gidr working paper seriesgidr.ac.in/pdf/wp-242-772.pdf2 tracking women in agriculture through recent...
TRANSCRIPT

Tracking Women in Agriculture through
Recent Census Data in India
Itishree Pattnaik
Kuntala Lahiri-Dutt
GID
R W
OR
KIN
G P
AP
ER
SE
RIE
S
L
No
. 2
42
: M
arch
2017

Working Paper No. 242
Tracking Women in Agriculture through
Recent Census Data in India
Itishree Pattnaik Kuntala Lahiri-Dutt
March 2017
Gujarat Institute of Development Research
Ahmedabad

Abstracts of all GIDR Working Papers are available on the Institute’s website. Working Paper No. 121 onwards can be downloaded from the site.
All rights are reserved. This publication may be used with proper citation and due acknowledgement to the author(s) and the Gujarat Institute of Development Research, Ahmedabad.
© Gujarat Institute of Development Research
First published: March 2017

i
Abstract
With many men moving out of the farm or shifting their focus from agriculture to other rural non-farm activities, the question arises: has there been a concomitant increase in the numbers of women in agriculture in India? In other words, can one elicit a distinct trend or pattern of feminization of agriculture, as it is commonly understood as growing numbers (or proportions) of women in active roles in agricultural production? This paper presents a first-step temporal investigation of women’s participation in agriculture into this question from secondary sources, that is, from four sets of occupational data in Indian Census– 1981, 1991, 2001 and 2011. It shows that a mere increase in numbers/time/activity of women in the agricultural field is not appropriate definition of feminization of agriculture. Feminization of agriculture, as it is occurring in India, is adding to the already heavy work burden of most rural women and thereby further undermining their well-being. This is better described as the feminization of agrarian distress. Key words: Agrarian distress; Census of India; feminization of agriculture; rural India JEL Classification: Q11, J21, J43
Acknowledgments The present work is a part of the project ‘Farmers of Future: Challenges of Feminized Agriculture in India’ funded jointly by Australian Research Council (DP 140101682) and Indian Council for Social Science research (ICSSR). The authors would like to express their gratitude to both funding agencies. The paper was presented at the Symposium on ‘The Great Transformation in South Asia: Feminisation of Agriculture and its Implications for Food Security’, held at the Crawford School of Public Policy, The Australian National University in August. 2015. Authors would also like to thank the experts and the audience present in the Symposium for their valuable comments and suggestions. Sincere thanks are due to Chandra Sekhar Bahinipati for his inputs in the paper. Last but not the least, our grateful thanks go to Professor Amita Shah for her constant encouragement and insightful comments in guiding the analysis.

ii
Contents
Abstract i
Acknowledgements i
Contents ii
1 Women in Agriculture: Evidence from Past Studies
3
2
Methodology 6
3
Women’s Workforce Participation (WFP) in India: Overall Trends
8
3.1 Increasing Share of Marginal Workforce, Mainly Male Workers
9
3.2 Participation of Men and Women in Different Occupations
11
3.3 Change in Main and Marginal Workers 13 3.4 Participation of Main and Marginal Workers 14 3.5 Women’s Non-agricultural Activities 15 4 Agricultural Workforce: State-wise Analysis
15
4.1 Cultivators and Agricultural Labourers: View from the States
17
4.2 Caste of Women in Agriculture 18 4.3 Women Agricultural Workers vs. Women’s
Operational Holdings 19
5 Factors Influencing the Participation of Women in Agriculture across States
20
6 Feminization of Agriculture?
23
References
33

iii
List of Tables
1 Workforce Participation Rate – Men and Women
9
2 Women and Men: Main and Marginal Workers
10
3 Main Workers’ Participation Ratio
10
4 Work Participation in Agricultural and Non-Agricultural Sectors
12
5 Caste-wise Participation of Women in Agriculture
19
6 Regression Model: Determinants of Women’s Participation in Agriculture and Non-agriculture
22
List of Figures
1 Decadal Trends in Population Growth, LFP and WFP
9
2 Male and Female Participation in Agriculture and Non-agricultural Activities
13
List of Appendices
1 Description of Variables and Statistics used in the Model
26
2 Gender-wise Work Participation
27
3 Occupation-wise Workforce Participation
28
4 Industry-wise Activity of Women
28
5 Agricultural Workers as Share of Total Workers
29
6 Gender-wise Participation in Agriculture, 2011 (as a share of the total works of the respective gender)
30
7 State-wise Data on Women as Cultivators and Agricultural Labourers
31
8 Operational Holdings by Women and Women Cultivators 32
1
Tracking Women in Agriculture through Recent Census Data in India
Itishree Pattnaik
Kuntala Lahiri-Dutt♣
Experts suggest that India’s agriculture is experiencing a crisis, reflected in the declining size of plots, increase in food price inflation, increase in the cost of production, changing dietary preferences and even farmer suicides (Mishra, 2007; Dev 2012; Nair and Eapen, 2015). One of the a response to this deepening crisis has been the migration of working age-group men out of rural areas; scholars have noted that male outmigration has changed in duration, seasonality and destinations (Tumbe, 2014; Agrawal and Chandrasekhar, 2015). Anecdotally, and from field surveys, experts have commented that women’s roles in agriculture have assumed greater significance in recent years. Shah and Pattnaik (2015) notes that agriculture is increasingly being considered as an auxiliary activity by peasants; as the rural poor diversify their income sources to deal with poor and insufficient incomes from agriculture, the very idea of who or what comprises an ‘agriculturist’1 is being reframed, albeit not in a conspicuous manner. If indeed, the face of India’s agricultural labour in the future is feminine, then policy debates on agricultural growth will need to include women’s roles, practices, needs and interests. The question that needs investigating is if (and to what extent) women’s participation in agriculture is reflected in official data: has there been a concomitant increase in the numbers of women in agriculture in India? In
Itishree Pattnaik ([email protected]) is Assistant Professor at the Gujarat Institute of Development Research (GIDR), Ahmedabad, and Kuntala Lahiri-Dutt is Senior Fellow with the Resource Environment & Development Program, Crawford School of Public Policy, ANU College of Asia and the Pacific, The Australian National University, Canberra. 1 Agriculturist, for those, agriculture is the only source of income, has become
almost non-existence (Shah and Pattnaik, 2015).

2
other words, can one elicit a distinct trend or pattern of feminization of agriculture, as it is commonly understood as growing numbers (or proportions) of women in active roles in agricultural production? Obviously, we understand that there are other ways to comprehend feminization; Deere (2005) for example, offers five2 indicators to estimate feminization. Others have suggested that feminization of agriculture is significant not only because of women’s multiple (and increasing) roles in food crop production but also because of the importance of agriculture for women (Lahiri-Dutt, 2014). This paper presents a first-step temporal investigation of this question using secondary data, that is, India’s official Census results. It presents the report of an investigation into women’s participation in agriculture from three sets of occupational structure data – 1991, 2001 and 2011, hoping that a pre-liberalisation and post-liberalisation picture may emerge from the three sets of decadal data. In this context this study seeks to critically analyze feminization of agriculture and tries to examine the pattern, trend and type of feminization. It further tries to understand how feminization of agriculture could be interpreted in the present agrarian circumstances. The trend, pattern and roles women play in agriculture would help to define their significance in this sector. The analysis focuses mainly on understating the participation of women in agriculture, rather than exploring its possible reasons. We think that the present analysis would help to pose questions for further research to investigate the status of women within the changing agrarian scenario in India. The paper is structured as follows. The first section discusses the concept of feminization and presents a snap short of the past studies. The details of the methodology followed in the analysis are presented in section two. With the help of the census data, the third section presents the recent trend of women participation in agriculture and the gap between women
2 She defined feminization of agriculture as: 1) increase in rural women’s, or rural
and urban women’s participation rates in the agricultural sector, 2) increase in the share of the agricultural labour force that is female, either because of a higher female activity rate and/or a decrease in men’s participation rate in agriculture or under enumeration of women as unpaid family labour in the past or greater visibility as agricultural wage workers or own-account farmers in the current period.

3
workforce and operational holdings. State-wise analysis of the agricultural workforce forms section four. The fifth section tries to address the factors that influence the women participation in agriculture. The last section defines/redefines the type of feminization that is taking place in India in the recent period. 1. Women in Agriculture: Evidence from Past Studies Feminization of agriculture has been defined as the increasing importance of women in agriculture, measured as a ratio of males to females (Lastarria, 2006), unequal allocation of family labour (Tamanget.al., 2014; Zuo, 2004) or the increase in the share of women whose main occupation is agriculture (Schutter, 2013) or increasing share of women either as independent producers or as unremunerated family workers, or as agricultural wage workers (Lastarria, 2006). An increase in women’s role in terms of increase/decrease in duration of work and addition of agricultural tasks which were earlier mostly performed by men, can also be termed feminization of agriculture (Lahiri-Dutt, 2014). In more specific terms Deere (2005) explained feminization of agriculture as increase in importance of women in agricultural processing and packing plants along with working in the field and pastures. Hence she explained that feminization of the agricultural sector is taking place through two paths, women’s increased responsibility for peasant production and their growing participation as wage workers in non-traditional agro-export production. Feminization of agriculture in India is not a new phenomenon and was identified early by Duvvury (1989) and Chowdhry (1993). In the present agrarian context of declining farm incomes and stagnation of employment, it has gained importance. According to World Bank data, the agriculture value added to the GDP has declined in India from 18.6 percent in 2006-11 to 17.8 percent by 2011-2014. Under the Government of India’s 11th plan, the National Commission of Farmers (NCF, 2005) report: II, shows that with increasing out-migration of males, an increasing number of women are undertaking agricultural tasks such as taking care of the land, working as helpers and so on. Again, male out-migration is mainly in the nature of a distress migration (NCF, 2005 and Kanchi, 2010). Women’s role as food producers is important for maintaining the family

4
livelihood as well as food security. However the persisting gender inequality enhances the difficulties women farmers face, reducing the potential productivity of agriculture and hence of overall food availability in countries, regions, and worldwide as noted by Agarwal (2012). Feminization of Indian agriculture seems to be taking place in a situation of decline in economic stake of women and increase in contribution to agriculture, either as cultivators or as agricultural labour (Vepa, 2005). There is a decline in growth of male workers’ participation in agriculture from 1.5 per cent during 1983–1994 to 0.5 per cent during 1994–2005; on the contrary, the growth rate of women in agriculture was 1.2 per cent during 1983–94, which has increased to 1.4 per cent during the 1994–2005 NSSO rounds (Srivastava, 2011). The NSSO Employment and Unemployment Survey, 1999–00 and 2004–05, used by the author shows that there was an increase in the absolute number of both men and women engaged in agriculture, but the increase was greater for women as compared to men. The share of male in agriculture, either as farmers or as agricultural labourers, declined from 61 per cent to 58 per cent, whereas the share of women workers has increased from 38 per cent to 41 per cent. Their share increases further when we include women’s participation in allied sectors of agriculture like livestock, poultry, fisheries, water conservation, and so on (Vepa, 2005). In all these activities, the share of women is higher than that of men. In fact, the state-wise analysis shows that the proportion of women workers in agriculture in relation to the total rural workers was higher than the male workers across all the states in Indian except West Bengal. This clearly establishes the importance of women in agriculture and allied activities in India. Considering the rural population as a whole, nearly 84 percent of women workers are engaged in agriculture, compared to 67 percent of men (Srivastava and Srivastava, 2009). Thus, there has been a steady decline in male workers’ participation in agriculture and a slow increase in women’s participation; this phenomenon is explained as ‘creeping feminization’ by Srivastava and Srivastava (2009). In India, it is believed that feminization of agriculture has been induced by unprofitable crop production, distress migration and the casualization of work (Vepa, 2005; Kelkar and Wang, 2007; Kanchi, 2010; Srivastava, 2011). Male out-migration is quoted as one of the major reasons for the increase

5
in women’s participation in agriculture. Though there is no single and specific reason for male out-migration, it is believed to be a combination of several sets of political, economic and social factors. The report on migration based on official data is not reliable and does not capture details regarding the types of migration. However, several micro-studies have recorded the out-migration of males from agriculture to other sectors (Hardikar, 2004; Garikipati, 2006). Vepa (2005) also highlighted the existence of higher seasonal migration in India, even though there is no direct calculation that captures this phenomenon. Evidence shows that there has been a very slow increase in urbanization in India; the rural-to-urban migration was just 22 per cent, compared to rural-to-rural migration, recorded as 47 per cent by 1999–00. The high percentage of rural-to-rural migration emphasizes the preponderance of seasonal migration. The primary data analysis by Garikipati (2006) emphasizes the region wise variation in the rate of seasonal migration. His study showed that seasonal migration among males was higher in the dry and drought-prone areas; he has highlighted the region wise variation in migration. The insides from the micro study in two villages of Madhya Pradesh by Hardikar (2004) find out that the migration of males (most of them from the marginal and small land-holding groups) put a further pressure on the women employers as they lose the family labour and increase in the upward pressure on wage. This in turn forces the women cultivators to abandon their farms since they can’t afford to pay good wages to the remaining labour despite good monsoon. The concern here is that the mere increase in number/time/activity of women in the agricultural field need not necessarily be called a ‘feminization of agriculture’, as it may only signify the addition of extra burden (double or triple), thus representing more of a disadvantage for women. As noted by Ramakrishnan and Nagar (2011) while women are increasingly involved in agricultural activities, a gross underestimation of women’s labour continues. The roles of women in agriculture vary across regions, depending upon agro-climatic conditions, cropping pattern, land holding size, other socio-economic factors, relative regional development, industrialization, and so on. This paper examines the trend of women’s participation in agriculture across the Indian states, through the Census data. Which states and

6
regions have witnessed increase in women’s participation? The study also questions if there is any relation between the economic status of the state and the level of women’s participation. Finally, the paper discusses how to define or re-define the role of women in agriculture within the changing agrarian scenario. 2. Methodology In order to investigate agricultural labour force participation trends and their implications for women, data from the past four Population Censuses have been considered. The Census of India provides data on gender-wise participation of labour for various industries for both rural and urban areas. A key distinction is made in the Census between ‘cultivators’ (defined as those providing ‘effective supervision or direction in cultivation’ on land either owned outright or accessed via share-cropping of leasing arrangements), and ‘agricultural labourers’ (defined in terms of wage or in-kind payment for labouring activities).The total number of cultivators and agricultural labourers are combined to obtain the total population engaged in farming. The data gap of Census has been highlighted by several authors on the ground that the official data do not reflect the realities of the agricultural community (Bhagat, 2008). Even after sensitizing the enumerators during 2001 census survey, the data failed to capture the women workforce fully (Sikri, 2005). Census enumerators were overwhelmingly men until recently, and it is well-known that they failed to see (and officially record) the innumerable tasks that women perform in and around the fields in rural areas (Rustagi, 2004). Another limitation of census data is its inability to capture seasonal participation in agriculture, thereby ignoring the effect of seasonal male out-migration. Census data classify agricultural workers into two categories—cultivators and labourers. However, this classification does not describe the gendered differentiation of farm activities, gender-wise time allocation, or time spent.3All these tend to
3 If the time allocation (spend) is considered as the criteria for calculating the work
participation of women in agriculture, the share further increases, as more than 75 percent of the daily time of a rural women is spent on the farm and farming-related activity (Vepa, 2005).

7
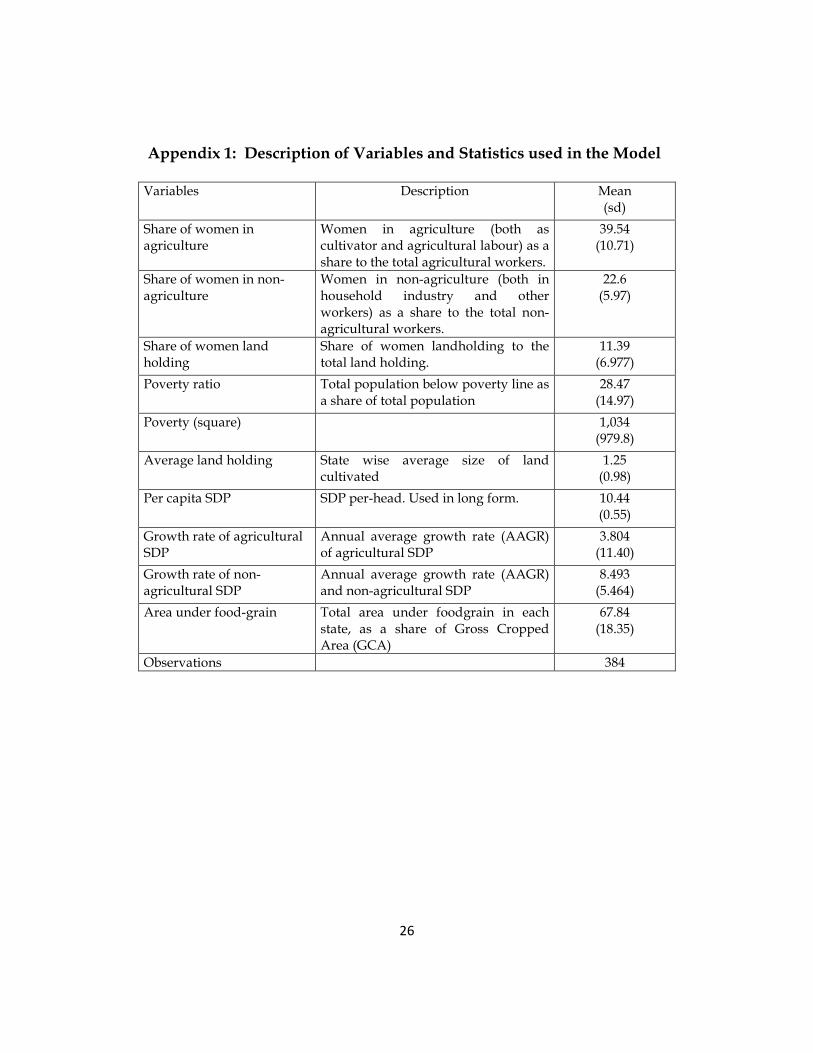
make invisible the significant role played by women in agriculture. We use the data with full awareness of their inadequacies and imperfections, primarily to see what explanations can possibly be extracted from national-level, official, and widely-used datasets. Despite these drawbacks, one cannot deny the fact that the scale and magnitude of data collection through the Census is wide. Data from Primary Census Abstract (PCA) for four years, i.e. 1981, 1991, 2001 and 2011 were analysed to assess the trend and pattern of gendered workforce participation in both agriculture and non-agricultural activities. We have attempted, with the help of state-level census data, to investigate the possible factors that influence women’s participation in agriculture and non-agricultural activities. For this purpose, a set of socio-economic and agricultural indicators were collected for the 28 states (with undivided Andhra Pradesh) and 7 union territories of India. A panel data set for the period 2001-2011was constructed by considering state-wise variables such as poverty ratio, women’s land holding, per capita income, average land holding size in each state, and area under food-grain. These variables were selected on the basis of existing studies cited above and the availability of macro-level data. Data sets for land holding, poverty, income per capita, agricultural and non-agricultural SDP and area under food-grains were collected from Agricultural Census of India (published by the Ministry of Agriculture), the Planning Commission of India, the Statistical Abstract of India (published by the Ministry of Statistics and Program Implementation) and Department of Agriculture, respectively. There were difficulties in matching data sets. Some data sets for indicators like State Domestic product (SDP) and area under food-grain were available on an annual basis, whereas data for poverty and land holding were available on quinquennial basis. Census data (e.g. women’s workforce participation) was available at decennial intervals. To deal with this, CAGR (compound annual growth rate) two-point, interpolation method was used to construct the data for the whole period. The description of each variable and descriptive statistics is presented in Appendix 1. The correlation among the explanatory variables has been checked and the variance inflation factor is estimated as 3.39 implying the absence multicollinearity in the data.

8
Factors influencing women’s participation in both agriculture and non-agricultural activities are considered as dependent variables. Therefore, two separate models were constructed. Given the panel data in hand, a fixed effect regression model is used for analysis. The equation for the regression model is: Yit = α + βiXit + δt Tit + uit Where, Yit represents the dependent variable (women participation in agriculture and non-agriculture) Xit represents all the independent variables, as explained above Tit is the time variable, fixed effect to capture time invariant. 3. Women’s Workforce Participation (WFP) in India: Overall Trends The Census data show that over the 3 decades from 1981 to 2011, the WFP has increased faster than the Indian population (see Figure 1). Although population growth slowed in the last period and so did WFP, in general the growth rate in WFP was higher than that for the population which is positive. If we look at the proportion of those of working age, that is LFP, we find that in 1981-1990 and 1991-2000, the growth rate of female workers was higher than the corresponding data for LFP. If the data are correct then this implies that females outside the age range 15-65 were entering the work force. The men workers did not exhibit this trend. It should be noted that as males account for about 2/3rds or more of the workforce, the similarity in growth rates means that the females are not making big inroads into the labour market as confirmed in Table 1, whichshows that women represent about 30 per cent of the workforce throughout the first 10 years of this century after increasing since 1981 from around 25 per cent. This analysis shows that although the Census data do not record a decline in workforce participation rates between 2001 and 2011 as seen in NSSO data (Rangarajan et.al, 2011; Papola, 2012) the workforce does seem to have stagnated.

9
Figure 1: Decadal Trends in Population Growth, LFP and WFP
Source: Compiled from Census of India, calculated by authors. Table 1: Workforce Participation Rate – Men and Women WPR (%) % Total Workers
Female Male Female Total 1981 52.4 19.8 35.6 25.9 1991 51.5 22.3 37.1 28.6 2001 51.8 25.6 39.2 31.6 2011 53.3 25.7 39.8 31.2 Source: Compiled from Census of India, calculated by authors. 3.1 Increasing Share of Marginal Workforce, Mainly Male Workers Workers are classified as main or marginal workers4. The division is shown in Table 2, which also breaks down the two categories according to
4 According to the census definition Main workers is defined as - All those
workers who had worked for the major part of the year preceding the date of enumeration i.e. those who were engaged in any economically productive activity for 183 days (six months) and more during the last year. Marginal workers - All those workers who had worked any time in the year preceding

10
gender for three decades starting at 1991. It can be seen that proportion of male main workers has declined with a concomitant increase in marginal male workers. In contrast women, as main workers, have increased percentage-wise but actual numbers are down a little due to the increased proportion of marginal workers unless offset by population growth. Their participation in marginal work has declined. Table 2: Women and Men: Main and Marginal Workers Census Main Workers
as % of Total Workers
Main Workers Marginal Workers Male (%) Female (%) Male (%) Female (%)
1991 91.0 77.5 22.5 19.6 80.4 2001 77.8 76.7 23.3 39.1 60.9 2011 75.2 75.4 24.6 49.2 50.8 Source: Compiled from Census of India, calculated by authors. There has been a definite shift in the gendered composition of the main and marginal workforce. It is evident that the rate of growth of marginal workers has been higher than the main workers (Appendix 2). However during the most recent Census, the rate of growth of main workers has revived, though it is still lower than the growth rate of marginal workers. The rate of growth of female main workers was higher than the rate of growth of male main workers. On the other hand, the rate of growth of male marginal workers was higher than female marginal workers. Table 3: Main Workers’ Participation Ratio Census year Male (as % of Total Male
Workers) Female (as % of Total
Female Workers) 1991 97.6 73.9 2001 87.3 57.3 2011 82.3 59.6 Source: Compiled from Census of India, calculated by authors.
enumeration but did not work for a major part the year i.e. those who worked less than 183 days or less than six months were termed as marginal workers.

11
Out of the total male workers, 82 per cent work as main workers, whereas 60 per cent of women work as main workers (Table 3). There has been a constant decline in the share of males as main workers, whereas there has been a marginal increase in women as main workers during the recent census. The above analysis shows that there have been some shifts in the workforce, but men still outnumber women by a large margin. The real change is increasing proportion of men are not employed as main workers. This raises the question that whether the women have taken over that space, or is there a general dip in economic opportunity for such full time work for men? In any case, there seems to be a move to marginal work, such that men and women’s participation is now almost equal. Again, have women lost out on traditional sources of marginal work due to the changing socio-economic factors, or is this only because of increased movement into main work? 3.2 Participation of Men and Women in Different Occupations A constant decline can be noted in the proportion of workers engaged in agriculture (either as cultivators or as agricultural labourers) throughout India. The total share of agricultural workers was 67 per cent during 1991, which declined substantially to 58 per cent during 2001; it further declined to 54 per cent during the 2011 census. The withdrawal of the population from agriculture was relatively faster during 2001 compared to 2011. Male workers have moved out of agriculture to non-agricultural pursuits, whereas women workers are still largely concentrated within the agricultural sector. The Census of India also presents information on activity-wise work participation under four main categories: cultivators, agricultural labourers, household industry, and other workers. An attempt has been made to examine the workforce participation in the agriculture (cultivators and agricultural labourers) and non-agriculture sectors (household industry and other workers) before going into a detailed analysis.

12
The data show that there has been a decline in the workforce in the agriculture sector and concomitant increase in participation in the non-agricultural sector (Table 4). Table 4: Work Participation in Agricultural and Non-Agricultural
Sectors Census year Agricultural
Workers (%) Agriculture Non-Agriculture
Male (%)
Female (%)
Male (%)
Female (%)
1981 62.0 66.2 38.0 33.8 1991 67.2 60.9 82.4 39.1 17.6 2001 58.4 51.9 71.8 48.1 28.2 2011 54.5 49.8 65.1 50.1 34.9
Source: Compiled from Census of India, calculated by authors. The gender-wise participation clearly shows that an almost equal share of male workers was engaged in agriculture and non-agricultural pursuits by 2011. During 1981, only 38 per cent of males used to work in the non-agricultural sector, compared to 62 percent in agriculture. There has been a steady, constant decline in the agricultural participation of male workers. On the other hand, among women, the change is not so clear. There was a sharp decline visible in non-agricultural participation in the 1991 Census, but by 2011, the figures reflect a steady increase. However, in the agricultural sector, female participation, which had peaked in the 1991 Census, shows a steady decline. Despite these trends, the share of women in the agricultural sector remains almost double their share in the non-agricultural sector. Out of the total female population, only 25 per cent are economically active. Of those who are involved in economic activity as defined by the census, 65 per cent are in agriculture. The proportion of women workers out of the total female population has remained almost the same over the period 2001 to 2011 (26 per cent), whereas the proportion of women in agriculture has declined from 72 to 65 per cent. Total workers remaining constant, this decline indicates a shift from farm to non-farm activity during the past decade (28 per cent during 2001 to 35 per cent during 2011). Compare this fact with the proportion of male workers in

13
agriculture; only 49 per cent of the total male workers are in agriculture (as compared to the 65 percent of women). 3.3 Change in Main and Marginal Workers Analysing the change in composition of male main and marginal workers, the data show that out of the total number of male main workers, there has been a clear decline in agriculture and an increase in the non-agriculture sector to the extent that has now overtaken agricultural work. However, among the male marginal workers, there isn’t such a significant shift from agriculture to non-agricultural pursuits so male workers are now even more concentrated in the agriculture sector as marginal workers. Figure 1: Male and Female Participation in Agriculture and Non-agricultural Activities
Source: Compiled from Census of India, calculated by authors. Although the trends are similar for female workers in that engagement of women in agriculture as both main and marginal workers has declined, with increased involvement in the non-agriculture sector. However, unlike male workers, the share of female main workers in agriculture was significantly higher than in the non-agricultural sector as can be seen in Figure 2.

14
3.4 Participation of Main and Marginal Workers In 1991, out of the total male workers, cultivators had the highest share, followed by other workers (Appendix 3). This share has declined; and in 2011, a higher share of males (about 47 per cent) were working as ‘other workers’, followed by 25 per cent as cultivators and 25 per cent as agricultural labourers. Around 39 per cent of all females used to work as cultivators in 1991, which has reduced to only 24 per cent by 2011. Between 1991 and 2001, there was also a decline in the share of agricultural labourers but then there the proportion increased in the next decade. It was also evident that women have moved out of agriculture to work in other sectors. Over the last decade, female cultivators have now started working as agricultural labourers and other workers because with the decline in the female cultivators there is no definite increase in the share of female other workers rather the share of agricultural labourers has increased. The expansion of household industry has been even more limited. The data on total workers show that male workers are concentrated in the ‘other workers’ category, whereas the proportion of female workers in this category has did not shoe significant increase as compared to male workers. Women’s involvement is primarily concentrated in the category of agricultural labourers: 41 per cent of women workers were labouring as agricultural labourers in 2011. On the one hand the share of women cultivators has declined, and their participation as ‘other workers’ has not increased at the same magnitude (Appendix 3), on the other, they are now increasingly concentrated in the category of agricultural labour. Out of the total male main workers, the highest proportion worked as ‘other workers’ during 2011—this share has increased significantly from 37 per cent in 1991 to 50 percent in 2011. However, out of the total male marginal workers, the highest percentage (over 46 per cent) worked as agricultural labourers. Thus, by 2011, more male main workers were engaged in ‘other work’, whereas more male marginal workers were engaged in agricultural labour. In the case of women main workers, there is a decline in those engaged in cultivation. The highest proportion (about 34 per cent), according to the

15
2011 survey is now engaged in agricultural labour and ‘other work’ (34.6 per cent and 34.5 per cent respectively). Of this, there is a definite increase in those engaged in ‘other work’, but a decrease in the share of agriculture. Out of the total women marginal workers, the data show that with the decrease in the proportion of total female marginal workers, there was a sharp decline in women cultivators. As in the case of women main workers, even the marginal workers show a preference for agricultural labour (51 per cent). The share of ‘other workers’ has increased, particularly during the 2011 census, though it still represents only one-fifth of total female marginal workers. 3.5 Women’s Non-agricultural Activities We have made an attempt to examine the type of non-agricultural activities that women are involved in. Indian Census does not provide any further classification of ‘other workers’, therefore we have used the data published by the National Sample Survey Organisation (NSSO). According to the NSSO report of the Key Indicators of Employment and Unemployment (2011–12), the industry-wise classification (NIC-2008) of workers across various sectors, women’s participation is highest in sectors like manufacturing, with small contributions to many others; however, the Agriculture, Forestry and Fishing sector dominates (Appendix 4). 4. Agricultural Workforce: State-wise Analysis State-by-state analysis of women’s participation in agriculture and other occupations is important in its own right. However, our analysis of state-by-state differences in this paper is undertaken principally to discern what can be learned from these differences about the causes and consequences of various employment patterns. The state wise data on women workers shows that, despite an increase in women’s workforce from 1991 to 2000, it has remained almost stagnant between 2000–01, and 2010–11. According to the 2011 census, the share of women in the total workforce has ranged from a low of 10 per cent in Delhi to 45 per cent in Himachal Pradesh. States such as Odisha,

16
Maharashtra, Karnataka, Tamil Nadu, Jharkhand, Madhya Pradesh, Andhra Pradesh and Rajasthan (among the major states) have a higher number of women in the workforce (share of women in total workforce) which is above the all-India average. There exists a positive and significant relationship (rank correlation) between women in the workforce and literacy rate (Venkatanarayan and Naik, 2013). The share of workers engaged in agriculture varies across states, from 74 per cent in Chhattisgarh to 1.3 per cent in Delhi (Appendix 5). Until recently, around 40 % of the total population was engaged in agriculture in most of the states, except for just seven states and union territories. Out of the total population engaged in agriculture, nearly 63 per cent were men and the rest were women. However, the women’s participation in agriculture varies across regions and states. The participation of men in agriculture was higher than that of women across all the states, except in Himachal Pradesh and Nagaland. It was evident that, in those states having a higher share of worker in agriculture (i.e. above the country average), the difference between participation of men and women workers was the least. The only exception to this were Utter Pradesh and Bihar, which has a high share of agricultural workers, but where only 25 and 28 per cent respectively of total agricultural workers were women(Appendix 5).It is possible that only 24 and 27 per cent of women are defined as workers in Utter Pradesh and Bihar. Out of the total women workers in the two states, more than 65 and 75 per cent are engaged in agriculture, however in comparison to men workers the share of women in agriculture is significantly low. The proportion of both men and women in the workforce engaged in agriculture has declined; however the share of women engaged in agriculture remained high (85 per cent and 81 per cent in Chhattisgarh and Himachal Pradesh) (Appendix 6).Agricultural sector in states such as Chhattisgarh, Himachal Pradesh, Jharkhand, Rajasthan, Uttarakhand and Odisha is dominated by female cultivators. In all the other states as well, the share of women in agriculture was higher than that of men, except in Assam, Punjab and West Bengal. In Madhya Pradesh and Bihar, even though the total female participation was higher than in other states, the male participation was also higher. Among the major states, except for Goa, Kerala, Punjab and West Bengal, the share of women in non-

17
agriculture activities was less than 50 per cent of total female workers. However, the growth rate of female participation in agriculture has slowed down in the recent decade. States like Goa, Gujarat, Haryana, Jammu and Kashmir, Kerala, Mizoram, Punjab, Sikkim and Utter Pradesh (most of these states have higher State Domestic Product- SDP) showed a negative growth rate. Except for Maharashtra and Andhra Pradesh, all other states that witnessed a decline in the number of women in agriculture are those with high per capita income. 4.1 Cultivators and Agricultural Labourers: View from the States The proportion of total female cultivators has declined significantly at the all India level; it is, however, important to assess the state-wise situation. Most of the major states show a trend of sharp decline for female cultivators, although for Karnataka, Kerala, Tamil Nadu, Punjab, Pondicherry, Manipur, Delhi, Chandigarh and Andhra Pradesh the decline is marginal (Appendix 7). This shows that among the south Indian states there was marginal decline in women as cultivators. Expect Punjab rest of all other states witnessed marginal decline in the share of women cultivators have actually small share of women work in agriculture. As already mentioned, at the all India level about 41 per cent of women have been working as agricultural workers in the last decade, which is a result of the drastic decline in the share of female cultivators. The increase in share of female agricultural workers was evident in all most all parts of the country. However, there was a decline in the share of female agricultural labourers in states like Tamil Nadu, Karnataka, Kerala, Maharashtra, Goa and Bihar. Except for Bihar, all other states that witnessed a decline in female agricultural labourers are high per capita income states. The share of female agricultural labourers has overtaken the share of female cultivators in almost all the states by 2011, except in Jammu and Kashmir, Haryana and Rajasthan, where the share of cultivators is declining, but is still higher than the share of agricultural labourers. The proportion of cultivators was higher in most of the North-Eastern states compared to others.
18
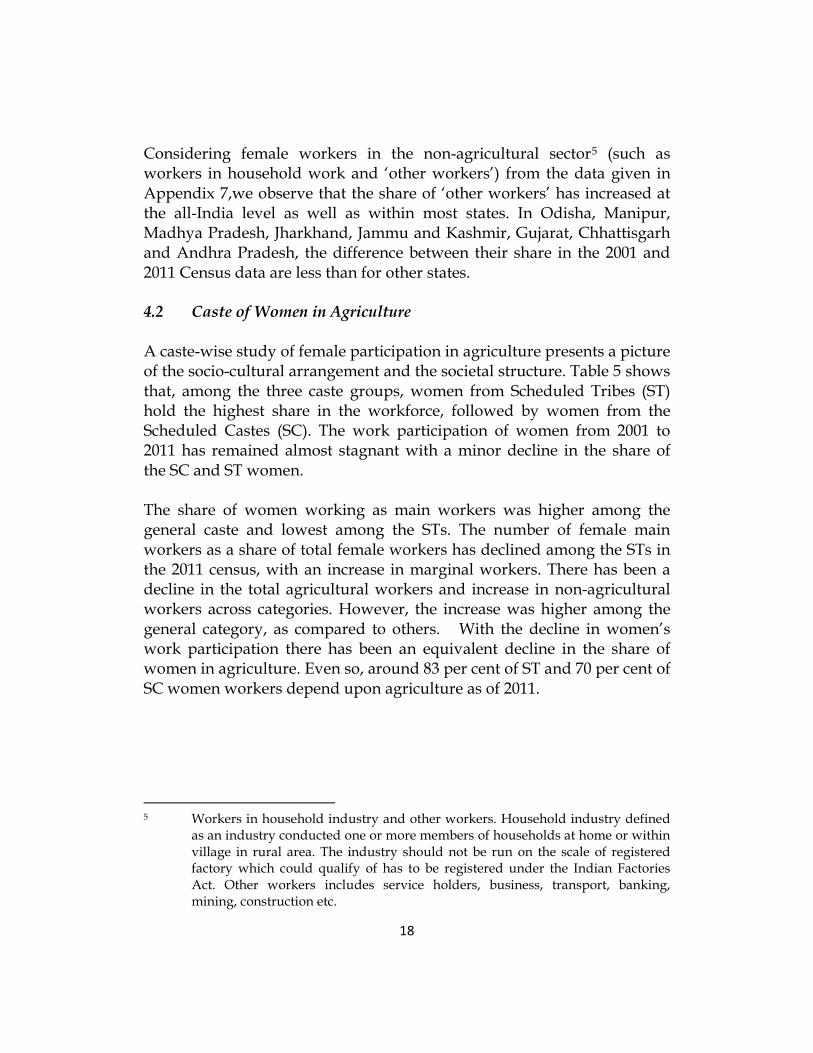
Considering female workers in the non-agricultural sector5 (such as workers in household work and ‘other workers’) from the data given in Appendix 7,we observe that the share of ‘other workers’ has increased at the all-India level as well as within most states. In Odisha, Manipur, Madhya Pradesh, Jharkhand, Jammu and Kashmir, Gujarat, Chhattisgarh and Andhra Pradesh, the difference between their share in the 2001 and 2011 Census data are less than for other states. 4.2 Caste of Women in Agriculture A caste-wise study of female participation in agriculture presents a picture of the socio-cultural arrangement and the societal structure. Table 5 shows that, among the three caste groups, women from Scheduled Tribes (ST) hold the highest share in the workforce, followed by women from the Scheduled Castes (SC). The work participation of women from 2001 to 2011 has remained almost stagnant with a minor decline in the share of the SC and ST women. The share of women working as main workers was higher among the general caste and lowest among the STs. The number of female main workers as a share of total female workers has declined among the STs in the 2011 census, with an increase in marginal workers. There has been a decline in the total agricultural workers and increase in non-agricultural workers across categories. However, the increase was higher among the general category, as compared to others. With the decline in women’s work participation there has been an equivalent decline in the share of women in agriculture. Even so, around 83 per cent of ST and 70 per cent of SC women workers depend upon agriculture as of 2011.
5 Workers in household industry and other workers. Household industry defined
as an industry conducted one or more members of households at home or within village in rural area. The industry should not be run on the scale of registered factory which could qualify of has to be registered under the Indian Factories Act. Other workers includes service holders, business, transport, banking, mining, construction etc.

19
Table 5: Caste-wise Participation of Women in Agriculture Caste groups General SC ST Workers / Census 2001 2011 2001 2011 2001 2011
Total Workers Total female workers 22.7 22.7 29.4 28.3 44.8 43.5 Cultivators 35.3 25.6 18.1 13.4 41.7 30.2 Agricultural labours 32.4 34.3 57.4 55.7 44.5 52.5 Other workers (HH+OW) 32.3 40.1 24.5 30.9 14.0 16.3
Female Main Workers Total workers 58.7 61.7 55.2 57.6 53.3 52.8 Cultivators 36.1 26.5 18.9 13.9 49.1 36.8 Agricultural labours 24.5 28.3 51.2 51.1 35.0 45.4 Household industry 7.5 6.2 5.6 4.4 2.5 2.4 Other workers 31.9 39.0 24.3 30.7 13.4 16.6
Female Marginal Workers Total workers 41.3 38.3 44.8 42.4 46.7 47.2 Cultivators 34.0 24.3 17.0 12.6 32.2 22.7 Agricultural labours 43.6 43.8 65.0 62.0 56.1 62.6 Household industry 7.5 7.4 5.5 5.4 3.4 3.1 Other workers 14.8 24.5 12.5 20.0 8.3 12.0 Source: Compiled from Census of India, calculated by authors. Out of the total women in the workforce in each caste group, ST women have the highest share in agriculture followed by SCs. Though the dependency of the STs was higher in agriculture, most of them work as agricultural labourers rather than cultivators; in fact, the share of female agricultural labourers was highest among the STs. There has also been a significant decline in the SC female cultivators. The shift from agriculture to non-agricultural activities was higher among the general caste population as compared to the SCs and STs. The above analysis on women workers in agriculture and other sector in Indian and across states shows that the share of women in agriculture is high compared to male, implying feminization of agriculture. The state wise analysis shows that the role of women in agriculture was dominant in those regions with lower per capita income. This implies a kind of distress feminization in the agricultural sectors. 4.3 Women Agricultural Workers vs. Women’s Operational Holdings Though the significance of roles played by women in agriculture as workers is well-established, but their right to agricultural property

20
remains minimal. Weak property rights lead to sub-optimal decisions and missed opportunities to increase productivity (Ashby et.al., 2009). As land ownership data are not available at the official sources, operational holding6 is used as a proxy for this. Appendix 8 presents data for the land operated by women, out of the total operational holdings. According to the latest census of 2010–11, out of the total operational land, 13.5 per cent was owned by women and only 11 per cent of land was operated by them. This shows that out of the total persons operating land, around 87.5 per cent were men. Clearly, a huge gap exists between land operation among men and women. Women’s operational holdings also vary across states, being higher in southern states like Andhra Pradesh and Kerala. Such persisting gender inequalities in access to agricultural assets, inputs, information, and services have hampered women’s potential economic contributions in agriculture (World Bank 2008, FAO, 2011). 5. Factors Influencing the Participation of Women in Agriculture
across States The negative relationships evident at the state-level between women in agriculture and per capita incomes are further examined with the help of a regression model (see Table 6) to study what factors that determines women’s participation in agricultural and non-agricultural work. This model demonstrates significant relationships between women’s work and land holdings, poverty, per capita income and the proportion of land utilized for food grain. As the average size of land holdings grow, women’s involvement in agriculture declines. Table 6 shows (see col. 1) a negative and significant association with women’s participation in agriculture (col. 1, Table 11) and a positive significant association with women participation in non-agriculture (col.2, Table 6). With 1 per cent increase in the average size of land holdings, women’s work participation in agriculture would decline by 28.6 per cent but their participation in non-agricultural activities 6 Operational holding in the agricultural Census is defined as all land which is
used for agricultural production and is operated as one unit by a person alone or with others, without regard to the title, legal form, size or location. The operational holders may be individuals or joint or institutional groups. By far the largest proportion of Indian land holding is individual.

21
(including both household industry and other workers) would increase by only 71 per cent. Therefore, we may infer that with increase in the average size of land, there is a tendency that women would withdraw from agriculture and participate in non-agricultural activities. Poverty, on the other hand, is associated with increasing female involvement in both agricultural and non-agricultural work, although the magnitude of the relationship between poverty and agricultural work is substantially higher. Mathematically, with only 1 per cent increase in the poverty ratio, women’s participation in agriculture would increase by 24 per cent and their participation in non-agricultural activities would increase only by 5 per cent. However, the relationship between the poverty ratio and women’s participation in agricultural and non-agricultural activities is not linear, as explained through the square term. It implies this relationship might not hold true after a point, at an extreme higher rate poverty women work participation declines.

22
Table 6: Regression Model: Determinants of Women’s Participation in Agriculture and Non-agriculture
Variables Women in Agriculture Women in Non-agriculture
Share of women land holding 0.044
(0.107) 0.053
(0.044)
Poverty level 0.241*** (0.047)
0.054*** (0.019)
Poverty (square) -0.003*** (0.001)
-0.001*** (0.000)
Average size of land -2.869*** (1.019)
0.714* (0.421)
Per capita SDP -2.592 (1.709)
1.664** (0.706)
Growth rate of agricultural SDP -0.005 (0.011)
-0.003 (0.004)
Growth rate of non-agricultural SDP
0.023 (0.024)
0.002 (0.010)
Share of area under food-grain 0.017
(0.026) -0.026** (0.011)
Constant 65.712*** (17.857)
5.355 (7.375)
R-squared 0.214 0.425 Observations 384 384 Year Effect Yes Yes Model Fixed effect Fixed effect Note: Standard errors in parentheses; *** p<0.01, ** p<0.05, * p<0.1 Source: Authors’ Estimation Income per capita does not show a significant relationship with women’s participation in agriculture but there is a positive association with women workers in non-agricultural activities. With an increase in income per capita of 1%women’sparticipation in non-agricultural activities would increase by 166%. The relationship between women work participation in agriculture and per capita income is negative but not significant. The proportion of the total farm area under food-grain is negatively associated with women’s participation in non-agricultural activities; that is, the more land under food-grain, the lower the likelihood women will participate in non-farm activities.

23
Importantly, no significant relationships were evident between women’s share of land holdings and their participation in agricultural and non-agricultural activities. This suggests that women’s ownership of land does not necessarily influence their overall levels of participation in agriculture. Poverty levels and the overall size of land holdings appear to be the major determining factors, with women withdrawing from agriculture in favour of involvement in non-agricultural activities as household income increases. The implication is clear: women’s participation in agriculture is higher when the family and the agriculture are less advantageous for livelihoods. The observation, albeit not unknown, does open up a new set of research questions asking for a different understanding. For instance, we need to ask: under what conditions is feminization of agriculture taking place in India? What are the different meanings and wider connotations of the processes implied in the term? To answer these questions, a deeper and more qualitative investigation might be needed. 6. Feminization of Agriculture? The role of women in the agricultural workforce could be defined as one where women as main workers have remained at a constant level, though the proportion of men as main workers has declined. With increased marginalization of the workforce, more men have joined marginal work than women. Participation of both men and women in agriculture has declined, but the rate of decline has been faster among the men compared to women. The shift of the male workers from agriculture to non-agricultural work was obvious, whereas there was no significant and major shift of women from one sector to another. Out of the total women workers, participation was highest in agriculture, with around 65 per cent engaging either as cultivators or as agricultural labourers, compared to 82 per cent in 1991. This overall decline stems from the drop in women cultivators as the number of women as agricultural labourers has remained stagnant. Women’s participation as agricultural labour was one of the major components of the latest Census. These labourers include casual, daily wage labourers, attached workers whose wages are fixed by contract, and
24
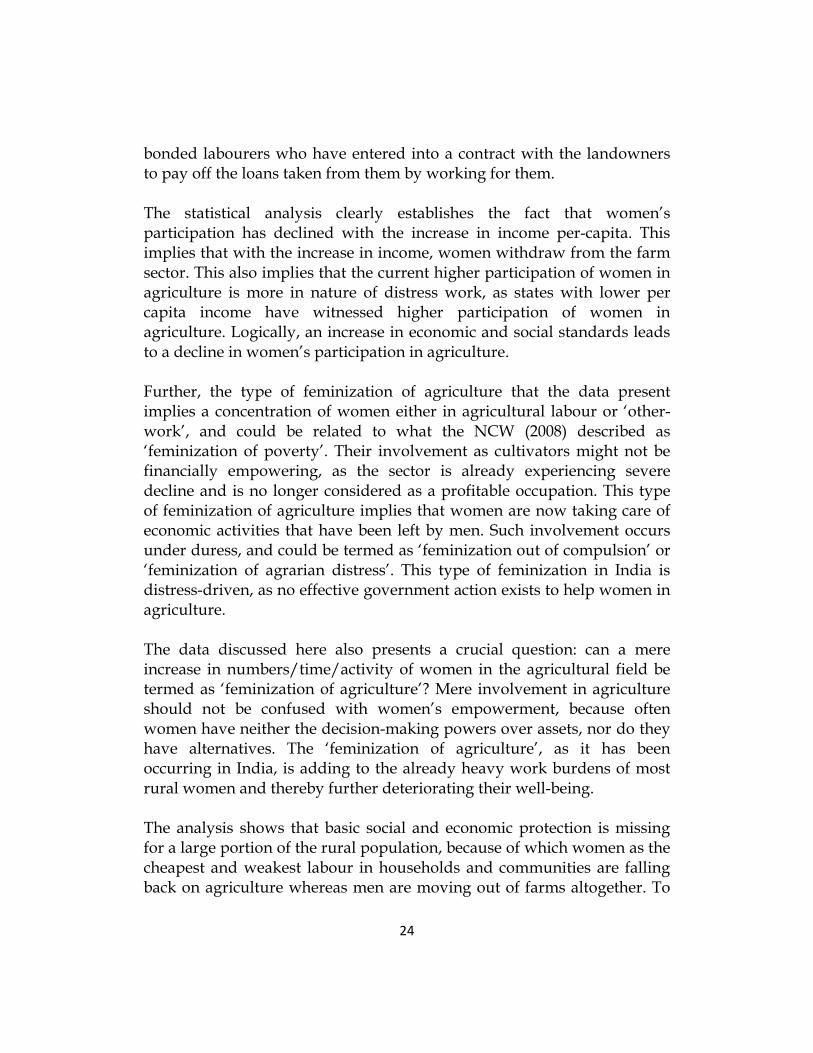
bonded labourers who have entered into a contract with the landowners to pay off the loans taken from them by working for them. The statistical analysis clearly establishes the fact that women’s participation has declined with the increase in income per-capita. This implies that with the increase in income, women withdraw from the farm sector. This also implies that the current higher participation of women in agriculture is more in nature of distress work, as states with lower per capita income have witnessed higher participation of women in agriculture. Logically, an increase in economic and social standards leads to a decline in women’s participation in agriculture. Further, the type of feminization of agriculture that the data present implies a concentration of women either in agricultural labour or ‘other-work’, and could be related to what the NCW (2008) described as ‘feminization of poverty’. Their involvement as cultivators might not be financially empowering, as the sector is already experiencing severe decline and is no longer considered as a profitable occupation. This type of feminization of agriculture implies that women are now taking care of economic activities that have been left by men. Such involvement occurs under duress, and could be termed as ‘feminization out of compulsion’ or ‘feminization of agrarian distress’. This type of feminization in India is distress-driven, as no effective government action exists to help women in agriculture. The data discussed here also presents a crucial question: can a mere increase in numbers/time/activity of women in the agricultural field be termed as ‘feminization of agriculture’? Mere involvement in agriculture should not be confused with women’s empowerment, because often women have neither the decision-making powers over assets, nor do they have alternatives. The ‘feminization of agriculture’, as it has been occurring in India, is adding to the already heavy work burdens of most rural women and thereby further deteriorating their well-being. The analysis shows that basic social and economic protection is missing for a large portion of the rural population, because of which women as the cheapest and weakest labour in households and communities are falling back on agriculture whereas men are moving out of farms altogether. To

25
transform the situation, it is essential to put the focus on women in the overall development plans and policies of agriculture. Feminization of Indian agriculture has been taking shape in the context of a complex interplay of shrinking land holdings; degraded soils and water resources; declining accessibility to traditional seeds and other inputs; distorted market incentives for crop choice and technology; growing labour shortages; and mechanization. It has also been occurring within a deepening crisis of gender relations. Efforts to enhance women’s agency without addressing these broader rural crises will achieve only limited outcomes. Women land ownership and control is one is the major factor for enhancing the livelihood of the rural community (Hanstad and Nielsen, 2004; Agarwal, 1994; 2003; Saxena, 2011; Rao, 2011). In India it is estimated that only 12.7% of land holdings are in the names of women, even as 77% women rely on agriculture as their primary source of income (UNDP, 2015).The lack of titled land prevents them from accessing a number of further benefits that they should be able to enjoy, such as access to institutional credit, bank loans and federal agricultural benefits. There are not many in-depth and systematic studies on understanding the changes in the agrarian sector through a social lens. Further, the involvement of women in agriculture might vary across land holding size; thus knowing the land holding-wise classification of women farmers is essential. The tasks women perform might be changing and need investigation. Without titles to land, it is a challenging situation not only for the women farmers but also for the policy-makers who are at a loss to devise appropriate credit mechanisms for rural women. This analysis opens up the need for future research into this direction.
26
Appendix 1: Description of Variables and Statistics used in the Model Variables Description Mean
(sd) Share of women in agriculture
Women in agriculture (both as cultivator and agricultural labour) as a share to the total agricultural workers.
39.54 (10.71)
Share of women in non-agriculture
Women in non-agriculture (both in household industry and other workers) as a share to the total non-agricultural workers.
22.6 (5.97)
Share of women land holding
Share of women landholding to the total land holding.
11.39 (6.977)
Poverty ratio Total population below poverty line as a share of total population
28.47 (14.97)
Poverty (square) 1,034 (979.8)
Average land holding State wise average size of land cultivated
1.25 (0.98)
Per capita SDP SDP per-head. Used in long form. 10.44 (0.55)
Growth rate of agricultural SDP
Annual average growth rate (AAGR) of agricultural SDP
3.804 (11.40)
Growth rate of non-agricultural SDP
Annual average growth rate (AAGR) and non-agricultural SDP
8.493 (5.464)
Area under food-grain Total area under foodgrain in each state, as a share of Gross Cropped Area (GCA)
67.84 (18.35)
Observations 384

27
Appendix 2: Gender-wise Work Participation (CAGR)
Note: *Calculated by the author. Source: Compiled from Venkatnarayan and Naik, 2013.
1981-91 1991-00 2001-11
Total Population
Total 2.1 2.0 1.6 Male 2.2 1.9 1.6 Female 2.1 2.0 1.7
LFP*
Total 3.4 2.8 1.8 Male 4.2 2.8 1.7 Female 2.6 2.9 1.8
Total Workers
Total 2.5 2.5 1.8 Male 2.2 2.1 1.9 Female 3.5 3.5 1.7
Main Workers
Total 2.5 0.9 1.5 Male 2.2 0.8 1.3 Femlae 3.6 1.2 2.1
Marginal Workers
Total 2.5 12.3 2.8 Male -2.6 29.5 5.1 Female 3.2 7.9 1.1

28
Appendix 3: Occupation-wise Workforce Participation
Total Workers Main Workers Marginal Workers
Cult Agl HH OW Cult Agl HH OW Cult Agl HH OW
Male
1991 40.0 21.0 2.1 37.0 39.9 20.8 2.1 37.2 42.7 31.9 2.8 22.6 2001 31.1 20.8 3.2 44.9 32.6 17.1 3.1 47.2 20.5 46.5 3.5 29.4 2011 24.9 24.9 2.9 47.2 26.7 20.2 2.8 50.3 16.5 46.8 3.8 32.9
Female
1991 39.0 43.4 3.3 14.3 34.6 44.2 3.5 17.7 50.3 41.3 2.6 5.7 2001 32.9 38.9 6.5 21.7 34.8 30.7 6.4 28.0 30.4 49.8 6.5 13.3 2011 24.0 41.1 5.7 29.2 25.6 34.6 5.4 34.5 21.7 50.6 6.2 21.4
Note: Cult – cultivators; Agl – agricultural workers; HH: household industry; OW – other workers. Source: Compiled from Census of India. Appendix 4: Industry-wise Activity of Women Industries Principal Status Usual Status
(PS+SS) Agriculture, forestry and fishing 59.96 62.77 Mining and quarrying 0.37 0.29 Manufacturing 13.31 13.39 Construction 4.91 6.09 Wholesale and retail trade; repair of motor vehicles and motorcycles
4.57 3.90
Education 5.89 4.67 Other services 10.98 8.88
Note: Usual principal activity status (PS) relates to the activity status on which a person spent relatively long time (i.e. major time criterion) during the 365 days preceding the date of survey was considered as the usual principal activity status of the person; Usual subsidiary economic activity status (SS) relates to activity status pursued for a shorter time throughout the reference year of 365 days preceding the date of surveyor for a minor period, which is not less than 30 days during the reference year. Source: NSSO, Key Indicators of Employment and Unemployment in India, 2011-12.

29
Appendix 5: Agricultural Workers as Share of Total Workers States Agri
workers Share of total agri
workers States Agri
workers Share of total agri workers
Male Female Male Female Chhattis-garh
74.7 52.4 47.6 Maha-rashtra
52.7 55.1 44.9
Bihar 73.6 71.7 28.3 Uttara-khand
51.2 51.5 48.5
MP 69.8 58.5 41.5 Gujarat 49.6 64.2 35.8 Jhar-khand
63.0 56.2 43.8 Assam 49.3 71.6 28.4
HP 62.9 45.1 54.9 Karna-taka
49.3 58.5 41.5
Rajasthan 62.1 52.0 48.0 Manipur 49.1 55.4 44.6 Odisha 61.8 63.2 36.8 Sikkim 46.5 53.1 46.9 Nagaland 61.7 48.5 51.5 Haryana 45.0 70.6 29.4 AP 59.5 53.2 46.8 Tripura 44.2 68.2 31.8 UP 59.3 75.2 24.8 West
Bengal 44.0 78.1 21.9
Megha-laya
58.5 55.4 44.6 Tamil Nadu
42.1 54.7 45.3
Arunchal Pradesh
57.7 50.5 49.5 J&K 41.5 65.8 34.2
Mizoram 55.8 56.0 44.0 Punjab 35.6 85.0 15.0 Dadra &
N Haveli 29.2 51.7 48.3
Kerala 17.2 70.5 29.5 A & N Islands
14.0 76.9 23.1
Goa 10.1 57.9 42.1 Daman & Diu
2.5 60.0 40.0
India 54.6 62.9 37.1 Delhi 1.3 80.7 19.3 Source: Compiled from Census of India, calculated by authors.

30
Appendix 6: Gender-wise Participation in Agriculture, 2011 (as a share of the total works of the respective gender)
Female Male Rank Share Gr_2001-
91 Gr_2011-01
Share Gr_2001-91
Gr_2011-01
Female
Male
India 65.1 2.1 0.7 49.9 0.4 1.5 - - Chhattisgarh 85.8 1.7 66.8 2.5 1 2 HP 81.0 3.4 0.6 49.4 1.3 1.3 2 13 MP 79.9 -1.6 1.3 64.0 -1.9 2.2 3 3 Jharkhand 77.4 2.4 55.0 1.8 4 6 Rajasthan 76.9 3.6 1.7 52.7 1.0 1.7 5 9 Bihar 76.0 1.2 1.2 72.6 -1.2 1.9 6 1 Uttarakhand 72.8 0.1 40.0 1.6 7 22 Nagaland 72.5 4.0 0.6 53.2 4.5 0.2 8 8 Andhra Pradesh 72.0 0.7 0.9 51.6 0.2 0.7 9 11 Odisha 70.7 1.8 1.9 57.6 -0.4 1.5 10 5 Arunachal Pradesh
70.6 1.2 1.0 48.9 1.2 1.6 11 14
Maharashtra 69.5 0.3 0.6 44.0 1.1 2.2 12 17 Gujarat 64.9 0.8 -0.3 43.9 0.8 2.1 13 19 Meghalaya 64.2 2.0 0.6 54.5 2.0 1.0 14 7 Mizoram 60.9 2.1 -1.6 52.3 2.3 0.6 15 10 Uttar Pradesh 60.6 3.4 -0.2 58.8 -0.1 1.3 16 4 Karnataka 59.4 1.0 0.1 44.0 0.3 0.8 17 18 Sikkim 59.0 4.2 -0.3 39.2 1.9 -0.3 18 23 Haryana 55.9 9.7 -3.7 41.6 0.6 1.0 19 21 Tamil Nadu 54.8 -0.2 0.1 35.3 -1.2 0.1 20 26 Jammu & Kashmir
54.4 -0.5 36.9 -0.1 21 25
Manipur 51.5 -1.7 1.0 47.3 -0.3 1.8 22 15 Assam 48.9 -1.5 0.9 49.5 -0.5 2.0 23 12 Tripura 48.7 4.2 0.0 42.4 -0.6 1.4 24 20 West Bengal 41.7 4.0 0.2 44.7 0.1 2.1 25 16 Punjab 29.1 11.3 -2.6 37.1 -1.4 0.4 26 24 Kerala 18.6 -4.8 -1.2 16.6 -4.1 -1.8 27 27 A & N Islands 15.6 2.3 -4.3 13.6 0.4 -1.4 28 28 Goa 15.5 -2.1 -5.8 8.0 -3.3 -2.1 29 29 Notes: a) Share for 2011 census is calculated as a percentage of total male and female workers respectively. b) Growth rate are calculated as: Gr_2001-99 – defined as growth of workers in 2001 census compared to 1991. Gr_2011-01 – defined as growth of workers in 2011 census compared to 2001 census. c) Compound annual growth is calculated. Source: Compiled from Census of India, calculated by authors.

31
Appendix 7: State-wise Data on Women as Cultivators and Agricultural Labourers
States TOT_F_CL/ TFW TOT_F_AL/ TFW TOT_F_OTHER (HH+OW)/ TFW
2001 2011 2001 2011 2001 2011 Andhra Pradesh 20.1 14.0 55.8 58.0 24.2 28.0 Bihar 23.2 15.3 62.6 60.8 14.3 24.0 Goa 16.7 7.9 13.4 7.6 69.8 84.5 Gujarat 28.0 17.8 39.1 47.1 32.9 35.1 Haryana 43.7 32.8 21.1 23.1 35.2 44.1 Jammu & Kashmir 54.7 42.6 5.2 11.8 40.1 45.6 Jharkhand 43.0 32.6 39.6 44.8 17.4 22.6 Karnataka 24.7 19.0 43.5 40.3 31.8 40.6 Kerala 4.9 3.9 21.5 14.7 73.6 81.4 Madhya Pradesh 43.3 28.5 40.4 51.5 16.3 20.1 Maharashtra 35.8 29.6 41.1 39.9 23.0 30.5 Odisha 20.1 12.9 53.9 57.8 26.0 29.3 Punjab 13.9 9.9 17.8 19.1 68.3 70.9 Rajasthan 67.0 52.6 16.2 24.2 16.8 23.1 Tamil Nadu 19.0 13.2 44.8 41.6 36.2 45.2 West Bengal 14.1 7.7 32.2 34.0 53.7 58.3 Assam 41.1 28.1 16.2 20.9 42.7 51.1 A & N islands 24.1 12.3 4.2 3.3 71.8 84.4 Chhattisgarh 44.5 31.3 44.1 54.4 11.4 14.2 Dadra Nagar Haveli 55.9 26.1 24.3 32.6 19.9 41.3 Daman & Diu 16.6 6.0 8.0 3.0 75.4 91.1 Delhi 1.8 0.7 0.8 1.0 97.4 98.3 Himachal Pradesh 85.8 76.2 3.0 4.8 11.2 19.0 Manipur 39.6 37.9 15.2 13.6 45.2 48.5 Meghalaya 52.8 45.1 20.1 19.1 27.1 35.8 Mizoram 61.6 51.1 6.9 9.9 31.5 39.1 Nagaland 77.5 65.2 4.2 7.3 18.4 27.5 Pondicherry 1.5 1.8 35.9 22.9 62.6 75.3 Sikkim 62.8 47.5 8.5 11.5 28.7 41.0 Tripura 28.1 15.8 34.6 32.9 37.3 51.3 Uttar Pradesh 36.1 22.2 39.7 38.4 24.3 39.4 Uttarakhand 77.8 64.0 6.1 8.8 16.1 27.2 India 32.9 24.0 38.9 41.1 28.2 34.9 Note: TOT_F_CL/TFW: total female cultivators/ total female workers; TOT_F_AL/TFW: total female agricultural labours/ total female workers; TOT_F_OTHER(HH+OT)/TFW: total female household industry workers and other workers/ total female workers. Source: Compiled from Census of India, calculated by authors.

32
Appendix 8: Operational Holdings by Women and Women Cultivators
Number Area
Number Area
Andhra Pradesh 25.4 22.1 Meghalaya 34.6 34.0 Goa 23.3 18.0 A & N Islands 25.8 22.8 Kerala 19.8 15.0 Pondicherry 22.3 14.1 Delhi 19.5 15.5 Daman & Diu 19.9 20.8 Tamil Nadu 19.2 16.6 Chandigarh 18.1 11.5 Karnataka 19.0 15.7 D & N Haveli 12.1 11.6 Maharashtra 15.0 13.1 Uttarakhand 11.3 10.5 Bihar 13.7 12.9 Mizoram 10.9 9.7 Chattisgarh 12.6 9.9 Arunachal Pradesh 10.7 8.2 Jharkhand 10.8 9.0 Tripura 10.3 8.8 Haryana 10.5 8.8 Nagaland 10.1 8.7 Gujarat 10.3 9.1 Sikkim 4.3 4.1 Madhya Pradesh 9.3 7.2 Manipur 3.6 2.8 Uttar Pradesh 9.1 7.6 Assam 2.1 2.6 Rajasthan 9.0 7.7
Jammu & Kashmir 8.1 6.5 Himachal Pradesh 7.1 4.7 West Bengal 3.5 2.1 Odisha 3.3 3.1 Punjab 0.9 0.7 All India 13.5 10.9 Source: Agricultural Census, various years.

33
References Agarwal, Bina (1994), A Field of One’s Own: Gender and Land Rights in South Asia, Cambridge University Press. Agarwal, Bina (2003), ‘Gender and Land Rights Revisited: Exploring New Prospects via the State, Family and Market’, Journal of Agrarian Change, 3 (1&2): 184-224. Agarwal, Bina (2012), ‘Food Security, Productivity, and Gender Inequality’, Institute of Economic Growth (IEG) working Paper 320. Agrawal, Tushar, S. Chandrasekhar (2015), ‘Short Term Migrants in India: Characteristics, Wages and Work Transition’, Working Paper-07, Indira Gandhi Institute of Development Research, Mumbai April 2015, http://www.igidr.ac.in/pdf/publication/WP-2015-07.pdf (accessed on 2 December, 2015) Bhagat , R.B. and K.C. Das (2008), ‘Levels, Trends and Structure of Workforce in India: Census Based Study 1981-2001’, International Institute for Population Sciences, Mumbai. http://iipsindia.org/pdf/b01cBhagat%20sir's%20report.pdf (accessed on 28 July, 2014). Chowdhry, Prem (1993), ‘High participation and low evaluation: Women and work in rural Haryana’, Economic and Political Weekly, 28(52), A-135 -47. Deere, Carmen (2005), ‘The Feminization of Agriculture? Economic Restructuring in Rural Latin America, Occasional Paper 1, United Nation Research Institute for Social Development, by February. Duvvury, Nata (1989), ‘Women in Agriculture: A Review of Indian Literature’, Economic and Political Weekly, 24 (43), October, pp. 96-112. Food and Agricultural Organization (FAO) (2011), The State of Food and Agriculture 2010–2011. Women in Agriculture: Closing the Gender Gap for Development (Rome, FAO). Garikipati, Supriya (2006), ‘Feminization of Agricultural Labour and Women's Domestic Status: Evidence from Labour Households in India’,

34
Research Paper Series - No. 30, University of Liverpool Management School, Great Britain. Hanstad, Tim and Robin Nielsen (2004), ‘From Sharecroppers to Landowners: Paving the Way for West Bengal’s Bargadars’, Rural Development Institute Reports of Foreign Aid, 121. Hardikar, Jaideep (2004), ‘Migration, agriculture and women’. http://www.indiatogether.org (accessed on 2 January 2012). Kanchi, Aruna (2010) ‘Women Workers in Agriculture: Expanding Responsibilities and Shrinking Opportunities’, ILO Asia-Pacific Working Paper, Asian Decade of Decent Work 2006 to 2015 June. Kelkar, G. and Wang, Y (2007), ‘The Gender Questions and Decent Work: An analysis of Apparel Industry Worker in China and India’, The Indian Journal of Labour Economics, 50 (3), pp-11-134. Lahiri-Dutt, Kuntala (2014), Experiencing, Coping with Change: Women-Headed Farming Households in the Eastern Gangetic Plains. Canberra: Australian Council for International Agricultural Research. Lastarria, Susana Cornhiel (2006), ‘Feminization of Agriculture: Trends and Driving Forces’, Background Paper for the World Development Report 2008. http://siteresources.worldbank.org/INTWDRS/Resources/477365-1327599046334/8394679-1327599874257/LastarriaCornhiel_ FeminizationOfAgri.pdf. (accessed on 29 July, 2014). National Commission on Farmers, Second Report (2005), Serving Farmers and Saving Farming, Crisis to Confidence, http://agricoop.nic.in/imagedefault/policy/NCF%20Report-02.pdf (accessed on 2 December, 2015). Papola, T. S. (2012), ‘Employment Growth in the Post-Reform Period’, Keynote Paper on the Theme “Employment in the Post-Reform India”, 54th Annual Conference, The Indian Society of Labour Economics, Banaras Hindu University, Varanasi.

35
Ramakrishnan, Rajesh and Shailesh Nagar (2011), ‘Small-holder Women Farmers in India’, A Discussion Paper for Oxfam India, New Delhi, Draft, January. Rangarajan, C, Padma Iyer and Seema Kaul (2011), ‘Where is the Missing Labour Force’, Economic and Political Weekly, 46(39), pp-189-197, September 24-30. Rao, Nitya (2011), ‘Women’s Access to Land: An Asian Perspective’, at the UN Women in Cooperation with FAO, IFAD and WFP Expert Group Meeting Enabling rural women’s economic empowerment: institutions, opportunities and participation. http://www.un.org/womenwatch/daw/csw/csw56/egm/Rao-EP-3-EGM-RW-30Sep-2011.pdf, (accessed on 2 December, 2015). Rustagi, Preet (2004), ‘Significance of Gender-related Development Indicators: An Analysis of Indian States’, Journal of Gender Studies, 11 (3), pp-291-343. Saxena N.C. (2011), ‘Women, Land and Agriculture in Rural India’, UN Women South Asia Sub Regional Office http://www.unwomen.org/~/media/field%20office%20eseasia/docs/publications/southasia/reportstudies/06_economic%20empowerment/un_women_land_agriculture_in_rural_india%20pdf.ashx?v=1&d=20141202T120141 (accessed on 2 December, 2015). Shah, Amita and Itishree Pattnaik (2015), ‘Recent Experiences of Agricultural Growth in Gujarat and Madhya Pradesh: An Enquiry into the Patterns, Processes and Impacts’, Report submitted to the Indian Council of Social Science Research (ICSSR), New Delhi. Schutter, Olivier de (2013), ‘The agrarian transition and the ‘Feminization’ of Agriculture’, in Food Sovereignty: A Critical Dialogue, Conference Paper #37, International Conference, Yale University, September 14-15. Sikiri, D.K. (2005), ‘Challenges of 2001 Census in India and Future Issues’, http://www.ancdsaap.org/cencon2005/papers/India/India.D.K.Sikiri.pdf) (accessed on 28 July, 2014).
36
Srivastava Nisha (2011), ‘Feminisation Of Agriculture: What Do Survey Data Tell Us?’, Journal of Rural Development, 30 (3), pp. 341 – 359. Srivastava, Nisha and Ravi Srivastava (2009), ‘Women, work, and employment outcomes in rural India’, Paper presented at the FAO-IFAD-ILO Workshop on ‘Gaps, Trends and Current Research in Gender Dimensions of Agricultural and Rural Employment: Differentiated Pathways out of Poverty, Rome, 31 March - 2 April 2009. Tamang, Sujata, Krishna P. Paudel and Krishna K. Shrestha (2014), ‘Feminization of Agriculture and its Implications for Food Security in Rural Nepal’, Journal of Forest and Livelihood, 12(1), October. Tumbe, Chinmay (2014), ‘Missing Men, Migration and Labor Markets: Evidence from India’, June http://www.ihdindia.org/sarnet/TumbeMissingMenMigrationandLaborMarketsinIndia.pdf UNDP, (2015), http://www.governancenow.com/views/think-tanks/ how-undp-helping-women-become-land-owners-in-rural-india (accessed on 15 May, 2015). Venkatanarayan M. and Naik, Suresh V. (2013), Growth and Structure of Workforce in India : An Analysis of Census 2011 Data, MPRA paper 48003 pp.1-24. Vepa, Swarna.S. (2005), ‘Feminisation of Agriculture and Marginalisation of Their Economic Stake’, Economic and Political Weekly, 40(25), pp-2563–68. World Bank (2008), ‘Gender in Agriculture Sourcebook’, Washington DC. World Bank, http://data.worldbank.org/indicator/NV.AGR.TOTL.ZS. Zuo, Jiping (2004), ‘Feminization of Agriculture, Relational Exchange, and Perceived Fairness in China: A Case in Guangxi Province’, Rural Sociology, 69(4), pp. 510–531.

THE GIDR WORKING PAPER SERIES (No. 225 onwards) 225. Keshab Das, ‘Provisioning Drinking Water in Gujarat’s Tribal Areas: An
Assessment’, January, 2015. 226. Chandra Sekhar Bahinipati and Unmesh Patnaik, ‘Climate Change Economics: A
Review on Theoretical Understanding and Controversies’, April 2015. 227. Keshab Das, “Institutional Constraints to Innovation: Artisan Clusters in Rural
India”, June 2015. 228. N. Lalitha and Amrita Ghatak, “Occupational Health Risks among Workers in
the Informal Sector in India”, September 2015. 229. LeelaVisaria and Rudra N. Mishra, “Health Training Programme for Adolescent
Girls: Some Lessons from India’s NGO Initiative”, October 2015.
230. Tara Nair and Keshab Das, “Financing the MSME Sector in India: Approaches, Challenges and Options”, December 2015.
231. Chandra Sekhar Bahinipati and P.K. Viswanathan, “Role of Policies and
Institution in the Diffusion of Micro-Irrigation in Gujarat, Western India”, February 2016.
232. Keshab Das and Hastimal Sagara, “State and the IT Industry in India: A Policy
Critique”, March 2016. 233. Tara Nair, “Media, Technology and Family: Exploring the Dynamics of
Interactions”, May 2016. 234. Amrita Ghatak, Debasish Nandy and Suddhasil Siddhanta, “Burden of Diseases due
to Air Pollution in Urban India”, July 2016. 235. Unmesh Patnaik, Prasun Kumar Das, Chandra Sekhar Bahinipati, Onkar Nath, “Can
Developmental Interventions Reduce Households’ Vulnerability? Empirical Evidence from Rural India”, August 2016.
236. N. Lalitha and Amrita Ghatak, “India’s Social Science Research Publications from
an International Perspective”, September 2016. 237. Keshab Das, “Craft Clusters and Work in Rural India: An Exploration”, October
2016.

238. N. Lalitha, “Creating Viable Markets through use of Geographical Indications:
What can India Learn from Thailand?”, November 2016. 239. Unmesh Patnaik, Prasun Kumar Das and Chandra Sekhar Bahinipati, “Effect of Rural
Livelihoods Project on Adaptation Decision and Farmers’ Wellbeing in Western Odisha, India: Application of Endogenous Switching Regression”, December 2016.
240. N. Lalitha and Soumya Vinayan, “GIs for Protecting Agro-Biodiversity and
Promoting Rural Livelihoods: Status, Strategies and Way Forward”, January 2017.
241. Itishree Pattnaik, “Land Ownership Rights and Women Empowerment in
Gujarat: A Critical Assessment”, February 2017.

About the Institute The Gujarat Institute of Development Research (GIDR), established in 1970, is a premier organisationrecognised and supported by the Indian Council of Social Science Research, New Delhi and Government of Gujarat. It is an approved institute of Maharaja Krishnakumarsinhji Bhavnagar University, Bhavnagar, Gujarat. GIDR undertakes analytical and policy-oriented research concerning development issues. The broad thrust areas of research at the Institute include Natural Resource Management, Agriculture and Climate Change, Industry, Infrastructure, Trade and Finance, Employment, Migration and Urbanisation, Poverty and Human Resource Development and Regional Development, Institutions and Governance.
• In the area of Natural Resource Management, Agriculture and Climate Change, in-depth studies have been carried out relating to some of the major development interventions like Participatory Irrigation Management, Watershed Development Programmes, Joint Forest Management and Protected Area Management. The studies have focused mainly on aspects relating to economic viability, equity and institutional mechanisms. In the sphere of management of natural resources, these studies often explore the interrelationships between the community, government and civil society. Many of these studies, based on careful empirical enquiry at the micro level, have contributed to the on-going debates on sustainable environment and institutions. Issues in Common Property Land Resources and land use have also been researched extensively.
• The research in the area of Industry, Infrastructure, Trade and Finance focuses on the response of micro, small and
medium enterprises to the changing government policies in the wake of liberalisation. The research has contributed to work on industrial clusters, flexible specialization and addresses issues involving intellectual property regimes, especially for pharmaceuticals and biotechnology. Studies dealing with issues in provisioning of and access to basic infrastructure both in the rural and urban areas, the linkages between infrastructure, trade and finance, regional growth and aspects of governance have also been carried out at the Institute.
• Studies under the theme Employment, Migration and Urbanisation relate to population, demographic changes,
labour, nature of employment, diversification of economic activities and migration. An emerging aspect has been to study international migration to trace social, economic, cultural and political influences through remittances, social spending and norms setting. Urban services and aspects of urban economy and governance have also been an important emerging area of research at the Institute.
• The research in Poverty and Human Resource Development focuses on population, labour and poverty issues. The
studies relate to quality of life, education, social infrastructure, diversification of economic activities and migration. The informalisation process in the labour and production systems leading to poverty and social security issues forms another important theme. The research on health and family welfare has contributed towards developing a framework for target- free approach in family planning. In the informal sector debate the research has focused on the collection of social statistics to influence policies for better labour conditions and social security reforms.
• The enquiry in Regional Development, Institutions and Governanceconcentres on application of regional planning
models, data collection and analysis for regional planning exercises, impact of area development plans on growth and development of the regional economy. Studies have also focused on studying the role and participation of Non-Governmental Organisations (NGOs) in the development process, the changes in the characteristics of the NGOs and so on.
The major strength of the Institute is a thorough understanding of the micro processes and a consolidated effort to link these to macro issues. The faculty members have made considerable endeavour towards developing policy-sensitive database of the Indian economy, especially relating to the informal activities, including child labour. The Institute has played a useful role in promoting empirical research in the country and the evolution of related conceptual framework and approaches. Overtime, the Institute's research agenda has broadened to cover a fairly wide range of issues pertaining to development policy both at the regional and the national levels. The results of the Institute's research are shared with policy makers, non-governmental organisations and other academicians. The faculty members at the Institute also participate in government panels, committees and working groups to influence certain policy decisions. The Institute promotes public discussion through the publication of its research findings and through seminars, conferences and consultation and undertakes collaborative research along with NGOs, international organisations, government and academic institutions.