workforce futures
TRANSCRIPT

Workforce Futures 2013 - 2016

Photo credit: Tourism Saskatoon: Gordon Taylor

A Message from... The City Manager
Murray TotlandCity Manager
Photo credit: Tourism Saskatoon: Gordon Taylor
We are pleased to present Workforce Futures, our roadmap to guide the development of our current and future workforce.
In 2012, City Council adopted the City of Saskatoon’s 2012 – 2022 Strategic Plan. Equipped with a long term vision, it seeks collaborative, responsive and innovative ways to create a highly desirable and
sustainable city. The Strategic Plan outlines seven strategic goals, and includes an overarching mission, values and leadership commitments. These define how we do business and how we empower ourselves to embrace change – and if there is one thing in Saskatoon’s future, it’s change!
One of the strategic goals is A Culture of Continuous Improvement and is defined in part by how we provide high quality services to meet the needs and expectations of our citizens. One of the priorities for the next four years is to build a workplace culture that offers opportunities for career development, work-life balance and employee recognition.
Our workforce, like our community, is evolving rapidly; with multi-generational departments, labour shortages, impending retirements and diversity of incoming staff, it is clear that many factors need to be considered to build our workforce strategy. Workforce Futures is our plan to ensure we have a skilled, knowledgeable and inclusive workforce and that our work is aligned with our operational demands and strategic direction.
We will utilize leading practices to recruit the best employees to help build on our corporate culture of creativity, innovation and continuous improvement. We must continue to be viewed as a “first-choice” employer for prospective staff. We want our employees to feel directly connected to the City’s progress; thereby enhancing their personal satisfaction with “a job well done”.
The strategic priorities guiding our Workforce Futures plan are:
Attraction, Selection and Retention
Inclusive Workforce
Multi-Generational Workforce
Talent Development
Technology and Innovation
These were developed through a consultative process across City departments and validated with provincial and national industry and demographic data. As “a 21st Century City”, we will use multi-faceted approaches to satisfy the very ambitious goals set out in our Strategic Plan.
This really is a time when our actions today will make a significant difference to the future success and prosperity of our organization and the community we serve. Our people have always been our greatest asset and I look forward to continued support across the entire corporation as we move into a defining period in our City’s history.

Table of Contents 1 Our Vision
2 Our Mission
3 Our Corporate Values
4 Our Leadership Commitments
5 Workforce Futures
Strategic Goal—A Culture of Continuous Improvement
Executive Summary
13 Planning Context
Demographic Trends
Labour Trends
Generational Context
Table of Contents
23 Current Workforce Benchmarks
City of Saskatoon Workforce
Absenteeism
Turnover and Retention
Employment Equity
Age
Retirement Eligibility
Summary of Benchmarks
33 Strategic Priorities
Attraction, Selection and Retention
Inclusive Workforce
Multi-Generational Workforce
Talent Development
Technology and Innovation
57 Next Steps

Our Vision
1
In 2030, Saskatoon is a world class city with a proud
history of self-reliance, innovation, stewardship and
cultural diversity. Saskatoon is known globally as
a sustainable city loved for its community spirit, robust
economy, cultural experiences, environmental health,
safety and physical beauty. All citizens enjoy a range of
opportunities for living, working, learning and playing.
Saskatoon continues to grow and prosper, working with
its partners and neighbours for the benefit of all.

2
Our MissionOur Corporation, the City of Saskatoon, exists
to provide excellent local government
through leadership, teamwork, partnership,
and dedication to the community.
We will be innovative and creative in the
efficient and effective delivery of public
services for the economic, environmental,
social and cultural well-being of the community.

Our Corporate Values
Respect
We respect others in the
organization, regardless of
their position or status,
through our specific actions.
3
Trust
We assume responsibility for
our own trustworthiness and
continuously build trust
with our colleagues so they
know they can rely upon us.
Courage
We have the courage to face
adversity with strength,
confidence and poise.
Honesty
We are known for our ability
to hold frank and honest
discussions that maintain the
dignity and perspectives
of others.
Integrity
Everyday, we demonstrate
accountability and our actions
are always honorable
and ethical.

Our Leadership Commitments
4
Our leadership commitments are another critical ingredient for the City of Saskatoon to accomplish the vision and mission. We value and need people who demonstrate our four leadership commitments throughout their daily activities and in a manner that help to achieve the Strategic Goals.
Reliable and Responsive Service
As leaders we work towards providing high quality service. We take initiative to respond to the needs of our changing community and strive to earn the respect and confidence of the public.
Strong Management and Fiscal Responsibility
As leaders we strive to align our work to the corporate strategies and deliver municipal services in cost effective ways. We endorse the collective bargaining process. We continuously work towards achieving maximum benefits and services by establishing partnerships to leverage resources. And, we ensure future
generations are not financially responsible for the benefits received solely by today’s residents.
Effective Communication, Openness and Accountability
As leaders we make every effort to provide timely and accessible information on services and programs to our citizens. We maintain strong working relationships and open lines of communication between City Council, Senior Administration, civic employees and citizens.
Innovation and Creativity
As leaders we aspire to create a work environment that allows us to generate new ideas to meet the changing needs of the community. We aim to conduct our work using a collaborative approach.

Workforce Futures Workforce Futures

Workforce Futures In financial terms, ‘futures’ implies a financial
investment; one that can provide a significant
future benefit for investors. By using the same term
for workforce planning, we highlight the importance
of investing in the future of the City of Saskatoon
employees and the diverse skills, expertise and
commitment they bring to their jobs.
6
Workforce Futures

7
Strategic Goal A Culture of Continuous Improvement
Saskatoon is the best-managed city in Canada.
We provide high quality services to meet the dynamic needs and high expectations of our citizens. We focus on continuous improvement and providing the best possible services using innovative and creative means. We go beyond conventional approaches to meet the changing needs of our city.
We are a preferred employer that attracts skilled and talented people from a variety of backgrounds and professional disciplines. We are diverse and broadly representative of the community we serve.
We work together in a safe, healthy and productive environment. We know what is expected of us in our respective roles. And, we feel engaged and empowered to build a better city – committing ourselves to high standards of performance and taking responsibility for our decisions and actions each day.
Photo credit: Tourism Saskatoon

Continuous Improvement
8
Priorities for this Term(4 Years)
Build a workplace culture that offers opportunities for career development, work-life balance and employee recognition.
Develop and monitor a recruitment and retention strategy that attracts the best available talent and retains new employees over the long term.
Identify targeted opportunities to implement specific continuous improvement tools within departments.
Strategies for the Long Term(10 Years)
Create and encourage a workplace culture of continuous improvement that encourages innovation and forward-thinking.
Offer long term careers with desirable benefits.
Offer an inclusive workplace that embraces diverse backgrounds.
Make health and safety a top priority in all that we do.
Provide ongoing skills training and professional development opportunities for staff.
Increase productivity by being more efficient in the way we do business.
Leverage technology and emerging trends to reach our goals, serve citizens and connect meaningfully with our stakeholders.

Executive Summary | City of Saskatoon Workforce Futures
9
Executive Summary
Workforce Futures is the City of Saskatoon’s (the City) strategic approach to addressing actionable workforce priorities. This is to ensure a skilled, knowledgeable and inclusive workforce motivated to respond to changing demographic trends, economic conditions and technological innovations.
We will continue to build on our commitment to creating a culture of inclusion, innovation, and adaptability. Workforce Futures provides a foundation upon which to transform critical data into strategic insight to ensure alignment of our workforce with our operational demands and strategic direction. To begin, we provide an overview of the statistical context in which workforce planning happens. From there, key benchmarks are identified for measuring the City’s workforce against public service norms, and finally, we outline evidence-based strategic priorities.
Why Workforce Planning?
A generational shift is happening in workplaces across the country – for the first time in modern history, four distinct generations (Matures, Baby Boomers, Generation X, Generation Y) are working together. This is changing the nature of the workforce such that a market formerly controlled by employers is increasingly influenced by potential employees.
The City of Saskatoon is responsible for a wide range of services: public transit to infrastructure, utilities to environmental leadership, land planning to recreational facilities and more. The Corporation not only responds to community needs, it responds to community interests and demands. With a growing and increasingly diverse population, these needs, interests and expectations are becoming progressively broader. A sustainable, appropriately skilled workforce is necessary for the City to continue meeting essential needs while also responding to changing demands.
Workforce planning is a strategic activity designed to ensure the City of Saskatoon has the right number of people, with the right kinds of knowledge and skills, in the right places, to carry out its vision, mission and goals.
Workforce planning is designed to anticipate the human resource needs of individual departments and integration with the City’s Corporate Strategic Plan. The Corporate Strategic Plan highlights the goal of attaining ‘a culture of continuous improvement.’ It further outlines both long term strategies and short term priorities that we will collectively achieve. Workforce Futures calls for regular examination of the City’s current workforce to ensure that the distinct, often specialized skill sets required by different depart-ments, branches and units are included in departmental and corporate planning. This process will support the accomplishment of priorities outlined in the Corporate Strategic Plan.
“Workforce planning offers a means of
systematically aligning organizational and program
priorities with the budgetary and human resources
needed to accomplish them.”
- Building Successful Organizations,
U.S. Department of Health
and Human Services, 1999

Executive Summary | City of Saskatoon Workforce Futures
10
The Taskforce
In November 2010, the City of Saskatoon Human Resources Department established a cross functional team to identify actionable workforce priorities that need to be addressed in order to support the strategic business objectives of our Corporation.
The Workforce Strategy Taskforce brought together the specialized expertise of the Human Resources Department, including Employment and Total Compensation, Labour Relations, Occupational Health and Safety and Organization and Employee Development.
The goal was to develop as broad a perspective as possible of the Human Resources needs of the Corporation, while also gaining insight into the unique needs and challenges of specific departments and/or branches. To do this, the task force conducted interviews with City of Saskatoon senior management and individual branch managers.
The interviews and discussions were framed to capture managers’ perceptions regarding workforce needs. Results were
analyzed within the context of current and projected workforce needs, both as they pertain to the Corporation and the wider census metropolitan area. This ensures the City’s workforce planning is connected to evolving trends in the labour market.
Aligning Workforce Planning with Corporate Strategic Planning
“People management should be looked at as a strategic rather than a technical issue.”
- Workforce Planning in Local
Government, Municipal
Association of Victoria,
Australia
0
12
10
8
6
4
2
2012 2016 2021 2026200,000
240,000 236,
542
238,
884
240,
055
246,
147
258,
576
264,
976
258,
703 285,
488
299,
796
271,
899 31
5,20
233
9,19
1
280,000
320,000
360,000
Low Growth Medium Growth High Growth
500
1,000
1,500
2,000
2,500
2002 2007 20120
1,78
723
2 457
1,97
322
1 556
2,32
524
662
4
Civic Boards Police
Non-Aboriginal Population Non-Aboriginal Population
2005 2006 2007 20080
3,500
7,000
Human Resouces Operations
Departmental Workforce Planning
Corporate Human Resources Strategy
Corporate Strategy
2009
Periodic
5.0
OngoingMedical
Condition
2.5
Workers’Compensation
1.1
Total
8.6
StatisticsCanada
Benchmark
10.9
0.00%
1.00%
2.00%
3.00%
4.00%
2007
2.34%
2008
2.49%
2009
2.61%
2010
2.48%
2011
3.30%
PQ BC ON MB AB SK Canada0
5%
10%
15%
20%
65+ years
55-64 years
15-54 years
0-14 years83% 17%
81% 19%
96% 4%
98% 2%
20% 40% 60% 80%0% 100%
Senior (65+ years) Mature Labour Force (45-65 years)Young Labour Force (20-44 years)
2011
2016
2021
2026 21%23%
32%
20% 40% 60% 80% 100%
23%20%
36%
25%17%
36%
26%14%
37%
0%
Out-of-Scope5.6%
In-Scope94.4%
Embedding Workforce Planning in Strategic Planning
Workforce planning is not simply a human resource issue; it is an inclusive process that directly
relates to every department, branch and unit. Strategic planning, budget planning, program staff,
program management, service delivery, all are dependent on the Corporation’s ability to recruit
and retain the right people, in the right jobs, at the right times.
Executive Summary | City of Saskatoon Workforce Futures
11
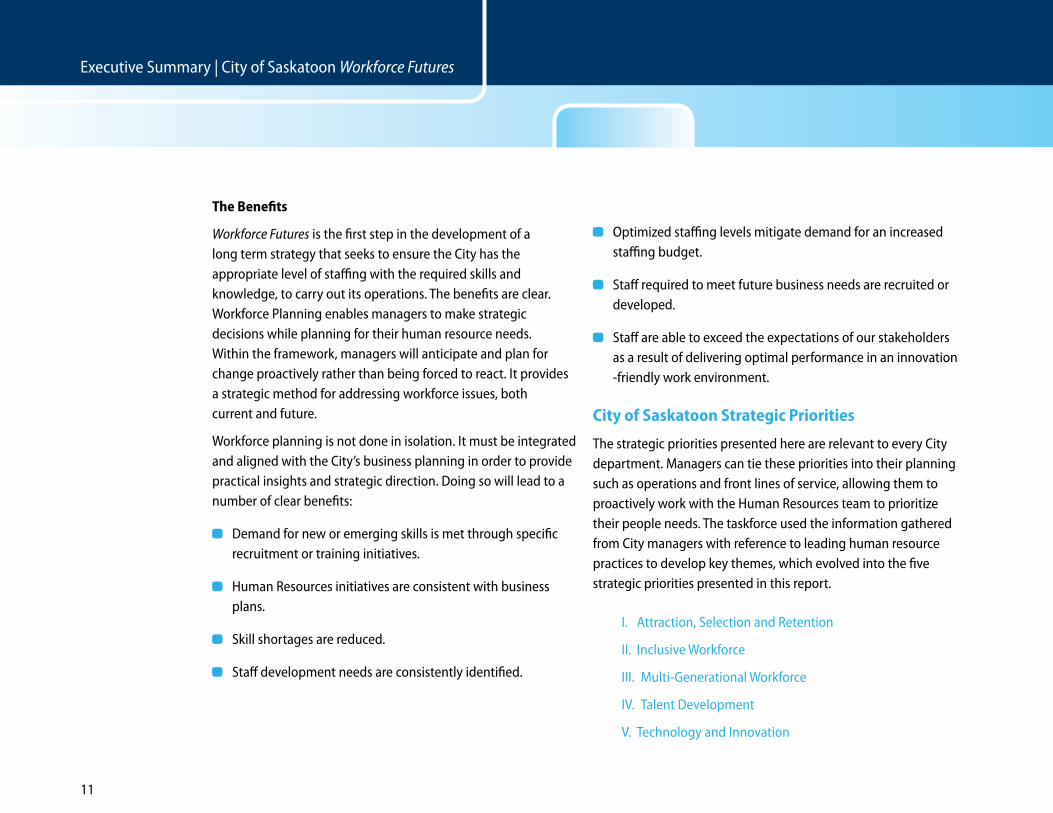
The Benefits
Workforce Futures is the first step in the development of a long term strategy that seeks to ensure the City has the appropriate level of staffing with the required skills and knowledge, to carry out its operations. The benefits are clear. Workforce Planning enables managers to make strategic decisions while planning for their human resource needs. Within the framework, managers will anticipate and plan for change proactively rather than being forced to react. It provides a strategic method for addressing workforce issues, both current and future.
Workforce planning is not done in isolation. It must be integrated and aligned with the City’s business planning in order to provide practical insights and strategic direction. Doing so will lead to a number of clear benefits:
Demand for new or emerging skills is met through specific recruitment or training initiatives.
Human Resources initiatives are consistent with business plans.
Skill shortages are reduced.
Staff development needs are consistently identified.
Optimized staffing levels mitigate demand for an increased staffing budget.
Staff required to meet future business needs are recruited or developed.
Staff are able to exceed the expectations of our stakeholders as a result of delivering optimal performance in an innovation -friendly work environment.
City of Saskatoon Strategic Priorities
The strategic priorities presented here are relevant to every City department. Managers can tie these priorities into their planning such as operations and front lines of service, allowing them to proactively work with the Human Resources team to prioritize their people needs. The taskforce used the information gathered from City managers with reference to leading human resource practices to develop key themes, which evolved into the five strategic priorities presented in this report.
I. Attraction, Selection and Retention
II. Inclusive Workforce
III. Multi-Generational Workforce
IV. Talent Development
V. Technology and Innovation

12
Executive Summary | City of Saskatoon Workforce Futures
Workforce planning is a strategic activity designed to ensure the City of Saskatoon has the right number of people, with the right kinds of knowledge and skills, in the right places, to carry out its vision, mission and goals.

Planning ContextPlanning Context

Planning ContextPlanning Context
14
Workforce planning does not happen in a vacuum;
the City of Saskatoon is influenced by a number of
factors such as national and provincial population
and labour trends. This section outlines the key
demographic issues impacting our workforce
planning.

15
Demographic Trends
Saskatchewan is enjoying an economic and demographic renaissance. As the provincial economy grows, so too does the population, in both size and diversity. These trends are reflected in the province’s largest city—Saskatoon. The city has accounted for roughly 30% of Saskatchewan’s population growth since 2011. Between 2006 and 2011, Saskatoon grew by approximately 20,000 people or about 4,000 people a year. This is the rough equivalent of adding a community larger than the size of Humboldt to the city’s population every year. (Source: The City of Saskatoon Planning Development Branch, December 2011)
Population Growth
Statistics Canada 2012 estimates the population of the Saskatoon Census Metropolitan Area (CMA) at 284,000. Saskatoon’s share of the CMA population is estimated to be 84.2%, which puts the city’s population in 2012 at 239,200 – and growing.
The population of Saskatoon will surpass a quarter of a million mark by 2017 at a low annual growth rate of 2.0%.
At a medium annual growth rate of 2.5%, the city will surpass the 300,000 mark by approximately 2022.
City of Saskatoon Population Projection “The number one challenge facing the City of Saskatoon is meeting
the demands of growth.”
- City of Saskatoon
submission to
Premier Brad Wall,
March 4, 2011
Planning Context | City of Saskatoon Workforce Futures
Source: The City of Saskatoon Planning Development Branch, December 2011
2017 2022 2027 20320
100,000
262,
263
269,
552
277,
320
290,
225
305,
167
321,
049
320,
094
345,
888
373,
979
350,
725
387,
742
428,
523
200,000
300,000
400,000
2.0% Growth 2.5% Growth 3.0% Growth

16
Increasing Diversity
Aboriginal People
According to the 2006 Census, Aboriginal people make up 14.9% of Saskatchewan’s population and 9.3% of Saskatoon’s population.
Saskatoon’s Aboriginal Population by Age
In Saskatoon, the Aboriginal population accounts for 17% of Saskatoon’s total population of children aged 0 to 14, 19% of the total population of those in the active labour force (aged 15 to 54), 4% of the total population aged 55 to 64 and 2% of the total population of seniors aged 65 and over. (Source: Statistics Canada, Aboriginal Peoples in Canada’s Urban Area –
Narrowing the Education Gap)
Immigrants
The number of immigrants to Saskatchewan and Saskatoon has increased significantly in recent years. In 2009, Saskatoon attracted 6,590 immigrants, including 2,564 permanent residents, 2,031 temporary foreign workers and 1,995 foreign students.
Number of immigrants to Saskatoon
Note: Includes permanent workers, foreign workers and foreign students.
Source: The City of Saskatoon Business Plan and Preliminary Budgets, December 2010
Historic trends put the city’s overall share of provincial immi-grants at 40-42%. Recently, the city has attracted as many as 51%. If the province continues to attract 12,000 immigrants a year, and if Saskatoon continues to attract 40%, by conser-vative estimates the city could see an annual influx of 4,800 newcomers. If, however, current trends hold, the city could see as many as 6,120 new immigrants a year. (Source: SINP, Citizenship and Immigration Canada, Facts and Figures 2009)
According to Statistics Canada findings, if the Aboriginal population was employed at the same rate as the non-Aboriginal population (approx. 67% of population aged 15 and older), there would have been an additional 19,000 workers in Saskatchewan in 2006.
- Statistics Canada Labour Market
Issues in Saskatchewan: A
Situational Analysis, Sask Trends
Monitor, May 2009
Planning Context | City of Saskatoon Workforce Futures
0
12
10
8
6
4
2
2012 2016 2021 2026200,000
240,000 236,
542
238,
884
240,
055
246,
147
258,
576
264,
976
258,
703 285,
488
299,
796
271,
899 31
5,20
233
9,19
1
280,000
320,000
360,000
Low Growth Medium Growth High Growth
500
1,000
1,500
2,000
2,500
2002 2007 20120
1,78
723
2 457
1,97
322
1 556
2,32
524
662
4
Civic Boards Police
Non-Aboriginal Population Non-Aboriginal Population
2005 2006 2007 20080
3,500
7,000
Human Resouces Operations
Departmental Workforce Planning
Corporate Human Resources Strategy
Corporate Strategy
2009
Periodic
5.0
OngoingMedical
Condition
2.5
Workers’Compensation
1.1
Total
8.6
StatisticsCanada
Benchmark
10.9
0.00%
1.00%
2.00%
3.00%
4.00%
2007
2.34%
2008
2.49%
2009
2.61%
2010
2.48%
2011
3.30%
PQ BC ON MB AB SK Canada0
5%
10%
15%
20%
65+ years
55-64 years
15-54 years
0-14 years83% 17%
81% 19%
96% 4%
98% 2%
20% 40% 60% 80%0% 100%
Senior (65+ years) Mature Labour Force (45-65 years)Young Labour Force (20-44 years)
2011
2016
2021
2026 21%23%
32%
20% 40% 60% 80% 100%
23%20%
36%
25%17%
36%
26%14%
37%
0%
Out-of-Scope5.6%
In-Scope94.4%

17
Increasing Age
According to a variety of sources, one of the most pressing issues facing public sector employers over the next 10 years is the aging of their workforce, particularly managers. A recent report found that only 13% of today’s local government managers are under 40 compared to 70% in the early 1970s. The fastest growing segment of the workforce is individuals older than 55, and the population of workers between 35 and 44 is declining. (Source: Generational Change Task Force, Government Finance Officers Association
Research and Consulting Center)
According to City of Saskatoon/Saskatoon Health Region projections, seniors (those aged 65 and over) currently comprise more than 13% of Saskatoon’s population. If no further efforts towards attracting the younger generation through immigration, in-migration and repatriation are put forth over the next 16 years, this number could potentially climb to 23% almost one quarter of the city’s total popula-tion. This figure is based on population projections using a standard medium growth scenario (1% annual population growth rate).
Age Cohorts as Percent of Total Population, 2011-2026
Saskatoon’s median age (the point at which half the population is older and half is younger than the stated figure) is currently 36.4 years. By 2026 the median age will be 40.7. This compares to a median age of 25.8 years in 1976.
“The numbers are simple: 80 million baby boomers
will be retiring in the next decade, there are only
50 million Generation Xers to fill the gap.”
- Generational Change Task Force,
Government Finance Officers
Association Research and
Consulting Center, 2010
“As the value of people increases, so does the
performance capacity of the organization, and
therefore its value to clients and other stakeholders. As
with any investment, the goal is to maximize value
while minimizing risk.”
- Strategic Workforce Planning,
County of Fairfax, Virginia
Planning Context | City of Saskatoon Workforce Futures
0
12
10
8
6
4
2
2012 2016 2021 2026200,000
240,000 236,
542
238,
884
240,
055
246,
147
258,
576
264,
976
258,
703 285,
488
299,
796
271,
899 31
5,20
233
9,19
1
280,000
320,000
360,000
Low Growth Medium Growth High Growth
500
1,000
1,500
2,000
2,500
2002 2007 20120
1,78
723
2 457
1,97
322
1 556
2,32
524
662
4
Civic Boards Police
Non-Aboriginal Population Non-Aboriginal Population
2005 2006 2007 20080
3,500
7,000
Human Resouces Operations
Departmental Workforce Planning
Corporate Human Resources Strategy
Corporate Strategy
2009
Periodic
5.0
OngoingMedical
Condition
2.5
Workers’Compensation
1.1
Total
8.6
StatisticsCanada
Benchmark
10.9
0.00%
1.00%
2.00%
3.00%
4.00%
2007
2.34%
2008
2.49%
2009
2.61%
2010
2.48%
2011
3.30%
PQ BC ON MB AB SK Canada0
5%
10%
15%
20%
65+ years
55-64 years
15-54 years
0-14 years83% 17%
81% 19%
96% 4%
98% 2%
20% 40% 60% 80%0% 100%
Senior (65+ years) Mature Labour Force (45-65 years)Young Labour Force (20-44 years)
2011
2016
2021
2026 21%23%
32%
20% 40% 60% 80% 100%
23%20%
36%
25%17%
36%
26%14%
37%
0%
Out-of-Scope5.6%
In-Scope94.4%
Source: The City of Saskatoon and The Saskatoon Health Region Population
Projections (2006-2026), June 2010

18
Labour Trends
Saskatchewan’s economy has enjoyed a period of sustained growth and major financial institutions are calling for that growth to continue. Year-over-year gross domestic product (GDP) forecasts range from 4.9% (RBC) to 2.8% (Scotiabank) growth.
Saskatoon’s healthy economy is part of a longer growth trend. According to the Conference Board of Canada, Saskatoon has posted a decade of strong growth, aside from mild declines in 2002 and 2009.
A recent Conference Board report forecasts that Saskatoon will experience the strongest growth in Canada in 2011, and will continue to do so through the next four years.
GDP is expected to expand by 4.1%, ahead of strong growth rates of 3.4% and 3.1% in Calgary and Regina, respectively. The surge will be driven by higher prices for natural resources, particularly oil and potash.
Saskatchewan’s unemployment rate continues to be one of the lowest in Canada, at 5.6% compared to the national 7.6% in the spring of 2011. (Sources: Statistics Canada Labour Force Survey; April 2011; Enterprise Saskatchewan,
Economic Checklist, April 11, 2011; Mayor’s Office press release, May 5, 2011)
Saskatchewan is predicted to face labour shortages beginning around 2013 due to baby boomer retirements. In 2003 for every person retiring or exiting the workforce in Saskatchewan, there were two people entering the labour market. By 2020, however, it is estimated that the provincial workforce will have a
replacement rate of only 75%. Aboriginal and immigrant employment trends play a key role in arming the province to deal with the growing demands of our labour market.
Aboriginal Employment
Saskatchewan continues to have Canada’s highest employment gap between Aboriginal and non-Aboriginal people. Recent statistics indicate a 13.5% gap between the percentage of Aboriginal people who are employed in the province and the percentage of non-Aboriginal people who are employed. This compares to a 10.7% gap in Alberta, 5.6% gap in Manitoba and 4.8% gap in Canada overall.
Gap between Aboriginal, Non-Aboriginal Employment Rates
Source: Community, Workforce and Quality of Life Indicators for Saskatchewan,
Enterprise Saskatchewan, April 2010
Educational attainment remains the key to increasing Aboriginal employment rates. The employment rate for Aboriginal people between 25-54 years of age with a post-secondary certificate, diploma or degree was 80.2%, close to parity with 83.5% for non-Aboriginal people.
Planning Context | City of Saskatoon Workforce Futures
0
12
10
8
6
4
2
2012 2016 2021 2026200,000
240,000 236,
542
238,
884
240,
055
246,
147
258,
576
264,
976
258,
703 285,
488
299,
796
271,
899 31
5,20
233
9,19
1
280,000
320,000
360,000
Low Growth Medium Growth High Growth
500
1,000
1,500
2,000
2,500
2002 2007 20120
1,78
723
2 457
1,97
322
1 556
2,32
524
662
4
Civic Boards Police
Non-Aboriginal Population Non-Aboriginal Population
2005 2006 2007 20080
3,500
7,000
Human Resouces Operations
Departmental Workforce Planning
Corporate Human Resources Strategy
Corporate Strategy
2009
Periodic
5.0
OngoingMedical
Condition
2.5
Workers’Compensation
1.1
Total
8.6
StatisticsCanada
Benchmark
10.9
0.00%
1.00%
2.00%
3.00%
4.00%
2007
2.34%
2008
2.49%
2009
2.61%
2010
2.48%
2011
3.30%
PQ BC ON MB AB SK Canada0
5%
10%
15%
20%
65+ years
55-64 years
15-54 years
0-14 years83% 17%
81% 19%
96% 4%
98% 2%
20% 40% 60% 80%0% 100%
Senior (65+ years) Mature Labour Force (45-65 years)Young Labour Force (20-44 years)
2011
2016
2021
2026 21%23%
32%
20% 40% 60% 80% 100%
23%20%
36%
25%17%
36%
26%14%
37%
0%
Out-of-Scope5.6%
In-Scope94.4%

19
Immigrant Employment
Immigrants have benefitted from Saskatoon’s growing job market, yet the employment rate of these newcomers continues to lag behind that of Canadian-born residents. Limited statistical data is available on recent Immigrants in Saskatoon, but a Statistics Canada study published in 2005 using 2001 statistics illustrates the long term nature of immigrant employment challenges.
Saskatoon Immigrant Labour Force Participation Rates by Age
15-24 25-44 45-64 Total
Recent Immigrants* 40% 75% 67% 67%
Canadian-born 70% 87% 78% 80%
* Arrived between 1996-2001
Source: Recent Immigrants in Metropolitan Areas: Saskatoon—a Comparative
Profile Based on the 2001 Census, Statistics Canada
Recent immigrants in Saskatoon have lower labour participation rates than the Canadian-born residents, at 67% versus 80%, respectively. The gap is especially evident among young immigrants (aged 15-24), with 40% labour participation compared to 70% for Canadian-born residents. Participation rates improve the longer immigrants remain in Canada.
Saskatoon Immigrant Employment Rates by Industry Sector
* Arrived between 1996-2001
Source: Recent Immigrants in Metropolitan Areas:
Saskatoon—A Comparative Profile Based on the 2001 Census, Statistics Canada
While recent immigrants tend to be over-represented in lower paying hospitality and manufacturing sector jobs, the public sector has higher attraction rates. Diversity policies play a key role in allowing recent immigrants to attain employment levels on par with Canadian-born residents.
Planning Context | City of Saskatoon Workforce Futures
Recent Immigrants*
Canadian-born Trade
Manufacture 18% 14%
Construction / Transportation Trade
15% 32%
Business Services 10% 12%
Public Sector 37% 32%
Hospitality 21% 11%

20
Generational Context
One of the unique challenges facing public and private sector employers is the broad generational context of the workplace. For the first time in modern history, four generations are partici-pating in the workforce; each with its own distinct characteristics, core values, influences and work styles. This last variable, work styles, presents the greatest challenge for employers and managers.
At the corporate, departmental, branch and unit levels, City of Saskatoon managers are being tasked with integrating the perspectives of different generations into a combined, cohesive workforce. The following table provides an overview of the generational context of workforce planning today.
Planning Context | City of Saskatoon Workforce Futures
“Younger workers with marketable skills are earning higher starting salaries than ever before, the average university grad starting out earns approximately $34,000 a year.”
- Youthography, Culture
in Transition
Recent Immigrants*
Canadian-born Trade
Manufacture 18% 14%
Construction / Transportation Trade
15% 32%
Business Services 10% 12%
Public Sector 37% 32%
Hospitality 21% 11%

21
Planning Context | City of Saskatoon Workforce Futures
Matures (Born before 1946) Baby Boomers (Born 1946-1964) Generation X (Born 1965-1978) Generation Y (Born 1979-1988)
Representation in Workforce Today 10% 45% 30% 15%
Representation in City of Saskatoon Workforce 0.3% 47% 36% 16%
Characteristics
– Savings is important as a result of the Great Depression
– Generally worked for only one place in their lifetime– Men made up the workforce; women stayed home
to run a household
– Credit card debt– Some choosing to lead the second half of
their careers with a different focus– In control of nation’s most important institutions– Coined the term ‘workaholic’
– No concept of life without debt– First to be told they would not be as successful as
their parents– Watched major institutions fail public trust – Influenced by the rise of the personal computer
– Born into tech-savvy world– Have known great affluence– Children of baby boomers and oldest Xers– Considered a coddled generation– Large group; rivals baby boomers in size. Members just starting to
enter the workforce
Core Values – Sacrifice and hard work, conformity and respect for authority, delayed reward and duty before pleasure
– Team orientation, personal gratification, health and wellness, personal growth, youthfulness, work and involvement
– Self-reliant, question authority, balance between life and work
– Civic duty, achievement, sociability and morality– Socially conscious and volunteer-minded, while materialistic
Working With
– Complied with established systems, policies, procedures
– “Climb company ladder by working hard”– Workplace is formal, separate environment from
social structures– Many continue working past retirement
– Number of hours worked = success with company– Loyal to their company and value title and rank– Competitive– Personal accomplishment is important– Respond to managers who reward them for their
hard work– Prefer managers who facilitate vs. dictate rules– Like flexible schedules and hours
– Consider themselves “free agents” in the workforce– No expectations of job security– Need to offer them a work environment that they
find hard to leave– Prefer a workplace that is less hierarchical and formal– Training is one of their best motivators– Adept at technology
– Looking for an opportunity to learn and move about– Desire leadership from management; “army waiting to be guided”– Free-agent mentality– Comfortable with change. Used to tackling multiple tasks with equal energy– Prefer “fun” workplaces– Managers should use technology to communicate with them– Need positive reinforcement– Managers should place them in roles that push their limits
Workplace Strategies
– Sabbatical options – longevity leave– Increased vacation– Retirement packages– Fitness benefits– Consulting options
– Leadership development– Mentoring– Recognition/ incentive– Vacation– Cafeteria benefits plan– Cross Training– Education
– Leadership development– Mentoring– Recognition/ incentive– Vacation– Cafeteria benefits plan– Cross training– Education
Generational Context of Workplace Planning

22
Planning Context | City of Saskatoon Workforce Futures
Matures (Born before 1946) Baby Boomers (Born 1946-1964) Generation X (Born 1965-1978) Generation Y (Born 1979-1988)
Representation in Workforce Today 10% 45% 30% 15%
Representation in City of Saskatoon Workforce 0.3% 47% 36% 16%
Characteristics
– Savings is important as a result of the Great Depression
– Generally worked for only one place in their lifetime– Men made up the workforce; women stayed home
to run a household
– Credit card debt– Some choosing to lead the second half of
their careers with a different focus– In control of nation’s most important institutions– Coined the term ‘workaholic’
– No concept of life without debt– First to be told they would not be as successful as
their parents– Watched major institutions fail public trust – Influenced by the rise of the personal computer
– Born into tech-savvy world– Have known great affluence– Children of baby boomers and oldest Xers– Considered a coddled generation– Large group; rivals baby boomers in size. Members just starting to
enter the workforce
Core Values – Sacrifice and hard work, conformity and respect for authority, delayed reward and duty before pleasure
– Team orientation, personal gratification, health and wellness, personal growth, youthfulness, work and involvement
– Self-reliant, question authority, balance between life and work
– Civic duty, achievement, sociability and morality– Socially conscious and volunteer-minded, while materialistic
Working With
– Complied with established systems, policies, procedures
– “Climb company ladder by working hard”– Workplace is formal, separate environment from
social structures– Many continue working past retirement
– Number of hours worked = success with company– Loyal to their company and value title and rank– Competitive– Personal accomplishment is important– Respond to managers who reward them for their
hard work– Prefer managers who facilitate vs. dictate rules– Like flexible schedules and hours
– Consider themselves “free agents” in the workforce– No expectations of job security– Need to offer them a work environment that they
find hard to leave– Prefer a workplace that is less hierarchical and formal– Training is one of their best motivators– Adept at technology
– Looking for an opportunity to learn and move about– Desire leadership from management; “army waiting to be guided”– Free-agent mentality– Comfortable with change. Used to tackling multiple tasks with equal energy– Prefer “fun” workplaces– Managers should use technology to communicate with them– Need positive reinforcement– Managers should place them in roles that push their limits
Workplace Strategies
– Sabbatical options – longevity leave– Increased vacation– Retirement packages– Fitness benefits– Consulting options
– Leadership development– Mentoring– Recognition/ incentive– Vacation– Cafeteria benefits plan– Cross Training– Education
– Leadership development– Mentoring– Recognition/ incentive– Vacation– Cafeteria benefits plan– Cross training– Education
Note: definitions of birth
years of baby boomers,
Generations X and Y vary;
this example is sourced
from a
United States based
Generational Change
Task Force, Government
Finance Officers
Association Research
and Consulting Center
(adapted from “Two’s
Company, Three’s a
Crowd, and Four’s a Lot
to Manage: Supervising
in Today’s Intergenera-
tional Workplace”, by Dr.
Willow Jacobson ) 2010

Current Workforce Benchmarks
Current Workforce Benchmarks
24
Workforce planning is most effective when
completed within business and strategic planning
processes. Benchmarking the City of Saskatoon’s
existing workforce data against provincial, national
and/or public service sector statistics enables
departments, branches and units to monitor
workforce trends and address gaps.

Current Workforce Benchmarks | City of Saskatoon Workforce Futures
25
City of Saskatoon Workforce
When developing the workforce statistics for the City of Saskatoon we have correlated the data for all permanent full-time, part-time and job share employees as of January 1, 2012. We have not included the data for employees subject to seasonal layoff or temporary and casual employees. For comparison purposes we have also correlated data at five-year intervals as at January 1, 2007 and January 1, 2002 respectively. In addition, all employees used as part of the City’s work force statistics are composed of:
Civic employees: Employees that make up the civic workforce within the City.
Boards: Employees that make up the workforce for all the affiliated boards within the City including the Saskatoon Public Library, Mendel Art Gallery, Credit Union Centre and TCU Place.
Police Services: Employees that make up the workforce within the Saskatoon Police Service.
For benchmarking purposes, we have selected public sector organizations of comparable size and operation. Where there was no data available within these parameters we have selected a relevant public sector organization.
Number of Permanent Employees
Source: City of Saskatoon Human Resources Department
As of January 1, 2012, the majority 94.4% of the City’s permanent employees are in-scope (unionized), 5.6% are out-of-scope (exempt). This is on average greater than the provincial public service; 83.9% of the Saskatchewan public service employees are in-scope. (Source: Saskatoon Public Service Commission, 2009-2010 Annual Report)
0
12
10
8
6
4
2
2012 2016 2021 2026200,000
240,000 236,
542
238,
884
240,
055
246,
147
258,
576
264,
976
258,
703 285,
488
299,
796
271,
899 31
5,20
233
9,19
1
280,000
320,000
360,000
Low Growth Medium Growth High Growth
500
1,000
1,500
2,000
2,500
2002 2007 20120
1,78
723
2 457
1,97
322
1 556
2,32
524
662
4
Civic Boards Police
Non-Aboriginal Population Non-Aboriginal Population
2005 2006 2007 20080
3,500
7,000
Human Resouces Operations
Departmental Workforce Planning
Corporate Human Resources Strategy
Corporate Strategy
2009
Periodic
5.0
OngoingMedical
Condition
2.5
Workers’Compensation
1.1
Total
8.6
StatisticsCanada
Benchmark
10.9
0.00%
1.00%
2.00%
3.00%
4.00%
2007
2.34%
2008
2.49%
2009
2.61%
2010
2.48%
2011
3.30%
PQ BC ON MB AB SK Canada0
5%
10%
15%
20%
65+ years
55-64 years
15-54 years
0-14 years83% 17%
81% 19%
96% 4%
98% 2%
20% 40% 60% 80%0% 100%
Senior (65+ years) Mature Labour Force (45-65 years)Young Labour Force (20-44 years)
2011
2016
2021
2026 21%23%
32%
20% 40% 60% 80% 100%
23%20%
36%
25%17%
36%
26%14%
37%
0%
Out-of-Scope5.6%
In-Scope94.4%
Percentage of Employees by Affiliation
Source: City of Saskatoon Human Resources Department
Current Workforce Benchmarks | City of Saskatoon Workforce Futures
26
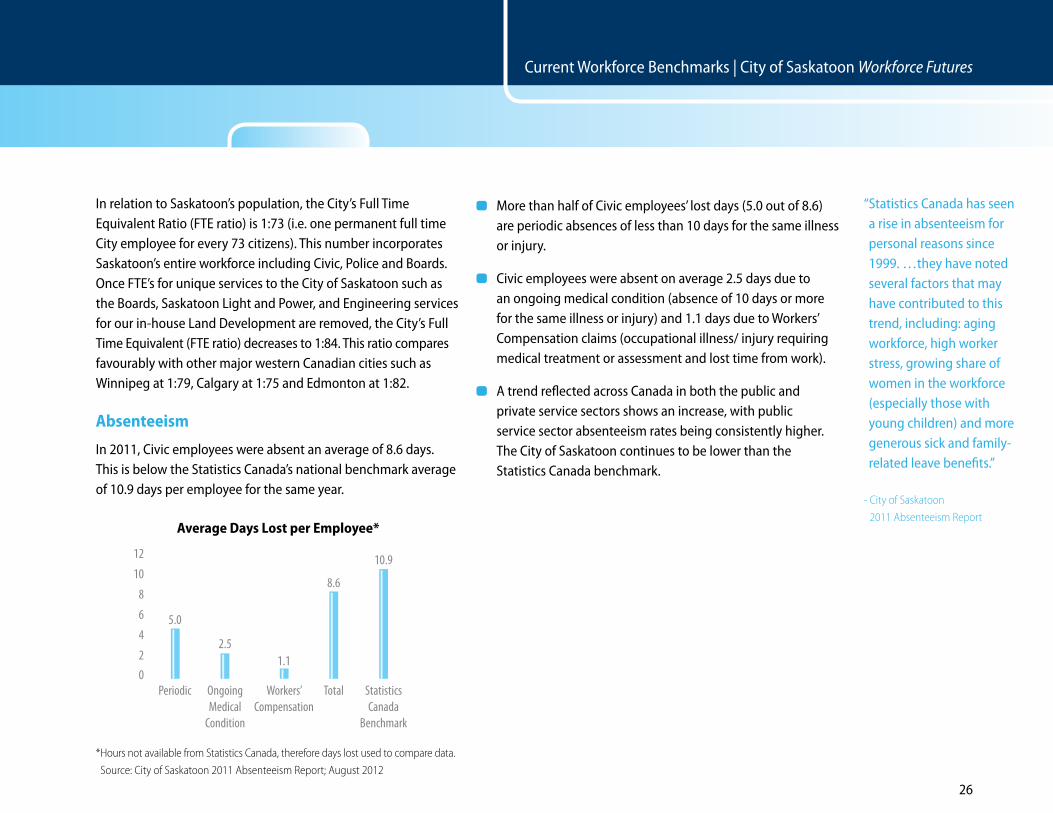
In relation to Saskatoon’s population, the City’s Full Time Equivalent Ratio (FTE ratio) is 1:73 (i.e. one permanent full time City employee for every 73 citizens). This number incorporates Saskatoon’s entire workforce including Civic, Police and Boards. Once FTE’s for unique services to the City of Saskatoon such as the Boards, Saskatoon Light and Power, and Engineering services for our in-house Land Development are removed, the City’s Full Time Equivalent (FTE ratio) decreases to 1:84. This ratio compares favourably with other major western Canadian cities such as Winnipeg at 1:79, Calgary at 1:75 and Edmonton at 1:82.
Absenteeism
In 2011, Civic employees were absent an average of 8.6 days. This is below the Statistics Canada’s national benchmark average of 10.9 days per employee for the same year.
Average Days Lost per Employee*
* Hours not available from Statistics Canada, therefore days lost used to compare data.
Source: City of Saskatoon 2011 Absenteeism Report; August 2012
More than half of Civic employees’ lost days (5.0 out of 8.6) are periodic absences of less than 10 days for the same illness or injury.
Civic employees were absent on average 2.5 days due to an ongoing medical condition (absence of 10 days or more for the same illness or injury) and 1.1 days due to Workers’ Compensation claims (occupational illness/ injury requiring medical treatment or assessment and lost time from work).
A trend reflected across Canada in both the public and private service sectors shows an increase, with public service sector absenteeism rates being consistently higher. The City of Saskatoon continues to be lower than the Statistics Canada benchmark.
“ Statistics Canada has seen a rise in absenteeism for personal reasons since 1999. …they have noted several factors that may have contributed to this trend, including: aging workforce, high worker stress, growing share of women in the workforce (especially those with young children) and more generous sick and family-related leave benefits.”
- City of Saskatoon
2011 Absenteeism Report
0
12
10
8
6
4
2
2012 2016 2021 2026200,000
240,000 236,
542
238,
884
240,
055
246,
147
258,
576
264,
976
258,
703 285,
488
299,
796
271,
899 31
5,20
233
9,19
1
280,000
320,000
360,000
Low Growth Medium Growth High Growth
500
1,000
1,500
2,000
2,500
2002 2007 20120
1,78
723
2 457
1,97
322
1 556
2,32
524
662
4
Civic Boards Police
Non-Aboriginal Population Non-Aboriginal Population
2005 2006 2007 20080
3,500
7,000
Human Resouces Operations
Departmental Workforce Planning
Corporate Human Resources Strategy
Corporate Strategy
2009
Periodic
5.0
OngoingMedical
Condition
2.5
Workers’Compensation
1.1
Total
8.6
StatisticsCanada
Benchmark
10.9
0.00%
1.00%
2.00%
3.00%
4.00%
2007
2.34%
2008
2.49%
2009
2.61%
2010
2.48%
2011
3.30%
PQ BC ON MB AB SK Canada0
5%
10%
15%
20%
65+ years
55-64 years
15-54 years
0-14 years83% 17%
81% 19%
96% 4%
98% 2%
20% 40% 60% 80%0% 100%
Senior (65+ years) Mature Labour Force (45-65 years)Young Labour Force (20-44 years)
2011
2016
2021
2026 21%23%
32%
20% 40% 60% 80% 100%
23%20%
36%
25%17%
36%
26%14%
37%
0%
Out-of-Scope5.6%
In-Scope94.4%

Current Workforce Benchmarks | City of Saskatoon Workforce Futures
Turnover and Retention
In 2010, the City’s workforce attrition rate (number of permanent employees who left the City) was 5.37%. This compares favourably with the turnover rates for Calgary at 5.8% and Edmonton at 7.2%.
The civic attrition rate for 2011 is 7.6%. This increase is largely due to an increasing number of retirements due to the City’s aging workforce demographics.
The City is performing well in terms of retaining employees. Despite a nominal drop in the retention rates over the past five years, retention rates for permanent employees remain above 70%.
Retention: Permanent Employees
Source: City of Saskatoon Human Resources Department
The City’s five-year retention rate of 75.3% compares favourably with the Saskatchewan Public Service Commission five-year retention rate of 60% in 2009 to 2010.
Retention: Permanent Employees (percent stayed)
Source: City of Saskatoon Human Resources Department
Length of Service
The average length of service for all City employees is 12.5 years, a decline from 14.4 and 13.8 years in 2002 and 2007, respectively.
Average Years of Service (number of years)
0
50%
25%
Stayed0%
25%
78.1% 75.3%
Left
21.9% 24.7%
50%
75%
100%
2001 to 2006 2006 to 2011
10%
20%
30%
40%
50%
% More than20 years
% More than25 years
% More than30 years
0
33%29%
25%
13%20%
14%
4% 5% 8%
January 1, 2002 January 1, 2007 January 1, 2012
15-24
4%
25-34
22%
35-44
26%
45-54
31%
55+
17%
0
20
10
2002
14.4
2007
13.812.5
2012
City Clerks 90.5%53.8%
90.5%75.0%
81.9%86.3%
55.1%68.8%
71.3%80.4%
67.4%
City ManagerCity Solicitor
Community ServicesCorporate Services
FireHuman Resources
Infrastructure ServicesUtility Services
PoliceBoards
20% 40% 60% 80% 100%0%
City Clerks 45%35%
29%30%
41%22%
17%26%
29%25%
33%
City ManagerCity Solicitor
Community ServicesCorporate Services
FireHuman Resources
Infrastructure ServicesUtility Services
PoliceBoards
10% 20% 30% 40% 50%0%
Non-eligible72%
Eligible in next 5 years28%
0
50%
25%
Stayed0%
25%
78.1% 75.3%
Left
21.9% 24.7%
50%
75%
100%
2001 to 2006 2006 to 2011
10%
20%
30%
40%
50%
% More than20 years
% More than25 years
% More than30 years
0
33%29%
25%
13%20%
14%
4% 5% 8%
January 1, 2002 January 1, 2007 January 1, 2012
15-24
4%
25-34
22%
35-44
26%
45-54
31%
55+
17%
0
20
10
2002
14.4
2007
13.812.5
2012
City Clerks 90.5%53.8%
90.5%75.0%
81.9%86.3%
55.1%68.8%
71.3%80.4%
67.4%
City ManagerCity Solicitor
Community ServicesCorporate Services
FireHuman Resources
Infrastructure ServicesUtility Services
PoliceBoards
20% 40% 60% 80% 100%0%
City Clerks 45%35%
29%30%
41%22%
17%26%
29%25%
33%
City ManagerCity Solicitor
Community ServicesCorporate Services
FireHuman Resources
Infrastructure ServicesUtility Services
PoliceBoards
10% 20% 30% 40% 50%0%
Non-eligible72%
Eligible in next 5 years28%
27

Current Workforce Benchmarks | City of Saskatoon Workforce Futures
0
50%
25%
Stayed0%
25%
78.1% 75.3%
Left
21.9% 24.7%
50%
75%
100%
2001 to 2006 2006 to 2011
10%
20%
30%
40%
50%
% More than20 years
% More than25 years
% More than30 years
0
33%29%
25%
13%20%
14%
4% 5% 8%
January 1, 2002 January 1, 2007 January 1, 2012
15-24
4%
25-34
22%
35-44
26%
45-54
31%
55+
17%
0
20
10
2002
14.4
2007
13.812.5
2012
City Clerks 90.5%53.8%
90.5%75.0%
81.9%86.3%
55.1%68.8%
71.3%80.4%
67.4%
City ManagerCity Solicitor
Community ServicesCorporate Services
FireHuman Resources
Infrastructure ServicesUtility Services
PoliceBoards
20% 40% 60% 80% 100%0%
City Clerks 45%35%
29%30%
41%22%
17%26%
29%25%
33%
City ManagerCity Solicitor
Community ServicesCorporate Services
FireHuman Resources
Infrastructure ServicesUtility Services
PoliceBoards
10% 20% 30% 40% 50%0%
Non-eligible72%
Eligible in next 5 years28%
28
However, tracking average length of service does not tell the full story. Given the broad scope of the City’s services, the municipal workforce is large and diverse. Employee tenure runs the full gamut, from new hires with less than a year’s experience to long term veterans with over 30 years of experience.
As the following chart shows, as of January 1, 2012, 25% of the City employees have 20 or more years of service. This is down from one-third (33%) at the end of 2002. At the same time, there has been a slight increase in the number of employees who have been with the City for more than 30 years, from 4% at the end of 2002 to 8% at the end of 2012. This number is expected to rise as baby boomers reach retirement, and then drop once the majority of them have exited the corporation.
Percentage of Long Term Employees
Source: City of Saskatoon Human Resources Department
Why Retention Matters
The cost to replace one employee is estimated at one-third of the employee’s salary. This cost is made up of advertising, screening, interviewing, travel and relocation, orientation and onboarding, and productivity losses in number of days until vacant position is filled. For example, a minimum wage employee making $9.25/hour earning $19,315/year will cost approximately $6,438/year to replace. (Source: www.employeeretentionstrategies.com)
Employment Equity
The City of Saskatoon remains committed to providing local government through leadership, teamwork, partnership and dedication to the community. The Corporate Employment Equity Program strives to support this mission by ensuring all members of our community have fair and equal access to employment opportunities. Employment equity enhances traditional policies for recruiting, hiring, training and promoting employees while creating an inclusive work environment free of barriers.
Employment equity statistics for the City of Saskatoon include all employees within the civic workforce with the exception of employees who are part of the Fire and Protective Services Depart-ment. Within the Saskatoon Police Service, in-scope C.U.P.E 59 employees are included while all other employees are excluded. Within the Boards which includes the Saskatoon Public Library, all C.U.P.E. 59 members are included while all other members have been excluded as part of the employment equity statistics.
“ A 3,000-employee organization with average salaries of $45,000 that reduces turnover by just 1% can save $1.3 million [per year]…”
- “Hidden” Costs of Turnover
Can Greatly Exceed
Numerical Calculations
www. employeeretentionstrategies.com
Current Workforce Benchmarks | City of Saskatoon Workforce Futures
29
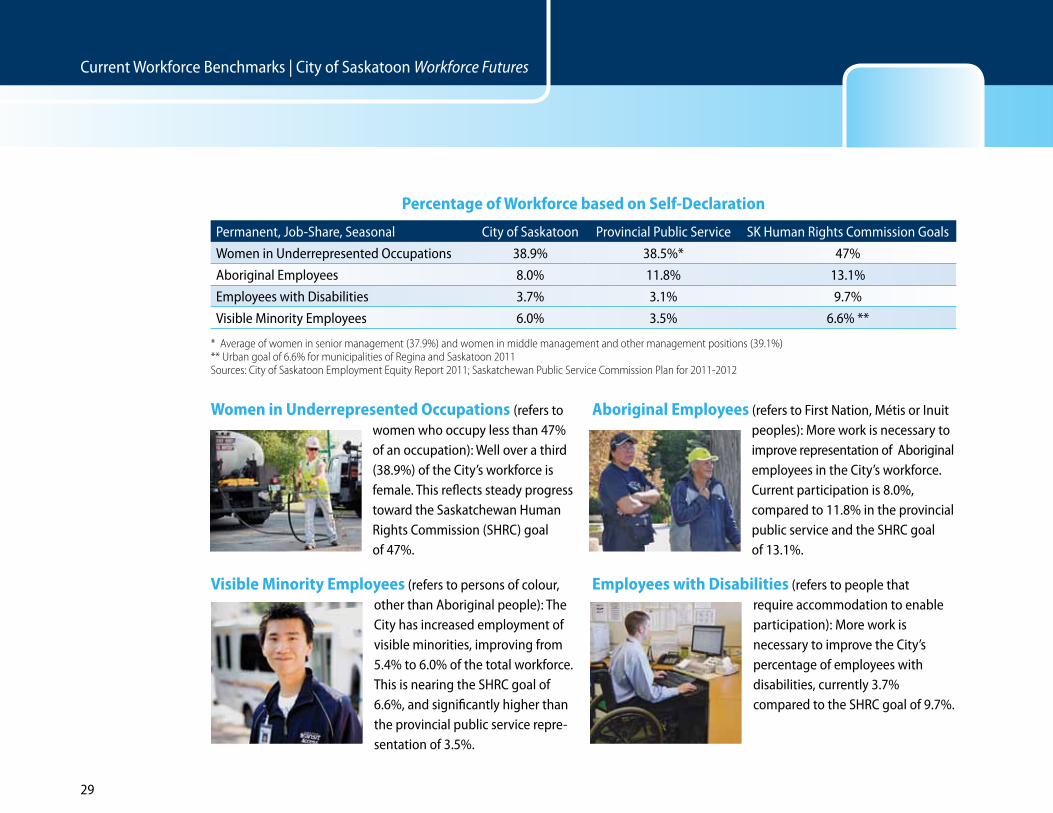
Percentage of Workforce based on Self-Declaration
Permanent, Job-Share, Seasonal City of Saskatoon Provincial Public Service SK Human Rights Commission Goals
Women in Underrepresented Occupations 38.9% 38.5%* 47%
Aboriginal Employees 8.0% 11.8% 13.1%
Employees with Disabilities 3.7% 3.1% 9.7%
Visible Minority Employees 6.0% 3.5% 6.6% **
* Average of women in senior management (37.9%) and women in middle management and other management positions (39.1%) ** Urban goal of 6.6% for municipalities of Regina and Saskatoon 2011Sources: City of Saskatoon Employment Equity Report 2011; Saskatchewan Public Service Commission Plan for 2011-2012
Women in Underrepresented Occupations (refers to women who occupy less than 47% of an occupation): Well over a third (38.9%) of the City’s workforce is female. This reflects steady progress toward the Saskatchewan Human Rights Commission (SHRC) goal of 47%.
Visible Minority Employees (refers to persons of colour, other than Aboriginal people): The City has increased employment of visible minorities, improving from 5.4% to 6.0% of the total workforce. This is nearing the SHRC goal of 6.6%, and significantly higher than the provincial public service repre-sentation of 3.5%.
Aboriginal Employees (refers to First Nation, Métis or Inuit peoples): More work is necessary to improve representation of Aboriginal employees in the City’s workforce. Current participation is 8.0%, compared to 11.8% in the provincial public service and the SHRC goal of 13.1%.
Employees with Disabilities (refers to people that require accommodation to enable participation): More work is necessary to improve the City’s percentage of employees with disabilities, currently 3.7% compared to the SHRC goal of 9.7%.

Current Workforce Benchmarks | City of Saskatoon Workforce Futures
30
Age
As at January 1, 2012, almost one-half (48%) of the City’s permanent employees are 45 years of age or older. This includes 17% of employees who are 55 years of age or older.
Age Demographics of City of Saskatoon Workforce (in years)
Source: City of Saskatoon Human Resources Department, January 2012
At 17%, the City’s proportion of older workers, 55+, is slightly higher than the overall proportion of Canadian workers (15%) and provincial workers (16.5%) (see next chart).
Workforce Age: City of Saskatoon vs. Provincial and National Populations
15-24 25-44 55+
City of Saskatoon* 4.1% 79.0% 16.9%
Saskatoon** 20.8% 51.7% 27.3%
Saskatchewan** 17.5% 66.0% 16.5%
Canada** 15.6% 69.2% 15.2%
* City of Saskatoon 2011 statistics
** Statistics Canada, Community profile and Labour Force Statistics, June 2011
Average Age of Public Service Employees (in years)
City of Saskatoon Canada
Permanent/ Job-Share
Seasonal Employees
Public Service
Employees
All Employed Canadians
2002 43.5 34.9 2001 44.7 38.8
2007 44.1 34.2 2004 44.9 39.6
2012 43.6 33.4 2007 45.3 40.0
Source: City of Saskatoon Human Resources Department
Comparing the City’s employees permanent and job-share with all of Canada’s permanent employees shows that the City’s workforce is somewhat younger than the Canadian public service sector average, but older than the overall aver-age of employed Canadians.
The average age of the City’s permanent employees in 2012 is 43.6 years, a slight increase from 43.5 years in 2002.
0
50%
25%
Stayed0%
25%
78.1% 75.3%
Left
21.9% 24.7%
50%
75%
100%
2001 to 2006 2006 to 2011
10%
20%
30%
40%
50%
% More than20 years
% More than25 years
% More than30 years
0
33%29%
25%
13%20%
14%
4% 5% 8%
January 1, 2002 January 1, 2007 January 1, 2012
15-24
4%
25-34
22%
35-44
26%
45-54
31%
55+
17%
0
20
10
2002
14.4
2007
13.812.5
2012
City Clerks 90.5%53.8%
90.5%75.0%
81.9%86.3%
55.1%68.8%
71.3%80.4%
67.4%
City ManagerCity Solicitor
Community ServicesCorporate Services
FireHuman Resources
Infrastructure ServicesUtility Services
PoliceBoards
20% 40% 60% 80% 100%0%
City Clerks 45%35%
29%30%
41%22%
17%26%
29%25%
33%
City ManagerCity Solicitor
Community ServicesCorporate Services
FireHuman Resources
Infrastructure ServicesUtility Services
PoliceBoards
10% 20% 30% 40% 50%0%
Non-eligible72%
Eligible in next 5 years28%

Current Workforce Benchmarks | City of Saskatoon Workforce Futures
31
Retirement Eligibility
In the next five years (2012-2016), 28% of the City’s permanent workforce will be eligible for unreduced retirement, including 16% who are eligible to retire in 2012.
Employees Eligible for Retirement
Source: City of Saskatoon Human Resources Department
The retirement situation the City is currently facing is similar to the situation in other Canadian cities and in the public sector in general. For example, in the federal public service, over 25% of their workforce will be eligible to retire in 2012; and 27% of the City of Toronto’s permanent employees will be eligible to retire by the end of 2015. (Source: City of Toronto Council Briefing, Transition to 2010-2014 Term)
According to Statistics Canada, public service sector workers tend to be older and to retire younger than private sector workers.
Which Departments are Most Affected?
All of the City’s departments are, or will soon be, dealing with increasing retirement rates.
Percentage of Employees by Department Eligible to Retire in the Next 5 Years
Source: City of Saskatoon Human Resources Department
The challenge is most pronounced in Corporate Services, where 41% of employees will be eligible for retirement in the next five years, with 26% being eligible in 2012.
Retirement eligibility is also high in City Clerks and Community Services: 45% and 30% of employees, respectively, are eligible to retire by 2016 (30% and 17%, respectively, in 2012).
33% of Boards employees and 29% of Infrastructure Services employees are eligible to retire by 2016.
0
50%
25%
Stayed0%
25%
78.1% 75.3%
Left
21.9% 24.7%
50%
75%
100%
2001 to 2006 2006 to 2011
10%
20%
30%
40%
50%
% More than20 years
% More than25 years
% More than30 years
0
33%29%
25%
13%20%
14%
4% 5% 8%
January 1, 2002 January 1, 2007 January 1, 2012
15-24
4%
25-34
22%
35-44
26%
45-54
31%
55+
17%
0
20
10
2002
14.4
2007
13.812.5
2012
City Clerks 90.5%53.8%
90.5%75.0%
81.9%86.3%
55.1%68.8%
71.3%80.4%
67.4%
City ManagerCity Solicitor
Community ServicesCorporate Services
FireHuman Resources
Infrastructure ServicesUtility Services
PoliceBoards
20% 40% 60% 80% 100%0%
City Clerks 45%35%
29%30%
41%22%
17%26%
29%25%
33%
City ManagerCity Solicitor
Community ServicesCorporate Services
FireHuman Resources
Infrastructure ServicesUtility Services
PoliceBoards
10% 20% 30% 40% 50%0%
Non-eligible72%
Eligible in next 5 years28%
0
50%
25%
Stayed0%
25%
78.1% 75.3%
Left
21.9% 24.7%
50%
75%
100%
2001 to 2006 2006 to 2011
10%
20%
30%
40%
50%
% More than20 years
% More than25 years
% More than30 years
0
33%29%
25%
13%20%
14%
4% 5% 8%
January 1, 2002 January 1, 2007 January 1, 2012
15-24
4%
25-34
22%
35-44
26%
45-54
31%
55+
17%
0
20
10
2002
14.4
2007
13.812.5
2012
City Clerks 90.5%53.8%
90.5%75.0%
81.9%86.3%
55.1%68.8%
71.3%80.4%
67.4%
City ManagerCity Solicitor
Community ServicesCorporate Services
FireHuman Resources
Infrastructure ServicesUtility Services
PoliceBoards
20% 40% 60% 80% 100%0%
City Clerks 45%35%
29%30%
41%22%
17%26%
29%25%
33%
City ManagerCity Solicitor
Community ServicesCorporate Services
FireHuman Resources
Infrastructure ServicesUtility Services
PoliceBoards
10% 20% 30% 40% 50%0%
Non-eligible72%
Eligible in next 5 years28%
“When employees retire, it results in a cascade effect
and potentially a period of instability because when
one employee leaves, it is not just a vacated position
that needs to be staffed, but many of the feeder
positions down the line. It is not just a simple matter of a one-to-one replacement
because it involves consequences for training,
knowledge transfer and human resources
management.”
- Federal Public Service
Retirements: Trends in
the New Millennium,
Statistics Canada

Current Workforce Benchmarks | City of Saskatoon Workforce Futures
32
Summary of Benchmarks
The current workforce benchmarks provided in this section, tell us our current state. This information provides important drivers for the development of our workforce strategies. The following summary of our current conditions will serve to lay the foundation and be the critical driver of our strategic priorities for workforce planning.
Turnover and Retention
Finding – The City’s five year retention index is in line with Saskatchewan comparatives while turnover rate is moderate.
Action – With the increasing number of retirements and new generation workforce entrants, this trend is not expected to remain stable over the next five years. Identifying how to attract and retain a skilled workforce is critical to the City’s success.
Employment Equity
Finding – Progress is being made in all areas of employment equity. There is more work to be done in the employment of Ab-original people and persons with disabilities.
Action – In light of looming labour shortages, we must develop proactive strategies to tap into the diverse labour pool available in Saskatchewan, while ensuring that we have an inclusive workplace that is representative of the community in which we live.
Age
Finding – While we are on par with the national average, we have an aging work-force in critical roles that has tremendous experience and knowledge that must be preserved.
Action – An aging workforce that may not be replaced at the same rate creates a need for a focused succession planning strategy for these critical roles.
Retirement
Finding – Some City departments are more significantly impacted by the retirement eligibility than are others.
Action – There is an increasing risk of losing corporate memory. We must target strategies to address the upcoming gaps that may result in potential loss of knowledge and skills in these areas.
Absenteeism
Finding – The City’s rate is lower than the national average, however there is concern regarding the cost of absenteeism to the organization.
Action – Our goals will be achieved through a stable and productive workforce. Strategies to engage and retain a productive workforce are essential to our success.
City of Saskatoon Workforce
Finding – We are currently experiencing growth in our workforce, and we predict even more in the future.
Action – As pressures to recruit and retain a competent and well trained workforce continue to rise, we must develop pro-active strategies to meet the demands of our growing city.

Strategic Priorities

Strategic Priorities
34
The Workforce Futures strategic priorities were developed using input
collected from in-depth interviews with City of Saskatoon senior
managers and branch managers. Their perceptions were analyzed within
the context of Saskatoon’s current and projected workforce needs –
not only as they pertain to the City, but also as they pertain to the wider
census metropolitan area. This will help ensure the City’s workforce
planning strategy and the resulting priorities are developed in context
of the broader labour market, and responsive to its evolving trends.
Analyzing data received from interviews and in conjunction with
leading human resource practices, the following five strategic
workforce planning priorities were identified:
I. Attraction, Selection and Retention
II. Inclusive Workforce
III. Multi-Generational Workforce
IV. Talent Development
V. Technology and Innovation

Strategic Priorities | City of Saskatoon Workforce Futures
35
Strategic Plan 2012-2022 Workforce Futures 2013-2016
Continuous Improvement – Strategies for the Long Term (10 yrs) Strategic PrioritiesCreate and encourage a workplace culture of continuous improvement that encourages innovation and forward-thinking.
Technology and Innovation
Offer long term careers with desirable benefits. Attraction, Selection and Retention
Offer an inclusive workplace that embraces diverse backgrounds. Inclusive Workforce
Make health and safety a top priority in all that we do.Attraction, Selection and Retention Talent Development
Provide ongoing skills training and professional development opportunities for staff.
Talent Development Multi-Generational Workforce
Increase productivity by being more efficient in the way we do business. Technology and Innovation
Leverage technology and emerging trends to reach our goals, serve citizens and connect meaningfully with our stakeholders.
Technology and Innovation Multi-Generational Workforce
Continuous Improvement – Priorities for this Term (4 yrs) Strategic Priorities
Build a workplace culture that offers opportunities for career development, work-life balance and employee recognition.
Attraction, Selection and Retention Multi-Generational Workforce Talent Development
Develop and monitor a recruitment and retention strategy that attracts the best available talent and retains new employees over the long term.
Attraction, Selection and Retention Talent Development
Identify targeted opportunities to implement specific continuous improvement tools within departments.
Technology and Innovation
Workforce Futures Link to Strategic Plan
The Strategic Goal of A Culture of Continuous Improvement has been identified by City Council in order to realize our vision and a ccomplish our mission over the next ten years.
To ensure all critical aspects of our workforce challenges were fully addressed and using the feedback from conversations with senior and operational managers, five key inter-related strategic priorities were identified as Workforce Futures links directly to the Corporate Strategic Plan.
Workforce Futures Strategic Priorities were designed to support achievement of our Strategic Goal of A Culture of Continuous Improvement.

36
Perhaps one of the biggest challenges facing public sector employers today is the competition for talent. While private sector employers have been developing innovative, aggressive strategies to attract, recruit and retain a new generation work-force, public sector employers, municipalities included, have lagged behind. This may be the result of a long-standing view of the public sector as a highly-desired employer due to superior job security and benefits packages.
But a generational shift is changing the way potential employees look at employers. Baby Boomers, Generation X and Generation Y, all have different values, expectations and requirements of their work-life. With a wave of baby boomer retirements looming, and an ever revolving workforce, public and private sector organiza-tions are competing to recruit talent to their teams.
The City of Saskatoon, and the community, has benefited from the ability to attract top talent in past years. To ensure the City remains a highly-desired employer, the workforce planning strategy must focus on three areas.
Attraction, Selection and RetentionI.

Attraction, Selection and Retention | City of Saskatoon Workforce Futures
37
Attraction
It is imperative that the City be pro-active in implementing strategies that will ensure our ability to continue to attract top talent. We must become a competitive player, with a focus on advertising our individual lines of business.
The City’s many business lines offer a broad range of career opportunities; it is time to capitalize on this diversity when competing with other employers in similar lines of business.
Advertising and Branding
Branding the City of Saskatoon as an employer of choice would be an important attraction initiative. We can do much more to promote our competitive edge, such as highlighting the ability for career-pathing within the organization, advertising our attractive benefits package, promoting a culture of continuous improvement and building stronger partnerships with educational institutions to attract their top graduates.
Saskatoon has been growing faster than any other major city in Canada. We must take full advantage of this growth to attract talent to our city or to attract more employees from the increasingly diverse talent pool. We have made some progress in attracting talent from the growing young Aboriginal population; however, initiatives that further promote pre-employment readiness will strengthen recruitment success within this talent pool.
Social media is a tool the City of Saskatoon can use to improve its brand. More and more employers are proactively using blogs,
wikis, micro-blogs, social networking sites (e.g. Facebook, Twitter, YouTube), video and photo sharing websites, forums, message boards and other user-generated content to reach out to potential qualified candidates – not just locally but around the world.
Global Recruitment
Similar to other employers in Saskatchewan, the City faces a shortage of qualified skilled trades workers. The provincial and federal government have instituted programs in response to these shortages that enable the employers to tap into the global market to bring workers to Canada from abroad. The City must develop initiatives that enable us to leverage these programs to fill the gaps in skilled trades shortages.
In addition, the provincial government has clearly articulated a three pillar approach to addressing the labour force shortages and one that we feel is very relevant to the City of Saskatoon’s approach to addressing these labour gaps:
Pre-employment training and education for Aboriginal youth
Inter/intra-provincial migration to Saskatoon
International immigration

Attraction, Selection and Retention | City of Saskatoon Workforce Futures
38
Selection
Research shows that the Canadian labour market is on the verge of a dramatic transformation, one that will redefine how organizations hire and how individuals find their next job. A generational shift is happening in workplaces across the country, for the first time in modern history, four distinct generations (Matures, Baby Boomers, Generation X, Generation Y) are working together. This is changing the nature of the workforce such that a market formerly controlled by employers is increasingly controlled by potential employees.
Competency Based Hiring
The City of Saskatoon will benefit from a competency framework to guide hiring decisions. The current approach to recruitment is to (a) screen appropriate applicants based on a paper resume, (b) conduct an interview and (c) assess the best candidate based on the match with job qualifications and duties. This traditional process has worked adequately in the past, but the lack of a competency framework means the specific competencies for the position have not been defined. This significantly impacts the accuracy of the selection process.
Many large organizations, including municipalities, are establishing core competencies for their organization and developing specific technical competencies according to job category. This leads to competency-based job descriptions, which serve as the foundation for the selection process.
Applicant Tracking System (ATS)
Leading employment practices include the tracking of employment trends, potential applicant pools and forms of successful advertising through web-based applicant tracking software. In addition to eliminating administrative redundancies and reducing printing costs substantially, an ATS will aid in providing the organization with a formal talent pool. Talent pools represent a skills inventory of current employees and potential external candidates who have shown an interest at some point in employment with the City. This is a critical aspect of a talent management strategy that can enable an organization to evaluate the success of our branding as well as conduct passive recruitment for hard to fill positions.
Retention
As identified in the 2009 Report on Service, Savings and Sustain-ability for the City of Saskatoon, “consensus thinking is clear in that cities must change to remain competitive and ultimately successful in addressing the list of existing and emerging issues.” The City of Saskatoon is striving to build a culture of innovation and creativity in which “staff are willing to take on new challenges with new approaches, and new strategies with enthusiastic energy and drive” (SSS Report 2009). In order to foster such a culture, the City of Saskatoon will need to coach, engage, empower and recognize employees as a means of ensuring retention. At the same time, we must embrace healthy turnover as an opportunity for internal progressions while welcoming a new pool of talent to lead the organization into the future.
“Work in partnership with education institutions for co-op and practicum opportunities. We can tie educational institutions to our business needs.”
- City of Saskatoon
Senior Manager,
Workforce Strategy
Taskforce Interviews

Attraction, Selection and Retention | City of Saskatoon Workforce Futures
39
New Employment Engagement
Engaging new employees helps them become full contributors to the organization by acquiring the necessary knowledge, skills and behaviours. Several socialization techniques are used by leading employers to onboard new employees resulting in higher job satisfaction, better job performance, and a greater understanding of role alignment to organizational objectives.
The City must develop a pro-active New Employee Engagement Program to ensure that our workforce is engaged and understands how their roles support organizational strategy. At the same time, we need to ensure time is built into supervisors’ and managers’ work plans to enable them to be successful at onboarding their new staff.
Total Rewards Strategy
Leading employers today leverage both the concept of total rewards as well as its individual elements to attract and retain top talent. Job seekers of the new generation are looking for rewards they value in return for the time, talent, effort and results they can offer to their potential employers.
Total rewards is a very powerful tool used for building a distinctive employment brand, as well as triggering behaviours that achieve high performance. An effective Total Rewards Strategy aims to feature five main elements. Each of these elements is made up of programs, practices and philosophies that collectively aim to attract and retain top talent:
1. Compensation
2. Benefits
3. Flexible Workplace
4. Career Development
5. Rewards and Recognition
According to a Workopolis survey,
the top five triggers that make employees
consider leaving an organization are:
1. Wanting a better work environment
2. Not feeling valued
3. Wanting a better benefits package
4. Wanting better work-life balance
5. Looking for more career opportunities
- Workopolis Job Seeker Survey,
2010, conducted by
Northstar Research

Attraction, Selection and Retention | City of Saskatoon Workforce Futures
40
1. Compensation
In line with a corporate pay philosophy, compensation practices should support business strategy while enabling external competitiveness. Programs should be consistent throughout the entire organization and communicated at all levels to ensure clarity. The philosophy should echo the organization’s commitment on how it values employees and supports it’s brand in being an employer of choice.
2. Benefits
Cash compensation received by employees is typically supplemented by benefit programs. These benefit programs offer security to employees and their families and, although not always paid in cash, are considered to be a very tangible advantage to employees. Examples may include:
Healthcare Benefits
Short Term/Long Term Disability Benefits
Pension Plan
Life Insurance
3. Flexible Workplace
Employers recognize that at different life stages, employees may seek to balance their work and outside interests (e.g. study, family, community involvement) by using flexible work practices. They also recognize that over an individual’s career those interests may vary, and the type of flexibility desired may also vary. Accommodating an employee’s need for flexibility, subject to reasonable business needs, is becoming the norm. Examples may include:
Flexible Work Options
Voluntary Furloughs
Reduced Work Weeks
Tele-work/Virtual Offices
Attraction, Selection and Retention | City of Saskatoon Workforce Futures
41
4. Career Development
Training and development opportunities enhance employees’ skills and competencies. Employees who have the opportunities for professional and personal growth, feel engaged and motivated to advance within the organization. This also enables employers to plan for the advancement of talented employees into leadership roles within the organization. Aligning employee goals with organizational goals will help build a strategically aligned workforce. Examples of career development inventory may include:
Tuition Reimbursement
Leadership Training
Mentorships and Succession Planning
Career Pathways
5. Rewards and Recognition
In a rapidly changing job market, attractive compensation packages alone are not enough to retain a productive workforce. Today, over 97% of employers offer some sort of rewards and recognition program. The federal government defines recognition as “honouring, encouraging and supporting individuals and teams who contribute, through their behaviour and their actions, to the success of the organization. Recogni-tion involves openly giving praise, granting monetary and non-monetary awards, and celebrating and communicating successes.” Successful Rewards and Recognition Programs
acknowledge employee contributions immediately, reinforce desired behaviours, and support business strategy, leading to organizational success. Examples may include:
Peer Recognition Awards
Corporate Recognition Programs
Exceeding Performance Awards
Employee Innovation Programs
In summary, the five elements within the Total Rewards Strategy represent what is most valued by employees in an employment relationship. The City will benefit from consolidating its existing rewards and benefits in the form of a total rewards inventory. Further, an integrated Total Rewards Strategy must be adopted, to ensure the retention of valued contributors to organizational success for as long as is mutually beneficial.
Employee Engagement and Satisfaction
Increasing competition for talent requires the City of Saskatoon to develop ongoing strategies to address retention. Many public sector employers are facing the same challenge. In order to provide successful, objective methods to increase retention, the City needs to understand the sources of employee engagement and satisfaction. Employee surveys are an invaluable tool in under-standing these sources, and for measuring the effectiveness of current programs being delivered.
“ The Conference Board of Canada study, Making it
Meaningful: Recognizing and Rewarding Employees
in Canadian Organizations, found that the average
annual amount spent on recognition is $175 per
employee. Public sector organizations average
$123 in expenditure per employee; those in the
private sector spend $208 on average.”
- http://ca.finance.yahoo.com/
news/MAKE -REWARDS-AND-
RECOGNITION-cnw -3578573674.
html?x=0

Attraction, Selection and Retention | City of Saskatoon Workforce Futures
42
Strategic Priority I – Attraction, Selection and Retention
Action Outcome
Attraction Adopt an Advertising and Branding Strategy that promotes consistency,
accessibility and prominently features the City as a preferred employer within the local, national and global community.
Develop a Global Recruitment Strategy to help fill gaps in skilled trades shortages by making use of the Provincial and Federal programs, while keeping with the provincial government’s three pillar approach to addressing labour force shortages.
The City is recognized as one of the top most engaging employers in Canada and offers the most desirable career choices for local and global talent pools.
Success Indicators:
Response rate for competitions Source for hire
Selection Implement Competency Based Hiring Practices for all professional
positions in the City. Provide an attractive and user-friendly Applicant Tracking System
that provides a database of internal and external applicants and enables efficient screening, selection and management of the intellectual capital available to the City.
The City hires the most qualified and suitable candidates through a credible competency based selection process. All new hires exhibit the required core competencies that are congruent with and enable the City’s strategic direction.
Success Indicators:
Workforce percentages by generational group
Retention Offer a comprehensive New Employee Engagement Program that
provides employees with role clarity while demonstrating congruency with corporate strategic goals.
Adopt an integrated Total Rewards Strategy that is comprehensive of its five elements and includes programs, practices and philosophies that collectively aim to attract and retain top talent.
Conduct Employee Engagement and Satisfaction Surveys which are used to continuously improve employee practices.
The City is an employer of choice that retains an engaged workforce in desirable careers while offering a dynamic work culture, flexible work options, personal and professional development opportunities and attractive compensation.The City’s employment practices reflect action on valuable employee feedback while embracing a culture of recognition and strategically linking it with the organization’s direction and priorities.
Success Indicators:
Retention index Employee satisfaction and engagement levels
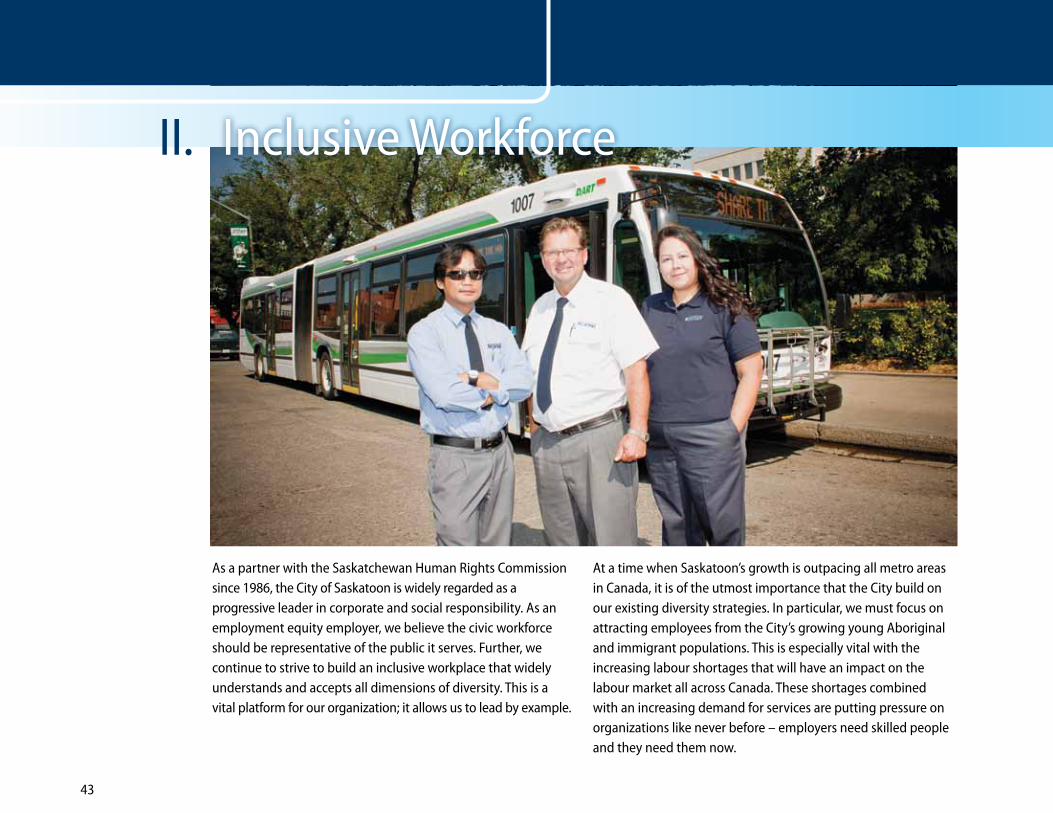
43
As a partner with the Saskatchewan Human Rights Commission since 1986, the City of Saskatoon is widely regarded as a progressive leader in corporate and social responsibility. As an employment equity employer, we believe the civic workforce should be representative of the public it serves. Further, we continue to strive to build an inclusive workplace that widely understands and accepts all dimensions of diversity. This is a vital platform for our organization; it allows us to lead by example.
At a time when Saskatoon’s growth is outpacing all metro areas in Canada, it is of the utmost importance that the City build on our existing diversity strategies. In particular, we must focus on attracting employees from the City’s growing young Aboriginal and immigrant populations. This is especially vital with the increasing labour shortages that will have an impact on the labour market all across Canada. These shortages combined with an increasing demand for services are putting pressure on organizations like never before – employers need skilled people and they need them now.
Inclusive WorkforceII.

Inclusive Workforce | City of Saskatoon Workforce Futures
44
The City partners with over 50 local networks and organizations to reach diverse populations across the province. While it is important to retain, strengthen and build on these relationships, input from interviews and discussions with City managers has also underscored the importance of expanding our networks beyond Saskatchewan. Across all employee groups, we recognize the need for equipping, supporting and building awareness around the value of an inclusive workforce. This will enhance the City’s ability to attract and retain a diverse people from all over the world.
Diversity and Inclusion Strategy
On a broader scale, the City, as a leading employer, must continue to strive towards the goal of removing internal barriers to employment.
This can be achieved through various means, including:
Outreach recruitment programs
Recognizing foreign credentials
Establishing workplace inclusiveness committees
Evaluating existing and new programs
“Canada stands to gain $4.1 billion to $5.9 billion annually from improving it’s system of learning recognition and promoting learning recognition.” (Source: Brain Gain - The Economic Benefits of Recognizing Learning
and Learning Credentials in Canada, The Conference Board of Canada)
It is therefore critical for the City, as an employer, to strive to close the gap in getting foreign credentials assessed for new immigrants. It is vital that the City communicate its Diversity and Inclusion Strategy through our website and other social media and deliver intercultural and inclusion awareness, specifically striving to develop cultural competence, through successful learning models.
Saskatoon’s growth is creating unique challenges for all of the City’s business lines. Expectations on infrastructure and services are increasing, seemingly exponentially, which increases the demands on City employees at all levels. In order to continue providing a high standard of service, the City must attract and retain skilled employees. In a highly competitive labour market, a pro-active Diversity and Inclusion Strategy, together with a Business Case for Inclusion may provide the best answer to the City’s workforce challenges.
Aboriginal Employment
A challenge for many employers in Saskatoon, including the City, is the attraction and retention of young Aboriginal people. This is the fastest growing population in the province, yet it continues to have the lowest employment rate. Employers must devise creative solutions to address the challenges many people of Aboriginal ancestry face in entering the workforce.
A major issue is educational attainment. According to 2006 statistics, the proportion of Aboriginal 25-54 year olds without a high school certificate was almost three times the proportion
Inclusive Workforce“ At a municipal level, social inclusion includes such issues as citizen participation in government, accessibility for persons with disabilities, acceptance and settlement of immigrants and newcomers, inequality, and protection of vulnerable groups.”
- Inclusion Policy in Canadian
Municipalities: The Importance of
Inclusion, Public Sector Digest

45
of non-Aboriginal people in both Saskatchewan and Canada. To address this, larger organizations have started to pro-actively develop programs, in concert with educational institutions, to assist potential Aboriginal employees in becoming workplace-ready. The City has participated in programs such as the Heavy Equipment Operator Pre-employment Training Program and has been successful in attracting these graduates to our workforce. We can play a more active role in such initiatives, either as a partner or as a continuous supporter.
The City plays a lead role in ensuring Aboriginal youth are engaged in the community and successful at finding gainful employment. An Aboriginal Employment Strategy focusing on attraction, selection, progression and retention of Aboriginal people must be devised to ensure the City is proactively responding to this growth while supporting operational demands. At the same time, we must ensure that new Aboriginal employees feel welcomed, valued and respected within the workplace.
Inclusion Awareness and Business Case for Inclusion
Understanding the historical and social aspects of Saskatoon’s community can help the corporation develop a context relevant to our people. This context forms a foundation for understanding and can break down barriers – especially culturally based barriers. It is therefore essential to attain an organizational culture that is rich with diversity and inclusion awareness.
This can be done through providing successful intercultural models of learning and adaptation that build capacity for cultural competence within our organization.
Organizations leading in diversity and inclusion best practices have developed a business case for inclusion. They are expanding their recruitment efforts globally and working to recognize international qualifications and credentials by: hiring employees through various provincial and federal immigration programs, providing pre-employment training programs, and apprenticeship and internship opportunities to attract top talent at every level. In recognizing the economic value of inclusion, employers are thinking outside the box when implementing strategies to attract and retain.
In conclusion, demand for skilled labour is turning the spotlight on this available talent pool, defined in Saskatchewan Human Rights Commission equity programs as people of Aboriginal ancestry, people with disabilities, visible minorities and women in underrepresented occupations. Equity employment is top-of-mind for many employers. It is not only proving to be highly successful for hiring, it is also allowing organizations to acquire their most valuable assets – people – and to build their intellectual capital.
“We need to define what diversity strategy is, [and] make this well
communicated so everyone is on board.”
- City of Saskatoon
Senior Manager,
from Workforce Strategy
Taskforce interviews
Inclusive Workforce | City of Saskatoon Workforce Futures
Canada’s BestDiversityEmployers 2012
Financial Group
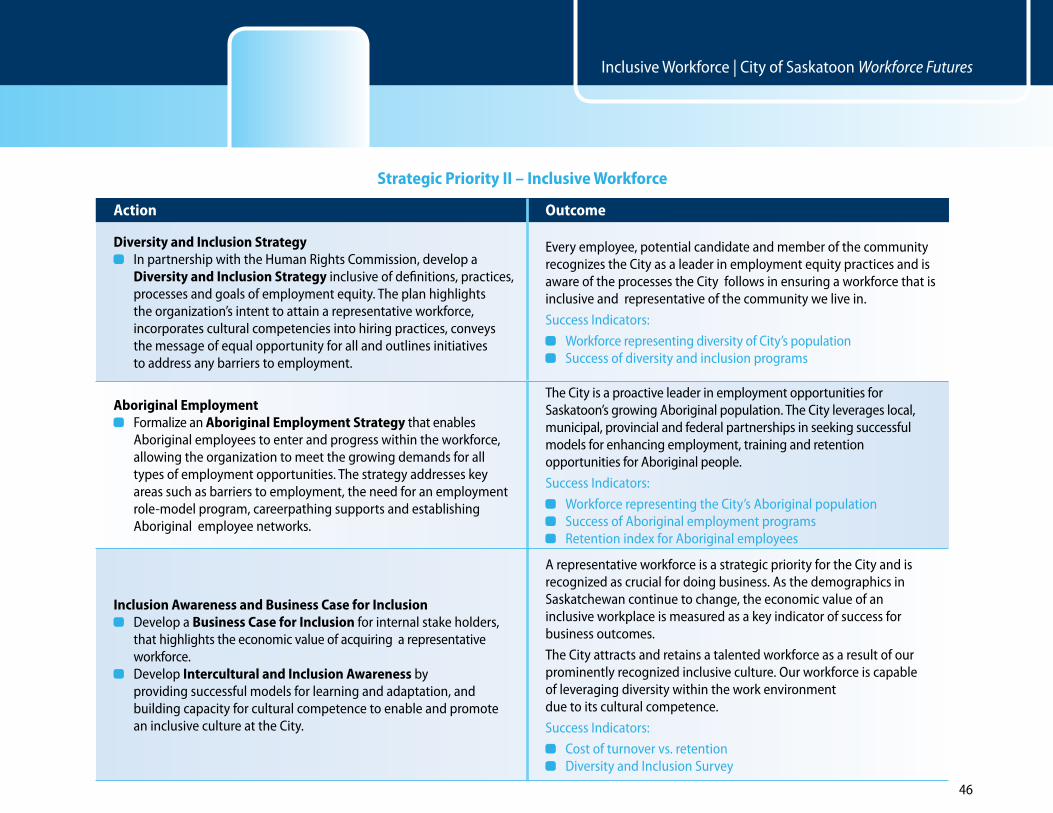
Inclusive Workforce | City of Saskatoon Workforce Futures
46
Strategic Priority II – Inclusive Workforce
Action Outcome
Diversity and Inclusion Strategy In partnership with the Human Rights Commission, develop a
Diversity and Inclusion Strategy inclusive of definitions, practices, processes and goals of employment equity. The plan highlights the organization’s intent to attain a representative workforce, incorporates cultural competencies into hiring practices, conveys the message of equal opportunity for all and outlines initiatives to address any barriers to employment.
Every employee, potential candidate and member of the community recognizes the City as a leader in employment equity practices and is aware of the processes the City follows in ensuring a workforce that is inclusive and representative of the community we live in.
Success Indicators:
Workforce representing diversity of City’s population Success of diversity and inclusion programs
Aboriginal Employment Formalize an Aboriginal Employment Strategy that enables
Aboriginal employees to enter and progress within the workforce, allowing the organization to meet the growing demands for all types of employment opportunities. The strategy addresses key areas such as barriers to employment, the need for an employment role-model program, careerpathing supports and establishing Aboriginal employee networks.
The City is a proactive leader in employment opportunities for Saskatoon’s growing Aboriginal population. The City leverages local, municipal, provincial and federal partnerships in seeking successful models for enhancing employment, training and retention opportunities for Aboriginal people.
Success Indicators:
Workforce representing the City’s Aboriginal population Success of Aboriginal employment programs Retention index for Aboriginal employees
Inclusion Awareness and Business Case for Inclusion Develop a Business Case for Inclusion for internal stake holders,
that highlights the economic value of acquiring a representative workforce.
Develop Intercultural and Inclusion Awareness by providing successful models for learning and adaptation, and building capacity for cultural competence to enable and promote an inclusive culture at the City.
A representative workforce is a strategic priority for the City and is recognized as crucial for doing business. As the demographics in Saskatchewan continue to change, the economic value of an inclusive workplace is measured as a key indicator of success for business outcomes.
The City attracts and retains a talented workforce as a result of our prominently recognized inclusive culture. Our workforce is capable of leveraging diversity within the work environment due to its cultural competence.
Success Indicators:
Cost of turnover vs. retention Diversity and Inclusion Survey

47
Baby Boomer retirements, a growing population of seniors, a shrinking population of younger workers – these demographic trends are not unique to Saskatoon; municipalities across Canada are struggling with similar challenges. More than a quarter of the City’s workforce is eligible to retire in the next five years. At the same time, we have a multi-generational workforce comprised of four different generations in the workplace; each with its own unique set of values and work ethic. This increases the importance of preserving corporate memory and offering other programs to help ensure a sustainable workforce. Senior managers believe a reasonable percentage of potential
retirees would be interested in prolonging their employment with the City if programs were available that allowed for knowledge transfer, mentorship and flexible work arrangements.
Over a quarter of the City’s workforce, 27% has been with the Corporation for more than 20 years. This is a large segment for any workforce, in any organization. It represents a wealth of experience, knowledge and skills. As the City’s workforce ages, more emphasis needs to be placed on keeping skills current within the workforce to ensure that positions are not stagnant but, rather, are adding optimum value to the organization.
Multi-Generational WorkforceIII.
“Knowledge transfer is a huge issue with
upcoming retirements.”
- City of Saskatoon
Senior Manager,
Workforce Strategy
Taskforce interviews
“ Research shows that organizations with an
integrated approach to succession management
have higher retention rates, increased employee
morale and an environment that stimulates innovation
and organizational change.”
- The Government Finance
Officers Association report
on Generational Change

Multi-Generational Workforce | City of Saskatoon Workforce Futures
48
Succession Planning
Effective succession planning enables identification of key positions and competencies within the organization and covers both actions necessary to transfer knowledge and critical leader-ship attributes needed to succeed in leadership roles. Succession planning is needed for all City departments, branches and units. Based on input from senior managers, it is clear that some understand the concept and have implemented a plan while others are unsure of the need or the process. There is pressure to fill positions as quickly as possible in order to avoid any interruption of service or business processes. However, change also provides the opportunity to critically review these position profiles before filling vacancies.
Managers must review the position and its role, with an eye to creating greater efficiencies or responding to changing Corporate needs. Proper succession planning would allow for the necessary time to conduct an analysis of the needs of the position, type of skills required, and develop potential internal candidates for the position well in advance of a vacancy.
Knowledge Transfer
Knowledge transfer seeks to organize, create, capture or distribute knowledge and ensure its availability for future employees. This is a guided process that identifies relevant knowledge and skills that reside within the organization’s employees, tools and tasks.
Although much of this knowledge is hard to articulate, leading organizations have developed programs that aim at retrieving and retaining such tacit knowledge. The City needs to begin by pro-actively developing knowledge transfer plans for positions to ensure a smooth transition of knowledge and skills from retirees to successors.
Mentorships
Mentorship programs aim at providing a mutual benefit for the mentor and the mentee. Mentors coach mentees by sharing their developed competencies to help align with and achieve desired objectives of the mentee. (This process supports succession planning, enables knowledge transfer and accomplishes employee engagement as the mentee works with the mentor to grow his or her skill set). Employees who have demonstrated excellent performance and have a desire to progress within the organization should have the opportunity to develop their skills by attaining a mentor, someone in a higher position to which they may aspire. A successful mentorship program must provide the necessary support for both the mentor and the mentee to reach the desired outcome.
Succession planning and knowledge transfer practices are critical initiatives for effectively managing a multi-generational workforce. These practices, coupled with opportunities for mentorship, will result in a retainable and engaged workforce.
Multi-Generational Workforce“ According to Statistics Canada, 2.95 million Canadians are now approaching retirement. And within the next ten to twenty years, another 4.4 million will follow. The baby boomers will start retiring in 2011, and there will be far fewer younger workers entering the workforce to make up for this exodus. This will present a significant hiring challenge across many sectors, as there are not enough people to fill the emptying full-time jobs, many of which are senior leadership or highly specialized positions.”
- Time for a New View of Job
Candidates, Workopolis, 2010

Multi-Generational Workforce | City of Saskatoon Workforce Futures
49
Strategic Priority III – Multi-Generational Workforce
Action Outcome
Succession Planning
Implement a Succession Planning Process that aids in identifying key management positions and competencies within the organization that are vulnerable to vacancies.
As the key positions become vacant, the City has the ability to fill them with the required leadership attributes.
Success Indicators:
Percentage of key positions identified and succession planned
Knowledge Transfer
Develop Knowledge Transfer Practices that preserve corporate memory, document processes, share specialized knowledge and expertise, implement cross-training plans, and provide other knowledge management and transfer mechanisms.
Successful transfer of knowledge is a priority for business sustainability.
Success Indicators:
Percentage of key positions identified and knowledge transferred
Mentorships
Develop an Executive Mentorship Program for staff who are looking to enhance their knowledge, skills and experience by being a mentee; through partnership with a mentor, who has the knowledge and skills being sought.
Mentoring is tied into learning and development plans for employees as well as succession planning. Employees feel engaged and well prepared to succeed within the organization.
Success Indicators:
Number of employees mentored for key positions
50
Like other employers, the City of Saskatoon is competing for talent in a rapidly changing market, one where current and projected labour shortages are impending. An employer that fosters continuous learning and growth is considered more likely to succeed in this market. As such, lifelong learning and talent development, together with opportunities for multi-faceted careers, are becoming the norm for successful organizations.
‘Talent development’ is an increasingly popular term. Having largely supplanted ‘training and development’, it encompasses a broader range: from traditional training and development to not-so-traditional career development, career management and
organizational development. An article on Wikipedia, widely quoted by Human Resources firms, highlights the essential difference between training and development and talent development this way:
“While talent development is reserved for the top management, it is becoming increasingly clear that career development is necessary for the retention of any employee, no matter what their level in the company. Research has shown that some type of career path is necessary for job satisfaction and hence job retention.” (Source: Time for a New View of Job Candidates, Workopolis)
Talent DevelopmentIV.

Talent Development | City of Saskatoon Workforce Futures
51
Talent development is the means through which the City can provide for efficient knowledge transfer (See Multi-Generational Workforce strategic priority).
Knowledge is a vital strategic asset. Faced with looming Baby Boomer retirements, the City needs to integrate knowledge transfer processes in its succession planning. Many organizations have implemented processes and systems to prepare people for new and different positions within the organization, whether through promotions or retirements.
Competency Framework
Competency Frameworks are critical to defining and measuring the effectiveness and performance of your workforce. Matching employee skills, behaviours, and attitudes to required core competencies leads to both individual satisfaction and corporate success.
The proposed Competency Framework provides a central focal point for all of the City’s people practices. By identifying core competencies the organization clearly articulates its performance and values. The job specific competencies give further clarity around expectations. The definition of these competencies provides specific direction for selection, succession planning and talent development.
Talent Management System
In interviews, the City’s managers recognize the need for talent development within their work groups, but also acknowledge
that support and resources have been limited. Management is seeking tools that allow them to effectively and efficiently manage their workforce capabilities and identify their top employees in order to ensure recognition and alignment of employee performance to City’s strategic priorities.
Regular feedback and personal development plans ensure employees understand expectations in terms of behaviour and work. Individual objectives need to be aligned with the City’s organizational objectives. These concerns underscore the need for a talent development strategy.
Leadership Development
In addition to the Professional Development Training (PDT) and the Management Development Program (MDP), the City must provide training to develop key skills and leadership attributes within new managers in order for them to succeed in becoming effective coaches and leaders. This program should specifically target the management skills needed to succeed within the City’s environment. Key Skills for Management Program (KSMP) will act as a precursor to support our existing leadership development programs. New managers and supervisors should all be trained in practices that ensure a supportive and nurturing environment to facilitate the success of all employees within the organization. This will not only prepare managers to succeed in future leader-ship roles within the organization but will also build a culture of accountability as a result of credible people practices.
According to a year long study involving 77 companies and almost
6000 managers and executives – the most
important resource over the next 20 years will be
talent: smart, sophisticated business people who are
technologically literate, globally astute and operationally agile.
And even as the demand for talent goes up,
the supply of it will be going down.
- The War For Talent
www.fastcompany.com

Talent Development | City of Saskatoon Workforce Futures
52
Strategic Priority IV – Talent Development
Action Outcome
Competency Framework
Design and implement a two-tiered Competency Framework that first outlines core behavioral competencies that are required for all employees. Secondly the framework identifies technical competencies (that means knowledge, skills and abilities) that are job specific. Together, these competencies aid in aligning employee performance with the City’s business strategies.
All professional job categories have core behavioral and knowledge/skill-based competencies defined. Selection, measurement and development are based on these competencies. Thereby developing a culture of accountability and superior performance at the City. The development is specifically targeted around the required competencies.
Success Indicators:
Consortium of skills and competencies available to the City of Saskatoon
Talent Development
Acquire a comprehensive Talent Management System that integrates a competency framework and aligns the goals of each individual employee to the strategic goals of the organization. (A system that enables the organization to identify and secure top talent while keeping the workforce more engaged by providing consistent and quality feedback to employees).
All employees receive thorough annual development plans, providing feedback on performance and update on annual progress. All employees recognize and acknowledge the core competencies required by the organization. They understand their personal objectives and how their actions are tied into strategic goals of the organization at any given time.
Success Indicators:
Percentage of employees participated in training per annum
Percentage of employees receiving annual development plans
Leadership Development
Develop a Key Skills for Management Program that trains new Supervisors and Managers on critical skills, knowledge, competencies, values and behaviors required to succeed in a leadership role within the City.
The City has an expanded talent pool of leaders who are well-trained and whose values are aligned with the strategic business priorities of the City.
Success Indicators:
Training penetration rate for management positions

53
“An innovative organization engages
everyone throughout the organization in the
task of developing and implementing new
ways to reach the organization’s goals.
And everyone indeed includes everyone,
from the chief executive to the frontline workers.”
- Creating an Innovative
Organization: Ten Hints for
Involving Frontline Workers
In today’s rapidly advancing digital climate, technology is a catalyst for business success. Public and private sector employees have adapted to significant technological advances over the past two decades. These changes will continue as new workforce entrants expect technology to shape their jobs, create efficiencies, support optimal performance and build a platform for innovation and creativity. But while technology allows employees to become engaged and take ownership of their work environment, it challenges employers to be more immediately responsive to employee and customer needs.
Technology
The role of technology in the workplace will continue to be paramount in defining work environments. Over the next decade it will, in fact, raise customer and employee expectations and play a vital role in successfully acquiring and retaining employees. Job seekers will look around to see what current and past employees are communicating about an organization through various social media. This kind of communication will reach thousands of potential employees and will, in turn, determine the calibre of the workforce attracted to the organization.
Technology and InnovationV.

Technology and Innovation | City of Saskatoon Workforce Futures
54
Current statistics illustrate the growing trend: in 2010, 51% of all job seekers used online job sites, 43% checked out company websites and 15% used online social networking sites. (Source: Time for a New View of Job Candidates, Workopolis)
Human Resources Information System
Organizations are realizing that investing in state of the art technologies provides important returns in the form of an efficient and productive workforce. While the speed of technological change is fierce, market demands are also unforgiving. Workforce entrants want access to the latest, most convenient tools and if they are not provided with such, they turn to competitors.
In response, many organizations (including municipalities) are taking an enterprise-wide approach to resource planning and designing systems that streamline the knowledge base across the organization. Paper forms are being replaced with real-time electronic records management and filing. As these changes evolve, traditional types of job duties will become obsolete and be replaced. Organizations in the service sector are becoming efficiency-centered and are incorporating practices (i.e. Lean and Six Sigma) to maximize customer value while minimizing waste.
Most City managers believe the Corporation’s existing technology adequately supports current processes, but feel it won’t be sufficient to support future needs. One area of significant interest is web-based capabilities for internal reporting on people statistics, such as attendance management and real-time access to department specific statistics, applicant tracking, talent management employee self service and manager self service.
A comprehensive Human Resources Information System (HRIS) would allow effective collection and analysis of data to inform strategic decisions at every level of the organization including:
Simplifying administrative tasks to enable HR roles to better align with the organization’s operations and strategy
Facilitating effective HR planning and metrics
Innovation
Creating an environment that enables employees to apply their creativity while trying twenty-first century approaches at work, provides a platform for employees’ professional growth and personal satisfaction. It begins when organizations create and communicate an explicit mission that gives their employees a reason to be innovative. This mission, when aligned with the everyday goals of frontline workers, reminds employees of their purpose.
An article on involving frontline workers in creating an innovative organization at Govleaders.org makes the point that, in an innovative organization, employees are given an opportunity to move around, to learn new jobs and provide feedback on efficiencies in areas where they may be a third party.
Technology and Innovation

55
“At the same time, not everyone in the organization is engaged daily in completely redesigning his or her job. Most of the people spend most of their time carrying out their job as defined by the last innovation. My point is that the task of creating better ways to achieve the organization’s purposes is not that of only a few people; this responsibility is in the job description of everyone.” (Source: Creating Innovative Organization: Ten Hints for Involving
Frontline Workers, at http://govleaders.org/behn_innovation.htm)
Incubate to Innovate
Making innovation everyone’s responsibility taps into the rich diversity of the City employees’ knowledge, experience and skills. The caveat is that innovation must directly help the organization achieve its mission or it is not an innovation – “Innovation only makes sense within the overall framework of the agency’s mission and goal.” (Source: Creating Innovative Organization: Ten Hints for Involving Frontline Workers,
at http://govleaders.org/behn_innovation.htm)
City managers believe a culture that nurtures innovation is necessary. They believe employees like to contribute and would be motivated if they saw their ideas developed and implemented. Middle and frontline managers must have the skills and always understand the “big picture” to be able to work with frontline workers in the pursuit of innovation.
In order to become an employer of choice, the City of Saskatoon must not only continue to embrace a culture of innovation and creativity; this must be visible to potential employees. Over the long term, enhancing our use of technology and creating a platform for innovation will allow the City to attract a motivated, engaged and competent workforce.
“Technology plays a leading role in innovation,
but it isn’t the only factor… Technology can be the
establishing base for innovation, but people are
the ones that drive it forward. Technology
is really only the mechanics of the process.
Real innovation is about great people
generating and then implementing new ideas”
- Egils Milbergs of Accelerating
Innovation on IBM’s Business
Leadership Forum, April 2006
Technology and Innovation | City of Saskatoon Workforce Futures

Technology and Innovation | City of Saskatoon Workforce Futures
56
Strategic Priority V – Technology and Innovation
Action Outcome
Technology
Acquire and implement a robust and comprehensive Human Resource Information System (HRIS) that allows for integrated and efficient, realtime employee and manager self-service capabilities and reporting.
As a strategic partner, the Human Resources Department provides value-adding and timely people measurements through an effective decision support system.
Success Indicators:
HR Balanced Scorecard
HR Service Effectiveness Survey
Processes for Continuous Improvement
Collaborate in the implementation of Continuous Improvement Processes at all levels of service to gain maximum value and output for the changing needs of our internal and external customers. By using fewer, more efficient resources and enabling zero waste, the City leverages its efficiencies to enhance its brand allowing sustainable attraction and retention of talent.
Due to its lean practices, the City is branded as an efficient, innovative, forwardthinking, technologically astute and desirable place of employment. City employees view all decisions related to resources and output with a lean lens, effectively driving business efficiencies.
Success Indicators:
Productivity gains or losses
Incubate to Innovate
Establish an Innovation Incubator Program that provides a safe platform and support system for employees to explore, develop and test new ideas that drive efficiencies while benefiting business objectives.
As a result of enabling optimal engagement and superior performance within our work culture, the City is recognized as a leader in innovation.
Success Indicators:
Number of successful and sustainable ideas pursued
Productivity gains resulting from the incubator

Next Steps

58
Workforce planning is not simply a human resource
issue; it is an inclusive process that directly relates
to every department, branch and unit. Strategic
planning, budget planning, program staff, program
management, service delivery, all are dependent
on the Corporation’s ability to recruit and retain the
right people, in the right jobs, at the right time.
Next Steps

Next Steps | City of Saskatoon Workforce Futures
59
Next Steps
The title of this report is aptly named, “Workforce Futures”. Our Future as a growing and thriving city is very much dependent upon our Workforce. Similar to many employers across the country, the City of Saskatoon has identified priorities that when addressed will help ensure the workforce is aligned to the City’s operational demands and strategic directions. It is important to note that work has already been initiated in some of these priority areas.
The Human Resources Department will continue to play a key role in promoting strategic workforce planning and in guiding the strategic actions towards the desired outcomes. It is imperative that managers and leaders integrate these workforce strategies into their annual strategic plan. Indeed, this report must serve as a catalyst for the entire organization in under-standing and supporting these five strategic priorities as a means of ensuring the City attains a culture of continuous improvement.
In summary, next steps include the following:
Provide opportunities for the City leaders to become knowledgeable of the workforce challenges at hand.
Prioritize the strategies and actions that have been identified.
Once prioritized develop detailed plans including resource requirements. Regular updates will be provided to ensure information is shared on what has been accomplished and any necessary shift in priorities subject to changing business or demographic needs.
In response to the Next Steps ask yourself and your teams the following questions when considering the five priorities:
Do these five priorities align with the corporate objectives of our organization?
How do the five priorities, if accomplished, offer strategic advantage in relation to your departmental goals and objectives?
Which of the priorities and action items have the greatest urgency for you and your department?

60
“ Let’s become ruthlessly goal oriented and endlessly flexible in how we get there.”
- Murray Totland, Fall Leadership Forum,
November 3rd, 2011
61
Brain Gain: The Economic Benefits of Recognizing Learning and Learning Credentials in Canada, The Conference Board of Canada, http://www. giantinsights.com/pdfs/brain_gain.pdf
Building Successful Organizations, U.S. Department of Health and Human Services, 1999, www.hhs.gov/ohr/workforce/wfpguide.html
City of Saskatoon 2011 Absenteeism Report
City of Saskatoon Employment Equity Report 2009-2010
City of Saskatoon Mayor’s Office Press Release, May 5, 2011
Community, Workforce and Quality of Life Indicators for Saskatchewan, Enterprise Saskatchewan, April 2010
Creating an Innovative Organization: Ten Hints for Involving Frontline Workers, http://govleaders.org/behn_innovation.htm
Culture in Transition, Youthography
Enterprise Saskatchewan, Economic Checklist, April 11, 2011 Evaluation of Transport Canada’s Awards and Recognition Program, Transport Canada, 2003
Fast Consulting, City of Saskatoon Recruitment Survey Report, May 2008
Federal Public Service Retirements: Trends in the New Millennium, Statistics Canada
Generational Change Task Force, Government Finance Officers Association Research Consulting Center 2010
Ray D. Bollman, Statistics Canada, “ The Rural Saskatchewan Landscape: Demographic Outlook for Rural Saskatchewan,” Presentation to the Saskatchewan in Transition Conference, Statistics Canada IPAC Regina Conference, March 12, 2003
‘Hidden’ Costs of Turnover Can Greatly Exceed Numerical Calculations, www. employeeretentionstrategies.com
Inclusion Policy in Canadian Municipalities: The Importance of Inclusion, Public Sector Digest
Recent Immigrants in Metropolitan Areas: Saskatoon – A Comparative Profile Based on the 2001 Census, Statistics Canada
Saskatchewan Immigrant Nominee Program (SINP), Citizenship and Immigration Canada, Facts and Figures 2009
Saskatchewan Public Service Commission 2009-2010 Annual Report
Saskatchewan Public Service Commission Plan for 2011-2012
Statistics Canada Labour Force Survey, April 2011
Statistics Canada Labour Market Issues in Saskatchewan: A Situational Analysis, Sask Trends Monitor, May 2009
Strategic Workforce Planning, County of Fairfax, Virginia
The City of Saskatoon and The Saskatoon Health Region Population Projections (2006-2026), June 2010
Time for a New View of Job Candidates, Workopolis, 2010
Transition to 2010-2014 Term, City of Toronto Council Briefing
Workforce Planning in Local Government, Municipal Association of Victoria, Australia
Your Next Move, Strategic Workforce Planning in Public Sector, Deloitte
ReferencesThe Workforce Strategy Taskforce reviewed numerous publications, books and workforce planning documents from other municipalities, both in Canada and abroad, as well as from other government levels and organizations.

62
Notes
