woodford case study
TRANSCRIPT


Case Study: Woodford Shale Source Rock Characterization by Geochemical
and SEM Evaluation in a Horizontal Well
Tom Arnold1, Andrew Sneddon1, Shang Wu2, Andrei Deev2 , Yongchun Tang 2,3
1. Paladin Geological Services, 13832 Santa Fe Crossing Dr., Edmond Ok 73013;
[email protected];[email protected] 2. Arrow Grand Corporation, 738 Arrow Grand Cir., Covina, Ca 91722;
[email protected]; [email protected] 3. Power Environmental Energy Research Institute, 738 Arrow Grand Cir., Covina, CA 91722;
Abstract
The benefits to hydrocarbon exploration from geochemical and SEM analysis have been known
for many years. Yet the advent of smaller, cheaper and more specialized equipment is now
providing the ability to make highly precise and critical measurements during the drilling process
rather than having to wait for weeks or even months to obtain the results. When this data is
coupled with standard surface logging techniques of gas and formation analysis, they provide
valuable information about the reservoir that will help with current production of the subject well
and future development planning.
For this case study, several instruments were used in a mobile laboratory during the drilling of a
Woodford horizontal well on cutting samples taken at regular intervals.
Rock Eval
GCIR II for Gas Isotopes (proprietary)
Niton XRF
Hitachi TM-3030 SEM
The Rock Eval Pyrolysis provided data on producible hydrocarbons, thermal maturity and total
organic content in each sample. The GCIR II analyzed the gas isotopes from both isotubes and
isojars yielding data on c1, c2 and c3 isotopes. This data provided insight into permeability, porosity
and provided information on hydrocarbon compartmentalization and differentiation from OBM.
XRF analysis was able to quantify the elemental composition of the cutting samples, providing an
understanding of the best locations to frac based on silica content, changes in mineral composition
and an indication of TOC. Petrographic analysis was done using the SEM. This instrument gave
direct observation of both microstructures and available pore space. In turn this data gave
corroboration to the previous geochemical and elemental analysis.

Introduction
Identifying the zone of highest production potential, especially while drilling, is a critical issue.
Even with good initial understanding of the target zone, geosteering the lateral in order to remain
within that interval is often challenging due to inadequate mineralogy, geochemical or petrologic
data. With the advent of new techniques, instrumentation and near real-time analysis, the
uncertainty that often arises can be greatly reduced.
By virtue of a unique and proprietary analysis of drill cutting’s for gas isotope analysis of C1,2,3,4
and CO2 over time provides a dynamic measurement of porosity, permeability, and overall
production potential of a given zone. This procedure provides important data concerning the
identification of compartmentalization from immediate measurements on fresh cuttings. This
process incorporates data from the analysis of both isotubes, unaltered gas samples, and isojars,
unaltered mud samples, each providing data that completes the picture of the hydrocarbon
potential from a given sample.
Another important advantage of this instrumentation and its associated procedures is its ability
to differentiate OBM from potential oil reserves. This reduces the possibility of sample
contamination interfering with results.
For a direct measurement of hydrocarbon potential from the rock, we incorporate the Rock
Eval machine. This pyrolysis instrument drives hydrocarbons from the drill cuttings at specific
stages based on temperature. Typical data such as S1, the amount of free hydrocarbon present in a
rock, and Total Organic Carbon can be measured directly. This provides an excellent measure of the
‘sweet spot’ while drilling.
X-Ray Fluorescence is another technique that will provide quantitative data on mineral
composition, rock hardness and hydrocarbon potential. Providing corroboration to the geochemical
analysis, the presence of vanadium in a sample correlates directly to TOC as seen by the Rock Eval
Pyrolysis. Here are a few additional valuable measurements that can be found from the
XRF(Weedmark et al.).
The relationship of sulfur to iron indicates the presence of pyrite in a
sample that could potentially reduce the presence of usable porosity.
The relationship of vanadium, molybdenum and manganese provides
evidence of the paleo-environment in which sediments were deposited.
Rock hardness, which relates directly to a rocks ability to be fractured, can
be assessed by examining the amount of silica and aluminum present.
The higher the amount of these two elements the easier it is to break the
rock; ie frackability.
Depositional sources can be identified; transgressive vs regressive cycles.

In carbonate facies, high concentrations of Potassium and Thorium are
produced by large transgressive events because of the deposition of
excessive amounts of aluminosilicate detritus. However large peaks of
Uranium indicate an extended subaerail exposure in which Uranium was
concentrated by groundwater.
Assist with correlation when biostratigraphic and lithostratigraphic markers
are absent
Distinguish carbonate facies changes: limestone vs dolomite.
Porosity is always a key element. Being able to directly measure it in a rock provides the linking
element for all the previous analytical tools. The Scanning Electron Microscope is the instrument of
choice for this. The SEM provides a means to measure and examine the pore space present. When
taken in real-time while drilling, the data provides a quick means to assist in locating the ‘sweetest
spot’ in a well. If we can determine from geochemistry that a zone has a given potential, the SEM
will identify if there is sufficient porosity present to make the zone a potential target.
Application of these instruments and procedures were provided on a horizontal Woodford play
well. This formation is well known for its hydrocarbon potential throughout Oklahoma. Although a
great deal of study has been given to the geologic setting and overall extent of the formation, there
is still much to be learned especially when looking at the formation from the perspective of a single
well.
Analysis
Samples were taken at regular intervals throughout the drilling process and subjected to a
specific regimen of preparation. For the Rock Eval, XRF and SEM, the following procedure was
followed:
1. Extracted and rinsed in Diesel (OBM), H2O (water-based) stored in plastic jars 2. Rinsed again with soap/water mixture (OBM), and water (water-based), removal of
diesel and any remaining LCM 3. Put into drying pans to dry 4. Weight samples:
-Rock Eval: .100 ± .05 mg into Crucibles -XRF: 7.00 ± .50 mg into container cups
Sample preparation for the GCIR Gas Isotope analyzer was different.
1. Samples were collected at specific depth into Isojars, filled with water +10 drops
Zephiran Chloride to prevent any bacteria
2. Specific injection volumes carefully measured and inserted in GCIR for analysis
In order to ensure the quality of the data provided, it is necessary to follow a consistent and
regulated process for each sample analyzed.
Rock Eval Pyrolysis
The data from the Rock Eval was used to identify specific areas where the best recoverable
hydrocarbon potential was present. These measurements are based on the results provided by
heating the rock sample during several stages of pyrolysis (McCarthy et al., 2011).
Stage 1 (S0): 0 to 90 C⁰ - hydrocarbons are released from bitumen followed
by the release of CO2 as the temperature rises
Stage 2 (S1): 90 to 300 C⁰ - free hydrocarbons are released without cracking
and represents the amount of hydrocarbon that can be thermally distilled
from one gram of sample
Stage 3 (S2): 300 to 600 C⁰ - these are residual hydrocarbons and represent
the amount of hydrocarbon a source rock might produce if maturation
continues
Stage 4 (S3): 300 to 600 C⁰- CO2 from the thermal cracking of kerogen
Note: All depths are in Measured Depth due to directional data being unavailable.
Figure 1 shows the results of the analysis for the entire well plotted against the gamma ray and
total gas. Results from S0, S1, S1/S2 ratio and TOC are displayed versus depth. The TOC is important
because hydrocarbon production is related to its carbon content (McCarthy et al., 2011). The
sensitivity of the S1/S2 ratio to hydrocarbons and TOC provide the primary indicators for these
zones of interest. An additional indicator is seen in Figure 2 where the data for the presence of
vanadium, gleaned from the XRF analysis, is plotted versus the S1/S2 ratio and TOC. This was used
to corroborate the results from the Rock Eval. (Examples of this correlation are circled on the Figure
2.)
Kerogen is a key indicator of hydrocarbon type and maturity. By determining TMax, maximum
temperature for the generation of hydrocarbons (McCarthy et al., 2011), from the Rock Eval and
plotting it versus TOC, we are able to determine Kerogen type (Dellisanti et al, 2010). This leads to
an understanding of thermal maturity and the type of hydrocarbon present within that interval.
Figure 3 plots all the values for TMax measured throughout the lateral. From this plot we can
clearly see those depths that are the most mature and have the greatest potential to yield
productive hydrocarbons. In addition, this plot defines those zones that will produce oil, gas and
condensate based on the Hydrocarbon Index.
Figure 4 plots the values of S1 versus TOC. A linear relationship is expected due to the fact that
all these samples were taken within the lateral of a horizontal well. Had this been a vertical well,
the plot would have appeared much different.
Figure 5 plots S2 versus TOC. This defines the oil prone type II & gas prone type III kerogen
content. This is typically the result of a marine depositional environment. Figure 6 defines the

Production Index. This is derived from the pyrolysis of the first and second stage and defined as
S1/(S1 + S2) (McCarthy et al., 2011). This ratio relates to the evolution of organic matter over time
being subjected to increased temperature and pressure. Consequently it relates to source rock
maturity. From this data the oil generation potential is defined. In addition, those values that fall
outside a given set of standards can be defined as contamination.
Figure 7 plots TOC versus depth. Understanding the amount of oil and gas potential within a
source rock is critical in its evaluation. This figure indicates the progression of carbon by weight
percent as the lateral is drilled. Clearly the concentration of carbon content increases as the
wellbore penetrates deeper into the Woodford. In addition this could indicate different
hydrocarbon compartments within the source rock.
Gas Isotopes
The examination of mud gas isotopes adds a much greater understanding of the source rock.
Here is a list of some of the characteristics that can be learned from this analysis.
(1) Permeability assessment: Methane carbon isotope data for both mud gas and gas released
from cuttings from the same depth were examined. Built on the work of Xia and Tang (2012), it
was found that the isotope difference between these two types of gases may indicate the
degree of gas recovery and thus the permeability of the formation (Arnold, et al. 2014).
(2) Well compartmentalization: high-resolution isotope data for C1, C2 and C3 are good
indicators for well compartment (Arnold, et al. 2014).
(3) “Isotope reversal” indicates high production rates. With maturity increasing, gas isotope
ratios increase, that is they become less negative. However, “isotope reversal” is found in some
gas fields, where C2 and C3 isotope ratios stop increasing with maturation, but begin to decline
drastically at certain maturity. Field data indicates that isotope reversal of C2 and C3 gas
isotopes may indicate the high production rates for such wells (Arnold, et al. 2014).
(4) Delineation of gas sources: gases from different sources have their own fingerprints (shale,
coal, biogenic, thermogenic, primary gas, secondary gas, etc). The accurate gas source
correlation is necessary for a better understanding of gas in place, quality and producibility
(Arnold, et al. 2014).
(5) Gas maturity and formation temperature: This is a classic use of isotopes. With increasing
maturity, gas isotopes increase (for example, methane δ13C may increase from -60 per mil to -
30 per mil with maturation (Arnold, et al. 2014); ( Luwen, 1983; Schoell, 1983).
(6) With gas generation from shale, the gas isotope ratios follow a certain trend. Therefore gas
accumulated at different time intervals should show different gas isotope ratios. We can thus
derive the “cumulative”, ratios seen over time, vs. the “instantaneous”, ratio seen at a single
given interval. This data can then be used to qualify porosity and permeability within a given

zone based on the length of time and amount of gas released. (Proprietary data GOR-Isotopes2
Software Group, HeoIsoChem Corporation) (Arnold, et al. 2014),
(7) Nano-porosity and permeability assessment: A proprietary method has been established to
evaluate the nano-porosity and permeability based on the isotope fractionation through gas
releasing from the rock matrix—the stage-wise degassing. The basic idea is to reconstruct the
isotope fractionation variation trend through degassing, which is related to the “easiness” for
the gas moving out of the rock matrix. The stage-wise degassing procedure can be joined with
the GCIR II to obtain real-time data on site (Arnold et al. 2014).
(8) Production decline: A proprietary and novel method has been developed to predict the
production decline in a shale gas well. The scientific fundamentals are similar to those of
permeability assessment, as gas isotope changes through production (Xia and Tang, 2012, GCA).
The method depends on the instrument we construct and develop (The natural gas isotope
analyzer, NGIA), and has been successfully deployed for field trial in Barnett Shale (Arnold, et al.
2014).
Figure 8 displays all isotube gas isotopes: iC1, iC2, iC3. The decreased amount of fluctuation
of the iC3 data is the result of a much heavier molecule and closely relates to the stability of the GCIR II.
The changes visible in iC1 over the depth range indicate hydrocarbons from different compartments
within the source rock.
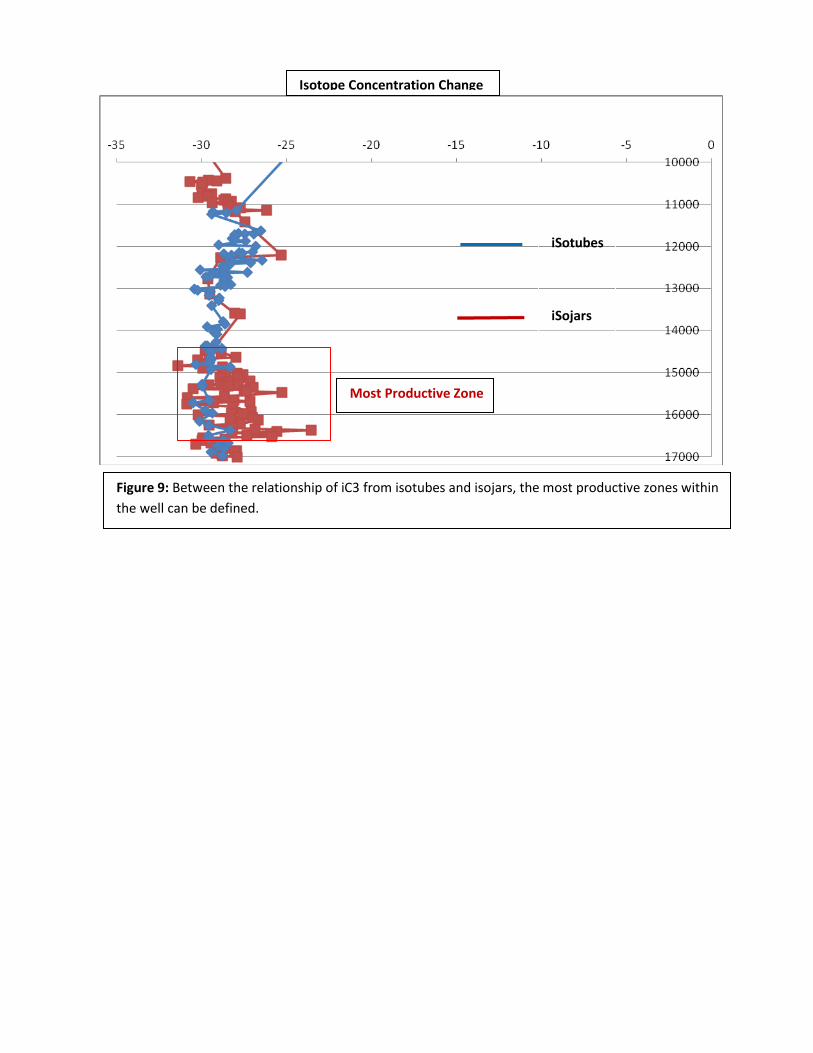
Figure 9 is a plot of isotubes versus isojars for iC3. This analysis provides an indication of
areas of maximum porosity. 14,600’ MD to 16,500’ MD appear to be the areas that are of greatest
promise.
In Figure 10 iC2 is plotted for both isotubes and isojars showing a smaller difference.
Figure 11 puts everything together for all the isotopes derived from both tubes and jars. A
large difference between Jars/Tubes and their dynamic change, over time, provides information on
porosity/permeability, underscored by the Jars’ concentration change. As seen previously, the 14,600’
MD to 16,500 MD zone appears to the area of greatest hydrocarbon production. All this data indicates
the potential for hydrocarbon recovery is high and especially favors liquids.
X-Ray Florescence
Figures 12 & 13 plot the elemental composition of all the rock samples collected. The increased
presence of silica is defined within several areas, marking zones where fracking would be much easier.
These areas range between 12,500’MD to about 14,000’MD. From 12,400’MD to 13,800’MD the values
of sulfur and iron are very high. This is would indicate an area with considerable pyrite which could
inhibit production. (A closer investigation with the SEM will be necessary to identify the degree of
degradation due to pyrite pore blockage.) The XRF analysis of vanadium indicates possible zones of
production that fall well within those areas prescribed from isotope analysis and Rock Eval. This level of
cross corroboration is important in developing a clear picture of those areas that are of particular
interest.
From all this data, we have found three zones that require greater investigation.
• Case A: 13,100 - 13,600
• Case B: 14,900 - 15,350
• Case C: 16,000 - 16,400
Scanning Electron Microscope
Figure 14 is an SEM image taken of a sample originating at 13,070’MD. The pyrite framboid seen
here is a good indication of the increased sulfur and iron content defined by the XRD. This image is at
2500X and represents an area of 30 micormeters across. The only porosity visible in this photo is intra-
granular within the pyrite. Production from this area would be challenging. The spectrogram seen in
Figure 15 shows the increased iron content in this sample, most likely from the pyrite present.
In Figure 16 taken from 13,430’MD, the porosity becomes clear as the amount of iron and sulfur
decrease. Here the porosity has increased to very good. The average pore size is 1.81 micrometers.
From the Rock Eval data we find that S1 has increased through this area indicating more free
hydrocarbons. Notice the increased calcium in the spectrogram seen in Figure 17. Obtained from the
XRF, this indicates the possibility of CaCO3 may be blocking pore throats or even present as calcite.
As an example of the second area of interest, Figure 18 taken from 15,050’ MD shows
considerable porosity. Numerous pores are present with an average size of 6.7 micrometers. (This is the
best visible porosity seen within the well.) Looking at the Rock Eval for S1 on Figure 4 at this depth, a
marked increase can be seen. The XRF spectrogram in Figure 19 shows significant decrease in both
calcium and iron thus removing the CaC03 and pyrite concern.
Our last area of concentration is represented by a sample taken at 16,130’ MD seen in Figure
20. There are an increasing number of large pores present with an average size of 2.43 micrometers.
Porosity appears very good.
When all the data is tabulated from the SEM analysis, we have provided two plots which
represent the porosity within the lateral. The first plot, seen in Figure 21, plots average pore size versus
depth. The second plot indicates the overall porosity quality. Figure 22 plots the quality estimate versus
depth. This value is a subjective analysis based on the ease of locating porosity in a sample, the size of
the pores found and number of pores present in the image. All this is analyzed under standard
magnification within a given area.
Conclusion
The combination of four techniques has provided an in-depth understanding of the hydrocarbon
potential of a Woodford well.
• GCIR tells C1-5+CO2 isotope & composition static (tube) & dynamics (cuttings in jars), relates to
gas & permeability
• Rock Eval tells S0,1,2, TOC (liquid and potential) of the cuttings at given depth
• XRF tells the mineral composition lithology, relates to frackability
• SEM gives direct visual characterization of porosity
Putting the mosaic of data together as we have presented here will help geologists to decide where
the hydrocarbons are located, which zones provide the greatest potential for production, where to frack
the well and reveal information about the reservoir for future development. This type of information
will allow producers to provide the maximum production from a well and reduce cost from unnecessary
drilling practices.

Biographical Sketch
Tom Arnold
Director of Training, Paladin Geological Services
13832 Santa Fe Crossing Dr.
Edmond, Ok 73013
(405) 463-3270
After developing one of the first micro-computer based EDR and
Pore Pressure detection systems used in the Gulf of Mexico in the late 1970s, he continued to
develop other real-time software applications for the drilling industry including remote satellite
data transmission. With investigation of both geochemical and petrologic techniques in addition to
the use of SEMs for sample analysis in the late 70’s and early 80’s, bringing advanced technology to
the rig site has always been a focus of his career. Later while working for The Superior Oil
Company, he introduced the integration of petrophysical and mudlog analysis for formation
evaluation, a technique that yielded immediate results in increasing petroleum production.
Working for Bariod/Sperry Sun, he developed software for both their surface logging and MWD
systems, one of the first systems to employ remote real-time logging. During the mid 1980s, Tom
created Drilling Data Systems in Plano, Texas to provide advanced logging systems and services to
the drilling industry. While CEO there, he was instrumental in the development and deployment of
Infra-Red gas detection into the logging industry, along with some of the other advanced
techniques listed in this paper. Now within the leadership team at Paladin Geological Services, his
focus is divided between training, advanced analytical techniques and founding the GEOGAP
petroleum training service and is the worldwide trainer in Geosteering for PetroSkills of Houston.
Tom has a BS degree in Geology and Astrophysics from the University of Texas Pan American.

Yongchun Tang
Director, GeoISoChem Corporation
738 Arrow Grand Cir., Covina, CA 91722
(626)858 5077
Dr. Tang is the director of GeoIsoChem Corporation. He was co-founder
of the Power Environmental and Energy Research (PEER) Center at Caltach, which became an
independent research institute (now the PEERI) in 2009. Dr. Tang has published over 100 papers.
His major research interests are applying molecular modeling and experimental simulation
techniques for geological problems. He pioneered the molecular modeling technique to many fields
of organic geochemistry, surface chemistry, reaction kinetics and organic and inorganic reactions
under subsurface geological processes, real-time gas isotope technology, double substitute
isotopes and in-situ measurement of CO2 and nano-porosity of rocks.
He served as consultant for many energy firms including Chevron, Shell, Exxon, BP,
Conocophillips, Petrobras (Brazil), Saudi Aramco, ENI-Agip (Italy), Total (France), Devon, Petrochina
and China Petroleum Corporation (Taiwan). Hs is cofounder for several startup companies in the
USA and abroad.
Sheng Wu
Chief Scientist 727 Arrow Grand Cir., Covina, CA 91722 (626)858 5077 [email protected]
Dr. Wu is the Chief Scientist and co-founder of ArrowGrand Technology Corporation. He and Dr. Andrei Deev invented the second generation Gas Chromatography Infrared (GC-IR2) system which gives 3 orders of magnitude sensitivity improvements to the current GC-IR system.
As a result, Dr. Wu serves on the committee of Nano and Quantum Sensing Conference of SPIE. The GC-Infrared Isotope Ratio spectrometer for compound specific carbon stable isotope, as described in this paper, is the first commercial product based on the GC-IR2 platform.

His major research interests are developing novel optical sensing technologies and laser sources for chemical sensing and analysis, material processing and biomedical applications. Dr. Wu received his double BS degrees in Chemistry and Physics from Peking University in 1992, received his master degree in Environmental Science and Engineering in 1994 and his PhD in Physical Chemistry in 1999 both from Caltech.
Andrei Deev
VP of Research and Development, ArrowGrand Technologies
727 Arrow Grand Circle, Covina, CA 91722
Andrei Deev worked as a researcher at Caltech where he developed
infer-red spectrometers for laboratory and field detection of
atmospheric trace gases and radicals. In 2009 Dr. Deev joined PEER
Institute as a scientist, where he was involved in laboratory simulation
of Thermochemical Sulfur Reduction in oil reservoirs, including the
pioneering experiments on compound-specific isotope analysis of sulfur
species. Dr. Deev also developed a field-deployable isotope analyzer
for methane in natural gas and participated in field studies of carbon
isotope ratio during gas production. Currently, Dr. Deev is VP of R&D
at ArrowGrand Technologies, where he works on development of
field-deployable compound-specific isotope analyzers. Andrei received
MS
in Physics from Moscow Institute of Physics and Technology and Ph.D. in
Physical Chemistry from California Institute of Technology.
Andrew Sneddon
Geologist- Project Geochemistry Technician, Paladin Geological
Services
13832 Santa Fe Crossing Dr.
Edmond, Ok 73013
(805) 680-7981

Andrew obtained his Bachelor’s degree in Geology from Portland State University in June of 2014. He
has completed two years of engineering courses at Oregon State University prior to pursuing his degree
in Geology. He worked a variety of projects during his time at Portland State including an EMP (Electron
Micro Probe) project to differentiate between two suspected same- source tuff flows using mineral
composition analysis as well as geological map and interpretation of an unmapped region in eastern
Oregon for his final senior project. Andrew joined Paladin in September 2014 and since has been the
primary lab technician in the Geochemistry department. He has been primarily responsible for data
collection, machine troubleshooting, data analysis and preparation.
References Cited
Arnold,T., Gao, L., Tang, Y, Advanced Techniques to Increase Production from Horizontal Wells and
Reservoirs, The Journal of the Oklahoma City Geological Society (Shale Shaker), July/August
2014, pp278-303
McCarthy, K., Niemann, M., Palmowski, D., Peters, K., Stankiewicz, A., (2011), Basic Petroleum
Geochemistry for Source Rock Evaluation, Oilfield Review Summer 2011: 23 no 2.
Dellisanti, F., Pini,G.A., Baudin, F., (2010), Use of Tmax As A Thermal Maturity Indicator in Organic
Successions and Comparison with Clay Mineral Evolution, Clay Minerals 2010: 45, pp115-130.
Weedmark, T.C., Spncer, R.J., Juss, D.P., Marechal, F., (2014) Applications of Portable XRF, Chemical
Stratigraphy and SEM in the Horn River Basin, CSOG/CSEG/CWLS GeoConvention 2012, Calgary
presentation.
Lewan, M.D. (1983) Effects of thermal maturation on stable organic carbon isotopes as determined by
hydrous pyrolysis of Woodford Shale, Geochimica et Cosmochimica Acta, 47(8), Pages 1471-
1479, ISSN 0016-7037, 10.1016/0016-7037(83)90306-X.
Schoell, M. 1983. Genetic characterization of natural gases, AAPG Bulletin, , v. 67, p. 2225-2238
Wu, S., Deev, A, Haught, M, Tang, Y. 2008. Hollow Waveguide Quantum Cascade Laser Spectrometer as
an Online Microliter Sensor for Gas Chromatography. Journal of Chromatography A, 1188(2): p.
327-330.

FIGURES
Figure 1: Rock Eval Pyrolysis for the subject well. The top of the Woodford is at 12,120. The spikes in
the S1, S1/S2 and TOC are significant and relate to specific hydrocarbon zones within the lateral.
WOODFORD

Figure 2: Vanadium is a good indicator of the presence of hydrocarbons. Here it is
plotted against the hydrocarbon sensitive S1/S2 ratio and TOC.

Figure 3: TMax vs Hydrogen Index provides identification of hydrocarbon maturity and the Kerogen
type.

Figure 4: TOC vs S1. Note the linear relationship of the data as samples were collected throughout
the lateral.

Figure 5: TOC vs S2. Seen here the majority of the production is within the oil/gas zone for Type II & II
Kerogen.
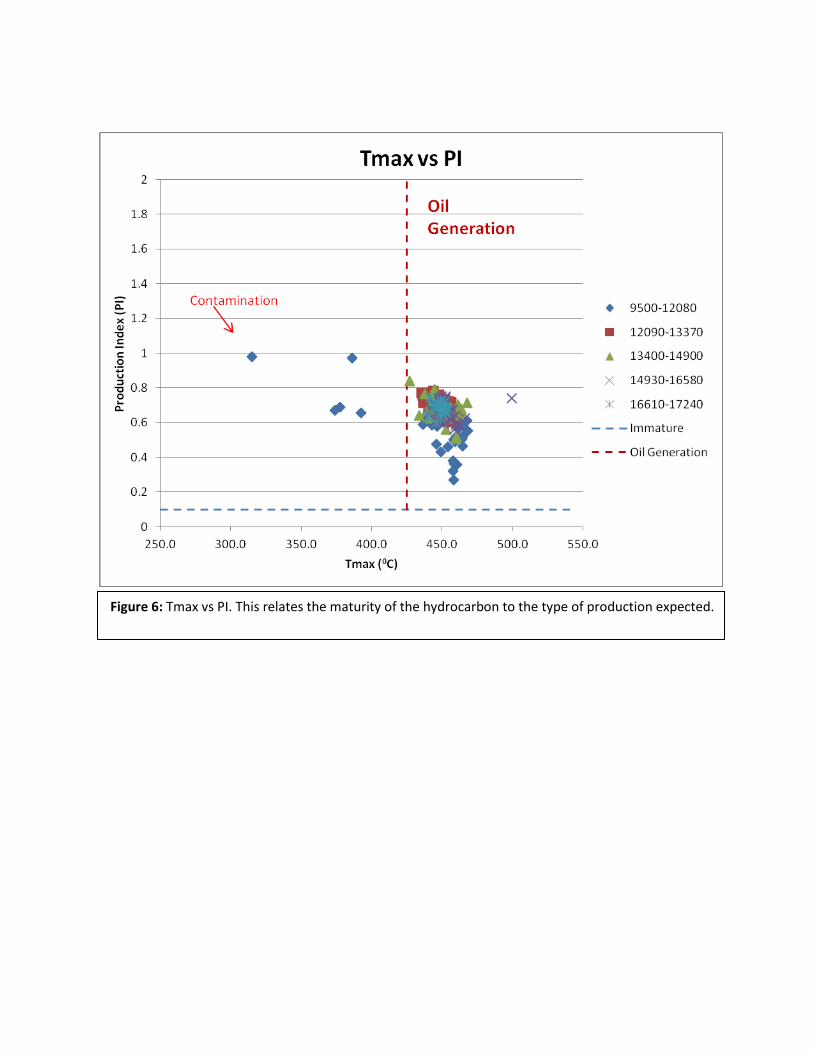
Figure 6: Tmax vs PI. This relates the maturity of the hydrocarbon to the type of production expected.

Figure 7: TOC vs Depth

Figure 8: Plotted vs depth, the values for each isopote is provided. The fluctuations in iC1 indicates
hydrocarbons from different compartments within the Woodford.
iC1 iC2 iC3
Isotope Concentration Change
iSotubes
iSojars
Most Productive Zone
Figure 9: Between the relationship of iC3 from isotubes and isojars, the most productive zones within
the well can be defined.
Isotope Concentration Change

Figure 10: Plotting iC2 from data collected between iSotubes and iSojars, a smaller difference is
found than the plot of iC3 seen in Figure 9.
Isotope Concentration Change

Figure 11: When taken collectively, we find a large difference between isotubes and isojars. This data
indicates that the potential for hydrocarbon recovery is very high and tending toward liquids. A large
difference, green double arrow, between Jars /Tubes and their dynamic change over time provides
information on porosity/permeability, underscored by the Jars’ concentration change.
Isotope Concentration Change

Figure 12: XRF measurements in the lateral within the Woodford. The relationship of sulfur to iron is an indication of
pyrite, while calcium helps identify calcification at a given interval. Potassium, K, is one of the radioactive elements that
make up the spectral gamma ray, the other two being Uranium and Thorium.
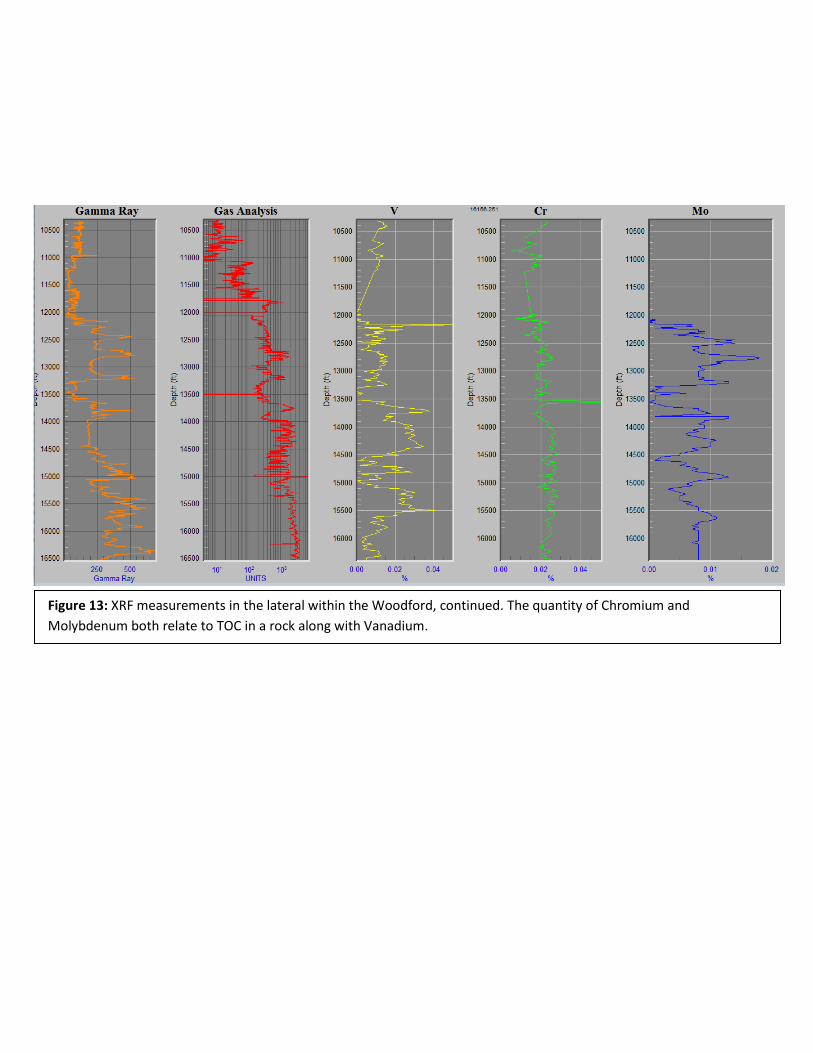
Figure 13: XRF measurements in the lateral within the Woodford, continued. The quantity of Chromium and
Molybdenum both relate to TOC in a rock along with Vanadium.

Figure 14: SEM image of a pyrite framboid from a sample depth of 13,070 MD. The magnification was 2500X.

Figure 15: XRF spectrogram taken at 13,070 MD. The peaks of iron are higher through this interval indicating the
increased potential for the presence of pyrite.
XRF Spectrogram from 13,070 MD

Figure 16: Now at 6000X, porosity becomes visible in this image from 13,430 MD.

Figure 17: XRF Spectrogram from the sample at 13,430 MD. The amount of iron has significantly decreased from the
sample at seen in Figure 16. Note the increase in Ca in this sample.
XRF Spectrogram from 13,430 MD

Figure 18: SEM image from 15,050 MD. The porosity has increased in this sample with an average pore diameter of 6.7
micrometers.
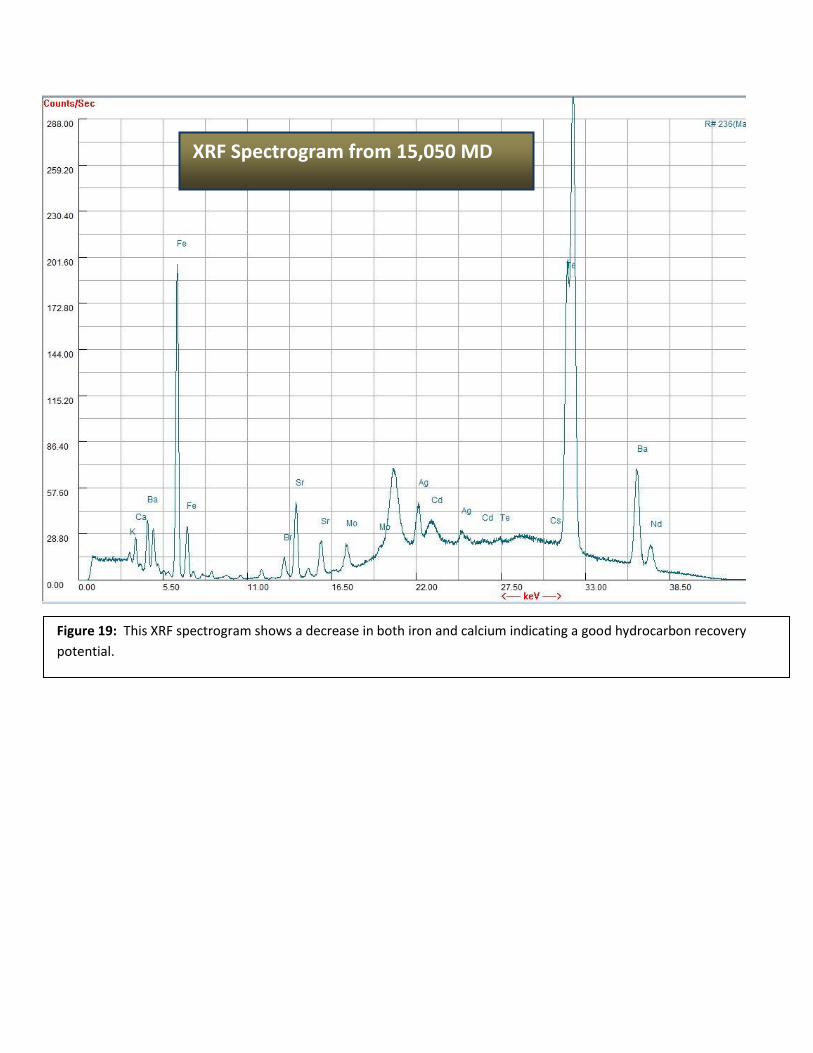
Figure 19: This XRF spectrogram shows a decrease in both iron and calcium indicating a good hydrocarbon recovery
potential.
XRF Spectrogram from 15,050 MD
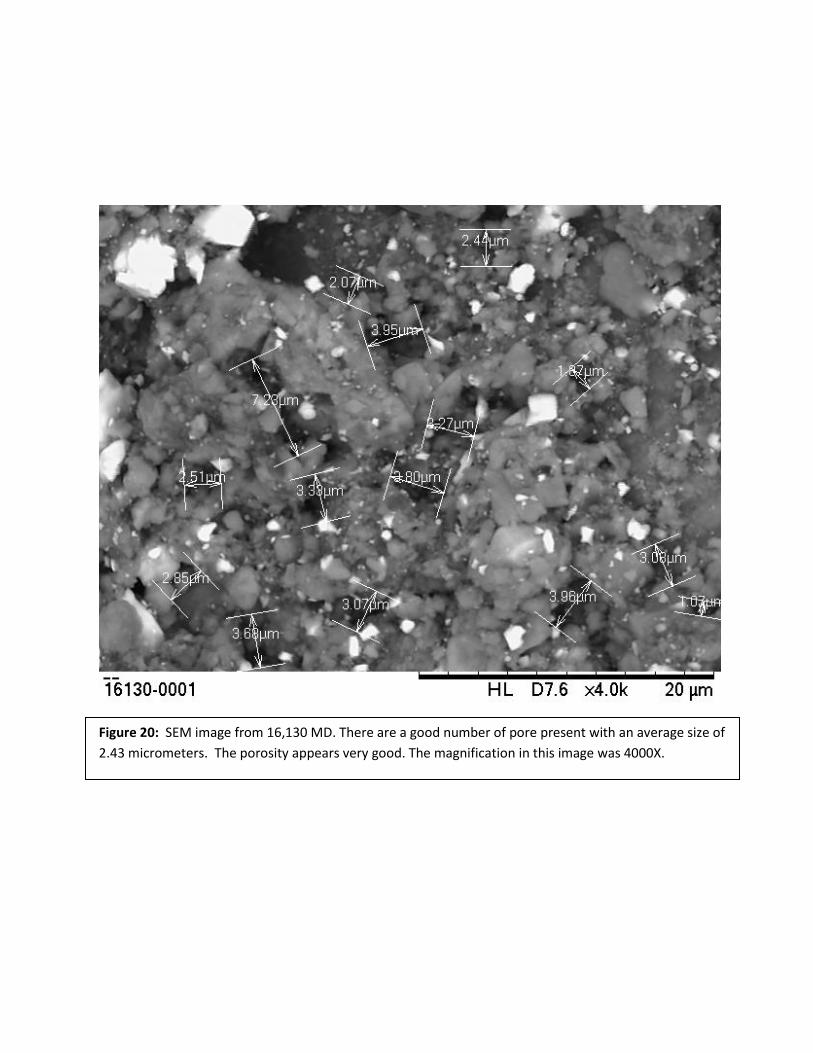
Figure 20: SEM image from 16,130 MD. There are a good number of pore present with an average size of
2.43 micrometers. The porosity appears very good. The magnification in this image was 4000X.
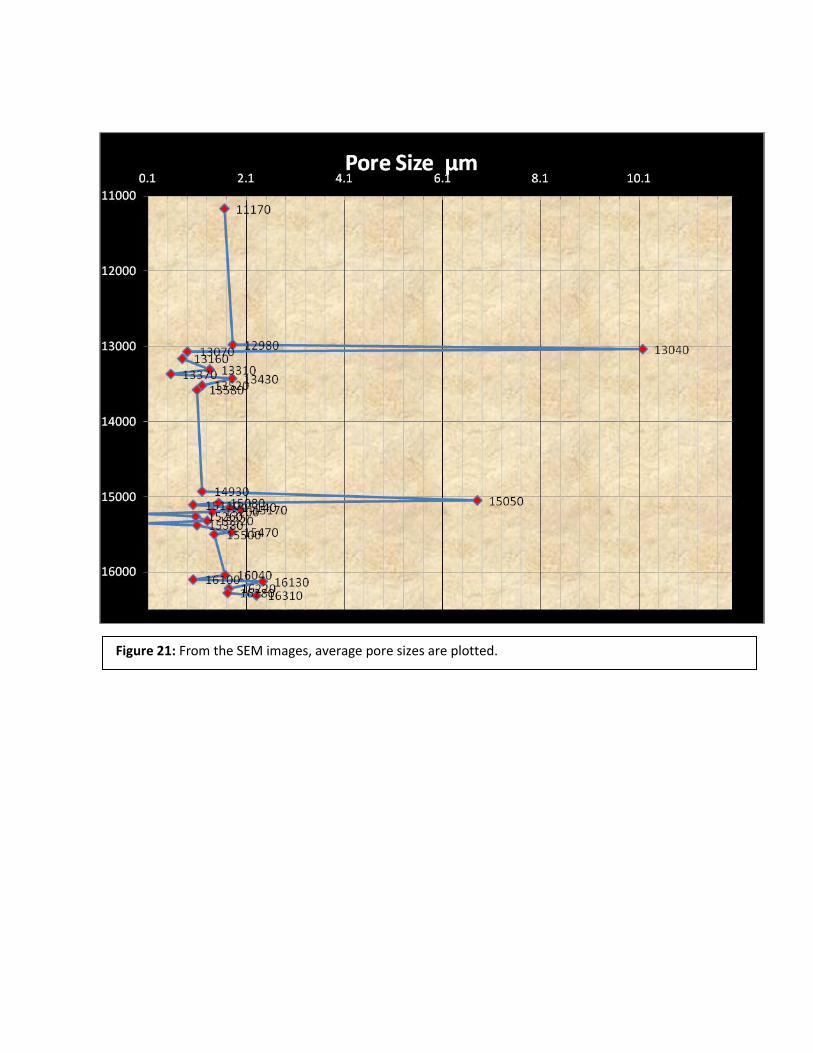
Figure 21: From the SEM images, average pore sizes are plotted.
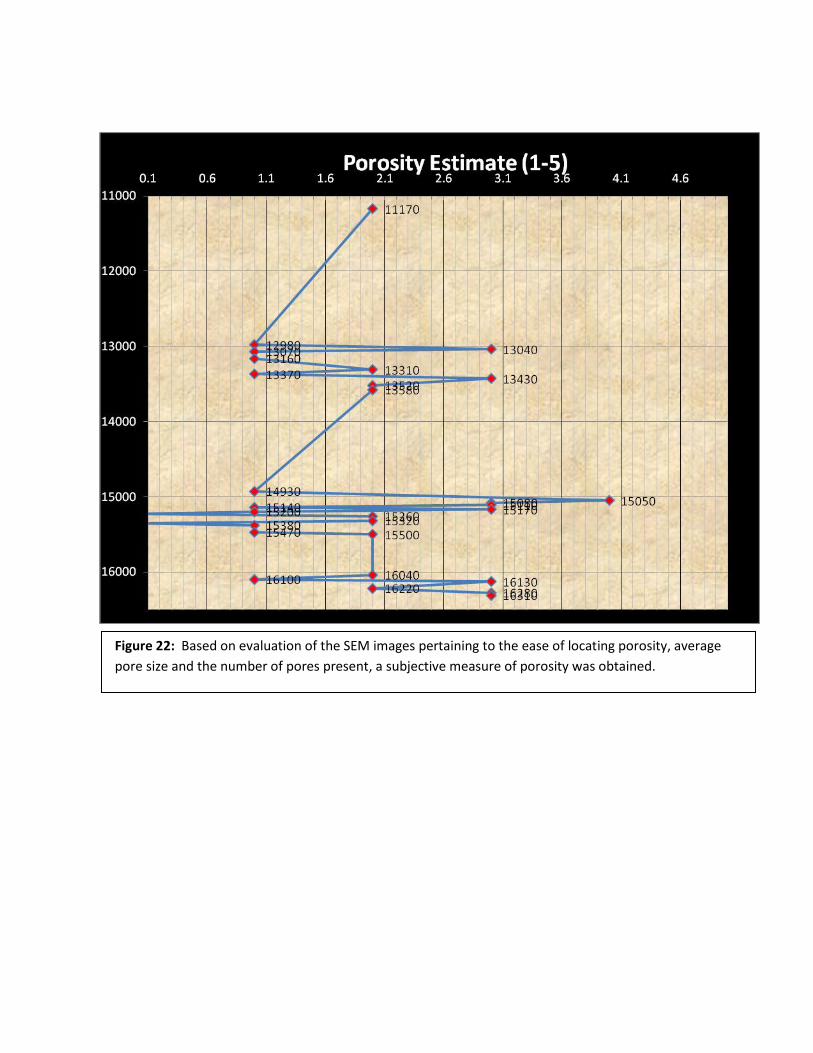
Figure 22: Based on evaluation of the SEM images pertaining to the ease of locating porosity, average
pore size and the number of pores present, a subjective measure of porosity was obtained.