wood waste cleanup
TRANSCRIPT

Wood Waste Cleanup
Identifying, Assessing, and Remediating Wood Waste in Marine and Freshwater Environments Guidance for Implementing the Cleanup Provisions of the Sediment Management Standards, Chapter 173-204 WAC
September 2013 Publication No. 09-09-044

Publication and Contact Information This report is available on the Department of Ecology’s website at https://fortress.wa.gov/ecy/publications/SummaryPages/0909044.html For more information contact: Toxics Cleanup Program P.O. Box 47600 Olympia, WA 98504-7600
Phone: 360-407-7170 Washington State Department of Ecology - www.ecy.wa.gov
o Headquarters, Olympia 360-407-6000
o Northwest Regional Office, Bellevue 425-649-7000
o Southwest Regional Office, Olympia 360-407-6300
o Central Regional Office, Yakima 509-575-2490
o Eastern Regional Office, Spokane 509-329-3400 If you need this document in a format for the visually impaired, call the Toxics Cleanup Program at 360-407-7170. Persons with hearing loss can call 711 for Washington Relay Service. Persons with a speech disability can call 877-833-6341.

Disclaimer
This document provides guidance on the cleanup of wood waste pursuant to the Sediment Management Standards, Chapter 173-204 Washington Administrative Code (WAC). It is primarily intended to provide guidance to persons with technical backgrounds and experience in sediment cleanup, including Washington Department of Ecology site managers, consultants, and contractors. This guidance contains some recommendations and best management practices that are not mandated by law. Best professional judgment should be used when applying these recommendations to a specific site. While the information provided in this guidance is extensive, it is not exhaustive and the user may need to obtain information from additional sources. Although this guidance has undergone review to ensure the quality of the information provided, there is no assurance that this guidance is free from errors. The information contained in this guidance should be independently verified. This guidance does not establish or modify the rights or obligations of any person under the law. This guidance is not intended, and cannot be relied on, to create rights, substantive or procedural, enforceable by any party in litigation. Ecology may act at variance with this guidance and may modify or withdraw this guidance at any time. Further, in publishing this guidance, Ecology does not intend to impose upon itself any mandatory duties or obligations. Any regulatory decisions made by Ecology in any matter addressed by this guidance will be made by applying the governing statues and administrative rules to the relevant facts.

This page intentionally blank.

Wood Waste Cleanup
Identifying, Assessing, and Remediating Wood Waste in Marine and Freshwater Environments
Guidance for Implementing the Cleanup Provisions of the Sediment Management Standards Chapter 173-204 WAC
Toxics Cleanup Program Washington State Department of Ecology
Olympia, Washington

This page intentionally blank.

i
Table of Contents Chapter 1 Authority and Background ........................................................................................1
Framework of the Sediment Management Standards Rule .........................................................1 The Model Toxics Control Act ....................................................................................................4 The Timber Industry in Washington State ...................................................................................4 Why Can Wood Waste in the Aquatic Environment be a Problem? ...........................................5
Chapter 2 Site Assessment .........................................................................................................15 Review Site History and Existing Data .....................................................................................15 Nature and Extent ......................................................................................................................16 First Tier: Screening Tools ........................................................................................................18 Second and Third Tier: Additional Identification Tools ...........................................................21 Biological Tests and Wood Waste .............................................................................................27
Chapter 3 Remediation and Monitoring...................................................................................31 Cleanup Site Characteristics to Consider ...................................................................................31 Evaluating Remediation Alternatives ........................................................................................32 Post Remediation Monitoring ....................................................................................................37 Source Control Monitoring ........................................................................................................39
Chapter 4 Site-Specific Cleanup Case Studies ...........................................................................1 Hylebos Waterway .......................................................................................................................1 Port Gamble Bay ..........................................................................................................................4 Scott Paper Mill ...........................................................................................................................7 Barbee Mill ..................................................................................................................................8
Appendix A Best Management Practices for Reducing In-Water Wood Waste ................ A-1 Introduction ............................................................................................................................. A-1 Tools for Implementation of BMPs ........................................................................................ A-1 Wood Waste Storage .............................................................................................................. A-6 Washington State Department of Natural Resources ............................................................. A-7
Appendix B Impacts of Marine and Freshwater Organic Decay ..........................................B-1 Physical Impacts ......................................................................................................................B-1 Chemical Impacts ....................................................................................................................B-4 Biological Impacts .................................................................................................................B-11 The Aquatic Ecosystem .........................................................................................................B-13 Ecosystem Impacts ................................................................................................................B-15
Appendix C References ............................................................................................................ C-1

ii
List of Figures Figure 1. Sawdust in Nearshore Sediment ................................................................................ 7 Figure 2. Nearshore Dimensional Lumber Wood Waste .......................................................... 7 Figure 3. Variety of Nearshore Wood Waste.......................................................................... 10 Figure 4. SPI Image Showing the RPD Layer ........................................................................ 26 Figure 5. Vicinity Map of the Hylebos Waterway and Hylebos Wood Debris Site ................. 1
List of Tables Table 1. Comparison of Marine and Freshwater Chemistry ................................................... 13

iii
Acronyms and Abbreviations
AKART all known, available and reasonable methods of prevention, control, and treatment BMP best management practice BOD biochemical oxygen demand BTEX xylene ° C degrees Celsius CAD confined aquatic disposal CDF confined disposal facility CERCLA Comprehensive Environmental Response, Compensation, and Liability Act cPAHs carcinogenic polycyclic aromatic hydrocarbons CSL cleanup screening levels DMMP Dredge Material Management Program DMMU dredged material management units DNR Department of Natural Resources ENR enhanced natural recovery FS feasibility study GPS global positioning system HCP Habitat Conservation Plans HWDS Hylebos Wood Debris Site MLLW mean lower low water mmol millimoles per liter MNR monitored natural recovery MTCA Model Toxics Control Act NPDES National Pollutant Discharge Elimination System PAH polycyclic aromatic hydrocarbons PCBs polychlorinated biphenyls pH potential of hydrogen PLPs potentially liable persons PSEP Puget Sound Estuary Program RCW Revised Code of Washington RI remedial investigation RPD redox potential discontinuity SAPA Sediment Sampling and Analysis Plan SMS Sediment Management Standards SPI sediment profile imaging SQS sediment quality standards SWI sediment-water interface SWPPP Storm Water Pollution Prevention Plan TOC total organic carbon TVS total volatile solids USEPA U.S. Environmental Protection Agency WAC Washington Administrative Code WPCA Water Pollution Control Act

iv
This page intentionally blank.

Chapter 1 Authority and Background
1
Chapter 1 Authority and Background
This document provides detailed technical guidance for site managers and consultants for identifying, assessing, and remediating organically enriched aquatic environments impacted by specifically by wood waste. This document is intended to be used as a companion to the Sediment Cleanup Users Manual II, Publication No. 12-09-057 (Department of Ecology, 2013).
Framework of the Sediment Management Standards Rule The SMS rule was adopted in 1991 and revised in 1995 and 2013. The most recent revisions focus on Part V of the SMS rule, and include:
• Clarifying requirements for protection of human health from sediment contamination.
• Integrating the SMS and Model Toxics Control Act (MTCA), Chapter 173-340 WAC cleanup requirements where feasible.
• Clarifying requirements for protection of higher trophic level species from sediment contamination.
• Promulgating numeric chemical and biological standards for freshwater sediment to protect the benthic community.
The goal of the SMS is to reduce and ultimately eliminate adverse effects on biological resources such as shellfish, aquatic worms, and crustaceans in addition to threats to human health from surface sediment contamination. The sediment cleanup decision process governs the cleanup of contaminated sediment sites, including how sites are identified, investigated, cleaned up, and monitored.
The Model Toxics Control Act, Chapter 70.105D RCW, authorizes Ecology to regulate environmental cleanups and is the implementing authority for Part V of the SMS. The SMS provides Ecology with a uniform set of procedures and requirements for managing contaminated sediments. The goals of the SMS may be achieved by coordinating activities to comply with other state and federal statutes, such as MTCA; Water Pollution Control Act (WPCA); Comprehensive Environmental Response, Compensation and Liability Act (CERCLA); and State Environmental Policy Act (SEPA).

Chapter 1 Authority and Background
2
The SMS provides the legal framework to:
• Establish numeric chemical and biological criteria.
• Establish narrative standards for sediment quality.
• Assess the nature and extent of sediment contamination.
• Follow a decision process for the cleanup of sediment contamination.
• Follow procedures for reducing pollutant concentrations in NPDES discharges to prevent future sediment contamination.
The SMS rule has six sections:
• Part I: General Information. Includes anti-degradation and administrative polices.
• Part II: Definitions. These definitions apply to Parts I–VI of the rule, unless a definition in Part V supersedes Part II definitions.
• Part III: Sediment Quality Standards. This section has numeric chemical and biological benthic criteria for marine sediments. In addition, there are narrative standards for the freshwater benthic community and protection of human health. The Sediment Quality Standards (SQS) correspond to the long-term goals for sediment quality in Washington State. Sediments that meet the SQS criteria are expected to have no adverse effects on the benthic community. The numeric chemical SQS criteria are based on the results of biological testing and may be revised as new data are developed regarding the toxicity of contaminants in sediment.
• Part IV: Sediment Source Control. This section includes a process for managing sources of sediment contamination. This portion of the rule includes:
o Mechanisms for verifying that discharges (under the National Pollution Discharge Elimination System, or NPDES) with the potential to impact receiving sediments have received all known, available, and reasonable methods of prevention, control, and treatment prior to discharge and the application of best management practices.
o Monitoring procedures necessary for evaluating the potential for a discharge to impact receiving sediments.
o Procedures for determining whether a source is eligible for a sediment impact zone, which would authorize the receiving sediments to exceed the SQS.

Chapter 1 Authority and Background
3
o Methods for determining what restrictions (e.g., on size or level of contamination) would apply if such a sediment impact zone is authorized.
o Managing dredged material disposal activities.
• Part V: Sediment Cleanup Standards. This part of the rule is promulgated under the MTCA law only. The goal of the sediment cleanup decision process is to provide a framework for timely decisions and expeditious cleanup of contaminated sediment sites. This includes a decision process for:
o Identification of contaminated sites (WAC 173-204-510 through 173-204-530).
o Determining the appropriate regulatory authority for cleanup and compliance with other authorities (WAC 173-204-540 and 173-204-575).
o Procedures for conducting a remedial investigation and feasibility study (WAC 173-204-550).
o Procedures for selecting appropriate cleanup standards on a site-specific basis (WAC 173-204-560 through 173-204-564).
o Procedures for selecting appropriate cleanup alternatives and compliance and monitoring requirements (WAC 173-204-570).
• Establishment of sediment recovery zones (WAC 173-204-590).
• Part VI Sampling and Testing Plans/Recordkeeping. This part of the rule includes requirements for sampling plans, reporting, and records.
To effectively guide the cleanup of sites contaminated by wood waste for marine and freshwater sediment, the SMS contains both biological and numeric criteria for a suite of chemicals in WAC 173-204-562 (marine environments) and WAC 173-204-563 (freshwater environments).
The SMS also includes narrative standards for addressing contaminants known as “other toxic, radioactive, biological or deleterious substances” which can cause or contribute to sediment impacts. Numeric criteria for these substances are also developed on a site specific basis.
For more information about the SMS rule, please visit Ecology’s website: http://www.ecy.wa.gov/programs/tcp/smu/sed_standards.htm.

Chapter 1 Authority and Background
4
The Model Toxics Control Act In March of 1989, a citizen-mandated cleanup law went into effect in Washington, changing the way hazardous waste sites are cleaned up. Passed by voters as Initiative 97, this law is known as the Model Toxics Control Act, Chapter 70.105D RCW. Ecology subsequently published the MTCA rule (Chapter 173-340 WAC) which describes the legal processes and technical requirements for the cleanup of contaminated sites. Since passing the initiative, the legislature has amended the MTCA law several times, and Ecology has periodically updated the rule.
The SMS provides a process for identifying, investigating, and evaluating cleanup alternatives for individual hazardous waste sites. Once the nature and extent of contamination at a location have been defined and cleanup alternatives identified, MTCA and SMS define a two-step approach for setting cleanup requirements:
• Setting Cleanup Standards Cleanup standards provide a uniform, statewide approach on a site-by-site basis.
• Selecting Cleanup Actions Cleanup actions evaluate cleanup methods and help in choosing the best one.
For more information on the SMS and the cleanup process, visit Ecology’s website: http://www.ecy.wa.gov/programs/tcp/cleanup.html.
The Timber Industry in Washington State The timber industry has played an important role in Washington for over 150 years. Sawmills, log rafting, and log dump facilities were an important part of the state’s economic and industrial development. Communities relied on local lumber supplies for growth, so many early towns had their own sawmill and rafting areas.
The earliest lumber mills began operating around 1850. At the height of the timber industry, potentially hundreds of mills were operating in Washington State, many with nearby log rafting areas. In 1908, 35 sawmills operated in Clark County alone, supplying building materials to local homesteaders. Currently, relatively few sawmills remain in operation statewide.
In addition to raw lumber, the timber industry produces pulp, paper, plywood, and many other products. Often, sawmills and pulp and paper facilities keep large inventories of logs to provide a continuous timber supply throughout the year (Schaumburg et al., 1973). Different types of wood waste can result from different industry processes, including:
• Sawdust from mill operations.
• Scraps from mill operations and transfer facilities.
Chapter 1 Authority and Background
5
• Bark and chips from log rafting and transfer facilities.
• Whole logs from transport and rafting.
• Dimensional lumber from transport and transfer facilities.
Historically, the state’s waterways provided one of the most economical ways to transport and store large amounts of timber. Most historic sawmill locations are found on or close to marine and freshwater shorelines, often near productive littoral zones. Littoral zones are some of the most diverse and productive habitats in the aquatic environment. These ecosystems contain valuable natural resources and important habitat critical to a healthy ecosystem.
Why Can Wood Waste in the Aquatic Environment be a Problem? Beneficial Wood in the Aquatic Environment Accumulation of wood is often a natural part of the aquatic environment. In forest streams, large pieces of wood such as fallen trees can create pools and riffles, providing habitat for aquatic species. Woody debris, such as the tangle of limbs, root wads and logs, provide hiding places for juvenile salmon seeking protection from predators. Driftwood provides nutrients and the foundation for biological activity as well as dispersing the water’s energy and trapping sediment (Maser and Sedell, 1994). Woody debris can provide stream organisms with leaves, needles, cones, twigs, and bark. Trees can naturally enter streams and may physically shape small streams. Woody, organic debris is continually degraded by insects, bacterial, and fungal digestion. As it breaks down, the particles become increasingly susceptible to microbial consumption (Maser and Sedell, 1994). The natural environment has adapted to these systems.
Wood Waste in the Aquatic Environment When wood waste is present in unnaturally large volumes, however, it can overwhelm the assimilative capacity of sediment, potentially harming the environment. Wood waste from industrial processes such as log rafting, bark, chips, or sawdust is different from the wood naturally found in the environment. The natural systems and organisms are not adapted to large volumes of industrial wood waste.
Typically, wood waste accumulation occurs in the productive nearshore environment. These nearshore areas provide habitat for early life stages of fish species, support valuable recreational and commercial fish and shellfish populations, and play a vital role in the recovery of threatened and endangered species. Sediment impacted by wood waste in these areas can result in impaired productive habitat and closure or impairment of valuable recreational and commercial shellfish beds.

Chapter 1 Authority and Background
6
Wood waste, especially in large volumes, affects the aquatic environment physically, chemically, and biologically. With time, wood waste can decay into smaller, sometimes fibrous pieces, mixing with sediment and impact the benthic community (Kendall and Michelsen, 1997). Wood waste decreases the availability and diversity of the benthic community. A healthy and diverse benthic community is essential to a healthy aquatic community as it is a foundation of the aquatic food web and recycles nutrients between the sediment and the water column in forms usable to other organisms.
In an undisturbed benthic community, each species fills a specific role and ensures that aquatic life cycles continue. In areas receiving unnaturally large volumes of industrial wood waste, few macrobiotic communities may develop, if at all. Sometimes new communities form, but often they are settled only by animals tolerant of organic enrichment; a fully formed, diverse benthic community may still be absent.
Various studies conducted in Washington State (Kathman et. al. 1984; Kirkpatrick et. al. 1998; Floyd and Snider, 2000; SAIC 1999a) show that just 20 percent wood waste by volume could negatively impact the benthic community. These impacts can be from:
• The physical presence of wood waste, which prevents biota from thriving and recruiting in and on native, healthy substrate.
• Decreased dissolved oxygen due to microbial decomposition, which can create an unhealthy or toxic environment for biota.
• Decomposition by-products such as sulfides, ammonia, and phenols, which can cause or contribute to toxicity.
These adverse effects are site-specific and may vary within a small area (Kendall and Michelsen, 1997). The severity of wood waste impacts on the benthic community depends on factors such as:
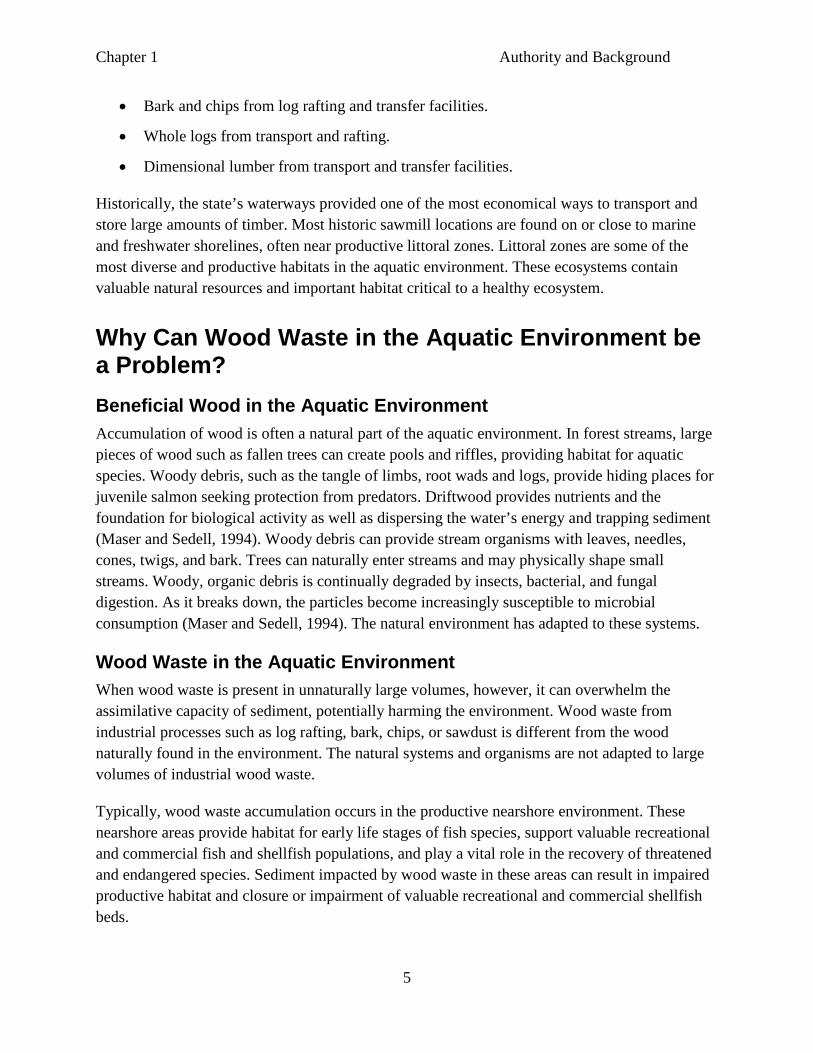
• Physical attributes of the wood waste (bark, scraps, chips, sawdust [Figure 1], logs, and dimensional lumber [Figure 2]).
• Degree of incorporation into sediment.
• Volume present.
• Currents and flushing in the area.
• Habitat (freshwater, marine).
• Tree or plant species from which the wood waste is derived.
• Extent of decomposition and weathering.

Chapter 1 Authority and Background
7
Figure 1. Wood waste in nearshore sediment in the form of sawdust.
Figure 2. Wood waste in nearshore sediment in the form of dimensional lumber.

Chapter 1 Authority and Background
8
Wood Waste Decomposition and Surface-to-Volume Ratio Microbial Metabolism Wood waste decay results from microbial metabolism. Bacteria feed on the wood, breaking it down and creating decomposition by-products such as ammonia, sulfides, and methane. As the decomposition continues, decaying wood provides more nutrients for the bacteria. As bacteria metabolize these nutrients, their respiration increases. Thus, they use more dissolved oxygen, which may exhaust the area’s supply, depending on site-specific conditions.
Often in fresh and brackish waters, increased metabolic activity from fungi, bacteria, and higher organisms may boost carbon dioxide production, potentially forming carbonic acids and reducing dissolved oxygen as well as the local potential of hydrogen (pH) (Goldman and Horne, 1983; Adolphson, 2009). More chemical reactions may occur in these areas. A lowered pH can cause the ionization of metals in the sediment. These ionized metals are often more toxic than their unionized forms. If the pH remains low and carbon dioxide is reduced to carbonic acid, low levels of free carbon dioxide could harm aquatic life (Goldman and Horne, 1983).
In the presence of abundant carbon (which can be found in wood waste), the rate of microbial decomposition is controlled by temperature and oxygen. Higher temperatures speed up decomposition. If sufficient temperatures exist (for example, above 4° Celsius), oxygen can limit the rate of decay. Bacteria can most efficiently decompose wood where oxygen is consistently present. Anoxic conditions can exist where wood decomposition occurs, but the rate of anaerobic1 decomposition is much slower than decomposition in aerobic conditions.
Marine Borers Marine borers are commonly found in brackish waters and can cause serious destruction to untreated wood (Kirk-Othmer, 1998). Gribbles are wood-boring isopod crustaceans that decompose wood in the estuarine and marine waters of the Pacific Northwest, predominantly in intertidal or shallow sub-tidal areas (Maser and Sedell, 1994).
Gribbles resemble small, terrestrial pill bugs and live in colonies on large pieces of wood. They burrow deep into the wood and ingest the powder produced from their borings. Part of what they ingest is eliminated as fecal pellets. These pellets are composed of finely ground wood fibers and are readily dispersed by currents. Gribble fecal pellets can be a source of carbon to estuarine sediment and small piles of them can build up under accumulated wood (Maser and Sedell, 1994). This is how wood waste fibers from whole logs and dimensional lumber become incorporated into sediment.
1 Anaerobic means without oxygen, and is often used in reference to metabolic functions.

Chapter 1 Authority and Background
9
The other marine borers found in the Pacific Northwest are shipworms (Teredo and Bankia species). Shipworms are specialized bivalve mollusks. They attach to wood and can burrow below the surface within 24 hours. Growing up to 2 feet in six months, infestations of shipworms can be so dense that they convert large, solid logs into a fine powder. This wood powder provides food for filter feeders as it spreads into the estuarine environment. Because shipworms must continually bore, much of the wood is not digested but eliminated as fecal pellets. Like gribbles, the pellets sink to the bottom in calm water and are dispersed by turbulent water. Also like gribbles, shipworms use the cellulose portion of the wood for food (Maser and Sedell, 1994).
Surface-to-Volume Ratio Wood particles decay from the outside surface inward. This is consistent regardless of particle size. It has been Ecology’s experience that, as larger wood particles decay in water, they break into smaller pieces, creating greater and greater surface areas on which bacteria may feed.
The smaller the wood particle, the greater its decomposition rate. The relative rate of decomposition from slow to fast is logs, bark, wood chips, and sawdust. As the surface area to volume ratio increases, decomposition increases and dissolved oxygen decreases.
As the wood decays, its volume spreads into a more homogeneous sediment and wood waste mixture which becomes more difficult to remove. For example, a large log can be removed easily when it is fresh or preserved. It may displace productive habitat, but may not produce significant toxic by-products.
However, as the log starts to decay, pieces break off and the decomposition process speeds up. As these smaller wood pieces decay, by-products begin to increasingly be released into the environment and removal becomes increasingly difficult and expensive. If the wood is disturbed, it could break apart and be deposited over a larger area (Adolphson and McMillan, 2009).
Physical Impacts of Wood Waste in the Aquatic Environment Wood waste that is a few centimeters to over a meter thick may smother established benthic and epibenthic organisms and prevent other animals or plants such as eelgrass from colonizing the sediment (Jackson, 1986; Liu et al., 1996). Examples of wood waste with the potential to smother the benthic community are shown in Figures 1 - 3. Organisms settling on the sediment surface or burrowing into the substrate are unable to reach suitable habitat. The normal, healthy surface and subsurface communities are absent. Since most wood waste is in the productive nearshore environment, the decline or loss of these biological communities and habitat can be significant. Ellis (1973) noted that an outstanding feature of surveyed log-rafting and dumping areas “was the tremendous but apparently localized accumulation of bark and wood waste at log dumps. This debris eliminates plants and nearly eliminates animals from the area. How long this debris will persist is unknown.”

Chapter 1 Authority and Background
10
Natural sedimentation may occur during wood waste decomposition. Natural sedimentation of relatively thinly deposited wood waste may allow for the natural recovery of the benthic community over an extended period of time. However, sedimentation over deep accumulations of wood waste does not benefit the benthic community, often because of sulfides and ammonia permeating up through the recently deposited sediment. Cleanup investigations at locations containing thick deposits of wood waste (usually over 3 feet) in Puget Sound suggest that natural recovery is unlikely to occur on its own. These locations show anoxic sediment with little or no sediment turnover by organisms, or any other physical disruption. For natural recovery to be effective, sediment habitats require enough dissolved oxygen, flushing and water exchange, the elimination of wood waste sources, and sediment turnover.
Figure 3. Wood waste in nearshore sediment in a variety of forms.
For more information about the physical impacts of wood waste in the aquatic environment, please see Appendix B.
Chemical Impacts of Wood Waste in the Aquatic Environment As wood begins to decay, increasing aerobic microbial metabolism can drain oxygen from the pore water2 and potentially the water overlying the sediment. Oxygen is the preferred electron receptor as it gives the greatest energy release from a given nutrient source. Bacteria prefer the oxidizing agent or electron receptor that provides the most energy return.
If poor circulation or diffusion limits available oxygen, bacteria can use other chemicals as electron receptors. This can result in anaerobic respiration and limit the energy available for
2 Pore water refers to the water between sediment particles or wood waste.

Chapter 1 Authority and Background
11
metabolism. If oxygen is unavailable, bacteria use nitrates and produce ammonia, followed by sulfate reduction to sulfides, and the metabolism of small organic compounds to create methane. This is why oxygen depletion in sediment can lead to increased ammonia, hydrogen sulfide, and occasionally methane (Theede, 1969).
Electron receptor availability varies among sediment and from marine to freshwater environments. The upper horizon in sediment, where oxygen is available, is often lighter in color and contrasts with the darker underlying anoxic3 or reduced environment. The black coloration suggests reduced manganese.
This visible color contrast also marks the point where many sediment-dwelling organisms may not survive due to limited oxygen, increasing ammonia, and increasing hydrogen sulfide. The oxidized layer may be shallow (less than a centimeter) or entirely absent in anoxic sediment. This signals a stressed or severely impacted environment.
In poorly circulated water bodies, this may also lead to a significant decline of dissolved oxygen. In turn, this means that larger animals move away or die, as seen in fish kills (McMillan, 2007). This typically occurs when an area’s highest seasonal temperatures have been sustained for several weeks. Wood waste leaches and degrades into compounds toxic to aquatic life, such as phenols and methylated phenols, benzoic acid, benzyl alcohol, terpenes, and tropolones (Kendall and Michelson, 1997, as cited from Buchanan et al., 1976).
For more information about the chemical impacts of wood decomposition in the aquatic environment, please see Appendix B.
Chemical and Biological Interactions in Marine Water Marine systems are more chemically stable than freshwater systems. As a result, marine life is more sensitive to small changes in the environment. Wood waste decomposition can cause significant marine system changes, which can harm the local ecology due to the complexity and overall stability of marine chemistry.
Small changes in chemistry due to wood waste decomposition can significantly affect an area’s overall sediment ecology. The high buffering capacity and conductivity of marine waters can affect the rate of wood waste decomposition as well as the by-products formed. Marine water pH drifts only slightly, depending on conditions, because of high mineral content such as carbonate and bicarbonate salts, sulfates, and borate. Because marine waters are more stable through time, their ecological systems are based on this stability.
3 Anoxic means without oxygen.

Chapter 1 Authority and Background
12
Marine systems contain large water volumes. As a result, temperature changes are more gradual and seasonal. Marine water temperature can vary from less than 0° C to greater than 30° C. Puget Sound ranges from about 7° C in midwinter to 15° C in late summer. Temperature, combined with salinity, determines water density.
In marine water, temperature and salinity changes may cause stratified water layers, which influence spring phytoplankton blooms and an area’s mixing and flushing. The seasonal formation of a pycnocline4 can significantly affect oxygen levels below and above the boundary layer, thus differentially affecting biological communities above and below the pycnocline. All of these factors can affect the rate of microbial respiration and the ability of microorganisms to decay wood waste.
Once wood waste covers the native sediment, or surface sediment mixes with significant amounts of wood waste, a negative correlation may exist between the depth of wood waste and the number and diversity of species present, as shown by several studies:
• Populations of suspension feeders may begin to decline when wood waste accumulations approach 1 centimeter (Conlan and Ellis, 1979).
• Bark accumulation greater than 2.5 centimeters may eliminate mollusks and several polychaete species (Jackson, 1986).
• Impacted areas with up to 15 centimeters of wood waste may show a reduced diversity and biomass, with only a few deposit-feeding polychaetes and crustaceans (Conlan and Ellis, 1979).
The presence of the marine bacteria Beggiatoa species has historically been a good indicator of the organic enrichment that is typical when wood waste is present. Beggiatoa is a filamentous genus of proteobacteria and forms colonies that produce bacterial mats. Beggiatoa is tolerant of high sulfide concentrations, while eelgrass is intolerant of these conditions. Once eelgrass beds are eliminated by the inhospitable environment, Beggiatoa will move into the area.
This genus of bacteria is chemosynthetic, meaning the bacteria use inorganic substances as an energy source, often by oxidizing sulfur compounds. The most common sulfur compounds used are hydrogen sulfide, elemental sulfur, and thiosulfate. With a lack of hydrogen sulfide, Beggiatoa will reduce elemental sulfur into sulfuric acid. As a rule, Beggiatoa live in low or acidic pH environments. It is unclear whether they themselves produce toxic by-products because of their chemosynthetic activities.
4 A pycnocline is a rapid change in water density with depth.

Chapter 1 Authority and Background
13
For more information about wood waste and its chemical and biological interactions, please see Appendix B.
Chemical and Biological Interactions in Freshwater Because conditions can change rapidly in freshwater, wood waste decay rates can vary widely both within a single season and between seasons. Wood decay is slowed if freshwater conditions do not support microbial populations. Slower microbial action from anaerobic conditions can also slow decay.
When conditions support healthy microbial populations (such as shallow, warmer water with readily available oxygen and other nutrients) wood decomposition can occur at a faster rate, depleting the available oxygen. As decomposition continues under anoxic conditions methane can be produced as a by-product.
Freshwater has more seasonal stratification because of dramatic changes in temperature. This occurs because of smaller water volumes in isolated rivers or lakes, and the water source supplying the system. With seasonal stratification, dramatic shifts in dissolved oxygen can occur in the water column and the sediment. With dissolved oxygen decline in midsummer, freshwater chemistry is fundamentally different from marine water chemistry. Table 1 highlights some differences between marine and freshwater.
Table 1. Comparison of Marine and Freshwater Chemistry Parameter Marine Water Freshwater
pH 7.5 to 8.4 2.0 to 12.0 Salinity 3.5 percent dissolved salts <0.2 percent dissolved salts Density 1.0255 1.0 Average carbon 2.3 mmol kg -1 Variable
mmol: millimoles per liter
With higher microbial activity, dissolved oxygen often shows daily changes. During daylight hours, significant photosynthesis occurs from algal production and dissolved oxygen increases rapidly, especially in the epilimnion.5
During dissolved oxygen production, carbon dioxide is consumed, which significantly reduces the carbonic acid content in the water column. This acid reduction can rapidly increase the water column pH. This, in turn, causes ionized metals to become unionized and precipitate out of the upper water column.
5 The epilimnion is the warmer layer above the thermocline. The thermocline is the layer of water in an ocean or lake with a temperature gradient greater than the warmer layer above and the colder layer below.

Chapter 1 Authority and Background
14
In lakes, these precipitated metals often fall through the water column past the thermocline. They generally remain in the hypolimnion6 until lake turnover occurs. Turnover happens when seasonal temperatures decrease epilimnion temperatures and water densities equilibrate to temperatures in the hypolimnion. Variability in water density is caused by a change in water temperature.
During summer months, the hypolimnion in regional lakes is often hypoxic (contains inadequate oxygen) once the thermocline is established. The thermocline is established seasonally due to increased solar radiation, causing a lack of mixing in the hypolimnion. The bacterial consumption causes the oxygen levels in the hypolimnion to become depleted below the tolerance levels of most higher trophic-level organisms. The metals falling into the hypolimnion subsequently become re-ionized, potentially resulting in high concentrations of biologically available and toxic ionized metals.
During nighttime hours, algae consume available oxygen, often exhausting dissolved oxygen in the epilimnion below levels that support higher organisms. This can cause increased organic material to migrate downward and harm benthic communities even further. Because of these rapid changes, the seasonal time period for the evaluation of benthic effects should be considered in sediment investigations. Often, no immediate effects are noted in winter and spring samples.
Overall, communities and ecosystems can be adversely impacted in a single season or even shorter time period, and this can affect the entire life cycles of many species (often species with annual life cycles). This can shift the entire sediment community ecology, especially in the presence of large amounts of carbon.
More information about the chemical and biological interactions, biological decay, and ecological impacts caused by wood waste may be found in Appendix B.
6 The hypolimnion is the colder layer of water below the thermocline.

Chapter 2 Site Assessment
15
Chapter 2 Site Assessment
The purpose of this chapter is to present tools for evaluating wood waste to determine its impact on the benthic community as well as compliance with the SMS rule. This chapter outlines a sequence for using these tools.
Successful assessment of wood waste impacts may be complex and demands the creativity of the site manager. Wood waste investigations can be dynamic and require adaptive management and decision making as the data is reviewed. The key objectives of a wood waste investigation include:
• Identifying potential sources of wood waste and associated contaminants in sediment, including both past and continuing sources.
• Describing the overall nature and extent (lateral extent or area, depth, percent cover) of wood waste that impacts the benthic community.
• Characterizing sediment chemical contamination, including the SMS chemicals (WAC 173-204-562 Table III and 173-204-563 Table VII). In particular, polycyclic aromatic hydrocarbons (PAHs), polychlorinated biphenyls (PCBs), and metals. Other chemical contaminants might include wood preservation chemicals, waste oil, and dioxin/furans from associated industries and practices.
• Informing the potential range of remedial choices, ensuring that the remedial investigation (RI) will support the feasibility study (FS) alternative evaluation and selection of a suitable cleanup remedy that satisfies SMS requirements (WAC 173-204-570 and 173-204-575).
The biological criteria in the SMS (WAC 173-204-562 Table V and 173-204-563 Table VIII) provide the best tool to determine compliance with the SMS, but sampling and analysis can be costly. Selectively sequencing investigative tools can help develop a weight of evidence approach and may minimize the total number of biological samples and bioassay analyses needed.
Review Site History and Existing Data When determining areas of interest and possible scope of investigation, understanding the site use history and related activities contributing to wood waste accumulation is important. Many

Chapter 2 Site Assessment
16
resources are available, including company records, current and historical maps, aerial photos, lease records, county assessor’s records and tax parcel information, interviews and local historical accounts from libraries, and records from Ecology and other agencies. After reviewing historic and existing data, sometimes expanding the area under investigation and including more potentially liable persons (PLPs) is necessary.
Consider all potential sources near a known or suspected site. Wood waste is persistent and can spread a fair distance from its origin, and this may also cause the spread of associated contaminants. Consider the following to help identify potential sources near sites:
• Is there a reason to believe wood waste might be present at or near a site?
• Are log rafting or log transfer areas found in the vicinity, either active or historic?
• Have log sort yards operated near the shoreline where wood waste may enter the water?
• Has chip barge loading or unloading, or nearshore chip storage, occurred in the area?
• Have sawmills operated on or along the shoreline?
• Are there any areas or sources continuing to impact the area?
Nature and Extent This section describes best practices for defining the nature and extent of wood waste at a given location. This determination in an aquatic area will help define boundaries and help establish the potential for exceeding the SMS biological or chemical criteria.
Impacts from wood waste are site-specific. The site manager should be adaptive to the area under investigation. For example, as levels of wood waste increase, the form of the wood waste and site-specific conditions could show varying levels of impact.
Wood waste coverage (area and depth) is different at every location. Past wood waste cleanups conducted by Ecology have often used the following as initial screening guidelines (based on Kendall and Michelsen, 1997). While they are not intended to be universally binding, in Ecology’s experience these guidelines have proven useful at wood waste cleanups:
• Wood waste surface coverage between 5 percent and 25 percent may need further investigation.
• Wood waste surface coverage of 25 percent and greater may adversely impact the benthic community and should be investigated further, depending on habitat, coverage area, and depth.

Chapter 2 Site Assessment
17
Determining the lateral and horizontal dimensions (depth, area, volume, and percent coverage) of wood waste coverage is a key site assessment objective. The percentage of surface and subsurface wood waste represent the overall volume on and within sediment. Determining the physical nature (bark, chips, sawdust, and logs) of the wood waste should include understanding the extent of decomposition and weathering and the potential for flocculent characteristics.7 Knowing the extent and type of wood waste will also help determine the environmental impact from the wood waste as well as suitable remedies.
Bathymetry, currents, circulation, and sedimentation rates all influence how wood waste affects sediment in a particular area. Wood waste can be neutrally buoyant and moved by wind, currents, tides, and storm events. Ship scour can be strong enough to redistribute and resuspend both sediment and wood waste. Wind roses are a map symbol showing, for a given location, the frequency and strength of the wind from various directions. They can be useful for looking at potential chip or sawdust distribution from wind as well as currents and tides to identify potential distribution and impacts.
The goals and objectives of investigating the wood waste should typically include determining the following:
• Surface coverage of sediment. Sediment profile imaging (SPI) of the area can help assess coverage. Oblique views and towed or diver video transect surveys also provide subjective information.
• Vertical extent of wood waste and the nature of underlying layers, where wood waste depth exceeds the SPI or vertical imaging penetration depth. Coring or sub bottom profiling technology may also be used.
• Physical nature of sediment. Percent solids and quantitative grain size.
• Conventional chemical concentrations. Total organic carbon or total volatile solids.
• Benthic community information. This includes quantitative taxonomic detail or bioassay results for comparison to the SMS, which helps find transition areas between no impacts and minor adverse effect.
• SMS suite of chemicals.
7 Flocculence refers to “fluffiness” from finely textured or well-decayed wood waste.

Chapter 2 Site Assessment
18
First Tier: Screening Tools Using a weight of evidence approach with a broad suite of endpoints (such as a combination of physical, chemical and biological assessments) to determine site characteristics will support a more efficient and thorough remediation. Because of site variability, using a site-specific weight of evidence approach is a valuable initial screening tool. Using this approach for initial screening will help narrow the locations necessary for SMS chemical and biological sampling and analysis. Chemical and biological sampling and analysis are used to determine the areas that exceed the SMS criteria.
Adaptive management by site managers is another important tool in a wood waste investigation. This may mean adapting the coring or SPI plan while out in the field to extend the area covered to delineate the boundaries. Not allowing for on-site changes may result in lost information or boundaries not properly defined.
Visual Assessment The spread of wood waste can be highly variable, with chip or bark mixtures found in sediment in varying degrees throughout an area. The goal of the site assessment is to determine the presence and percent cover of wood waste, including depth. Visual assessment and descriptive methods often provide a good overall representation of local conditions.
Visually assessing the area can be performed using SPI, diver survey or video transects, towed video, coring, and sieving. Sieving the core and surface samples may show entrained wood waste that cannot be detected using SPI or other visual methods. These methods may be effective depending on site-specific conditions, including when the wood waste was deposited and the sedimentation rate of the area.
Sediment Profile Imaging (SPI) SPI is a rapid survey tool for characterizing the physical and biological aspects of the seafloor. The method uses a wedge-shaped camera box inserted into the sediment surface to take pictures of the sediment profile. SPI surveys are performed by moving the camera across a grid or area of seafloor while recording global positioning system (GPS) fixes on the boat. The resulting images give the viewer the same perspective as looking through the side of an aquarium half-filled with sediment (Germano and Browning, 2006).
SPI can be a useful tool for evaluating the horizontal distribution of wood waste across an area. It can help to detect white mats of Beggiatoa bacteria, for example. It also provides a good view of recently deposited coarse wood waste and can be useful for finding finer textured wood waste (McMillan, 2004).

Chapter 2 Site Assessment
19
SPI provides:
• Locationally accurate data, assuming it is used with integrated differential GPS.
• Relatively high replication at low cost.
• Surface sediment layering to 20 centimeters.
• Redox potential discontinuity information.
• Grain size (dominant features).
• Visible features of surface sediment.
• A general nature of wood waste (coarse or fine).
• Benthic community information (successional stage).
Combining SPI with other tools can provide a more complete assessment. For more information on SPI, see http://en.wikipedia.org/wiki/Sediment_Profile_Imagery.
Diver Transects Conducting visual or video diver transects can provide details about wood waste distribution. Divers are able to position cameras in the best locations, check depth, and closely inspect the wood waste and sediment. A diver can visually note details, probe the sediment with a rod to determine wood waste depth, and look for Beggiatoa bacterial mats. However, diver transects can be expensive.
Towed Video Towed video, as the name implies, is video taken by a camera towed a distance behind a boat. Although it is less expensive than conducting diver transects, it can be much less precise. The quality or resolution of a towed video survey is affected by water clarity as well as the ability to keep the video camera at a specific distance from the sediment surface and to travel at a constant rate. The towed video works best where depths are constant and few subsurface obstacles occur. It gives a more subjective view than a plan view image from SPI imaging.
Towed Array Side-Scan Sonar This instrument is also towed behind a boat. Side-scan sonar gives information about larger features of the sea floor, such as logs, pilings, or other underwater structures, in addition to revealing profiles and contours of the sediment surface. It provides information only on the sediment surface, but may be useful for assessing the abundance of old pilings, debris, sunken logs or bundles, or remnants of overwater structures.

Chapter 2 Site Assessment
20
Sediment Surface Grab Samples Sediment surface grab samples can be used for sediment conventional analyses to help define the areas to take core samples, or where further biological or chemical analyses may be necessary. They are a useful, adaptive tool for making decisions in the field. Typically a 1/10th square meter Van Veen sampler is used to take grab samples. Sediment samples are taken from the top 10 centimeters of the sample.
Surface grab samples collected for wood waste characterization are evaluated visually, based on general soil classification charts. Wood waste type, percent surface cover, depth of overlying sediment, presence of benthos, odor, or sheen should be recorded. A semi-quantitative estimate of percent wood waste can be performed at each location by repeating visually based estimates of volumetric percentage of wood waste within the top 10 centimeters. The range of estimated values should be recorded by qualified sampling personnel.
Sediment Coring Taking core sediment samples can help identify wood waste depth as well as show wood waste deposition over time. Types of core casings include clear Lexan tubes or round aluminum tubes. Lexan cores can be visually inspected before removing the core from the casing. Wood waste lenses or layers can be identified through the Lexan. However, finer, fibrous wood waste such as sawdust or heavily decayed materials may not show up in silty cores. Instead, the core may appear clean. Note that Lexan core casings may bend or break if they hit a hard surface, such as logs or rocks when sampling.
Aluminum cores can be more expensive to use. The aluminum costs more than Lexan and can require added handling costs if they need to be cut to extruded or access the core material.
No matter which core casing is used, extruding or opening the core and cutting it to reveal sediment layers provides the most information. Note any significant visual or textural differences between layers to assess the amount of wood waste and information on sediment deposition. Closer examination and analysis of visually distinct layers may be needed to describe a boundary between wood waste and the undisturbed native sediment. If distinct layers are not obvious, separate core intervals should be examined and analyzed (sediment conventional chemistry and sieving) not exceeding 1 vertical foot of sediment per interval.
Core analyses can be used to provide an estimate for removal volume. Assessing the cores at 1-foot intervals provides a much more accurate estimate for potential wood volume needing removal than core assessment at 2-foot intervals.
Sieving A grab or core sample may appear clean and free of wood waste but may contain 10 percent or greater wood waste. The presence of wood waste may be visually obvious in sandy sediment.

Chapter 2 Site Assessment
21
However, finer textured wood waste (fibers) in fine-grained, silty sediment may not be obvious from looking at the sample. Wet sieving the grab sample or intervals of the extruded core will help detect this more finely textured wood waste. Depending on time and funding constraints, more sieving of the samples using a complete sieve set can provide more complete information about the type and amount of wood particles and fibers present.
Radiometric Dating Radiometric dating is often used to characterize sedimentation rates. By using globally distributed radioisotopes, such as cesium 137, lead 210, and beryllium, radioactive dating methods can age certain sediment layers associated with certain isotopes. Cesium 137 is a marker resulting from nuclear testing activities in the 1960s and gives information on average sedimentation rates since that time. Beryllium has a short half-life and depending on site-specific conditions and seasonal changes, can provide information on how much new sediment was deposited the previous month or so. Radiometric dating can also help determine the potential for natural recovery from the impacts of wood waste.
For a more discussion on sediment field sampling methods, including surface sediment samplers and subsurface sediment corers, please refer to the Sediment Sampling and Analysis Plan Appendix (SAPA), Ecology Publication No. 03-09-043 and the Sediment Cleanup Users Manual II (SCUM II), Ecology publication No. 12-09-057 which includes the SAPA requirements.
Second and Third Tier: Additional Identification Tools Second Tier: Chemical Analyses The previously discussed first tier screening methods are less expensive than other techniques and can help determine the sampling locations for more extensive chemical and biological analyses. This can help reduce the number of chemical and biological samples needed, thus reducing costs.
If cores and surface samples show organic loading from wood waste, conduct chemical and biological analyses (second tier). The goal is to confirm chemical contamination or biological impact. Concentrate bioassay analyses in areas suspected to be problematic or try harder to define accumulation and site boundaries. Perform enough bioassays and chemical analyses to define the nature and extent of the wood waste accumulation and any sediment chemical contamination. Analyses may include:
• 100 percent pore water Microtox® bioassay.
• Total volatile solids.
• Bulk and pore water sulfides.

Chapter 2 Site Assessment
22
• Ammonia in marine waters.
• Biochemical oxygen demand (BOD).
Testing for BOD is not always necessary, but measurements at the area (and suitable matched reference areas) may help evaluate the potential for a reduced oxygen environment.
From these assays, and depending on site-specific conditions, statistically significant correlations may or may not exist between the biological, chemical, and sediment conventionals data.
Third Tier: Chemical and Biological Analyses After conducting the second tier analyses, a third tier of assessment may be needed. This involves reviewing all screening assays to determine the need for and scope of sampling for further biological analysis. If these screening methods and the resulting weight of evidence evaluation suggest potential impacts from wood waste, sampling for the full suite of SMS bioassays and conventional chemistry should be conducted.
Based on Ecology’s experience at wood waste cleanups, finer textured wood waste may have greater ecological impact with less coverage. For example, for areas with more finely textured wood waste (such as small chips or sawdust), consider using a visual area cover threshold of 5 percent (as opposed to 25 percent) to determine potential impact. Determining the surface area to volume ratio of wood waste, as discussed previously, is important to determining potential biological impacts at a wood waste cleanup.
The overall health of the benthic community is important for determining sediment quality at wood waste sites. Benthic community health is determined using the bioassays identified in the SMS for marine and freshwater environments as well as benthic community analysis. If conducting benthic community analysis, use species level taxonomic data and compare benthic community metrics from impacted sediment to those from an approved reference area. Determine sampling needs and select a reference area before sampling starts. Because of freshwater variability, several seasonal samplings and/or multiple year samplings may be necessary to account for the temporal heterogeneity of benthic communities.
Bioturbation8 of surface sediment is associated with an active and productive benthic community. The depth of the redox potential discontinuity (RPD) often correlates to the degree of bioturbation and may reflect the overall vigor of a benthic community. Sediment turnover promotes oxygen renewal in pore water from overlying water, allowing a wider diversity of organisms to colonize the sediment. Some burrowing organisms circulate water for feeding and
8 Bioturbation refers to the turning and mixing of sediment by organisms.

Chapter 2 Site Assessment
23
respiration, extending the oxygenated zone even deeper. The oxygen affects chemical fluxes and exchange between the sediment and the pore water and overlying water, as seen by the RPD.
Bioassay selection or testing protocols may be altered to reflect toxicity associated with the wood waste. For example, the amphipod bioassay calls for aeration to provide dissolved oxygen for optimal survival. However, some situations arise where a severe oxygen shortage can be directly attributable to the presence of wood waste. In addition, the larval test method may need to be modified to include a resuspension step.
Seasonal oxygen depletion is characteristic of nearly all natural systems. This aeration may also eliminate toxicity associated from seasonal dissolved oxygen depressions, resulting from microbial decomposition and related BOD. The aeration also unintentionally but simultaneously results in volatilizing potentially toxic ammonia and sulfides.
To address this unintentional side effect, protocol changes may be needed to reproduce the pore water and overlying water quality conditions of the wood waste (McMillan, 2004). In such situations, collection of detailed vertical water quality profiles and suitable comparisons with matched reference areas can provide important information to evaluate the need for and scope of bioassay protocols. However, bioassay deviations from established Puget Sound protocols should only be conducted with Ecology approval to ensure proper quality control.
Distribution of Sampling Stations It is important to determine if wide-ranging impacts have occurred at a site. The volume of wood waste often correlates with the duration in which the facility operated. The longer the facility operated, the more likely the wood waste distribution will be larger, both laterally and vertically.
To characterize the extent of lateral and vertical wood waste distribution, develop a broad ranging, dynamic sampling plan. Because each wood waste area is different, be flexible to allow for changes to sampling plans to adapt to field and laboratory sampling data. The plan should include sampling stations to define the horizontal extent of accumulated wood waste above prospective cleanup levels (McMillan, 2004).
Sediment Chemistry and Wood Waste Conventionals All sediment investigations should include measuring the conventional sediment variables discussed below. Guidelines for the analysis of conventional sediment variables are provided in the Puget Sound Estuary Program (PSEP, 1986) and SCUM II (Department of Ecology, 2013).
Consider running more analyses if the presence of contaminants and wood waste decomposition by-products are suspected. By-products include (but are not limited to) guaiacols, resin acids,

Chapter 2 Site Assessment
24
PAHs, and phenols. These analyses are discussed in more detail below. For a full technical discussion on sediment chemistry assays, see the SAPA and SCUM II documents (Department of Ecology, 2008 and 2013).
The following conventional analyses can help identify areas impacted by decomposition by-products associated with wood waste:
• Percent solids
• Grain size
• Total organic carbon (TOC)
• Total Volatile Solids (TVS)
• Bulk and pore water ammonia
• Bulk and pore water sulfides
• Pore water dissolved oxygen
• Biochemical Oxygen Demand (BOD)
• Pore water pH
Percent solids provide information on how much water is contained in the sediment sample. For example, a densely packed, clay-like sediment sample would contain much less water than a porous wood waste sediment sample. This is another tool to determine the sediment conditions and provide more information for a weight of evidence approach.
Sediment grain size helps identify suitable reference sediment for biological testing. It helps interpret sediment toxicity data and benthic macro invertebrate abundance data and gives more information about evaluating sediment transport and deposition as well as evaluating remedial alternatives. Sometimes, it may be appropriate to perform grain size following removal of wood waste and other organic materials (for example, by preprocessing the samples with hydrogen peroxide) to ensure a suitable reference station comparison.
TOC analysis can help determine the presence of eutrophic and low dissolved oxygen conditions, such as those present at areas of actively decaying wood waste sites. TOC is also used in normalizing nonionizable organic compounds and aids identifying suitable reference sediment for biological testing. TVS analysis may better correlate with biological results in some field situations and can be used to assess the overall volume of wood waste. TVS represents nitrogen-, oxygen- and sulfur-containing compounds and their associated hydrogen atoms as well as the carbon content-associated sediment. It also may include volatilization of some small fraction mineral salts.
TOC and TVS both provide objective, reproducible measures of the overall organic content in sediment (versus fixed mineral content) and can be used to assess the percentage of wood waste

Chapter 2 Site Assessment
25
present in sediment. TVS measurements often provide a less variable measure of wood waste, since the analytical method recommended by Ecology uses a greater sample volume than the TOC analysis and thus addresses the small-scale spatial variability that is often characteristic of wood waste. Therefore, TVS is the chemical indicator most often used to correlate with confirmatory bioassay results, and is often used to develop site-specific cleanup standards.
Bulk and pore water sulfides and ammonia analyses may provide additional indicators of potential toxicity from wood waste and can be used in a weight of evidence evaluation to determine the need for further biological testing. Accurate pore water sulfide measurements can be difficult to obtain.
To understand the impact of conventional chemicals, a statistical stepwise regression between the detected conventionals listed above and bioassay results can be a useful tool. To do this, Ecology often recommends taking higher numbers of samples. High levels of variability can confound results, requiring potentially higher numbers of samples at some locations to achieve acceptable results.
Chemistry data must meet data requirements listed in the SAPA and SCUM II guidance documents (Department of Ecology, 2008 and 2013). Sediment chemistry data less than 10 years old are preferable for site screening use. Older data may not be representative of current conditions. This is especially true if the source of contaminants of concern decay rapidly in the environment, or if the sample station is in an area with a high sedimentation rate.
Redox Potential Discontinuity The RPD can provide important information about marine sites and help characterize the area’s BOD and level of oxygen depletion from wood waste decomposition. Oxidizing conditions refers to having a high oxygen concentration while reduced conditions show a lack of oxygen. Since animals need oxygen, poorly oxidized sediment impacts healthy benthic communities.
The RPD is affected by the concentration of oxygen dissolved in the interstitial water (water occupying the space between sediment grains) and is influenced by grain size, organic decomposition, and seawater’s oxygen content. The larger the grain size diameter, the better the water circulates in the sediment and the greater the oxygen in the sediment. Fine material (e.g., silt, clay) would have lower oxidizing conditions than sandy sediment.
The presence of digestible organic material leads to faster oxygen consumption. As a result, sediment with high organic content usually has low oxygen levels. If the oxygen content of the seawater above the sediment is low, its capacity to supply oxygen to the interstitial water is limited (McMillan, 2009).

Chapter 2 Site Assessment
26
Figure 4 is an SPI image showing the RPD layer between the brown oxic or oxygenated layer and the darker gray anoxic or reduced oxygen layer. The RPD layer between the oxic and anoxic layers is a thin gray layer where the redox potential changes rapidly within a small distance.
Figure 4. SPI image showing the RPD Layer9
Although normally found in freshwater, the presence of methane and high sediment oxygen demand can also be found in severely anoxic marine sediment. The methane can sometimes be seen in SPI images as shiny bubbles trapped in the sediment. In marine systems, sulfate-starved sediment produce methane instead of sulfides.
Phenols Phenols are associated with the breakdown of lignins in water. They are water-soluble and therefore not present very long without a constant carbon source for continuing decay. Phenols volatilize and solubilize quickly. Although phenols can be toxic in the aquatic environment, phenol signatures are difficult to get, as they are sensitive to seasonal oxygen and temperature changes. The site manager should carefully time phenolic testing to seasonal highs in temperatures and simultaneous lows in dissolved oxygen.
9 Courtesy of R. McMillan.
Chapter 2 Site Assessment
27
Wood-Derived Analytes The following chemicals can be associated with or indicative of wood waste:
• Phenol10,11
• Methylated Phenols10 (2-Methyl Phenol, 4-Methyl Phenol, 2,4-Dimethyl Phenol)
• Benzoic acid10
• Benzyl alcohol10
• Guaiacols (only associated with conifers; not found with deciduous woods)
• Resin acids (associated with conifer woods and fresher materials)
• Retenes (from aged resins; found in the semi volatile fractions)
• Terpenes
• Humic acid
• Fulvic acid
• Tannins
Grab or core samples can be analyzed for these chemicals. Look at their relative concentration and distribution across the investigation area. Increased concentrations may be a red flag for more investigation. Individual chemical concentrations are not necessarily dependent on each other. They can be indicators for locations to conduct bioassays.
Biological Tests and Wood Waste Toxicity tests and benthic community analysis provide a more direct indicator of wood waste impacts than using chemistry analysis alone. Under the regulatory structure of the SMS, bioassays are the confirmatory tools to show that wood waste is adversely impacting the benthic community. Where biological standards (or chemical criteria) are exceeded in surface sediments, the depth of adverse effects must be assessed to allow evaluation of the potential range of remedial options. Biological testing to assess existing sediment quality may include conducting sediment toxicity tests or assessing the naturally occurring community of benthic macroinvertebrates in sediment samples. The SMS relies on a suite of bioassays to reflect the variety of species in a benthic community and their sensitivities to pollution. The applicable biological tests vary depending on whether the sediment environment is marine, estuarine, or freshwater. For marine sediment, the SMS require the use of two acute effects biological tests
10 SMS numeric criteria 11 MTCA hazardous substance

Chapter 2 Site Assessment
28
and one chronic effects biological test (WAC 173-204-562(3)(d). The biological tests for freshwater sediment should include a suite that reflects at least two species, three end points, at least on chronic test, and at least one sub-lethal endpoint (WAC 173-204-563(3)(d).
Applicable marine and freshwater biological tests are listed below. For more information, please refer to the SAPA and SCUM II (Chapter 3) guidance documents (Department of Ecology, 2008 and 2013).
Marine Bioassays (For more information see SCUM II Chapter 3)
Acute Effects Tests
• Larval (mortality/abnormality)
o Sand dollar (Dendraster excentricus)
o Pacific oyster (Crassostrea gigas)
o Blue mussel (Mytilus galloprovincialis)
o Green sea urchin (Strongylocentrotus droebachiensis)
o Purple sea urchin (Strongylocentrotus purpuratus)
• Juvenile amphipod (10-day mortality; may acclimate to some low oxygen environments and may not be the best choice for some sites)
Chronic Effects Tests
• Benthic infaunal abundance (three major taxa: Crustacea, Polychaeta, Mollusca)
• Microtox® (luminescence)
• Juvenile polychaete Neanthes spp. (20-day growth)
Freshwater Bioassays (For more information see SCUM II Chapter 3)
Acute Effects Tests
• Midge Chironomus spp. (10-day growth)
• Midge Chironomus spp. (10-day mortality)
• Amphipod Hyalella azteca (10-day mortality)
Chapter 2 Site Assessment
29
Chronic Effects Tests
• Midge Chironomus spp. (20-day growth)
• Midge Chironomus spp. (20-day mortality)
• Amphipod Hyalella azteca (28-day growth)
• Amphipod Hyalella azteca (28-day mortality)
The presence of wood waste in the sediment could logistically complicate biological testing if large particulate debris cannot fit in the bioassay containers. However, if too much wood is removed from the containers, or if the sample is processed (for example, overly crumbling the large particles), it will no longer represent in situ conditions.
A method used to resolve this in the past was to remove large particulate materials. The sample was placed in a decontaminated stainless steel bowl. Wearing surgical gloves, small amounts of the sample were crumbled between the fingers. All wood and mineral debris greater than 1 centimeter in diameter was removed. Any remaining woody material was pulverized by homogenization and mixed into the sediment (Pentec, 1994). This method is similar to Puget Sound Estuary Program (PSEP) guidance for handling larger particulates (such as gravel or other items) and has been adopted for use in other sediment related guidance by the Puget Sound Dredge Material Management Program (DMMP).
Other methods are being developed to address the potential confounding issues with bioassays and warrant coordination with Ecology prior to conducting biological tests. An example is a method employed at the termination of the marine larval test to resuspend larvae that may have been trapped in the flocculent surface layer (see SCUM II Appendix B for further detail on this method). Decaying woody material often results in a layer of flocculent material in which larvae can become entangled, but continue to develop normally. The standard protocol for test termination would miss most of these larvae without modification to resuspend these otherwise normal larvae. Conducting concurrent PSEP and sediment-water interface (SWI) tests can help distinguish between effects related to chemical and physical factors (Anderson et al., 2001). This information can be useful when evaluating remedial alternatives.
The SWI test was approved by the DMMP to evaluate the suitability of mixed sediment and wood waste from the Manke Lumber Site in the Hylebos Waterway for disposal at the Commencement Bay nondispersive site. It controls for potentially confounding physical effects associated with low-density flocculent material often characteristic of wood waste material. The test exposes larvae to sediment-associated water using a screen tube in a sediment core.
When enough bioassay and chemistry samples are collected, regression analysis with toxicity tests and chemistry analytical results may be used to determine site-specific cleanup levels such

Chapter 2 Site Assessment
30
as percent TVS and percent surficial wood waste coverage. Please refer to the case studies in Chapter 4 for examples.
Another site-specific tool for determining sampling locations for toxicity is to divide TVS by TOC (TVS/TOC). In general, it has been Ecology’s experience that as the ratio increases, so does the potential for toxicity. As the ratio begins to approach two, there is a greater likelihood that toxicity will be observed. This ratio has often been an indicator for more consistent toxicity in a given area. This is a general trend observation and may not hold true in some site-specific situations.
Bioassay test results from wood waste cleanups should be interpreted per the SMS requirements, as for any other site assessment. For a full technical discussion on sediment biological assays, see the SAPA and SCUM II guidance documents (Department of Ecology, 2008 and 2013).
Tissue Analysis Tissue would not necessarily be expected to be affected by wood waste or compounds associated with wood decomposition. If other sources were contributing bioaccumulative contaminants (such as metals, dioxins, and PCBs) to the area, this would be a basis for analyzing tissue.
When conducting tissue analysis at wood waste cleanups, we recommend considering the same factors that would be considered at other cleanup locations. For instance, think about whether local populations consume fish or shellfish in the area. If they do, consider targeting tissue analysis toward those species locally consumed to discover if local populations could be at risk. If historic or current use suggests the possibility of dioxin production, include total dioxins analysis with SMS chemical analysis. For further information on human health risk assessment procedures see the SCUM II guidance document (Department of Ecology, 2013).

Chapter 3 Remediation and Monitoring
31
Chapter 3 Remediation and Monitoring
Once the site assessment is complete, developing and evaluating remediation options can begin. The goal of wood waste cleanup is generally to restore areas so they meet the SMS criteria.
Site-specific cleanup standards are developed based on the combined biological and chemical data, the percentage of wood waste coverage, and amount of wood present in the sediment as measured by TVS analysis. Consider wood waste characteristics as well as the percentage of surficial wood coverage when reviewing remediation alternatives. Use the TVS analysis to help assess the percent volume of wood in sediment. Use as many indices as available to determine what should be remediated at the site.
Cleanup Site Characteristics to Consider Variability of Conditions Each wood waste location has distinctive characteristics and these differences will drive site-specific remedy selection. What might work at one location might not at another. It is necessary to take everything about the site into consideration when determining remediation techniques.
Physical Setting Consider the physical, oceanographic, hydrologic, and geologic characteristics of a location. Currents will be different, for example. Is the area a secluded estuary or more open to weather and current conditions? The physical characteristics of the location, such as the lake or ocean floor shape and bathymetry, will play important roles in how remediation is conducted.
Source, Quantity, Nature and Variability of Wood Waste Before an area is cleaned up, the local industrial processes that may be continuing sources of wood waste should be evaluated for potential recontamination of the area. Best management practices (BMPs) can be implemented to reduce recontamination potential. See Appendix A for more detail on BMPs to reduce wood waste from entering the aquatic environment.
Consider the types of wood waste present at the site. This may include bark, sawdust, chips, logs, and dimensional lumber – and possibly a combination of these types. Sawdust remediation is different from dimensional lumber remediation. Aged, decaying logs that appear whole can shatter when removed and scatter small particles of wood waste over an even larger area.
Chapter 3 Remediation and Monitoring
32
Natural Resources at Risk Natural resources potentially at risk will be different with each location. Consider local fish and shellfish consumption, shellfish beds, salmon and other fish habitat, spawning areas that may include eelgrass, multiple life cycle habitats, and upland habitats. Will the benthic community be disrupted during remediation? If so, how could this be minimized?
Present and Future Anticipated Uses Will the area be available to the general population for recreational use? Will navigation access be necessary? If the area is heavily used for navigation, constraints on depth may affect remediation and restoration. Other considerations include ship scour and wave action along the shoreline. Potential future uses can affect both remediation and restoration.
Evaluating Remediation Alternatives The SMS remedy selection requirements for conducting sediment cleanups, must be considered. The SMS requires that a cleanup protects the environment and human health, meets environmental standards in other laws that apply, and requires monitoring to confirm site cleanup levels are met. WAC 173-204-570(3) minimum requirements includes considering if the remedy:
• Protects human health and the environment.
• Complies with all applicable laws.
• Complies with cleanup standards.
• Uses permanent solutions to the maximum extent practicable.
• Provides for a reasonable restoration time.
• Includes source control measure where applicable.
• Meets sediment recovery zone requirements in WAC 173-204-590 when applicable.
• Provides for review and comment by the public.
• Provides for compliance monitoring.
• Provides for periodic review.
Remediation Methods Proposed cleanup actions should evaluate all potential alternatives for addressing impacts from wood waste and chemically contaminated sediment. Proposed cleanup should also consider the requirements in WAC 173-204-570(4) through 173-204-570(5). The following are some methods that can be used to remediate wood waste sites.

Chapter 3 Remediation and Monitoring
33
Log and Debris Removal Wood waste cleanups will often contain various elements that complicate the cleanup. These include sunken logs, bundles of logs, old pilings or piling stubs, and bundling cables. Other elements include miscellaneous debris such as sunken vessels and industrial discard material such as large metal, concrete, and synthetic structural materials. These are often removed in an early dredge sweep or managed during dredging. Mechanical dredging is often used to remove logs, debris, and varying sizes of wood waste. Much of this can be identified using side-scan, penetrating, or other types of advanced sonar technologies.
Dredging Complete removal of wood waste is a solution that is effective in the long-term. Dredging removes the wood waste that can clog an aquatic ecosystem and exposes native sediment. This reduces environmental uncertainty (USEPA, 2005). Another advantage is that site-specific cleanup standards can often be met. Dredging may also provide more flexibility for future use.
However, dredging is usually more complex and costly than managing sediment in place. The uncertainty of estimating residual contamination can be high, especially if flocculent wood waste is present. In addition, removing all the wood waste at some locations can be cost prohibitive or logistically infeasible because of access. In these cases, removing wood waste in identified “hot spots” may be the best choice.
For dredging projects, the FS should include practical, site-specific estimates of how much wood waste or contaminated sediment may remain in the dredged area after dredging is completed. Dredging can be scheduled or managed to control construction impacts. Confirmatory sampling should consist of analyses to verify the site-specific standards were met.
Practical Considerations for Dredging Wood Waste
After the first debris sweep to remove large logs and industrial debris, effective dredging at some locations may require multiple dredging passes. The first pass is often performed using a digging clamshell bucket, which removes much of the wood waste. Bucket sizes are specific and suitable sizes should be carefully considered. A 3-yard bucket is used to work around pilings. For open areas, a larger bucket is used.
Some wood waste is large and the bucket may not always be able to close while dredging. Large material can be dropped or smaller particles released into the water, contributing to resuspension and its associated water quality impacts as well as sediment residuals. Since wood waste is nearly neutrally buoyant (small in size and low-density), fines and dredge residuals can be problematic (Patmont and Palermo, 2007).
After the first pass using the larger equipment, a second pass using a different, smaller container (such as a square-faced bucket)may be necessary. This pass can improve the effectiveness of

Chapter 3 Remediation and Monitoring
34
environmental dredging where wood waste is well-defined vertically. Few types of dredging equipment have proven effective to remove the last unconsolidated (or “fluff”) layer typically remaining at the end of dredging. If the extent of wood waste was not adequately characterized, or if dredging is not performed carefully, the resulting post-dredge surface may be scalloped. This creates a final surface mix of native substrate and residuals containing high concentrations of fluff.
Placement of a clean surface sediment layer to reduce dredge residuals and restore the natural pre-dredge habitat is a common BMP used in most environmental dredging projects. This helps reduce exposure of residual wood waste to the biologically active surface zone, decrease the migration of dredge materials off-site, and diminish scalloping caused by the uneven dredge bucket penetration. If future site use requires lower elevations for deeper draft vessels, over-dredge followed by backfill or capping may be needed.
Disposal choices for sediment containing high volumes of wood waste may be limited to land disposal. Sediment with less than 25 percent wood waste may meet requirements for open water disposal. If sediment with greater than 25 percent wood waste does not fail bioassays, open water disposal may be possible. Check with a DMMP official to find out the requirements for open water disposal.
Confined Aquatic Disposal (CAD)
Confined aquatic disposal (CAD) is typically an engineered disposal site where dredged sediment is placed and covered by a cap to ensure long-term effectiveness. However, recently the use of CADs has proven less cost-effective than other disposal or reuse choices.
Risks Associated with CAD
Before designing and implementing a CAD, know the risks associated with leaving the wood waste in place. Recognize that uncertainty comes with using a CAD. The CAD may be ineffective or fail in the future. The long-term monitoring plan should include a contingency plan for future CAD failures, including clearly defined triggers for implementing the contingency plan.
CAD Contingency Plans and Long-Term Monitoring
Detailed contingency plans for CAD removal or redesign, for both full and partial failure, should be included in the initial long-term monitoring plan. Contingency plans should include specific and detailed triggers to remove or reengineer the failed CAD and its contents. These specifications should be included with the long-term monitoring plan on completion of the original CAD.

Chapter 3 Remediation and Monitoring
35
In Situ Capping
In situ capping is typically the least desirable remedy for in-water wood waste cleanups. In situ capping occurs when a subaqueous covering or cap of clean material such as sand is placed over contaminated sediment or wood waste (USEPA, 2005).
Before capping, find out the extent and depth of wood waste coverage. Significant volumes may require removal before placing a cap as capping requirements include limits on the volume of wood waste in sediment. Cap design must provide complete wood waste coverage. If logs are present and randomly oriented, remove them so the surface material is less irregular, which allows for less capping material for full coverage.
Determine potential effects to the surface sediment for the area. Following placement of a cap over wood waste, the interstitial water will be displaced and travel vertically through the cap. If the surface of the cap is intended to provide habitat, it may be harmed during early consolidation since any infauna and epifauna would be exposed to the pore water. Depending on the nature of the capping material, and the wood waste being capped, this may be a transient, short-lived effect, but it does call for consideration.
In addition, the decaying wood under the cap may result in the generation of toxic by-products and further oxygen demand as it continues to decompose. The weight of the cap can force these gases up through the cap, significantly risking the integrity of the cap as well as preventing a diverse benthic community from colonizing the cap. Post remediation cap monitoring is necessary to verify the cap integrity and long-term recolonization of the benthic community.
Consider Reasons for In Situ Capping
Caps can be made of clean sediment, sand, or gravel. Depending on the contaminants and sediment conditions present, a cap is designed to reduce risk by:
• Physically isolating wood waste to reduce direct contact exposure.
• Stabilizing wood waste to reduce resuspending it into the water column.
• Chemically isolating wood waste to reduce decomposition byproduct exposure to biota.
For more information on in situ capping, see http://www.epa.gov/superfund/health/conmedia/sediment/guidance.htm.
Nearshore Confined Disposal
At several sediment cleanups in Washington, sediments have been dredged and consolidated with an engineered confined disposal facility (CDF) built along the shoreline. In a CDF, contaminated sediment is contained by a clean berm and capped by clean sediment. Depending

Chapter 3 Remediation and Monitoring
36
on site-specific conditions, the area on top of the facility may be developed for a port or other water-dependent shoreline activities.
If this method is chosen, it is important to determine if tidally driven groundwater exchange could flush through the wood waste and continue to release the sulfides and ammonia that can impact the benthic community. Nearshore confined disposal will require federal and state permitting.
Upland Disposal
Wood waste can be dredged and transported to an upland landfill. The landfill may either be an existing upland Class A landfill (such as the Roosevelt landfill), or a new landfill dedicated to this use (such as a monofill) can be developed. Upland disposal is typically the most costly alternative for sediment cleanup, and requires land for the dewatering of sediment before its transportation to the landfill (Floyd and Snider, 2000). Depending on the disposal option used, sparging salt from marine wood waste may be necessary, as shown in the Port Gamble wood waste interim action cleanup of 2007.
Potential Reuse as an Alternative to a Landfill
Dredged or recovered wood waste may occasionally be beneficially reused as an alternative to land filling. Contact Ecology for details specific to your site, and see Chapter 173-350 WAC for further information about beneficial reuse.
Chemical concentrations may limit the opportunity for the upland beneficial reuse of dredged wood waste. If reuse is considered, wood waste should not have chemical concentrations exceeding MTCA Method A or B soil cleanup standards and must meet local requirements. Check with local city or county jurisdictions to see if they have additional requirements.
Once the wood waste is shown to be clean and salt-free, it could potentially be used as a soil amendment, top soil additive, or compost. Wood waste recovered from freshwater may be evaluated for potential hog fuel, composting, and topsoil amendments as a recycled and clean material.
Do not use seawater-soaked logs, woody debris, or wood waste from marine waters or estuaries for hog fuel. These materials are a proven source of dioxins, which form from the carbon (wood) and chlorinated marine salts at temperatures found in fires and hog fuel boilers.
Treatment and Disposal
Treatment technologies used for contaminated solids may include incineration, solidification, cementation, washing, and bioremediation. Under certain conditions, some of these technologies could be used for marine sediment, although high water content and salinity may interfere with treatment success (e.g., burning salt-laden wood can produce dioxins). Treatment of sediment
Chapter 3 Remediation and Monitoring
37
mixed with wood waste, organic chemicals, and metals may be technically difficult. Treatment is not typically a cost-effective choice for low-level, widespread contamination. Some treatments may, however, prove to be less expensive than upland disposal.
Monitored Natural Recovery
Monitored natural recovery (MNR) and enhanced natural recovery (ENR) are alternatives considered in an RI/FS. ENR can improve the affected area via the application of a thin-layer placement of clean sand or other material over the wood waste, which allows natural recovery processes to occur. While MNR may be suitable at some sites, it may be inappropriate where wood waste has accumulated in thick deposits.
Evaluate the long-term stability of the sediment, the mobility of wood waste, and associated contaminants before using MNR. Include contingency plans as part of an MNR remedy. MNR can be used in combination with source control and/or active sediment remediation. MNR can be a low-cost and noninvasive option under certain conditions.
Post Remediation Monitoring Confirmatory or Performance Monitoring Objectives Monitoring needs will vary depending on the site conditions. Establish site-specific monitoring objectives to determine the overall health and success of the cleanup. Monitoring requirements can be developed using site-specific wood waste cleanup goals and chemical cleanup requirements established for the site. These will aid evaluating and documenting compliance with site-specific requirements during cleanup.
Consider whether facilities at the site are still operating, or if operations have stopped and are not expected to resume. For example, specific monitoring would be required where log yards, mills, or transfer facilities are currently operating in order to decide if they are recontaminating the site with wood waste. BMPs and source control can be performed at sites to prevent further wood waste accumulation. See Appendix A for BMPs examples related to wood waste cleanups.
Longer-Term Monitoring Objectives Evaluating sediment chemistry, physical conditions, and sedimentation rates can help determine if wood waste is reaccumulating. If bioassay failures were identified during the RI that triggered remedial action, perform bioassays to confirm the implemented remedial action achieved cleanup goals and SMS standards. If the bioassays continue to fail SMS criteria after the remedial action is complete, a cleanup contingency plan should be written and implemented.
At wood waste cleanups, measuring the recovery period of the benthic and macrophyte community provides a good sign of overall sediment health and is an important measure of

Chapter 3 Remediation and Monitoring
38
remedy effectiveness. Epibenthic and benthic observations can be compared over time to document increased benthic community health. Rates of use by juvenile salmon can be compared with pre-remediation rates. If the wood waste cleanup also contained bioaccumulative contaminants, tissue monitoring can be used to record if tissue contaminant trends are in decline.
Depending on the final remedy selected, monitoring can be as short as five years or extend longer than 30 years. Within the post-construction monitoring period, adjustments to the monitoring term may be needed as new data are collected and the site conditions reassessed. These adjustments may shorten or lengthen the monitoring period, depending on site-specific conditions. A longer monitoring plan may be necessary if continued operations would result in potential for continued wood waste accumulation.
Potential Monitoring Approaches Set up monitoring locations where wood waste accumulation is expected from continued activities. Consider monitoring the areas with highest remaining visible wood waste or highest conventional chemistry profiles (TVS, TOC, and pore water sulfides). Ideally, wood waste accumulations will be reduced or eliminated when using BMPs.
Monitoring is generally recommended at one, three, and five years post-remediation. Longer-term monitoring for chemistry and bioassays may be needed depending on previous monitoring results and site-specific conditions. If an area is collecting wood waste at rates exceeding the site-specific performance criteria, survey that area on an accelerated schedule to track the accumulation rate.
Monitoring approaches include:
• Visually surveying wood waste accumulation via
o Large-scale plan view imaging (vertical camera angle).
o Digital or photographic images of the undisturbed sediment surface by SPI.
o Slow traveling video survey, timed to optimize water clarity and avoiding storm events.
• Grab samples collected using a modified van Veen grab following PSEP protocols. Analyze the grab samples for chemical contamination, and either direct measures of wood waste (such as percent wood by volume using a physical separation procedure), or indirect measures (such as TVS).
After the sampling time elapses (e.g., three years), use the wood waste accumulation data to develop a longer-term monitoring schedule. Adjust the monitoring frequency as necessary to

Chapter 3 Remediation and Monitoring
39
improve the ability to detect wood waste accumulations before they need dredging (Floyd and Snider, 2000).
Biological monitoring is often required in order to document recovery as well as site use by natural resources and endangered species. If a stated goal of the cleanup was to ensure biological recovery, then biological monitoring is necessary. A contingency plan should accompany the long-term monitoring plan. This contingency plan should identify actions to be taken if toxicity test failures occur during the long-term monitoring.
Source Control Monitoring Monitoring Objectives Monitoring facilities that continue to handle, store, and transfer logs, chips, and sawdust near waters of the state will help assess the accumulation areas and rates to better manage and control wood waste in the aquatic environment. Monitoring plans should typically include control measures, such as dredge removal. These control measures should be triggered by site-specific monitoring plan limits to capture and remove wood waste before it becomes more widely scattered. Monitoring should consider the following (as appropriate):
• Activities with the greatest accumulation rates require more frequent monitoring and control activities.
• Monitoring plans must cover the entire area of potential accumulation.
• Monitoring plans must be developed with specific control activities.
• Triggers (which will cause removal) or other control activities that have measured parameters.
• Monitoring plans should include performance monitoring for control activities. For example, a dredge removal would be successful if post-dredge wood waste surface coverage is less than 20 percent or TVS is less than 10 percent.
The Hylebos Waterway Case Study in Chapter 4 provides a description of a similar monitoring effort. Monitoring efforts can be included in the Storm Water Pollution Prevention Plan (SWPPP) maintained by each facility as required by their General or Individual Industrial Stormwater Permit.

Chapter 3 Remediation and Monitoring
40
This page intentionally blank.

Appendix A BMPs for Reducing In-Water Wood Waste
A-1
Chapter 4 Site-Specific Cleanup Case Studies
Hylebos Waterway A marine wood waste cleanup in Commencement Bay.
History The Hylebos Waterway is located in Commencement Bay in the Tacoma Tideflats, an industrial area of Tacoma, Washington. The Tideflats area is the historic alluvial delta created by the Puyallup River entering Puget Sound. The Hylebos Waterway is one of several man-made waterways dredged out of this former tidal mudflat area (see Figure 5).
Dredging to create the Hylebos Waterway began in the 1920s. More dredging in the 1930s increased the total waterway length by 2.8 miles. Additional dredging in the 1960s added another 0.4 miles to the Hylebos Waterway and created a new turning basin at its end. Until relatively recently, several wood processing facilities operated in the Hylebos Waterway. Historical releases of wood waste from these facilities resulted in the Hylebos Wood Debris Site (HWDS).
Figure 5. Vicinity map of the Hylebos Waterway and the Hylebos wood debris site.12
12 Courtesy of R. McMillan.

Appendix A BMPs for Reducing In-Water Wood Waste
A-2
Determining Cleanup Standards The cleanup required evaluating the wood waste distribution throughout the upper third of the Hylebos Waterway. Tools used included:
• Towed video transects for visual assessment.
• Side-scan sonar to find logs, pilings, bundles, and large debris.
• SPI and plan-view imagery of the surface sediment.
• Surface grabs were collected at 150-foot intervals, providing information regarding:
o Physical information to estimate surface coverage of wood waste and other conditions.
o Percent wood waste cover determined by photographing the surface of the recovered sample and overlaying a randomized grid for subsampling wood waste cover.
o Pore water ammonia and sulfide concentrations.
o Sediment conventional chemistry (as defined earlier in this document).
o Lignins and other wood-specific analytes (e.g., retene, resin acids, guaiacols).
• Cores to characterize accumulation depth.
• Surface grabs and subsurface core samples for bioassays and the analysis of suite of 47 SMS chemicals to determine SMS compliance and DMMP disposal options.
Wood waste depth and chemical contamination varied throughout the cleanup area. To meet the SMS objectives, all areas with chemical exceedances (the Commencement Bay Comprehensive Environmental Response, Compensation, and Liability Act [CERCLA] Sediment Quality Objectives were used since these were equivalent to the SMS benthic criteria) or SMS bioassay exceedances (at the Sediment Cleanup Objective level) were dredged to undisturbed native material. Also, where wood debris cover was greater than 50 percent and/or TVS were greater than 15 percent, removal was required. These site-specific standards were established based on the increasing presence of toxicity observed where conditions exceeded these parameters. Where SMS bioassay failures at the Sediment Cleanup Objective level occurred without associated chemical exceedances or low levels of by-products from wood waste decay, more monitoring was conducted to find out if active remediation would provide a net environmental benefit. Dredged areas with generated residuals (post-dredge) that exceeded site-specific cleanup standards were covered with 6 inches of clean sand.
Remediation and Monitoring The site-specific compliance monitoring requirements were surface sediment (0 to 10 centimeters) TVS concentrations at or below 15 percent and surficial wood waste coverage at or

Appendix A BMPs for Reducing In-Water Wood Waste
A-3
below 50 percent. Bioassay failures occurred at increasing frequencies above this threshold. Dredging and nearshore or upland confined disposal was the primary remedy implemented at the HWDS. Where repeated passes of the clamshell dredge did not result in complete removal of residuals, a 6-inch layer of sand was placed. A subset of ten dredged material management units (DMMUs) from areas where chemistry was not exceeded within the HWDS were evaluated for open-water disposal, with the following results:
• Amphipod Bioassay (Eohaustorius estuarius). The amphipod bioassays were conducted during the initial testing of the ten DMMUs. These results showed all ten DMMUs had no-hit responses and passed the nondispersive disposal site guidelines.
• Neanthes 20-day Growth Bioassay (Neanthes arenaceodentata). For the Neanthes growth bioassay, nine of the ten DMMUs passed the nondispersive open-water disposal guidelines, while one scored a two-hit response.
• Bivalve Larval Bioassay (Mytilus galloprovincialis). The screen tube larval bioassay (using a 25-micron mesh size) results showed that six of ten DMMUs passed the nondispersive disposal guidelines, while one scored a two-hit response and three scored one-hit responses.
DMMP decided that of the ten DMMUs characterized within the cleanup area, six DMMUs showed bioassay responses suitable for unconfined open-water disposal. The remaining four showed responses unsuitable for unconfined open-water disposal, and were either disposed at an on-site nearshore CDF, or transported to a suitable off-site facility.13
A long-term monitoring plan was developed and implemented by the PLPs. The monitoring plan was based on source control BMPs and included monitoring for the continued wood waste sources to the waterway from log transfer facilities and log rafting areas. Monitoring methods and frequency were selected to determine accumulation rates, percent cover, depth, and maintenance dredging frequency for removing accumulated wood waste. Please see Appendix A for more information on BMPs.
Monitoring areas were based on different activities, with the smallest area and highest monitoring frequency at the transfer facilities. Jostling and maneuvering log bundles into and out of the water at transfer facilities result in the greatest loss of wood waste to the aquatic environment. Accumulated wood waste removal was triggered when the wood waste depth reaches 1 foot, preventing these areas from becoming sources to the surrounding vicinity.
Rafting areas were also monitored and wood waste removal was triggered if the surface coverage exceeded 75 percent cover and where contiguous area coverage exceeded a combined acre. For example, a half acre at the transfer area showed 1-foot depth and a contiguous half-acre of
13http://www.nws.usace.army.mil/PublicMenu/Doc_list.cfm?sitename=DMMO&pagename=DY05_SDM`S

Appendix A BMPs for Reducing In-Water Wood Waste
A-4
rafting area showed 75 percent surface coverage. When removal was triggered, compliance was determined to be 50 percent surface coverage or less.
Lessons Learned Correlating conventional chemistry results with bioassay results was difficult because of high sediment variability and limited samples for both bioassay and chemistry. Toxicity was more consistently observed where TVS exceeded 15 percent or wood waste volume exceeded 50 percent. These values were selected as the site-specific sediment cleanup standards and are also used as the threshold for performance monitoring.
A pilot study examined reuse options for wood waste. A small clamshell dredge and compartmented barge were used to assess the wood waste for possible reuse. Recoverable, intact logs were chipped for pulp production. However, logs decayed or fragmented by shipworms or gribbles (marine wood-boring invertebrates) could not be recovered and required confined disposal.
Separating wood waste from sediment was possible where the wood waste was recently deposited. Elsewhere, separation was impracticable because the fine sediment was mixed with the softened and decaying wood waste.
The city of Tacoma accepted recovered wood waste as hog fuel for their steam-generating plant. This was possible only because the incinerator was certified to run at high enough temperatures to destroy dioxins created by salt-laden hog fuel. Composting and adding the material as organic amendments to topsoil production were options that were also explored. Sparging to remove the salt was a limiting factor because of space and time requirements.
Port Gamble Bay A marine cleanup on the Kitsap Peninsula, this site is impacted by wood waste and chemical contamination that poses risks to both human and ecological health. For illustrative purposes, the following description is limited to the impacts of wood waste on the benthic community.
History The Port Gamble sites include a former lumber mill in a protected marine bay, which was continuously operated for 142 years (1853-1995), and a leased area for log storage. The wood waste in the vicinity of the mill came from log rafting, chip loading, and sawdust from operations at the lumber mill. Further from the mill, additional wood waste was introduced at log transfer facilities and log rafting for storage. These areas are near commercial and tribal shellfish beds. The bay habitat currently supports the second largest herring spawning area in Puget Sound in addition to eelgrass (which provides forage fish habitat) and shellfish such as clams, geoduck, and oysters. Wood waste deposits in some areas near the mill were up to 10 feet deep. Remedy

Appendix A BMPs for Reducing In-Water Wood Waste
A-5
challenges thus far have included cost, feasibility, habitat and cultural resource protection, and future land use compatibility.
The wood waste appears to be mainly wood chips, sawdust, and bark. Bark is present from logs in areas used for storage, staging rafts, breaking apart bundles and feeding individual pieces into the mill. Through the middle of Port Gamble Bay, finely fragmented, decaying wood waste is in the surface sediment.
Determining Cleanup Standards For an interim cleanup action at the mill site in 2007, several sampling methods were used to examine the wood waste distribution and SMS exceedances. Surface grabs were analyzed for surface sediment conventional chemistry and the suite of 47 SMS chemicals. SMS bioassays were run to determine any toxicological effects on the benthic community of wood waste. Acoustic sub bottom profiling helped determine the wood waste depth but failed to define the boundary between wood waste and native sediment. Coring provided a more definitive characterization of the wood waste depth. At some locations, coring accuracy was actually hampered by wood waste depths exceeding the core tube length. SPI and video surveys helped define the aerial extent of wood waste. Bioassays were used to determine the lateral extent of areas requiring remediation.
Sampling results were examined to determine if a correlation existed between the sediment larval bioassay results, TVS, and pore water sulfide concentrations. The information was then used to determine areas needing remediation. Similar to the Hylebos wood debris site evaluations discussed earlier, exceedances of SMS biological criteria are based on PSEP bivalve larval bioassay tests. Concurrent larval bioassay tests performed for DMMP using a 25-micron mesh size passed nondispersive disposal guidelines.
A shallow nearshore area of the site (with buried wood chip accumulations) showed increased dissolved sulfide concentrations in near-surface sediment. This may be partly because of groundwater-pore water discharge or recharge cycles driven by tidal exchange. However, wood waste deposits in deeper areas of the bay appear as buried wood waste below a naturally deposited cap of clean sediment with low dissolved sulfide concentrations.
Remediation and Monitoring The dredging action in 2003 in addition to the 2007 interim action resulted in the total removal of approximately 30,000 cubic yards of wood waste at the former mill and chip loading facility. The 2007 interim action targeted an area with large wood waste build-up next to the mill site. Restoring the marine environment by dredging to native sediment was the objective. About 17,000 cubic yards of sediment containing wood waste, sand, and silt were dredged from 2 acres, dredging 1 acre down to native material. Six inches of sand was deposited on the dredged area to control residuals.

Appendix A BMPs for Reducing In-Water Wood Waste
A-6
Dredged materials were held in an upland area and sparged with freshwater until they met target salinity levels. They were then reused as fill and topsoil on nearby land. A small portion of the dredged materials contained PAHs and were allowed to naturally attenuate for about one year until they met MTCA and Kitsap County reuse requirements.
Baywide Sediment Investigation In 2008-2009 and 2011, Ecology conducted baywide sediment studies, in part, to further characterize the extent of wood waste in the bay. The following information refers to sampling and analyses conducted to characterize wood waste impacts to the benthic community and does not include the sampling and analyses to characterize impacts to human health. The sampling included SPI images, sediment cores, grab samples for bioassay and chemical analyses. Sediment chemical analyses included sediment conventionals (TVS, TOC, percent solids, grain size, bulk sulfides, and bulk ammonia), the suite of 47 SMS chemicals, plus dioxin/furans. Microtox was used as an initial bioassay screen and a suite of three more bioassays were conducted at a subset of stations to determine biological toxicity.
Preliminary bioassay results showed the following order of decreasing sensitivity: larval, Microtox, juvenile polychaete, and amphipod. Bioassay exceedances extend through the middle of the bay at some distance from the primary sources of wood waste at the mill site, log-rafting location, and log transfer facility location. Sediment chemical exceedances of the SMS benthic criteria included phenols and benzoic acid SMS exceedances. Data will continue to be evaluated and will support FS work for Port Gamble Bay currently being conducted. The details and results of this study can be viewed at: http://www.ecy.wa.gov/programs/tcp/sites_brochure/psi/portGamble/psi_portGamble.html
Lessons Learned No single characterization tool was universally effective at determining the wood waste distribution. The differing age and origin of the wood waste (bark, sawdust, wood chips, and logs), the time elapsed since different activities ended, and the wood waste sources made evaluation difficult. The location’s high variability makes recommending this sampling plan or hierarchy of sampling methods difficult.
At Port Gamble, the initial plan to use visual cues to narrow the areas of focus did not work as expected. The SPI failed to provide a quick determination of wood waste distribution. The fine woody material was widely distributed but not visually obvious in the surface sediment.
The next tool used was vibracoring using clear Lexan core tubes. The Lexan cores did not help identify the fine wood waste. The coring was effective at finding wood waste comprised of wood chips and pieces of bark (a few millimeters and larger) at the surface and in the sediment column, but it required extruding the cores and splitting them open.

Appendix A BMPs for Reducing In-Water Wood Waste
A-7
Finely fragmented, decaying wood waste was seen in the sediment in the middle of the bay. Lightly wetting the core material and floating the fine material out of the sediment matrix revealed the presence of wood waste in the sediment. This type of wood waste was difficult to see in the sediment but was captured when sediment was sieved using a 0.5 millimeter or 1.0 millimeter screen size. This tool best identified and quantified the fine wood waste, similar to fine sawdust comprised of soft pulp-like material.
Sediment conventional chemical analyses and bioassays were performed on surface sediment samples. The boundary areas that were moderately impacted by the presence of wood waste were difficult to define. The heaviest deposits were easy to detect using visual tools but the gradients in more moderately impacted areas, especially areas dominated by finer woody material, were more difficult to detect.
A weight of evidence approach was used to assess the range of impacts and determine boundaries for wood waste impact. Greatest weight was attributed to the bioassay results, followed by SMS chemistry exceedances and conventionals (TVS and sulfides, selected based on correlations to toxicity results).
Scott Paper Mill A marine wood waste cleanup site in Fidalgo Bay.
History At the Scott Paper Mill site, a lumber mill and later a pulp mill operated from the late 1800s through the late 1970s. The pulp mill used waste from the lumber mill and discharged waste water directly to Fidalgo Bay. Metals, diesel, and motor oil-range petroleum hydrocarbons, carcinogenic PAHs, PCBs, and dioxins/furans were found in soil at the site above MTCA cleanup levels. Many of these contaminants were also found in nearshore marine sediment at low levels.
In 1999, an independent cleanup action was conducted to remove petroleum-contaminated soil and wood waste on one parcel within the site. The site has been used historically as a log yard, a staging area for oil field equipment, a boat manufacturing site, storage, modular home assembly, and a public park.
Determining Cleanup Standards Visual surface coverage was determined using diver transects and diver penetrating probes. TVS, TOC, percent solids, grain size, pore water sulfide, and ammonia levels were characterized. Bioassay results were used to determine sediment cleanup standards. Using regression analysis with bioassay and TVS data, a site-specific sediment cleanup standard was established of 12.2

Appendix A BMPs for Reducing In-Water Wood Waste
A-8
percent TVS and 25 percent wood waste (by volume) in the top 10 centimeters of surface sediment.
Remediation and Monitoring Removal of several hundred creosoted pilings in the nearshore intertidal and subtidal areas was completed along with removal of a creosoted piling breakwater consisting of hundreds of pilings that previously protected the adjacent marina. Two wave attenuation structures were constructed to protect the shoreline and prevent the erosion of the uplands that were constructed of artificial fill material (construction debris and wood waste). Approximately 3 acres of nearshore excavation removed nearly 20,000 cubic yards of contaminated sediment, construction debris, and several feet of overlying wood waste. Approximately 5 acres of subtidal dredging (totaling about 10,000 cubic yards) of wood debris and contaminated sediment were also completed. An additional 6 acres of subtidal area were capped with clean sediment for a total of 11 acres that were replanted with eelgrass. Nearshore intertidal areas have been backfilled and capped with forage fish habitat-friendly sand/gravel mix in anticipation of forage fish spawning. Natural recruitment of eelgrass has been observed within one year and the recovery of the benthic community and associated forage fish have also been observed. Biological monitoring is ongoing for approximately 10 years to ensure eelgrass recovery and forage fish spawning in the nearshore.
Barbee Mill A freshwater wood waste cleanup in Lake Washington.
History Quendall Terminals is a 25-acre property on Lake Washington’s southeastern shore in Renton, Washington. This site is found between the former JH Baxter site to the north and the Barbee Mill site to the south. From 1916-1969, the site was operated by a company that made creosote and other tar products.
Since 1971, the property was used periodically for fuel storage and as a log sort yard. Past uses at the Quendall Terminals property impacted soil, groundwater, surface water, and lake sediment. The primary chemicals of concern were PAHs and the volatile organic compounds benzene, toluene, ethyl benzene, and xylene (BTEX). The wood waste site was nearshore between the Quendall Terminals site and the Barbee Mill site. The location was originally a MTCA site but is now proceeding through an RI/FS under the USEPA Superfund Program.
Determining Cleanup Standards The wood waste cleanup required determining visual surface coverage. TOC and ammonia analyses were conducted. A suite of three to five bioassays was used to determine where toxic

Appendix A BMPs for Reducing In-Water Wood Waste
A-9
effects occurred. The bioassay and chemistry results were analyzed by regression analysis. TOC provided the best fit with the bioassay data. The TOC/bioassay regression analysis determined the site cleanup standards as 14 percent TOC or 50 percent surface coverage. This work, conducted when it was a MTCA site, has been provided to the USEPA.
Remediation and Monitoring Aquatic wood waste located at the Barbee Mill sites was remediated by dredging the wood waste to achieve the TOC and percent coverage cleanup levels.

Appendix A BMPs for Reducing In-Water Wood Waste
A-10
This page intentionally blank.
Appendix A BMPs for Reducing In-Water Wood Waste
A-1
Appendix A Best Management Practices for Reducing In-
Water Wood Waste
Introduction This appendix provides examples of potential best management practices (BMPs) to help reduce wood waste in and around aquatic environments. This appendix is for general informational purposes only and is not intended to reflect regulatory requirements. Examples are presented that reduce impacts from handling, storing, and transporting logs as well as the associated generation of wood waste and accumulation in the aquatic environment. The goal of these BMPs is to protect the aquatic environment by minimizing the transfer of wood waste to sediment. However, each situation should be individually analyzed to determine the most applicable requirements and BMPs
Tools for Implementation of BMPs Stormwater Pollution Prevention A Stormwater Pollution Prevention Plan (SWPPP) is an effective tool for preventing wood waste from reaching the aquatic environment. A SWPPP is required for any facility issued a National Pollutant Discharge Elimination System (NPDES) permit. The BMPs captured in a SWPPP target activities at upland facilities to contain and prevent wood waste from being lost to the aquatic environment. Besides managing wood waste lost from upland storage and handling of logs, SWPPPs can help control wood waste from in-water log transfer and in-water storage and log movement associated with a facility.
Paved log yards can help minimize the wood lost to the aquatic environment. Paving provides more physical control for easier removal of wood waste and management of stormwater, which can carry wood waste and leachate into adjacent waters. Paving also facilitates collecting and moving stormwater to treatment structures built per BMPs in Ecology’s stormwater guidance documents.
Catch basins with ecology blocks and filter socks can be used to collect debris and smaller particles before they enter the stormwater conveyance system. Settling basins containing weirs can trap solids. Baskets for easy cleanout can be sequenced to allow enough settling time and capacity to remove most particulate wood waste. Sorbent booms can be placed across the ditch to skim oil and floatable solids. Minimizing the amount of water used for dust control and to prevent drying and splitting of saw logs will minimize flows to the stormwater collection system.

Appendix A BMPs for Reducing In-Water Wood Waste
A-2
These types of BMPs have been used at many log yards in the Pacific Northwest to effectively remove the maximum amount of solids from runoff water. However, site-specific design and implementation of stormwater BMPs is required because of widely varying conditions between locations.
Good Housekeeping Good housekeeping practices include managing bark and other wood wastes consistent with industry practices and establishing procedures to minimize the amount of wastes generated and by proper handling and cleaning up of bark and wood waste. The most effective measures to avoid or minimize generating wood waste are use of debarking prior to transporting logs from the harvest site. Wherever practicable, but especially for activities that are dependent on debarked logs, debarking as early in the harvest, transport, sorting and handling process reduces waste generation and the costs associated with waste handling and stormwater impacts. Debarking combined with designing and managing a log handling facility to capture, contain and prevent stormwater contact with wood waste provide the best results.
Daily cleanup at log sorting, scaling, and roll out areas in addition to loading and unloading areas is appropriate. Also regularly cleaning out catch basins is an effective measure (Department of Ecology, 2004). Other cleanup methods can include mobile sweepers, scrapers, brow logs, or scoops and facilitate regular (for example, daily, weekly, monthly, yearly) maintenance and cleanup. Such practices can also be included in employee training.
Opportunities for Reuse Many reuse choices exist for uncontaminated bark and wood waste. Bark from the debarking process can be ground into beauty bark. Sawdust and chips can be collected and used to make wood pellets or sold to local buyers to make paper or for animal bedding material. Bark and wood waste can also be moved off-site for reuse, eliminating transient and residual wood waste.
Source-Specific Best Management Practices BMPs for solid wastes can be used for wood waste and bark piles not intended for recycling, under WAC 173-304 or WAC 173-350, Solid Waste Handling Standards, updated February 2003, as it applies. Significant differences exist between these two solid waste rules. They should be reviewed by affected facilities for applicability. Contact the local jurisdictional health department or other relevant local jurisdiction for applicability and implementation issues.
Examples of source-specific BMPs are:
• Covering piles to prevent contact with rainfall.
• Paving areas to increase sweeping and cleaning effectiveness.

Appendix A BMPs for Reducing In-Water Wood Waste
A-3
• Limiting storage time, surface areas, and bark and wood waste pile volumes exposed to precipitation to minimize leachate generation (Department of Ecology, 2004).
Ecology’s Best Management Practices to Prevent Stormwater Pollution at Log Yards (Department of Ecology, 2004) is a resource for BMPs for incorporation into a SWPPP. More design and application guidance is available at http://www.ecy.wa.gov/programs/wq/stormwater/tech.html.
Facility Location If moving an existing facility or locating a new facility, consider avoiding or minimizing the potential for wood waste to enter the environment. Locating a high wood use industry, such as a log storage facility, in the nearshore environment can impact high value aquatic habitat through poor control and loss of wood waste to the environment. Mitigating measures would be necessary to prevent loss of wood waste and to control contact with stormwater or adjacent surface waters.
No degradation of existing sediment quality is allowed under the SMS for waters constituting an outstanding resource or waters of exceptional ecological significance. The SMS anti-degradation policy requires that all existing beneficial uses are to be maintained for any new or increased activity.
Where proposed activities may introduce a waste that may contaminate sediment, all known, available and reasonable methods of prevention, control, and treatment (AKART) and/or BMPs must be applied and existing beneficial uses of the sediment protected (WAC 173-204-120(1)(c)).
Logs and Chips Overland Transport One of the most effective ways to stop wood waste from entering the environment is to avoid contact of logs or log bundles with the water. Overland trucks or trains are preferred methods for transporting logs and chips to fully contained upland log sorting and storage sites. However, many timber dependent industries are located on the water because in-water transport and storage is the less expensive, traditional transport method but may result in harm to the aquatic environment, requiring expensive cleanup actions.
In-Water Storage The use of private or inexpensive state aquatic land leases has allowed externalizing many costs associated with transport, sorting, and storage of logs. Thus, localized loss of habitat values through the shading, grounding, and build-up of bark from these activities has occurred. When the costs of in-water monitoring and cleanup of wood waste is considered, the advantages of controlling wood waste by dry transport and storage become more pronounced.

Appendix A BMPs for Reducing In-Water Wood Waste
A-4
Barging Much of the timber now delivered to Puget Sound mills comes from British Columbia or southeast Alaska, so barging logs has become more cost-effective. This may also be preferred to trucking on congested routes such as Interstate 5 through Seattle. Barging controls bark loss better than in-water log raft transport and storage provided logs are transferred dry to uplands rather than dumped into the water and subsequently transferred upland.
Transfer Using a skirt between the barge and dock captures bark and wood waste when loading and unloading barges. The wood waste remaining on the deck of a barge should be swept up and recovered. Tipping or unloading log bundles from the barge into the water is not preferred since it cancels the environmental advantages of dry transport.
In-Water Log Handling Debarking Where transferring logs to water is unavoidable, measures to eliminate or minimize the bark loss is recommended to reduce the potential for requiring cleanup. Debarking logs before they reach the water is the best way to minimize bark loss.
Nearly all timber dependent processes already require debarking. Debarking logs may involve portable debarkers, often at the logging site, as well as where logs are staged before transport (McMillan, 2001). More control of wood waste occurs when logs are bundled together and bound with a cable or strap, reducing the battering and chaffing between logs.
Minimizing Bark Loss If logs with bark are placed in the water, bark loss occurs where logs are transferred to, staged, stored, or removed from the water. Log chafing and bark loss increases where logs, bundles, or rafts move around, especially where bundles are transferred into the water or maneuvered onto a lift by tugs or log broncs. More bark loss occurs when log rafts are exposed to rough water conditions while in transit or storage which can chafe or break bundles apart and require added handling of individual fugitive logs (McMillan, 2001).
Because of the increased bark loss at transfer points in and out of the water, focused actions at these points will minimize impacts. Easy letdown devices are universally required for placing bundles into and removing them from water. These devices end the jostling and chafing from spilling individual logs or bundles down ramps or gravity log dumps. They also prevent log stackers entering the water to float or recover logs or bundles. Bark loss can also be reduced at transfer stations by ending transfer except when bundles can be fully floated off or onto the cradle of the easy-let-down device, without grounding or high-centering the bundles.

Appendix A BMPs for Reducing In-Water Wood Waste
A-5
Transfer stations can be surrounded by floating barriers to contain floating wood waste and simplify removal. A boom specifically designed to capture floating debris could be used since reliance on boom sticks (logs typically used to contain a raft of log bundles) will fail to confine bark and debris. Boom sticks do not provide a continuous barrier and are easily overtopped by small waves, making them ineffective at containing floating wood waste. Floating booms designed with an upright fence extending a few inches above the water surface will contain floating debris.
Rafting Rafting areas could be located to minimize impacts from wood waste, which could include areas:
• Protected from rough water conditions.
• Locations in areas of moderate or greater circulation.
• Locations away from shallow and intertidal areas.
• Locations away from high value aquatic and nearshore habitat.
• Compatibility with preserving fish passage corridors.
Grounding Ending log raft and bundle grounding eliminates a source of bark and logs from the environment. The following procedures can help avoid grounding:
• Place pilings or buoys water ward of the -12 foot mean lower low water (MLLW) mark to prevent grounding and raft movement into shallow subtidal and intertidal habitat. Pilings and buoys at close intervals will prevent sagging booms between them from allowing rafts at shallower depths. Consider ending log rafting over shallow mudflats.
• Immediately recover logs or boom sticks that ground in intertidal areas.
• Monitor logs that sink in deeper water for percent coverage and decomposition to determine if removal is necessary.
• Remove logs resting between piers or bulkheads as quickly and safely as possible.
Fish Passage When juvenile salmon enter estuaries during their transition from fresh to marine water, some species stay close to the shoreline. They may avoid swimming under log rafts and even interrupt their migration to avoid log rafts. In log rafting areas, preserve migration corridors to ensure unhindered fish passage continues between rafting areas and the shoreline.

Appendix A BMPs for Reducing In-Water Wood Waste
A-6
Fugitive Logs The loss of logs themselves from rafting and transporting impacts the environment as log transfer and rafting areas are often located in the nearshore and estuarine environments. Logs breaking free of transfer or storage operations can be carried by tide, wind, and waves into these sensitive areas. These fugitive logs can ground and destroy, bury, or scour vegetation and disrupt habitat. Monitoring on a frequent schedule of rafting areas and timely recovery of fugitive logs is recommended.
Avoiding In Water Physical Disturbances If wood waste has already collected near a log transfer area, BMPs can help avoid resuspending the wood waste. Periodic dredging and removal can help avoid resuspension and redistribution. Limit disturbing the bottom, especially if the main wood waste layer is above the native sediment layer or little sedimentation has occurred over the wood waste.
Wood waste is neutrally buoyant and disturbing these layers can cause the wood waste to spread further. Also try to:
• End or reduce prop scour.
• Prevent grounding of floating overwater structures. Avoid allowing docks and other structures to rest on the substrate.
• Use boat anchorage systems in a manner that prevents dragging of the anchor or line across the bottom. Use midline floats on anchor lines.
Wood Waste Storage Windblown Wood Waste Mismanagement of wood chips and sawdust impacts the nearshore environment. A major source of aquatic wood waste is windblown from overfilled or poorly contained scows or barges. These losses can be reduced by installing belt conveyor enclosures at critical locations and ensuring that outlet spouts are lowered during filling and directed into the hold of the barge, away from the water. While loading wood chips onto barges, consider extra precautions during windy conditions. Loading may need to be stopped until windy conditions have ended.
To avoid slumping, or having wood chips blow into the water, do not overload barges beyond the height of the side panels. Operators of chip loading facilities are responsible for windblown deposits of wood chips into adjacent waterways. Debris can be contained with booms to prevent escape to open waters. The collected debris can be delivered to a proper disposal site before they become waterlogged and sink to the bottom (Liu et al., 1996).
Appendix A BMPs for Reducing In-Water Wood Waste
A-7
Storage Large piles of wood waste are commonly stored at wood processing facilities, farms, and nurseries. If wood waste must be stored adjacent to a waterway, using a buffer strip or control structures such as bulkheads will help keep wood from entering the aquatic environment. These can be installed between the water and the wood waste pile to prevent erosion and to protect riparian areas on waterways, helping preserve the integrity of adjacent marine nearshore areas.
If wood waste is stored on piled structures overhanging the water, check the integrity of the structures regularly and complete any needed repairs. If wood waste is stored in overhead bins before hauled away on trucks, locate the bins well away from any waterways.
To minimize leachate generation, the base of woodpiles can be minimized and the surface can be shaped to create a moderate to steep slope (for example, cone-shaped). Surface runoff can be diverted around the piles. Consider leachate control if leaching occurs or if water is sprayed on wood residue piles for dust suppression or fire prevention (Liu et al., 1996).
Washington State Department of Natural Resources Habitat Conservation Plans (HCP) As state aquatic land leases through Washington’s Department of Natural Resources (DNR) come up for renewal or as new uses are proposed, DNR may incorporate habitat conservation measures into the leases. The conservation measures will vary based on site-specific conditions, including specific measures for log transfer, rafts, and storage facilities. Please contact DNR’s Aquatic Lands HCP section for more information: http://www.dnr.wa.gov/ResearchScience/Topics/AquaticHCP/Pages/Home.aspx.

Appendix A BMPs for Reducing In-Water Wood Waste
A-8
This page intentionally blank.

Appendix B Impacts of Marine and Freshwater Organic Decay
B-1
Appendix B Impacts of Marine and Freshwater
Organic Decay This appendix provides additional scientific background information to aid the cleanup of wood waste in aquatic environments.
Physical Impacts Wood waste can physically impact sediment quality and benthic communities. Wood waste in any form, from a few inches to several feet thick, can smother benthic plants and animals (Samis et al., 1999). It can be an inappropriate physical substrate for benthic communities, prevent access to suitable habitat, and prevent colonization of the sediment (Schultz and Berg, 1976). Native, healthy surface and subsurface communities tend to decrease as wood waste accumulation increases.
Since most wood waste is found in productive, nearshore environments, the decline or loss of benthic communities and habitat can be significant. Areas with good tidal flow show less impact from wood waste than areas with little tidal flow. The effects may last for years. Large accumulations of wood waste are slow to decay and may persist in the aquatic environment for decades (Kendall and Michelsen, 1997; Kirkpatrick et al., 1998).
The physical impacts associated with wood waste affect the sediment and benthic community by:
• Physically isolating the sediment surface or the sediment-water interface (SWI) (Schultz and Berg, 1976; Freese and O’Clair, 1987; Samis et al., 1999).
• Smothering or burying the SWI and any present biota (Conlan and Ellis, 1979; Liu et al., 1996; Samis et al., 1999).
• Compacting the sediment, as is commonly found in log rafting areas (Faris and Vaughan, 1985).
• Increasing water turbidity (Power and Northcote, 1991).
• Shading from rafts inhibits algal growth and can alter salmonid behavior (Pease, 1974; Faris and Vaughan, 1985) and may cause significantly reduced fish productivity (Samis et al., 1999).
Besides a direct effect on the sediment quality, log-rafting practices can affect the benthic and epibenthic communities. A decrease in the number and variety of benthic organisms has been

Appendix B Impacts of Marine and Freshwater Organic Decay
B-2
documented in log storage areas (Ellis, 1973; Jackson, 1986; Freese and O’Clair, 1987). This decrease could be from the physical wood waste layer created by excess accumulation but also from the presence of resin acids, phenolic constituents, and lower dissolved oxygen levels (Samis et al., 1999).
Temporal Factors Aquatic conditions can vary with time. A productive lake may go from low-oxygen saturation to super saturation within a 24-hour period (Goldman and Horne, 1983). However, a layer of wood waste lying either above or mixed with sediment can change these natural variations. This can be due to oxygen depletion due to high BOD from the decomposition of wood waste. The sediment often contains decaying organic material at a natural level and, if enough light is present, a coating of photosynthetic organisms (Goldman and Horne, 1983). A layer of wood waste would disrupt this natural process.
The respiratory activity of benthic organisms in the sediment creates a continuous exchange of carbon dioxide and oxygen with the overlying water. At night, respiration by plants and invertebrates as well as microbial decomposition can remove significant amounts of oxygen from the overlying water, with an exchange of carbon dioxide and dissolved nutrients in the process (Goldman and Horne, 1983).
Spatial Factors Puget Sound is a fjord-type estuary. Characteristics of this kind of estuary include high, steep slopes and great depths. Fjords can be effective filters for particulate matter. The filtering efficiency for suspended and dissolved particles increases as surface water flows seaward with deeper, new water entering the estuary over the entrance (Schubel and Kennedy, 1984). Mixing determines an estuary’s gravitational circulation pattern. This, together with the size of the estuary, controls the ability of the estuary to remove or keep particulate matter, including different types of wood waste. Mixing in Puget Sound is also affected by water density, especially where freshwater from rivers and salty marine water at the mouth of Puget Sound come together (Babson et al., 2004).
The strength and character of estuarine circulation controls the removal of suspended particles by physical processes. This circulation also plays a major role removing dissolved and suspended matter through precipitation, flocculation, and sorption (Schubel and Kennedy, 1984). The geophysical characteristics of the site will also affect debris accumulation as well as tidal currents, storms, sedimentation, and decomposition (Faris and Vaughan, 1985). This, in turn, can affect movement or stability of wood waste deposits.
For example, Ellis (1973) noted that, at the wood waste dump they studied, the decomposing wood waste was several feet thick, black, and anoxic. They noted that a layer of very flocculent material was easily stirred up at the interface of the wood waste and the overlying water. They

Appendix B Impacts of Marine and Freshwater Organic Decay
B-3
also noted that animals were very scarce in the soft flocculent bottom material. This is very similar to findings at Port Gamble Bay mill site, which shows a soft flocculent bottom with few benthic organisms found during sampling events (McMillan, 2009).
In contrast, the Cliffside Beach area near Bellingham, Washington, is not an area that has ever experienced rafting or wood waste dumping, and yet wood chips piled to a significant depth has been a problem in this area for years. The nearby Nooksack River has carried wood chips (original source unknown) from several upriver areas and deposited them in the Cliffside Beach area. Because of the structure of the river, a lagoon has formed at the delta’s southern distributary14 to Bellingham Bay (Culverwell, 2006).
Seasonal Changes Winter’s low biological productivity results from lower water temperatures and lower light levels. Winter storms mix the water column, carrying plant cells below the critical depth. In spring, the increasing solar energy increases the light availability and temperature of the upper layers of the water.
With spring’s increasing temperatures, increased density differences occur between upper and lower layers. Under such conditions, the wind cannot mix the water to as great a depth as in winter, and at some point, algal cells are no longer carried below the critical depth. Since nutrients in upper layers have been renewed during the winter mixing, conditions are good for phytoplankton growth, and spring blooms are often noted.
As spring changes to summer, the water column becomes more thermally stratified. Mixing at lower water depths is restricted, and light conditions are optimal for photosynthetic activity. Stratification causes nutrient renewal to be significantly reduced and biological production to fall, even though light levels are ideal (Nybakken, 1988). When summer begins, higher oxygen concentrations occur in lower depths. As biological activity increases with warmer temperatures, the oxygen concentration decreases as summer progresses, replaced with carbon dioxide.
With autumn, thermal stratification begins to lessen and nutrients are returned to upper levels. If mixing varies with calm weather, a small bloom may occur with the increased nutrients. This bloom declines in late autumn because of decreasing light and increased mixing (Nybakken, 1988).
This cycle can be upset by increased organics loading such as wood waste. Benthic communities may be disrupted and changing oxygen concentrations affect the biota. Summer fish kills are often a result of low oxygen, often when warm un-stratified waters occur continuously (Goldman
14 A distributary (or a distributary channel) is a stream that branches off and flows away from a main stream. Distributaries are a common feature of river deltas.
Appendix B Impacts of Marine and Freshwater Organic Decay
B-4
and Horne, 1983; McMillan, 2007). Because of the increased oxygen demand from wood waste decomposition, blooms may exhaust the saturated oxygen even faster than normal. If the reduction of deep-water oxygen exceeds the rate of oxygen replenishment from bottom currents, anoxia can develop (BC Ministry of Environment, 1997).
Chemical Impacts Biochemical Oxygen Demand Biochemical oxygen demand (BOD) is a process used to determine the rate at which biological organisms use up oxygen in water. High BOD reduces or removes available dissolved oxygen in the water column and pore water in sediment. Low oxygen reduces benthic abundance and shifts benthic diversity toward species tolerant of low oxygen environments. For example, polychaetes are more tolerant of organic enrichment and low oxygen environments.
Wood waste, like other organic material, creates increased BOD in sediment as it decays. Excessive BOD can reduce or eliminate the aerobic zone. A lack of oxygen in sediment limits the survival of benthic organisms, and can produce a shift toward species tolerant of organic enrichment (Kendall and Michelsen, 1997). Increases in hydrogen sulfide can also occur in anoxic conditions (Pentec, 1997). As wood waste decays and creates anoxic sediment, sulfides, ammonia, or methane production can increase to levels that are toxic to the benthic community.
Dissolved Oxygen Dissolved oxygen concentrations are in constant fluctuation because of chemical and biological processes, and seasonal changes. A normal daily oxygen cycle would show the dissolved oxygen concentration peaking late in the day and dipping early in the morning. Movement of oxygen in both marine and fresh waters is controlled by stratification, biological activity, air-water interface (including wind mixing), and photosynthesis of aquatic vegetation. Surface oxygen levels steadily decrease with depth and vary with local oxygen demand (BC Ministry of Environment, 1997).
Microbial metabolism draws oxygen out of the pore water and the overlying water, increasing BOD from the bacteria and other organisms feeding on excess organic carbon and reducing the sediment oxygen concentrations (Goldman and Horne, 1983). High BOD reduces the interstitial oxygen available to the burrowing organisms. Under extreme conditions, it can reduce the oxygen in the benthic boundary layer at the sediment-water interface affecting surface dwelling organisms (Hiltner, 1996; Pentec, 1997).
High organic content and high microbial populations in the sediment also exert a large oxygen demand on the interstitial water. If sediment particle size is very fine, it can restrict the exchange of interstitial water with the water column and oxygen can be depleted quickly. These conditions

Appendix B Impacts of Marine and Freshwater Organic Decay
B-5
support opportunistic species such as polychaete worms in the marine environment and odonates15 in the freshwater environment, which can become dominant with increasing organic enrichment (Hiltner, 1996).
Low oxygen conditions also contribute to the increasing ammonia and hydrogen sulfide levels in marine waters and methane in both freshwater and marine environments, preventing most benthic species from surviving. In poorly circulating water bodies, a significant decline of dissolved oxygen and water quality may result.
In marine waters, the lack of oxygen often correlates with the presence of hydrogen sulfide. When oxygen is absent, a reduction of nitrates first occurs with the microbial breakdown of organic materials. When the nitrates and nitrites have been reduced, sulfate is reduced by bacteria. This leads to the formation of sulfides and hydrogen sulfide. Marine areas with oxygen deficiency and hydrogen sulfide concentrations are characterized by declining benthic species (Theede et al., 1969).
Sediment can also be affected by log rafting practices, from sunken bark to other wood fragments. The bark and other sunken materials decay, increasing the BOD, which leads to lower dissolved oxygen and can result in an anoxic layer forming along the bottom. Anaerobic decay can result in toxic sulfide compounds being produced. The bark also contains retene, a PAH. PAH levels have been found as high as 800 parts per million in Lake Washington log rafting operations (Burnett, 1991).
Oxygen uptake rates for the sediment at log dumping sites were 30 to 70 percent higher than at control areas (Hansen et al. 1971). The effects of fresh bark (100 percent bark coverage) in depths of up to 10 centimeters decreased oxygen concentrations at the sediment surface from about 10 mg/liter in control areas to 2.5 mg/liter (Pentec, 1997).
Dissolved oxygen in flow-through log ponds is often depleted during summer months when flows are low and the waters are warm. The effects of handling and rafting logs on water quality in rivers and sloughs depend on the intensity of such activity and flushing actions. The loss of bark during log dumping is a significant problem and gets worse when larger amounts of logs are handled and rafted. Flushing action from the water body may reduce degradation, or even transfer the problem to another area (Schuytema and Shankland, 1976).
Sulfides Sulfide, produced by the anaerobic decay of organic matter with sulfate as the electron acceptor, is common in sediment once oxygen is depleted from the sediment by aerobic bacteria. This occurs in the surface sediment with the depth depending on the presence of organic matter. In
15 Odonates are an order of insects that includes dragonflies (Anisoptera) and damselflies (Zygoptera).

Appendix B Impacts of Marine and Freshwater Organic Decay
B-6
marine sediment, sulfate reduction by sulfate-reducing bacteria is the dominant process, producing large amounts of sulfide by the decomposition of organic matter. Although sulfate concentrations in freshwater are much lower than in marine waters, high levels of sedimentary organic matter, particularly in lakes, are sufficient to produce measurable sulfides (Wang and Chapman, 1999).
Like other contaminants, the toxicity of sulfide is dependent on the pH. In anaerobic sediment, sulfide produced by sulfate reduction reacts with Fe2+ and Mn2+ to form iron and manganese sulfide solids. Studies show a strong potential for sulfide to cause toxicity in sediment, because sulfide concentrations in pore water are frequently higher than effects concentrations (Wang and Chapman, 1999).
Of the sulfides produced, some will remain in pore water as hydrogen sulfide and dissolved sulfide, and some will precipitate out as iron sulfides. In shallow systems, some will be oxidized to sulfur deposits. The amount of sulfide available in the pore water at any one time will be controlled by the:
• Rate at which sulfide is produced.
• Amount of disturbance in the sediment that allows hydrogen sulfide in the pore water to enter the water column where it is rapidly reoxidized to sulfate.
• Amount of iron present to form pyrite. Iron is expected to be limiting only if the bark accumulation is thick enough to act as a barrier between normal silts in the sediment and the zone of active sulfide production (Pentec, 1997).
Studies show that the rates of sulfate reduction in marine sediment can be highly variable. These rates can be dependent on the amount and biological availability of organic matter for microbial decomposition and the ability of this organic matter to be metabolized (Westrich and Berner, 1984).
Many metals form insoluble sulfide complexes in anaerobic marine sediment, reducing their bioavailability. Some metals, such as copper, zinc, silver, cadmium, lead, and mercury form not only solid sulfides under reducing conditions, but also strong complexes with sulfides (e.g., bisulfides, polysulfides, and organic thio complexes). The metal-polysulfide complexes may be soluble. As the sulfide concentration in sediment increases, the concentration of metals in solution within sediment pore water increases. These soluble metal sulfide complexes may diffuse upward to less reduced sediment layers where they may precipitate as sulfides or be oxidized to other metal salts or complexes, some of which are soluble and bioavailable (Neff, 2002).

Appendix B Impacts of Marine and Freshwater Organic Decay
B-7
Nitrogen and Ammonia Nitrogen is always present in aquatic ecosystems and most abundantly as a gas (Goldman and Horne, 1983). Nitrate is normally the most common form of combined inorganic nitrogen in freshwater lakes and streams and can come from natural changes in the vegetation of drainage basins caused by fires, floods, or artificial clearing. Even farming or logging without severe erosion release more nitrate than ammonia or phosphate to the environment (Goldman and Horne, 1983).
All waters contain both dissolved and particulate organic nitrogen, which are not available to higher organisms until modified by bacteria and fungi. Although oxygen is the preferred electron receptor for aerobic microbial metabolism, bacteria will use nitrates producing ammonia in anoxic conditions (Goldman and Horne, 1983). Ammonia, present in aquatic systems mainly as the dissociated ion ammonium, is a much more reactive compound than nitrate due to its higher chemical energy.
Inorganic nutrient cycling involves the chemical and biological change of many nitrogen, sulfur, and phosphorus compounds (Russo, 1985). Although ammonia is used by plants, nitrate is the principal inorganic nutrient used by rooted plants and algae because it is most easily assimilated. Much of the ammonia must be converted to nitrate through nitrification.
This conversion is regulated almost entirely by two groups of bacteria: Nitrosomonas species, which oxidizes the ammonia to nitrite, and Nitrobacter species, which oxidizes the nitrite to nitrate. In aquatic environments, the major nitrogen fixers are the cyanobacteria Nostoc and Anabaena. The nitrifying bacteria use the energy from nitrification to incorporate carbon dioxide. If these bacteria are killed or disturbed, the nitrogen cycle is significantly disrupted and can have long-lasting effects on the ecosystem’s productivity (Russo, 1985).
In marine waters, when oxygen is completely absent, a reduction of nitrates results from the bacterial breakdown of organic materials. When nitrates and nitrites are reduced, a corresponding reduction of sulfate occurs, leading to the formation of sulfides and hydrogen sulfide. In addition, smaller amounts of hydrogen sulfide are formed by the putrefication of protein, especially in soft sea beds, which are often poorly aerated (composed of silt, slime, mud) and are rich in sulfides and hydrogen sulfide gas (Theede et al., 1969).
Redox Potential Discontinuity (RPD)
Heterotrophic organisms16 in aerobic environments use oxygen as a powerful electron acceptor. These organisms metabolize organic compounds for their energy needs, producing carbon
16 Heterotrophic organisms are organisms using organic molecules for their chemical energy. They cannot synthesize their own food and must use complex organic substances for nutrition.

Appendix B Impacts of Marine and Freshwater Organic Decay
B-8
dioxide. In eukaryotic organisms,17 aerobic respiration occurs in the mitochondria. Aerobic respiration combines oxygen molecules and hydrogen ions to form water molecules. The internal membrane system efficiently captures the energy from this process for the organism’s energy needs (Schlesinger, 1997).
The redox potential, or oxidation state, is determined by the chemicals present in a given area. When an area has little oxygen available for use as an electron acceptor, the area is anoxic and has low redox potential (Schlesinger, 1997). When sufficient oxygen is available, it combines easily with other elements to form oxides, indicating a high redox potential for the area. For example, when enough soluble iron is present, ferric oxide will form an orange ocher layer on the bottom of lakes and streams (Goldman and Horne, 1983).
When metabolizing organic matter in sediment, bacteria rely on several oxidizing agents depending on sediment conditions. For example, the pH of the environment affects the redox potential established by many species of metal ions (Schlesinger, 1997). This aerobic respiration occurs as a series of redox reactions where one molecule (the reducing agent and the organic material in the sediment) loses an electron and another molecule (the oxidizing agent) accepts electrons.
Oxygen is the most common and highest energy-yielding electron acceptor and is preferred by microbes. Without oxygen, microbes will use alternate electron acceptors in the order of the amount of energy produced. The low energy production from reactions occurring at lower redox potential accounts for the inefficiency of anaerobic metabolism and the preservation of organic carbon in sediment (Schlesinger, 1997).
When microbes decompose wood particles, aerobic respiration pulls the oxygen out of both the pore water and the overlying water. Where pore water oxygen replacement is limited by slow transport or diffusion, anaerobic microbes use other compounds, although the energy available for metabolism is reduced. In sediment, nitrates are the next oxidizing agent to be used, producing ammonia. Manganese and then iron reduction follow, then sulfate reduction to sulfides, and finally the metabolism of small organic compounds to yield methane. This is why eliminating sediment oxygen leads to the creation of ammonia, hydrogen sulfide, and occasionally methane in sediment (Pentec, 1997; Schlesinger, 1997).
The RPD is the transitional area between oxygen-rich and oxygen-poor sediment. The surface (the oxidized layer) is often lighter in color than the deeper, reduced layer, which is often black from the reduced manganese. The depth of the RPD is influenced by sediment porosity, bioturbation, and the amount of organic material. Where organic loading exceeds the capacity of
17 Eukaryotic organisms are organisms whose cells contain complex structures enclosed within membranes. Most living organisms, including all animals, plants, fungi, and protists, are eukaryotes.

Appendix B Impacts of Marine and Freshwater Organic Decay
B-9
the microbial community to process the nutrients, the RPD may be at the sediment surface or only a few millimeters below the surface. This is common when wood waste has been deposited on the sediment. Sediment that supports a robust and diverse benthic community may have an RPD from 2 to 5 centimeters below the surface.
Metals Concentrations of metals found in wood residue leachate can exceed lethal concentrations for certain fish species and benthic invertebrates. A Remedial Investigation for Commencement Bay (Garman, 1996) measured potentially harmful concentrations of arsenic and zinc in the upper Hylebos Waterway before the removal of wood waste. The depleted oxygen content of the sediment, and the consequent changes in arsenic chemistry, may cause a release or threat of release of arsenic. Chemical changes can result from small changes in redox potential and can reduce arsenate to arsenite causing increased solubility, and increased mobility and bioavailability (Garman, 1996).
Arsenic has a complex marine biogeochemistry, with important implications for its bioavailability and toxicity to marine organisms and their consumers. Arsenate and arsenite are the dominant forms of inorganic arsenic in marine ecosystems. Concentrations of inorganic arsenic in some estuaries and coastal waters may be higher than those for the open ocean, reflecting both natural and anthropogenic inputs (Neff, 2002). In aerobic marine environments, arsenite is oxidized rapidly to arsenate, both abiotically and by bacteria. In hypoxic and anoxic waters, the reduced species of arsenic is favored thermodynamically.
The rate of arsenate reduction is slow. Most arsenate in anoxic estuarine and marine sediment results from the organic particles containing absorbed arsenate, advection of oxidized surface waters downward to the anoxic zone, and the slow rate of arsenate reduction. The relative proportions of the inorganic and organic arsenic in marine and estuarine waters depend on redox conditions, temperature, and the species composition and abundance of phytoplankton, yeasts, and bacteria present (Neff, 2002).
Salinity Marine surface salinity determines the water density. Water density influences circulation patterns and marine habitat conditions. Pacific Ocean waters entering Puget Sound through the Strait of Juan de Fuca as well as the freshwater from rivers and streams all influence the surface salinity within Puget Sound.
A dominant feature of the estuarine environment is the change in salinity. By definition, a salinity gradient exists at some point in an estuary. The pattern of that gradient varies seasonally with the topography of the estuary, the tides, and the volume of freshwater. Changes in salinity can affect the stratification of water bodies. Stratification regulates many biological and physical processes, including the timing of the spring phytoplankton bloom, mixing and flushing (Newton

Appendix B Impacts of Marine and Freshwater Organic Decay
B-10
et al., 2003). Seasonal changes in salinity in the estuary are usually the result of seasonal changes in evaporation and freshwater flow (Nybakken, 1988).
Buffering capacity is the ability of the solution to resist changes in pH. Saltwater versus freshwater buffering is different. The buffering system found in marine water differs from freshwater. The pH in marine waters drifts only slightly depending on varying conditions whereas the capacity of freshwater for buffering is reduced. Freshwater does not have the carbonate, borate, and associated high calcium and sulfate content of marine water that provides for the increased buffering. The pH drift happens readily in freshwater, depending on its chemical content and temperature. Higher buffering occurs in marine water as well as increased conductivity due to its mineral content (Goldman and Horne, 1983).
Waters with high pH and low alkalinity are usually unstable. If natural organic acids accumulate in unstable waters, the pH will quickly decline. For example, marine water can hold only a limited amount of additional dissolved solids. As alkalinity increases, less “room” is available for the saturation of other dissolved elements such as calcium. Without an incoming source of alkalinity, a buffering system can be exhausted when it has to neutralize too many acids (Odum, 1983).
Freshwater systems experience more daily changes in temperature and pH and do not have the buffering capacity of seawater. The accumulation of organic and inorganic acids, particularly the carbon dioxide levels evolved by plant and animal respiration during night hours, can significantly reduce a freshwater system’s pH due to its generally low buffering capacity (Nybakken, 1988). Marine systems do not experience this wide diurnal pH fluctuation because of their high buffering capacity.
Decomposition Byproducts Wood waste decays, leaches, and degrades into compounds toxic to aquatic life. Decaying wood can release tannic and fulvic acids, phenols and methylated phenols, resin acid, benzoic acid, benzyl alcohol, as well as terpenes and tropolones. Fulvic acids may act as a strong chelating agent to multivalent, positively charged metal ions (particularly in freshwater systems) thus potentially changing metabolic processes by selected benthic community organisms.
Several of these chemicals such as phenols, benzoic acid, and benzyl alcohol have SMS criteria because of documented adverse effects on aquatic life. Other byproducts have been determined through laboratory studies to be toxic to salmon and other fish. Different types of wood and bark leach different chemicals and show varying degrees of toxicity in laboratory bioassays (Kendall and Michelsen, 1997).
Leachate from logs and bark are 60-80 percent volatile organic substances and can turn water brown, create a biological and chemical oxygen demand in the water, and can be toxic to

Appendix B Impacts of Marine and Freshwater Organic Decay
B-11
organisms (Schaumburg, 1973). Varying but small amounts of nitrogen and phosphorous are also found in leachate.
Terpenoid β-pinene is a derivative of coniferous foliage and wood. It is an essential ingredient in turpentine and used as a component of fumigants and disinfectants. At the Hylebos Waterway cleanup site in Commencement Bay, the distribution of the terpenoid β-pinene was correlated with the distribution of the greatest wood waste coverage as determined by sediment profile imaging (SPI) (Striplin, 1997).
Resin acids are produced by coniferous trees and are found in sap or resin. Resin acids and terpenoids have fewer carbon chains and are more polar, which may contribute to their greater solubilities relative to PAHs. This allows the resin acids to be more bioavailable to organisms in the water column, with a likely exposure route of gill uptake. In Commencement Bay, the greatest resin acid concentrations were observed in those areas where the greatest amount of wood waste was present (Striplin, 1997).
Biological Impacts Although many ecological food web relationships have been known for years, many processes within ecosystems are still not fully understood. The basis of trophic dynamics is the transfer of energy from one part of the ecosystem to another. Decaying wood waste and resulting byproducts may alter ecological food web relationships through the production of chemical byproducts and the disruption of benthic communities.
Several studies at log transfer facilities confirm biological effects from wood waste:
• Reduced abundance and diversity of benthic suspension-feeding polychaetes and bivalves (Conlan and Ellis, 1979; Jackson, 1986).
• Reduced fitness and survival of bivalves (Freese and O’Clair, 1987).
• Reduced fecundity and increased egg mortality in the Dungeness crab (O’Clair and Freese, 1988).
Freshwater Bacteria and Fungi Wood waste can become fragmented and entrained in stream and river sediment through physical abrasion, microbial activity, and the activities of freshwater stream and river invertebrate fauna. At least initially, the tannins present in bark may inhibit microbial activity. After a time, tannins are leached out. Primary microbial activities include production of carbon dioxide and methane, anaerobic nitrogen fixation, and glucose uptake (Baker et al., 1983).

Appendix B Impacts of Marine and Freshwater Organic Decay
B-12
Algae and microbes attach to newly deposited wood, softening the outer layers and providing food for grazer and collector insects (Maser and Sedell, 1994). However, fungi are considered the main decomposer of submerged wood, breaking down leaf litter and wood in streams and mediating energy transfer to other trophic levels (Gulis et al., 2004; Guilis et al., 2008). Fungi are likely the most important biological driver of carbon dynamics and detritus-associated nutrient uptake in headwater streams (Guilis et al., 2008).
Marine Bacteria Several types of marine bacteria can be present where wood waste is found. Many species of marine bacteria can digest cellulose and are widely distributed in sediment (Maser and Sedell, 1994).
Organic loading from fine wood particle buildup (such as wood pulp and chips) in low energy environments may degrade benthic habitat and potentially lead to a decline in overlying water quality. These conditions may encourage bacterial mats, such as Beggiatoa spp. (a group of bacteria that use sulfur as an energy source), and are often characterized by a high oxygen demand and a thin or nonexistent RPD depth within the sediment column. When these bacteria have reduced the available sulfate, methane gas may increase in the sediment (this can be noted as bubbles in SPI images) (SAIC, 1999).
When growing in the presence of hydrogen sulfide and oxygen, Beggiatoa store granules of elemental sulfur inside their cells. In nature, the filaments only seem to grow where both these compounds are present. Because hydrogen sulfide is not stable in oxygenated waters, Beggiatoa habitat is limited to the transition zone between oxygenated and anoxic environments where both oxygen and hydrogen sulfide are available. Where these gradients are steep, Beggiatoa may form white mats of dense cell masses. They are restricted to shallow areas rich in decomposing organic material (Jørgensen, 1977).
Bacterial mat colonies can delay the recovery of degraded, organically overloaded sediment by creating a membrane over the surface sediment. The bacteria continue to feed off the sulfate source, keeping underlying sediment anoxic. Prey are effectively nonexistent and the low dissolved oxygen conditions are not tolerated by most fish species (SAIC, 1999).
Beggiatoa mats in shallow water have been described as indicators of anthropogenic organic enrichment and Elliot et al. (2006) showed that their presence indicated areas of increased organic enrichment from wood waste. If used as an indicator, Beggiatoa may not always be present on the sediment surface. It may only be visible on the sediment surface during periods of low oxygen levels in the overlying water column (Elliot et al., 2006). Beggiatoa are known to migrate daily, being more visible on the surface at night or during periods with low light levels. As mats of Beggiatoa occur in areas of low dissolved oxygen, the presence of these mats may also be useful in identifying sediment conditions that are harmful to seagrasses. Studies show

Appendix B Impacts of Marine and Freshwater Organic Decay
B-13
that seagrass growth, survival, photosynthesis, aerobic metabolism, and nutrient uptake are negatively affected by poor oxygen conditions and the presence of sulfides (Elliot et al., 2006; Goodman et al., 1995; Koch, 2001).
Marine Fungi In the aquatic environment, fungi are major decomposers of woody and herbaceous materials. Their importance lies in their ability to degrade lignocelluloses. Marine fungi appear able to tolerate low oxygen conditions and may be a leading cause of lignocellulose turnover in marine sediment (Hyde et al., 1998).
Research also suggests marine fungi and bacteria play a minor role in wood decomposition in the marine environment. Marine fungi, such as Fungi Imperfecti18 and Ascomycetes19 help decompose cellulose, but they are less efficient than their terrestrial counterparts. Most fungi that break down lignin affect only the surface layers of the wood (Gonor et al., 1988; Maser and Sedel, 1994). This may suggest that bacteria and fungi have combined roles as wood decomposers that have yet to be clearly defined.
The Aquatic Ecosystem Information on species extinctions or inventory lists is incomplete for benthic organisms in lakes, streams, and wetlands. These biota are estimated at more than 100,000 species of sediment invertebrates globally, 10,000 species of algae, and more than 20,000 species of protozoans and bacteria (Palmer et al., 2000). Disturbances, such as organic enrichment from wood waste decay, may speed up biodiversity loss and contribute to aquatic and riparian habitat degradation.
Limits of Distribution and Tolerance Organisms have ecological minimums and maximums for life-sustaining factors such as temperature, salinity, chemical composition, and oxygen. The range between these minimums and maximums represents the limits of tolerance. Although physical requirements may be well within the limits of tolerance for an organism, the organism may still fail. Additionally, organisms may have a wide range of tolerance for one factor and a narrower range for another factor. Principles of the Law of Tolerance include:
• Organisms may have a wide range of tolerance for one factor and a narrow range for another.
18 The Fungi Imperfecti, also known as Deuteromycota, are fungi that do not fit into the commonly established taxonomic classifications. 19 The Ascomycota are a division/phylum of the kingdom Fungi, and subkingdom Dikarya, whose members are commonly known as the Sac Fungi.

Appendix B Impacts of Marine and Freshwater Organic Decay
B-14
• Organisms with wide ranges of tolerance for all factors are likely to be the most widely distributed.
• When conditions are not optimum for a species with respect to one ecological factor, the limits of tolerance may be reduced for other ecological factors.
• Frequently, organisms do not actually live at their optimum range for particular physical factors. Sometimes other factors have greater importance.
• Reproduction is usually a critical time when environmental factors are most likely to be limiting. The limits of tolerance for reproductive individuals are usually narrower than for non-reproducing individuals.
The actual range of tolerance in nature is usually narrower than the potential range of activity (Odum, 1983). The range of extremes tolerated by the environment is often greater than the individual organism’s tolerance (Adolphson, 2009).
Communities Based on Limits of Tolerance Large quantities of wood waste can skew the limits of tolerance for many organisms. Wood waste can also exclude certain organisms incapable of tolerating minute changes in habitat.
A limiting factor is anything that makes it more difficult for a species to live, grow, or reproduce in its environment. To be limiting, a factor does not need to be lethal for a species. The limiting factor may simply make the species’ physiology or behavior less efficient so it is less able to reproduce or to compete with other species for food or living space (Cox and Moore, 1980).
Niche The habitat of an organism is the place where it lives or the place where one would go to find it. The ecological niche, however, includes not only the physical space occupied by an organism but also its ecological function and relationship with environmental gradients of temperature, pH, and other conditions of existence. Consequently, the ecological niche of an organism not only depends on where it lives but is also the sum total of its environmental requirements (Odum, 1983).
Limits of Community Development Many physical and biological factors affect organisms, but each factor can be considered as a gradient. For example, the physical factor of temperature affects species over a range from low temperatures at one extreme to high temperatures at the other. This makes up a temperature gradient.
Different species vary in their tolerance of environmental factors and are either ecologically tolerant or ecologically intolerant, but each species can function efficiently over only a limited

Appendix B Impacts of Marine and Freshwater Organic Decay
B-15
part of each gradient. Within this range of optimum, the species can survive and maintain a large population. Beyond it, toward the low and high ends of the gradient, the species suffers increasing physiological stress. It may stay alive, but because it cannot function efficiently, it can maintain only low populations (Cox and Moore, 1980).
Ecosystem Impacts Aquatic wood waste found at log handling sites may contribute to a decrease in benthic species diversity, abundance, and biomass. Most benthic organisms cannot survive the anoxic environment created by these conditions (Samis et al., 1999). Organisms such as bivalves, crustaceans, and polychaetes need access to the water column and can be negatively affected by wood waste deposits (Pease, 1974; Conlan and Ellis, 1979; Jackson, 1986; Freese and O’Clair, 1987; Pentec, 1997).
Wood waste in unstable areas such as marine intertidal zones or estuaries may be resuspended in the water column, potentially smothering benthic communities in nearby areas. A continuous layer of wood waste in aquatic habitats significantly impacts benthic organisms and may reduce fish productivity (Samis et al., 1999). In the Puget Sound area, important ecological and commercial fish populations, such as salmon, herring, and shellfish, could be affected.
Along with the decomposition of wood, fungal and bacterial growth may also affect fish and fish habitat. Water flow and oxygen exchange can be affected, endangering the survival of fish eggs and developing fish. Microbial growth can also directly harm the eggs and developing fish (Samis, 1999). It can also grow directly on the gills, making the fish more susceptible to water quality and habitat changes. The toxicity of wood waste and decay to aquatic invertebrates is important because these benthic organisms are food for fish. The availability of aquatic invertebrates may help determine the distribution and survival of individual fish and fish populations (Samis et al., 1999).
Fish migration may be physically affected by wood waste. Wood waste may impact the critical habitat in shallow, nearshore areas; these are areas often used by young fish. For example, herring need eelgrass beds to lay their eggs. Wood waste accumulation and decay can make the nearshore inhospitable to eelgrass, eliminating important potential herring spawning areas. The eggs and young fish can also be buried or suffocated by wood waste.
Interstitial water flow, which provides oxygen to incubating eggs and developing fish, can be changed by wood waste deposits, resulting in death or decreased growth. Delayed development in young fish, from decreased oxygen, lower temperatures, and lower water flow, can impair their future ability to reproduce (Samis et al. 1999).

Appendix B Impacts of Marine and Freshwater Organic Decay
B-16
Freshwater Benthic Community Freshwater sediment contains vast varieties of species that produce and process organic carbon. Some species have specific roles such as fixing or recycling nitrogen. Other species break down contaminants or mix sediment that change the rates of ecosystem processes. Because sediment biota often regulate biogeochemical changes that keep freshwater ecosystems functioning properly, protecting this biota is essential (Palmer et al., 1997).
In healthy freshwater sediment, benthic invertebrates are diverse and plentiful. Until unexpected changes happen, the fundamental importance of freshwater benthic invertebrates and species richness often go unnoticed. Physical, chemical, and biological processes can create significant and distinct microhabitats. Habitat complexity and biological relationships are important traits of biodiversity. Bioturbation and other interactions can create extensive complexity in freshwater sediment (Covich, 1999).
Freshwater Food Web Impacts The diversity and ecological roles of freshwater benthic species and their processes influence freshwater ecosystems. Some benthic species, such as crustaceans, can influence both energy flow through food webs and nutrient cycling. Sometimes the presence or absence of a single species may significantly alter ecological processes (Covich, 1999). Benthic invertebrates provide many essential ecosystem functions, such as decomposing organic matter. Some benthic species determine how organic matter is processed in freshwater ecosystems (Palmer et al., 1997; Covich, 1999).
In benthic communities, even closely related species may get their nutrients in different ways. The addition or loss of a single species can alter delicate food web dynamics or even whole ecosystems. In theory, if each ecosystem function was performed by only one species, the ecosystem should remain working. However, with constantly changing environmental conditions, some populations of the remaining species may become locally extinct, disrupting the ecosystem. Thus, an ecosystem composed of the bare minimum species, in a changing environment, would likely collapse (Covich, 1999).
Marine Water Benthic Community Marine benthic systems may consist of several habitat types, all linked through biological, chemical and physical processes to form a complex ecosystem. Species may use this entire ecosystem during their entire life cycle (Turner et al., 1999). Thus, the integrity of the entire ecosystem is very important.
Wood waste affects ecosystems including shellfish beds, complex food webs, and habitat. It can cover fish spawning beds and eliminate seagrasses used for spawning. It disrupts the natural sediment filters for organic substances and food webs as well as the balanced ecosystem that

Appendix B Impacts of Marine and Freshwater Organic Decay
B-17
keeps an aquatic community healthy. The depleted oxygen shown to exist at wood waste sites is a constant danger not only to fish populations but all other organisms.
Wood waste is particularly harmful to Dungeness crab habitat (Schuytema and Shankland, 1976). Dungeness crabs kept on bark had reduced survival, inhibited feeding, and deposited smaller egg clutches compared to Dungeness crabs on clean sand. Crabs from Alaskan log transfer facilities have shown ovarian necrosis. Lesions were found in nearly all crab organs and tissues from a log transfer facility. The study hypothesized that a chemical in the bark caused reduced numbers of fertile crabs (O’Clair and Freese, 1988).
The diversity of benthic species in shallow sand bed communities can significantly change when covered by bark debris. Communities shift from suspension-feeding organisms toward communities dominated by deposit feeders. (Freese and O’Clair, 1987).
Bioturbation is the turning and mixing of sediment by aquatic organisms. It helps keep the upper layers of sediment oxygenated as well as resuspends food particles (Palmer et al., 1997). Active bioturbation is associated with an active benthic community. Wood waste can keep water from circulating through sediment as well as physically keep aquatic organisms from the sediment, reducing or eliminating the bioturbation necessary for a healthy benthic community.
Seagrass Loss Seagrass communities support diverse and productive aquatic communities. These habitats offer protection and nutrients to many organisms, supporting faunal diversity, abundance, and biomass. Seagrass communities with greater habitat complexity are associated with increased abundance and lower mortality for fish larvae compared with other habitat types (Hughes et al., 2002).
Eelgrass (Zostera marina), a dominant species in North America, has been lost in many locations because of eutrophication and physical disturbances such as hurricanes, earthquakes, and overgrazing. The human activities responsible for seagrass loss involve changes in water quality or clarity. Such activities include nutrient and sediment loading from runoff and sewage disposal, dredging and filling, pollution, upland development, and some fishing practices (Short and Wyllie-Echeverria, 1996).
Eelgrass habitat availability and integrity can be a major determining factor for fish community structure. The decline and loss of eelgrass can affect many species, including both resident and nursery species. In sites with healthy eelgrass communities, the fish community structure shows relatively high abundance and species richness. In areas losing their eelgrass communities, fish populations may take three to five years to return to their former abundance and species richness (Hughes et al., 2002).

Appendix B Impacts of Marine and Freshwater Organic Decay
B-18
Seagrass can also be lost from manmade disturbances, such as dredging and filling, coastal development, pollution, nutrient and sediment loading from runoff, oil spills, and some fishing practices. Increased total organic carbon (TOC) as from wood waste deposits enhances the production of hydrogen sulfide during the microbial reduction of sulfate. Sulfides are known phytotoxins and high concentrations can negatively affect seagrass growth, and survival. Sulfide toxicity has been linked to seagrass die-offs (Elliott et al., 2006).

Appendix C References
C-1
Appendix C References
Adolphson, P., and McMillan, R. Personal communication, Washington Department of Ecology, Olympia, WA (2009).
Anderson, B.S., J.W. Hunt, B.M. Phillips, R. Fairey, J. Newman, H.M. Puckett, M. Stephenson, K.T. Taberski, and R.S. Tjeerdema. “Influence of Sample Manipulation on Contaminant Flux and Toxicity at the Sediment-Water Interface.” Marine Environmental Research, Vol. 51, 2001, pp. 191-211.
Babson, A.L., M. Kawase, and P. MacCready. “Seasonal and Interannual Variability in the Circulation of Puget Sound, Washington: A Box Model Study.” Atmosphere-Ocean, Vol. 44, No. 1, 2004, pp. 29-45.
Baker, J.H., R.Y. Morita, and N.H. Anderson. “Bacterial Activity Associated with the Decomposition of Woody Substrates in Stream Sediment.” Applied and Environmental Microbiology, 1983, pp. 516-521.
C. Ministry of Environment. Ambient Water Quality Criteria for Dissolved Oxygen. Prepared pursuant to Section 2(e) of the Environment Management Act, 1981. Water Mgmt Branch, Environ and Lands Headquarters Div, Ministry of Environment, Lands and Parks, 1997.
Burnett, M. Memo to Lucy Pebles, Bellingham Bay Action Team (BBAT). “The Effects of Log Rafting on Sediment and Benthic Organisms in Bellingham Bay.” Washington Department of Ecology, 1991.
Conlan, K.E., and D.V. Ellis. “Effects of Wood Waste on Sand-Bed Benthos.” Marine Pollution Bulletin, Vol. 10, 1979, pp. 262-267.
Covich, A.P., M.A. Palmer, and T.A. Crowl. “The Role of Benthic Invertebrate Species in Freshwater Ecosystems.” Bioscience, Vol. 49, 1999, pp.119-127.
Cox, C.B., and P.D. Moore. Biogeography: An Ecological and Evolutionary Approach. New York: John Wiley and Sons, 1980, pp. 234.
Culverwell, H. Cliffside Beach Wood Waste Cleanup Background Document. Puget Sound Action Team. Bellingham, WA, 2006.
Department of Ecology. Industrial Stormwater General Permit Implementation Manual for Log Yards. Washington Department of Ecology. Publication #04-10-031, 2004.
Appendix C References
C-2
Department of Ecology. “Sediment Sampling and Analysis Plan Appendix (SAPA): Guidance on the Development of Sediment Sampling and Analysis Plans Meeting the Requirements of the Sediment Management Standards (Chapter 173-204 WAC).” Washington Department of Ecology Publication No. 03-09-043, Revised 2008.
Department of Ecology, “Draft Sediment Cleanup Users Manual II: Guidance on Implementing the Cleanup Provisions of the Sediment Management Standards Chapter 173-204 WAC.” Washington Department of Ecology Publication No. 12-09-057, Revised 2013.
Elliott, J.K., E. Spear, and S. Wyllie-Echeverria. “Mats of Beggiatoa Bacteria Reveal that Organic Pollution from Lumber Mills Inhibits Growth of Zostera Marina.” Marine Ecology, Vol. 27, 2006, pp. 372-380.
Ellis, R.J. “Preliminary Biological Survey of Log Rafting and Dumping Areas in Southeastern Alaska.” MFR Paper 980. Marine Fisheries Review, Vol. 35, 1973, No. 5-6, NOAA, Washington D.C.
Faris, T.L., and K.D. Vaughan. “Log Transfer and Storage Facilities in Southeast Alaska: a Review.” Gen. Tech. Rep. PNW-174. Portland, OR: USDA, Forest Service, PNW Forest and Range Experiment Station, 1985.
Floyd and Snider. Hylebos Waterway Wood Waste Program: Compliance Monitoring Plan. Draft Final. Prepared for the Hylebos Waterway Wood Waste Group, June 2000.
Freese, J., and C.E. O’Clair. “Reduced Survival and Condition of the Bivalves Protothaca Staminea and Mytilus Edulis Buried by Decomposing Bark.” Marine Environmental Research, Vol. 23, 1987, pp. 49-64.
Memo to A. Hiltner, USEPA RPM. “Regulation of Wood Waste in Hylebos Waterway: Pertinent Aspects of Arsenic Chemistry.” NOAA CRC Tech Support, Seattle, WA (January 25, 1996).
Germano, J.D., and D.G. Browning. “Marine Log Transfer Facilities and Wood Waste: When Dredging Is Not Your Final Answer.” In R.E. Randall (ed) Proceedings of the Western Dredging Association Twenty-Sixth Technical Conference. June 25-28, 2006, San Diego, CA. Center for Dredging Studies, College Station, TX.
Goldman, C.R., and A.J. Horne. Limnology. New York: McGraw-Hill, 1983, pp. 464.
J., J.R. Sedell, and P.A. Benner. “What We Know About Large Trees in Estuaries, in the Sea, and on Coastal Beaches.” In ed. C. Maser, R.F. Tarrant, J.M. Trappe, and J.F. Franklin, From the Forest to the Sea: A Story of Fallen Trees, Gen. Tech. Rep. PNW-GTR-229. Pacific Northwest Research Station, USDA, Forest Service, 1988, pp. 83-112.
Appendix C References
C-3
Goodman, J.L., K.A. Moore, and W.C. Dennison. “Photosynthetic Responses of Eelgrass (Zostera marina L.) to Light and Sediment Sulfide in a Shallow Barrier Island Lagoon.” Aquatic Botany, Vol. 50, No. 1, 1995, pp. 37-47. DOI:10.1016/0304-3770(94)00444-Q.
Gulis, V., A.D. Rosemond, K. Suberkropp, H.S. Weyers, and J.P. Benstead. “Effects of Nutrient Enrichment on the Decomposition of Wood and Associated Microbial Activity in Streams.” Freshwater Biology, Vol. 49, 2004, pp. 1437-1447.
Gulis, V., K. Suberkropp, and A.D. Rosemond. “Comparison of Fungal Activities on Wood and Leaf Litter in Unaltered and Nutrient-Enriched Headwater Streams.” Applied Environmental Microbiology, 2008, pp.1094-1101.
Hansen, G., G. Carter, W. Towne, and G. O’Neal. “Log Storage and Rafting in Public Waters.” Task Force Report for PNW Pollution Control Council, GPO 795-464, 1971, pp. 56.
Hiltner, A.L. Memo to Leroy Loiselle, Unit Manager and CB/NT Site File. Issue Paper on Wood Waste Communication, Hylebos Waterway Problem Areas; Commencement Bay Nearshore/Tideflats Superfund Site; Tacoma, WA, USEPA Region 10, Seattle, WA (1996).
Hughes, J.E., L.A. Deegan, J.C. Wyda, M.J. Weaver, and A. Wright. “The Effects of Eelgrass Habitat Loss on Estuarine Fish Communities in Southern New England.” Estuaries, Vol. 25, No. 2, 2002, pp. 235-249.
Hyde, K.D., E.B.G. Jones, E. Leano, S.B. Pointing, A.D. Poonyth, and L.L.P. Vrijmoed. “Role of Fungi in Marine Ecosystems.” Biological Conservation, Vol. 7, 1998, pp. 1147-1161.
Jackson, R.G. “Effects of Bark Accumulation on Benthic Infauna at a Log Transfer Facility in Southeast Alaska.” Marine Pollution Bulletin, Vol. 17, No. 6, 1986, pp. 258-262.
Jørgensen, B.B. “Distribution of Colorless Sulfur Bacteria (Beggiatoa species) in Coastal Marine Sediment.” Marine Biology, Vol. 41, pp.19-28.
Kathman, R.D, S.F. Cross, and M. Waldichuk. “Effects of Wood Waste on the Recruitment Potential of Marine Benthic Communities.” Canadian Tech Report: Fisheries and Aquatic Sciences, Vol. 1284, 1984, pp. 50.
Kendall, D., and T. Michelsen. 1997. “Management of Wood Waste under Dredged Material Management Programs (DMMP) and the Sediment Management Standards (SMS) Cleanup Program.” Seattle District, ACOE, and Washington Department of Ecology.
Kirk-Othmer. Kirk-Othmer Encyclopedia of Chemical Technology, 4th ed., Vol. 25. John Wiley and Sons, 1998, pp. 627-664.

Appendix C References
C-4
Kirkpatrick, B., T.C. Shirley, and C.E. O’Clair. “Deep-water Bark Accumulation and Benthos Richness at Log Transfer and Storage Facilities.” Alaska Fisheries Research Bulletin, Vol. 5, No. 2, 1998, pp. 103-115.
Koch, E. “Beyond Light: Physical, Geological, and Geochemical Parameters as Possible Submersed Aquatic Vegetation Habitat Requirements.” Estuaries and Coasts, Vol. 24, No. 1, 2001, pp. 1-17. DOI:10.1007/BF02693942.
Liu, S.D., M.D. Nassichuk, and S.C. Samis. Guidelines on Storage, Use and Disposal of Wood Residue for the Protection of Fish and Fish Habitat in British Columbia. DOE/DFO FRAP Report 95-18, Environment Canada/Fisheries and Oceans, BC, 1996.
Lorang, M.S., and J.A. Stanford. “Variability of Shoreline Erosion and Accretion within a Beach Compartment of Flathead Lake, Montana.” Limnology and Oceanography, Vol. 38, No. 8, 1993, pp.1783-1795.
Maser, C., and J.R. Sedell. “From the Forest to the Sea: The Ecology of Wood in Streams, Rivers, Estuaries, and Oceans.” Delray Beach, FL: St. Lucie Press, 1994, pp. 200.
McMillan, R. Memo to Piper Peterson-Lee, USEPA Region 10. Commencement Bay Nearshore/Tideflats Superfund Site, Thea Foss/Middle Waterway Log Haul Out Best Management Plan and Monitoring Approach. Washington Department of Ecology, Olympia, WA (November 21, 2001).
McMillan, R. Memo to Mark Mauren, Department of Natural Resources Review and Preliminary Comments on Sampling Plan for Foss Lease. Washington Department of Ecology, Olympia, WA (July 22, 2004).
McMillan, R. Email to Kim Schmanke. “Lumber Mill Legacy – Wood in Water is a Problem?” Letter to the editor. Washington Department of Ecology, Olympia, WA (2007).
Neff, J.M. Bioaccumulation in Marine Organisms – Effect of Contaminants from Oil Well Produced Water. Amsterdam: Elsevier, 2002, pp. 452.
Newton, J.A., E. Siegel, and S.L. Albertson. “Oceanographic Changes in Puget Sound and the Strait of Juan de Fuca during the 2000-01 Droughts.” Canadian Water Research Journal, Vol. 28, No. 4, 2003, pp. 715-728.
Nybakken, J.W. Marine Biology: An Ecological Approach. 2nd ed. New York: Harper and Row, 1988.

Appendix C References
C-5
O’Clair, C.E., and J.L. Freese. “Reproductive Condition of Dungeness Crabs, Cancer magister, at or near Log Transfer Facilities in Southeastern AK.” Marine Environmental Research, Vol. 26, 1988, pp. 57-81.
Odum, E.P. Basic Ecology. Philadelphia: Saunders College Publishing, 1983.
Palmer, M.A., A.P. Covich, B.J. Finlay, J. Gilbert, K.D. Hyde, R.K. Johnson, T. Kairesalo, P.S. Lake, C.R. Lovell, R.J. Naiman, C. Ricci, F. Sabater, and D. Strayer. “Biodiversity and Ecosystem Processes in Freshwater Sediment.” Ambio: A Journal of the Human Environment, Vol. 26, 1997, pp. 571-577.
Palmer, M.A., A.P. Covich, S. Lake, P. Biro, J.J. Brooks, J. Cole, C. Dahm, J. Gibert, W. Goedkoop, K. Martens, J. Verhoeven, and W.J. Van de Bund. “Linkages between Aquatic Sediment Biota and Life Above Sediment as Potential Drivers of Biodiversity and Ecological Process.” Bioscience, Vol. 50, No. 12, 2000, pp. 1062-1075.
Patmont, C., and M. Palermo. “Case Studies: Environmental Dredging Residuals and Management Implications.” Paper D-066 in Remediation of Contaminated Sediment-2007: Proceedings of the 4th International Conference on Remediation of Contaminated Sediment, January 2007, Savannah, GA. Columbia, OH: Battelle Press, 2007.
Pease, B.C. “Effects of Log Dumping and Rafting on the Marine Environment of Southeast Alaska.” USDA Forest Service General Tech Report 22, PNW Forest and Range Experiment Station, Portland, OR, 1974, pp. 58.
Pentec Environmental. Port of Everett Marine Terminal Sediment Studies, Vol. 1: Barge Berth Puget Sound Dredged Disposal Analysis and Sediment Management Standards Sediment Characterization. Project No. 21-045. Pentec Environmental, Inc. Edmonds, WA, 1994.
Pentec Environmental. “Review of the Significance of Log Handling and Wood Waste in the Marine Environment.” Prepared for: The Hylebos Wood waste Group. By: Pentec Environmental Inc., Edmonds, WA and Floyd and Snider Inc., Seattle, WA, 1997.
Power E.A., and T.G. Northcote. “Effects of Log Storage on the Food Supply and Diet of Juvenile Sockeye Salmon.” North American Journal of Fish Management, Vol. 11, 1991, pp. 413-423.
PSEP. Recommended Protocols for Measuring Conventional Sediment Variables in Puget Sound. Final Report. Prepared for USEPA, Seattle, WA, 1986.
Russo, R.C. “Ammonia, Nitrite, and Nitrate.” Fundamentals of Aquatic Toxicology, G.M. Rand and S.R. Petrocelli (eds). New York: Hemisphere Publishing, 1985, pp. 455-471.
Appendix C References
C-6
SAIC. Port Angeles Harbor Wood Waste Study, Port Angeles, Washington, Final. Prepared for: Washington State Department of Ecology by SAIC, Bothell, WA, 1999, pp. 41.
Samis, S.C., S.D. Liu, B.G. Wernick, and M.D. Nassichuk. “Mitigation of Fisheries Impacts from the Use and Disposal of Wood Residue in British Columbia and the Yukon.” Canadian Technical Reports of Fisheries and Aquatic Sciences, Vol. 2296, No. 8, 1999, pp. 91.
Schaumberg, F.D. “The Influence of Log Handling on Water Quality.” USEPA Rpt EPA-R2-73-085. Washington, DC, 1973, Pp, 105.
Schlesinger, W.H. Biogeochemistry: An Analysis of Global Change., 2nd ed. San Diego, CA: Academic Press, 1997.
Schubel, J.R., and V.S. Kennedy. “The Estuary as a Filter: An Introduction.” In V.S. Kennedy (ed), The Estuary as a Filter. Orlando, FL: Academic Press, 1984.
Schultz, R.D., and R.J. Berg. “Some Effects of Log Dumping on Estuaries.” Alaska Region Environmental Assessment Division Processed Report, NMFS Juneau, AK, 1976.
Schuytema, G.S., and R.D. Shankland. “Effects of Log Handling and Storage on Water Quality.” USEPA-600/2-76-262, Industrial Environmental Research Laboratory, Office of Research and Development, USEPA, Cincinnati, OH, 1976.
Short, F.T., and S. Wyllie-Echeverria. “Natural and Human-induced Disturbance of Seagrasses.” Environmental Conservation, Vol. 23, No. 1, 1996, pp. 17-27.
Striplin Environmental Associates, Inc. Hylebos Waterway Pre-Remedial Design Program – Round 1 Data Report, Public Review Draft. May 19, 1997. Prepared for the Hylebos Cleanup Committee.
Theede H., A. Ponat, K. Hiroki, and C. Schlieper. “Studies on the Resistance of Marine Bottom Invertebrates to Oxygen-deficiency and Hydrogen Sulphide.” Marine Biology, Vol. 2, 1969, pp. 325-337.
Turner, S.J., S.F. Thrush, J.E. Hewitt, V.J. Cummings, and G. Funnell. “Fishing Impacts and the Degradation or Loss of Habitat Structure.” Fisheries Management and Ecology ,Vol. 6, pp. 401-420.
USEPA. Contaminated Sediment Remediation Guidance for Hazardous Waste Sites. Office of Solid Waste and Emergency Response, OSWER 9355.05-85. EPA-540-R-05-012, December 2005.

Appendix C References
C-7
Wang, F., and P.M. Chapman. “Biological Implications of Sulfide in Sediment – a Review Focusing on Sediment Toxicity.” Environmental Toxicology and Chemistry, Vol. 18, No. 11, 1999, pp. 2526-2532.
Westrich, J.T., and R.A. Berner. “The Role of Sedimentary Organic Matter in Bacterial Sulfate Reduction: the G Model Tested.” Limnology and Oceanography, Vol. 29, No. 2, 1984, pp. 236-249.