wood infill walls in reinforced concrete frame structures
TRANSCRIPT
Western University Western University
Scholarship@Western Scholarship@Western
Electronic Thesis and Dissertation Repository
9-24-2012 12:00 AM
Wood Infill Walls in Reinforced Concrete Frame Structures: A Wood Infill Walls in Reinforced Concrete Frame Structures: A
Wood/concrete Construction Niche Wood/concrete Construction Niche
Jeffrey R. L. Blaylock, The University of Western Ontario
Supervisor: Prof. F. M. Bartlett, The University of Western Ontario
A thesis submitted in partial fulfillment of the requirements for the Master of Engineering
Science degree in Civil and Environmental Engineering
© Jeffrey R. L. Blaylock 2012
Follow this and additional works at: https://ir.lib.uwo.ca/etd
Recommended Citation Recommended Citation Blaylock, Jeffrey R. L., "Wood Infill Walls in Reinforced Concrete Frame Structures: A Wood/concrete Construction Niche" (2012). Electronic Thesis and Dissertation Repository. 888. https://ir.lib.uwo.ca/etd/888
This Dissertation/Thesis is brought to you for free and open access by Scholarship@Western. It has been accepted for inclusion in Electronic Thesis and Dissertation Repository by an authorized administrator of Scholarship@Western. For more information, please contact [email protected].
i
WOOD INFILL WALLS IN
REINFORCED CONCRETE FRAME STRUCTURES:
A WOOD/CONCRETE CONSTRUCTION NICHE
(Spine title: Wood Infill Walls in Reinforced Concrete Frame Structures)
(Thesis Format: Monograph)
By
Jeffrey R. L.
Blaylock
Graduate Program in
Civil and Environmental Engineering
A thesis submitted in partial fulfillment
of the requirements for the degree of
Master of Engineering Science
The School of Graduate and Postdoctoral Studies
Western University
London, Ontario, Canada
September 2012
© Jeffrey R. L. Blaylock, 2012

ii
WESTERN UNIVERSITY SCHOOL OF GRADUATE AND POSTDOCTORAL STUDIES
CERTIFICATE OF EXAMINATION
______________________________
Supervisor
Dr. F. Michael Bartlett
______________________________
Examiners
Dr. Maged A. Youssef
______________________________
Dr. George K. Knopf
______________________________
Dr. Hanping Hong
The thesis by
Jeffrey R. L.
entitled:
Blaylock
Wood Infill Walls in Reinforced Concrete Frame Structures: A Wood/concrete Hybrid Construction Niche
is accepted in partial fulfilment of the
requirements for the degree of
Master of Engineering Science
Date__________________________ _______________________________
Chair of the Thesis Examination Board
iii
ABSTRACT
This thesis investigated light-frame wood/concrete hybrid construction as part of the
NSERC Strategic Network on Innovative Wood products and Building Systems
(NEWBuildS). A review of eight wood/concrete niche areas identified three with
potential to be used in mid- to high-rise structures. Light-frame wood structures of seven
or more storeys with wood/concrete hybrid flooring seem to have little feasibility unless a
concrete lateral-load-resisting system is provided and material incompatibilities are
solved. Non-load-bearing light-frame wood infill walls in reinforced concrete frame
structures were recognized to have potential feasibility in mid- to high-rise structures. A
full-scale, single frame test apparatus was successfully designed and constructed at the
Insurance Research Lab for Better Homes. The frame is statically loaded to accurately
replicates realistic horizontal sway and vertical racking deformations of a typical eight
storey reinforced concrete frame structure at SLS and ULS. A linear-elastic analysis of
the test apparatus was generally able to predict the results during testing. The 2.4m x
4.8m (8 ft. x 16 ft.) infill wall specimen did not satisfy serviceability deflection
limitations of L/360 when subjected to representative out-of-plane wind pressures of
+1.44/-0.9 kPa. The out-of-plane response was not significantly affected by horizontal
sway deflections of +/-7.2mm or vertical racking deflections of +9.6mm. Although a
nominal 20mm gap was provided to isolate the wall from the surrounding frame,
insulation foam sprayed in the gap facilitated load transfer between them.
Keywords: Wood/Concrete Hybrid, Light-frame Wood, Infill Wall, Reinforced Concrete Frame Structure.

iv
ACKNOWLEDGEMENTS
First and foremost, I would like to thank Prof. F. Mike Bartlett for his supervision. His
guidance, expertise and insights have been invaluable throughout this project.
I would like to thank Andrew Klazinga for all his assistance during the construction and
testing phase. I would also like to thank Wilbert Logan for his insights throughout the
design and construction phase and Jared Harnish for his help during the final testing
phase.
I would also like to recognize the people who participated in the various thesis-related
discussions, both large and small, with special thanks to Daniel Grenier, Randy Van
Straaten, and my colleagues in the Grad Addition.
I would also like to acknowledge the NSERC Strategic Network on Innovative Wood
Products and Building Systems (NEWBuildS) for funding this research.
v
TABLE OF CONTENTS
PAGE
Certificate of Examination...................................................................................................ii
Abstract and Keywords......................................................................................................iii
Acknowledgements.............................................................................................................iv
Table of Contents................................................................................................................v
List of Figures ..................................................................................................................viii
List of Tables .....................................................................................................................xi
List of Appendices ...........................................................................................................xiii
Nomenclature....................................................................................................................xiv
1 INTRODUCTION ........................................................................................................ 1
1.1 Overview ..................................................................................................................... 1
1.1.1 Introduction ....................................................................................................... 1
1.1.2 ComplEmentary Materials ................................................................................ 2
1.1.3 Potential Benefit................................................................................................ 4
1.2 NEWBuildS ................................................................................................................. 6
1.3 Research Objectives .................................................................................................... 7
1.4 Outline of Thesis ......................................................................................................... 8
2 NICHE AREAS FOR MID-RISE LIGHT-FRAME WOOD/CONCRETE HYBRID CONSTRUCTION ......................................................................................... 10
2.1 Introduction ............................................................................................................... 10
2.1.1 Objective ......................................................................................................... 10
2.1.2 Defining Terms ............................................................................................... 10
2.2 Evaluation of Niche Areas ........................................................................................ 11
2.2.1 Scope ............................................................................................................... 11
2.2.2 Light-Frame Wood Structure .......................................................................... 12
2.2.3 Wood Structure with Wood/Concrete Floor Systems ..................................... 13
2.2.4 Wood Structure with Concrete Foundation and Lower Storeys ..................... 15
vi
2.2.5 Wood Structure with Concrete Lateral-load-resisting System ....................... 16
2.2.6 Hybrid Structures with Compartmentalization ............................................... 16
2.2.7 Reinforced Concrete Structures with Wood/Concrete Floor Systems ............ 17
2.2.8 Reinforced Concrete Structure with a Wood Roof or Wood Upper Storeys .. 18
2.2.9 Reinforced Concrete Structure with Interior Wood Partition Walls ............... 19
2.2.10 Reinforced Concrete Structure with Exterior Light-frame Wood Infill Walls 19
2.3 Assessment of Potential Niches ................................................................................ 20
2.3.1 Approach ......................................................................................................... 20
2.3.2 Wood Structure with Wood/Concrete Floor System ...................................... 21
2.3.3 Wood Structure with Concrete Lateral-Load-Resisting System ..................... 32
2.3.4 Reinforced Concrete Structure with Light-frame Wood Infill Walls ............. 34
2.4 Summary and Conclusion ......................................................................................... 36
3 TEST DESIGN AND CONSTRUCTION ................................................................ 40
3.1 Objective ................................................................................................................... 40
3.2 Prototype Structure .................................................................................................... 41
3.2.1 Idealization ...................................................................................................... 42
3.2.2 Loading Assumptions ..................................................................................... 43
3.2.3 Principal In-plane Deflections ........................................................................ 44
3.3 Test Apparatus ........................................................................................................... 51
3.3.1 Objective and Constraints ............................................................................... 51
3.3.2 Final Design .................................................................................................... 53
3.3.3 Design and Construction Challenges .............................................................. 61
3.4 Wood Infill Wall Specimen ....................................................................................... 66
3.4.1 Criteria ............................................................................................................ 66
3.4.2 Connection Design Concept ........................................................................... 69
3.4.3 Construction .................................................................................................... 76
3.4.4 Modelling ........................................................................................................ 77
3.5 Summary and Conclusions ........................................................................................ 78
vii
4 EXPERIMENTAL PROGRAM AND RESULTS .................................................. 80
4.1 Overview ................................................................................................................... 80
4.2 Out-of-plane Test 1 ................................................................................................... 81
4.2.1 Procedure ........................................................................................................ 81
4.2.2 Instrumentation ............................................................................................... 83
4.2.3 Performance of Specimen ............................................................................... 85
4.2.4 Performance of Test Apparatus ...................................................................... 94
4.3 Lateral Sway Tests .................................................................................................... 97
4.3.1 Instrumentation ............................................................................................... 97
4.3.2 Performance of Test Apparatus ...................................................................... 98
4.3.3 Performance of Specimen ............................................................................. 107
4.4 Vertical Racking Tests ............................................................................................ 111
4.4.1 Performance of Test Apparatus .................................................................... 112
4.4.2 Performance of Specimen ............................................................................. 118
4.5 Out-of-plane Test 2 and 3 ........................................................................................ 121
4.5.1 Effect of Vertical Racking Test .................................................................... 121
4.5.2 Effect of Lateral Sway Test .......................................................................... 121
4.6 Summary and Conclusions ...................................................................................... 123
4.6.1 Out-of-Plane Pressure Test 1 ........................................................................ 123
4.6.2 Lateral Sway Test ......................................................................................... 124
4.6.3 Vertical Racking Test ................................................................................... 125
4.6.4 Out-of-Plane Pressure Tests 2 and 3 ............................................................. 126
5 SUMMARY AND CONCLUSIONS ....................................................................... 127
5.1 Summary ................................................................................................................. 127
5.2 Conclusions ............................................................................................................. 128
5.3 Suggestions for Future Work .................................................................................. 131
REFERENCES .............................................................................................................. 133
CURRICULUM VITAE ............................................................................................... 171

viii
LIST OF FIGURES
PAGE
Figure 1-1 - Section of a Feasible Light-frame Wood/concrete Mid-rise Structure ........................ 5
Figure 2-1 - Spectrum of Potential Wood/concrete Hybrid Systems ............................................. 12
Figure 2-2 - Conceptual 16 storey Wood/concrete Hybrid Building (Smith, 2008b) .................... 17
Figure 2-3 - Load Arrangement for Maximum Internal Reaction ................................................. 22
Figure 2-4 - Tributary Area for a Wall .......................................................................................... 23
Figure 2-5 - Results for Case 1: Wood Structure under Residential Occupancy ........................... 29
Figure 2-6 - Results for Case 3: Wood Structure with Light-weight Concrete and Wood
Composite Flooring under Residential Occupancy ............................................................... 29
Figure 3-1 - Summary of Prototype Structure ............................................................................... 42
Figure 3-2 - Principal In-plane Deflections ................................................................................... 45
Figure 3-3 - Sway Deformation of the Prototype Structure at SLS and ULS ................................ 46
Figure 3-4 - Sway Deflection Limits for Critical Frame ............................................................... 47
Figure 3-5 - Vertical Creep Deformation of Exterior and Interior Columns at SLS and ULS ...... 48
Figure 3-6 - Vertical Creep Deformation Limits for Critical Frame ............................................. 49
Figure 3-7 - Mid-span Deflection of Critical Beam ....................................................................... 50
Figure 3-8 - Load Cases Investigated: a) In-plane; b) Out-of-plane .............................................. 51
Figure 3-9 - Final Test Apparatus: a) As Designed; b) As Constructed at IRLBH ....................... 54
Figure 3-10 - General Layout of Test Apparatus with Instrumental Grid System ......................... 55
Figure 3-11 - Test Apparatus Details for SAP Model ................................................................... 56
Figure 3-12 - Prototype Deflections vs. Test Apparatus Deflections for Lateral Racking ............ 58
Figure 3-13 - Prototype Deflections vs. Test Apparatus Deflections for Vertical Racking ........... 60
Figure 3-14 - Out-of-Plane Pressure Loading System ................................................................... 61
Figure 3-15 - As-built Variation from Designed Concrete Frame Dimensions ............................. 62
Figure 3-16 - Corner Reinforcement Detailing: a) Top View; b) Front View; c) As Constructed 63
ix
Figure 3-17 - Connection Detailing at Base of Concrete Frame: a) Front View; b) Side View
During Lateral Sway Test; c) Side View During Vertical Racking Test .............................. 64
Figure 3-18 - Concrete Frame to Steel Frame Connection and Jack Locations ............................. 65
Figure 3-19 - As-built Concrete Frame with Airbag and Back Panel ............................................ 66
Figure 3-20 - Degrees of Inset of an Infill Wall: a) Not Inset; b) Partially Inset; c) Fully Inset ... 67
Figure 3-21 - Type and Location of Connections for Infill Wall System ...................................... 70
Figure 3-22 - Cross Sections of Top Connections: (a) Partially Prefabricated Wood Wall; (b)
Light-gauge Steel Wall; (c) Fully Prefabricated Wood Wall. ............................................... 71
Figure 3-23 - Initial Bottom Connection Design: (a) Cross Section; (b) Deformed Shape for
Positive Wind Pressure; (c) Deformed for Negative Wind Pressure. ................................... 73
Figure 3-24 - Modified Bottom Connection with Shim: (a) Cross Section; (b) Shim. .................. 74
Figure 3-25 - Final Wall Design .................................................................................................... 75
Figure 3-26 - Final Gap Dimensions .............................................................................................. 77
Figure 4-1 - Pressure Loading Trace .............................................................................................. 82
Figure 4-2 - Details of Pre-pressure Phase ..................................................................................... 83
Figure 4-3 - Out-of-Plane LVDT Locations .................................................................................. 84
Figure 4-4 - LVDT Location and Points of Rotation at Bottom Connection ................................. 86
Figure 4-5 - Deformation of Bottom Plate With Respect to Shim Deflections ............................. 89
Figure 4-6 - Midheight Deflection of Infill Wall ........................................................................... 91
Figure 4-7 - Comparison of Tests 1.1, 1.2 and 1.3 at points a) T5; b) B5 and c)M5 ..................... 93
Figure 4-8 - Net Deflections at: a) Mid-height of Column; b) Midspan of Beam ......................... 96
Figure 4-9 - In-plane Instrumentation Location and Test Apparatus Details ................................ 98
Figure 4-10 - Lateral Sway Response at SLS ................................................................................ 99
Figure 4-11 - Lateral Sway Pull Test Response at SLS and ULS ................................................ 101
Figure 4-12 - Steel Frame Displacement for Average Push Test 1 and 2 Results at SLS ........... 102
Figure 4-13 - Steel Frame Displacement for Avg. Pull Test 1/2 at SLS and Test at ULS ........... 103
x
Figure 4-14 - Deflected Shape of Concrete Frame under Lateral Sway Loading ........................ 104
Figure 4-15 - Notation for Gap Change and Wall Movement .................................................... 108
Figure 4-16 - Change in Gap at Top Right Corner for Lateral Sway Loading at SLS ................ 111
Figure 4-17- Observed and Predicted Response due to Vertical Racking at SLS and ULS ........ 113
Figure 4-18 - Response of Steel Frame During Vertical Racking Test at ULS ........................... 115
Figure 4-19- Deflected Shape of Concrete Frame under Vertical Racking ................................. 117
Figure A-1 - Results for Case 2: Wood Structure with Light-weight Concrete Topping under
Residential Loading..............................................................................................................139
Figure A-2 - Results for Case 4: Wood Structure with Light-weight Concrete Slab under
Residential Loading..............................................................................................................139
Figure A-3 - Results for Case 5: Wood Structure with Normal-weight Concrete and Wood
Composite Flooring under Residential Loading...................................................................140
Figure A-4 - Results for Case 6: Wood Structure with Light-weight Concrete and Wood
Composite Flooring under Business Loading.......................................................................140
Figure A-5 - Results for Case 7: Wood Structure with Normal-weight Concrete and Wood
Composite Flooring under Business Loading.......................................................................141
Figure B-1 - Pressure Cases for the Loading on Exterior Cladding.............................................144
Figure E-1 - Predicted Applied Moments under Loading at ULS................................................151
Figure G-1 - In-plane Design Forces for Test Apparatus.............................................................160
Figure H-1 - Lifting Connection Attached to Infill Wall..............................................................162
Figure H-2 - Lifting of the Infill Wall..........................................................................................163
Figure I-1 - Out-of-plane Infill Wall Deflection: a) Original Position; b) Case 1; c) Case 2......166
Figure J-1 - Out-of-Plane Test LVDT..........................................................................................170
Figure J-2 - In-Plane Test LVDT.................................................................................................170
xi
LIST OF TABLES
PAGE
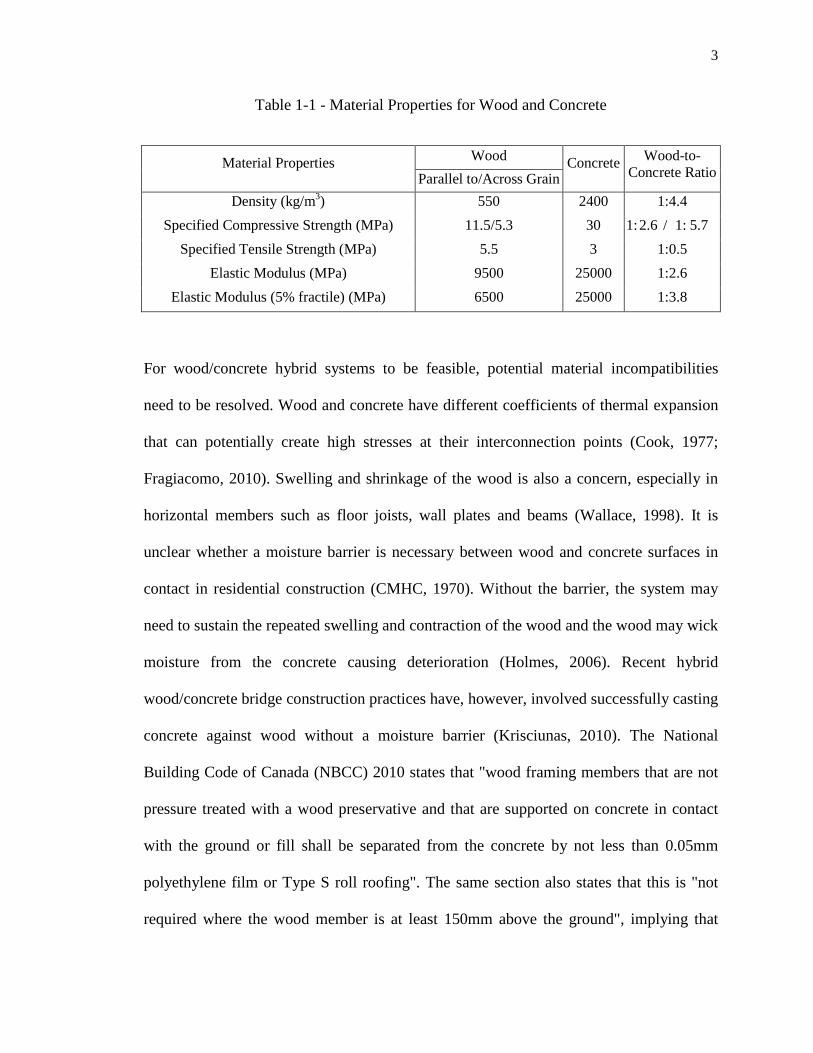
Table 1-1 - Material Properties for Wood and Concrete .................................................................. 3
Table 2-1 - Maximum Spans for Wood Joists ............................................................................... 24
Table 2-2 - Parameter Ranges Investigated ................................................................................... 25
Table 2-3 - Multi-Storey Wood Structures with Wood/concrete Flooring .................................... 27
Table 2-4 – Maximum Number of Storeys: Gravity Loading Only ............................................... 30
Table 2-5 - Maximum Number of Storeys: Lateral Load Included ............................................... 32
Table 2-6 - Maximum Number of Storeys: Gravity Loading with Lateral-load-resisting System 33
Table 3-1 - Final Deflection Limits of the Prototype Structure at SLS and ULS .......................... 50
Table 3-2 - Positive and Negative Test Pressures .......................................................................... 52
Table 3-3A - Deflection of Concrete Frame under Lateral Sway Loading at SLS ........................ 58
Table 3-3B - Deflection of Concrete Frame under Lateral Sway Loading at ULS........................58
Table 3-4A - Deflection of Concrete Frame under Vertical Racking at SLS ................................ 60
Table 3-3B - Deflection of Concrete Frame under Vertical Racking at ULS.................................60
Table 4-1 - Summary of Tests Performed ...................................................................................... 81
Table 4-2 - Out-of-plane Horizontal Deflections near the Top and Bottom Connections ............. 86
Table 4-3- Displacement of the Bottom of the Wall with Respect to the Shims ........................... 89
Table 4-4 - Deflection of the Wall at Midheight ........................................................................... 91
Table 4-5 - Out-of-Plane Test 1.1/1.2 compared to Test 1.1/1.2/1.3 under Positive Pressure ....... 93
Table 4-6 - Out-of-plane Support Deflections for Test 1.1 ............................................................ 94
Table 4-7 - Concrete Frame Deflections Between Supports .......................................................... 96
Table 4-8 - Concrete Frame Response During Lateral Sway Test at SLS ..................................... 99
Table 4-9 - Steel Frame Response during Lateral Sway Tests .................................................... 103
Table 4-10A - Concrete Frame Deformation for Lateral Sway (Push) Loading at SLS .............. 105
Table 4-10B - Concrete Frame Deformation for Lateral Sway (Pull) Loading at SLS................105
xii
Table 4-10C - Concrete Frame Deformation for Lateral Sway (Pull) Loading at ULS...............105
Table 4-11A - Wall Rotation under Lateral Sway (Push) Loading at SLS .................................. 108
Table 4-11B - Wall Rotation under Lateral Sway (Pull) Loading at SLS....................................108
Table 4-12A - Change in Gap under Lateral Sway (Push) Loading at SLS ................................ 110
Table 4-12B - Change in Gap under Lateral Sway (Pull) Loading at SLS...................................110
Table 4-13 - Test Apparatus Response During Vertical Racking Test ....................................... 113
Table 4-14 - Steel Frame Response During Vertical Racking Test ............................................ 115
Table 4-15A - Displacement of Test Apparatus During Vertical Racking Tests at SLS ............. 118
Table 4-15B - Displacement of Test Apparatus During Vertical Racking Tests at ULS.............118
Table 4-16- Wall Rotation During Vertical Racking Tests at SLS .............................................. 120
Table 4-17 - Change in Gap During Vertical Racking Tests at SLS ........................................... 120
Table 4-18 - Comparison of Out-of-Plane Test 1.3 and 2 ............................................................ 122
Table 4-19 - Comparison of Out-of-Plane Test 2 and 3 ............................................................... 122
Table B-1 - Wind Loading Factors for the Prototype Structure...................................................143
Table B-2 - Pressures Applied to Prototype Structure..................................................................143
Table B-3 - Wind Loading Factors for the Exterior Cladding Elements......................................144
Table C-1 - Axial Load in Columns at SLS and ULS..................................................................146
Table C-2 - Vertical Shortening Results.......................................................................................147
Table I-1 - Displacement of Infill wall under Negative Pressure.................................................166
Table I-2 - Displacement of Infill wall under Positive Pressure...................................................167
Table J-1 - Logbook Summary.....................................................................................................169
xiii
LIST OF APPENDICES
APPENDIX A FEASIBILITY STUDY RESULTS FOR CASES 2, 4-7 ................. 138
APPENDIX B WIND LOADING ............................................................................... 142
B.1 Prototype Structure ................................................................................................. 143
B.2 Test Apparatus........................................................................................................ 144
APPENDIX C VERTICAL CREEP CALCULATIONS ......................................... 145
C.1 Loading Details ...................................................................................................... 146
C.2 Summary of Results ............................................................................................... 146
APPENDIX D OVERVIEW OF BEAM DEFLECTION CALCULATIONS ....... 148
APPENDIX E EFFECTIVE MOMENT OF INTERIA CALCULATIONS ......... 150
E.1 Loading Details ....................................................................................................... 151
APPENDIX F ENGINEERING DRAWINGS FOR TEST APPARATUS ............ 152
APPENDIX G DESIGN LIMITS OF TEST APPARATUS .................................... 159
APPENDIX H WALL LIFT DETAILS ..................................................................... 161
H.1 Conceptual Design ................................................................................................. 162
APPENDIX I WALL DEFORMATION CALCULATIONS .................................. 164
I.1 Overview ................................................................................................................. 165
I.2 Conclusions ............................................................................................................. 167
APPENDIX J TESTING DETAILS .......................................................................... 168
J.1 Logbook Summary .................................................................................................. 169
J.2 LVDT Locations...................................................................................................... 170
xiv
NOMENCLATURE AND ABBREVIATIONS
A Area (mm2) a Distance between points of zero shear in longer direction (mm) b Distance between points of zero shear in the shorter direction (mm) B Bottom line of grid system, representing the bottom of the infill wall Ce Exposure factor Cf Factored compressive demand (MPa) Cg Gust effect factor Cp External pressure coefficients Cr Maximum factored wall resistance (kN) CT Top line of grid system, representing the top beam of the concrete frame CB Bottom line of grid system, representing the bottom beam of the concrete frame CM Middle line of grid system, representing mid-height of the concrete columns
d Diameter (mm) D Dead Load (kN/m) Ds Sustained Dead Load (kN/m), or smaller plan dimension of a building (m) e Eccentricity (mm) Ec Elastic Modulus of Concrete (MPa)
FRR Fire resistance rating stated by the NBCC fc' Compressive strength (MPa) fy Yield Strength (MPa) H Height of building (m), vertical height of infill wall (mm) H' Horizontal differential displacement of test apparatus (m)
HDT Distance between the top and bottom LVDT (m) h Height of storey (m)
HSS Hollow Structural Section I Moment of Inertia (mm4) Icr Cracked Moment of Inertia (mm4)
Ig Gross Moment of Inertia (mm4) Ie Effective Moment of Inertia (mm4)
IRLBH Insurance Research Lab for Better Homes L Span length (m)
Lmax Maximum length (m) L Live Load (kN/m), Steel Angle
LLRF Live Load Reduction Factor
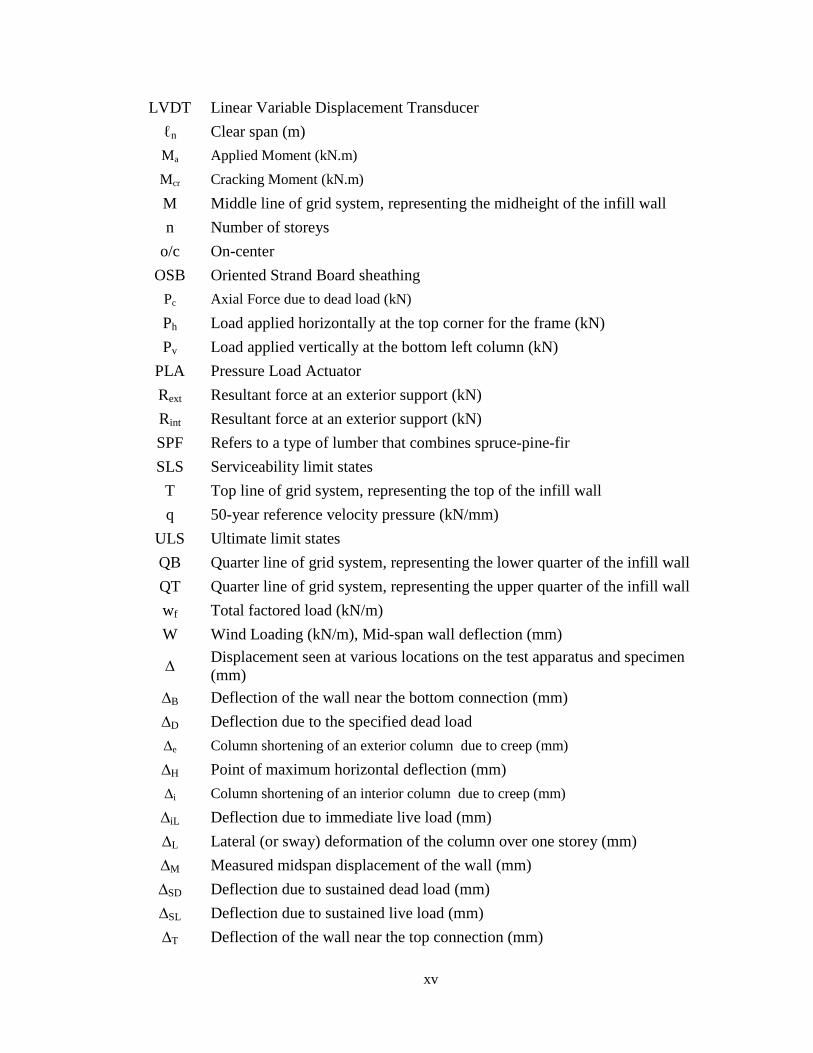
xv
LVDT Linear Variable Displacement Transducer ℓn Clear span (m) Ma Applied Moment (kN.m) Mcr Cracking Moment (kN.m)
M Middle line of grid system, representing the midheight of the infill wall n Number of storeys
o/c On-center OSB Oriented Strand Board sheathing
Pc Axial Force due to dead load (kN)
Ph Load applied horizontally at the top corner for the frame (kN) Pv Load applied vertically at the bottom left column (kN)
PLA Pressure Load Actuator Rext Resultant force at an exterior support (kN) Rint Resultant force at an exterior support (kN) SPF Refers to a type of lumber that combines spruce-pine-fir SLS Serviceability limit states
T Top line of grid system, representing the top of the infill wall q 50-year reference velocity pressure (kN/mm)
ULS Ultimate limit states QB Quarter line of grid system, representing the lower quarter of the infill wall QT Quarter line of grid system, representing the upper quarter of the infill wall wf Total factored load (kN/m) W Wind Loading (kN/m), Mid-span wall deflection (mm)
∆ Displacement seen at various locations on the test apparatus and specimen (mm)
∆B Deflection of the wall near the bottom connection (mm) ∆D Deflection due to the specified dead load ∆e Column shortening of an exterior column due to creep (mm)
∆H Point of maximum horizontal deflection (mm) ∆i Column shortening of an interior column due to creep (mm)
∆iL Deflection due to immediate live load (mm) ∆L Lateral (or sway) deformation of the column over one storey (mm) ∆M Measured midspan displacement of the wall (mm) ∆SD Deflection due to sustained dead load (mm) ∆SL Deflection due to sustained live load (mm) ∆T Deflection of the wall near the top connection (mm)
xvi
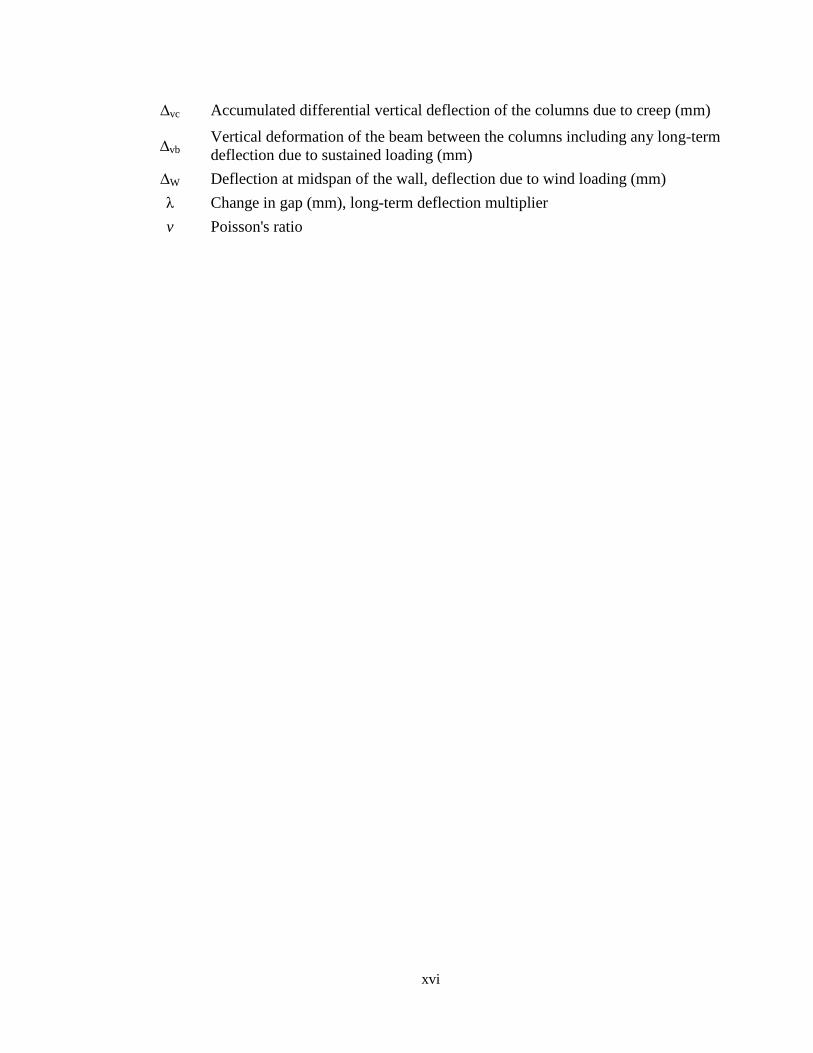
∆vc Accumulated differential vertical deflection of the columns due to creep (mm)
∆vb Vertical deformation of the beam between the columns including any long-term deflection due to sustained loading (mm)
∆W Deflection at midspan of the wall, deflection due to wind loading (mm) λ Change in gap (mm), long-term deflection multiplier v Poisson's ratio

1
1
1.1 OVERVIEW
INTRODUCTION
1.1.1 INTRODUCTION
Wood and concrete have been used separately as effective structural materials in two-
storey residential housing and low-rise multi-storey structures. With the recent seismic
test of a six-storey light-frame wood structure in the NEESwood project (van de Lindt,
2010) and changes to the BC Building Code that increase the maximum number of
storeys permissible using combustible building materials to six (BCBC, 2009), there is
incentive to explore the boundaries of light-frame wood construction. The feasibility of a
hybrid mid-rise design seems realistic given the potential synergy of pairing the strength
and durability of concrete with the light weight and sustainability of wood. Currently
there is no literature, however, that reviews light-frame wood and concrete hybrid
systems for mid- to high-rise structures.
There has been some research on wood/concrete connection detailing, but past tests have
focused on heavy timber construction, such as a post-and-beam wood frame with a
concrete shear wall (e.g. Sakamoto, 2004). When subjected to simulated earthquake
loading, failure occurred in both the concrete and the wood at their interconnection point.
There are no references in the literature that specifically refer to hybrid light-frame
wood/concrete methods of construction. The benefit of using light framing, instead of
heavy timber, is that the load can be distributed throughout the wall system. This requires
more connection points between the two materials but reduces the load on each
2
individual connection and so has the potential to add redundancy to the system. Light-
frame members are more readily available than heavy timber members, which are now
typically used as built-up sections (van de Lindt, 2010).
Additional research must be done to assess the interaction of light-frame wood and
concrete in buildings. The connection of these materials is not discussed within CSA
design standards and has been recognized as essential to the development of future design
methods (CSA, 2010a; CSA, 2010c). This is further emphasized in Commentary B of the
NBCC (2010) – Part 4, Division B, which states that “situations where structural integrity
may require special attention include medium-rise and high-rise building systems made
of components of different building materials, whose interconnection is not covered by
existing CSA design standards
1.1.2 COMPLEMENTARY MATERIALS
” (emphasis added) (NBCC, 2010).
Table 1-1 summarizes typical material properties of light-frame SPF wood (CSA, 2010c)
and normal-weight concrete (MacGregor and Bartlett, 2000). Some of these properties
are complimentary, suggesting hybrid wood/concrete construction may be feasible. For
example, concrete is denser, stiffer and markedly stronger in compression, where as
wood is lighter and stronger in tension.
3
Table 1-1 - Material Properties for Wood and Concrete
Material Properties Wood Concrete Wood-to-Concrete Ratio Parallel to/Across Grain
Density (kg/m3) 550 2400 1:4.4
Specified Compressive Strength (MPa) 11.5/5.3
30 1: 2.6 / 1: 5.7 Specified Tensile Strength (MPa) 5.5 3 1:0.5
Elastic Modulus (MPa) 9500 25000 1:2.6
Elastic Modulus (5% fractile) (MPa) 6500 25000 1:3.8
For wood/concrete hybrid systems to be feasible, potential material incompatibilities
need to be resolved. Wood and concrete have different coefficients of thermal expansion
that can potentially create high stresses at their interconnection points (Cook, 1977;
Fragiacomo, 2010). Swelling and shrinkage of the wood is also a concern, especially in
horizontal members such as floor joists, wall plates and beams (Wallace, 1998). It is
unclear whether a moisture barrier is necessary between wood and concrete surfaces in
contact in residential construction (CMHC, 1970). Without the barrier, the system may
need to sustain the repeated swelling and contraction of the wood and the wood may wick
moisture from the concrete causing deterioration (Holmes, 2006). Recent hybrid
wood/concrete bridge construction practices have, however, involved successfully casting
concrete against wood without a moisture barrier (Krisciunas, 2010). The National
Building Code of Canada (NBCC) 2010 states that "wood framing members that are not
pressure treated with a wood preservative and that are supported on concrete in contact
with the ground or fill shall be separated from the concrete by not less than 0.05mm
polyethylene film or Type S roll roofing". The same section also states that this is "not
required where the wood member is at least 150mm above the ground", implying that
4
there will be no moisture in the concrete above such elevations. Load transfer
mechanisms in future wood/concrete hybrid systems in mid-rise structures must
accommodate these material incompatibilities.
1.1.3 POTENTIAL BENEFIT
A major benefit of including concrete in a mid-rise wood structure is the potential of
increasing its fire resistance. A load-bearing wall within a structure of any size that is
sprinklered can be classified as a firewall if it has a Fire Resistance Rating (FRR) of 2
hours (NBCC, 2010). If the building has six storeys, satisfies the area limitations
specified in Part 3 of the NBCC (2010) and is made of a non-combustible material, then
it requires have a FRR of only 1 hour. Provisions for six-storey structures were recently
added to the BC Building Code to allow the use of combustible construction materials
with a FRR of 1 hour (BCBC, 2009).
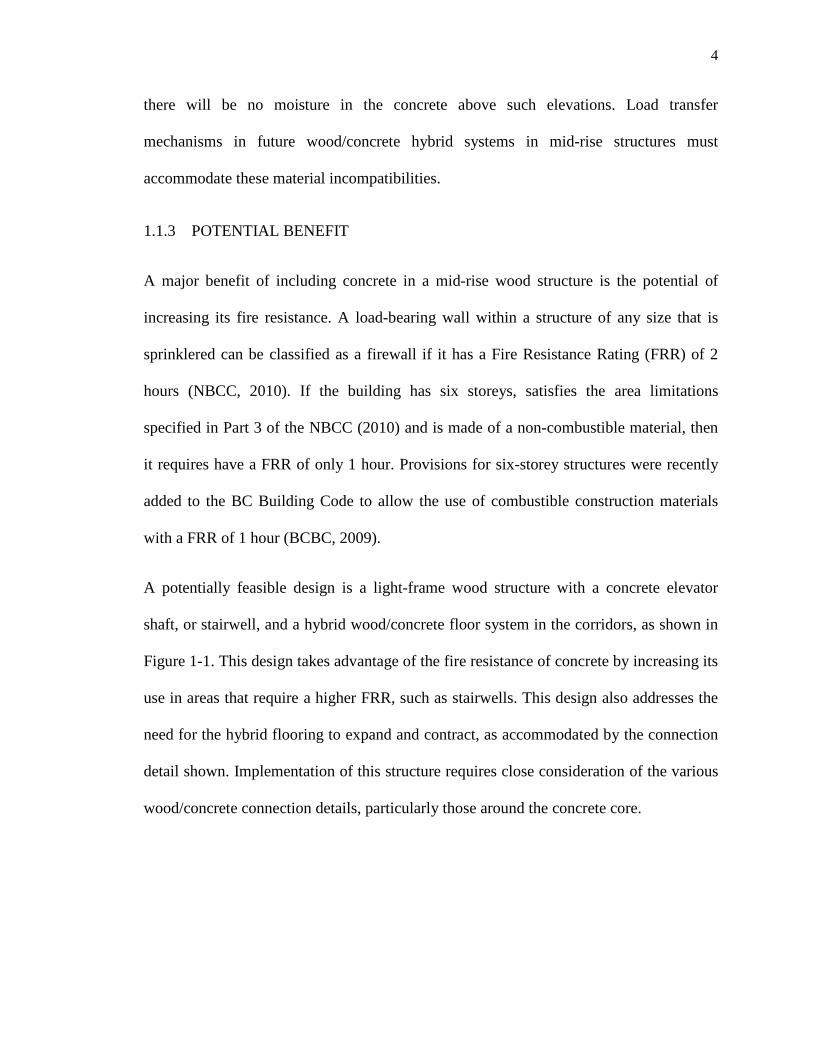
A potentially feasible design is a light-frame wood structure with a concrete elevator
shaft, or stairwell, and a hybrid wood/concrete floor system in the corridors, as shown in
Figure 1-1. This design takes advantage of the fire resistance of concrete by increasing its
use in areas that require a higher FRR, such as stairwells. This design also addresses the
need for the hybrid flooring to expand and contract, as accommodated by the connection
detail shown. Implementation of this structure requires close consideration of the various
wood/concrete connection details, particularly those around the concrete core.
5
Figu
re 1
-1 -
Sect
ion
of a
Fea
sibl
e Li
ght-f
ram
e W
ood/
conc
rete
Mid
-ris
e St
ruct
ure
6
1.2 NEWBUILDS
The NSERC Strategic Network on Innovative Wood Products and Building Systems
(NEWBuildS), who funded the research reported in this thesis, focuses on increasing "the
use of wood products in mid-rise buildings for residential and non-residential purposes in
Canada and elsewhere" (Chui, 2009). This network includes "industrial associations
(Canadian Wood Council, Canadian Home Builders Association), industrial research
organization (FPInnovations), building product approval agency (NRC Canadian
Construction Materials Centre), consulting engineers (structural and fire), engineered
wood product manufacturers, and university researchers". The research activities of the
network are classified within the four following themes:
- Theme 1: Cross Laminated Timber, focusing on material characterization and
structural performance;
- Theme 2: Hybrid Building Systems, focusing on structural performance;
- Theme 3: Building Systems, focusing on fire performance, acoustic and vibration
serviceability; and
- Theme 4: Building Systems, focusing on durability, sustainability and enhanced
products.
The present study is part of Theme 2, listed as Project T2-2-C4: "Niche for and
Feasibility of Reinforced Concrete Frame Multi-material Mid-rise Hybrid Systems".
7
1.3 RESEARCH OBJECTIVES
The broad objectives of this study are to:
1. identify and investigate niche areas for wood/concrete hybrid systems in mid- to
high-rise buildings that can be practically implemented, accounting for the
potential contributions of current or upcoming research, to highlight existing
knowledge gaps that have prevented development to date (presented in Chapter
2), and;
2. explore some of the existing structural engineering challenges for a specific niche
area to meet conventional limit states design requirements, including
serviceability, safety and durability, and further its practical development
(presented in Chapters 3 and 4).
Wind-bearing light-frame wood infill walls in reinforced concrete frame structures has
been chosen as the niche area worth pursuing. This led to the following specific
objectives:
A. Quantify the deformed shape of a typical reinforced concrete frame structure
under wind loading to identify critical frame sway deflection magnitudes.
B. Develop a methodology for testing full-scale non-load-bearing infill wall
specimens under realistic in-plane racking deformations and out-of-plane wind
loads at both serviceability and ultimate limit states
C. Design and construct a full-scale test apparatus that can replicate these critical
racking deformations and apply the required wind loads to investigate,
8
experimentally, the interaction between the reinforced concrete frame and the
wood infill wall.
D. Design, prototype and test a connection that accommodates the predicted in-plane
sway deflections of the reinforced concrete frame and yet withstands the localized
out-of-plane wind loads at both serviceability and ultimate limit states.
1.4 OUTLINE OF THESIS
Chapter 2 investigates a spectrum of potential niche areas for wood/concrete hybrid
systems in mid- to high-rise structures using traditional light-frame wood construction.
Certain niches areas are deemed to be more feasible than others and are further
investigated to quantify their feasibility using a limiting criterion such as the maximum
number of storeys. A single niche, light-frame wood infill walls in reinforced concrete
frame structures, is then chosen to be the focus of the rest of the study.
Chapter 3 focuses on the design and construction of the full-scale reinforced concrete
frame test apparatus and the light-frame wood infill wall specimen. The test apparatus is
used to replicate the realistic vertical and lateral frame deformations, identified by an
investigation of a 9-storey reinforced concrete frame prototype structure, and to apply
out-of-plane wind loading. A description of the connection design concept for the light-
frame wood infill wall is also presented.
Chapter 4 presents the procedure for and results from the in-plane lateral sway and
vertical racking tests, as well as three out-of-plane pressuring tests, performed using the
test apparatus and wall specimen. A comparison of observed and predicted response of
test apparatus and wall test specimen during the first out-of-plane test and the in-plane
9
tests are presented. The sequential out-of-plane tests were performed in-between each in-
plane test to investigate their effect on the out-of-plane stiffness of the wall using a
repeatability assessment.
Chapter 5 summarizes the research program and presents the conclusions of this research.
Recommendations for future work are also presented.
10
2
2.1 INTRODUCTION
NICHE AREAS FOR MID-RISE LIGHT-FRAME
WOOD/CONCRETE HYBRID CONSTRUCTION
2.1.1 OBJECTIVE
The objective of this chapter is to identify niche areas for wood/concrete hybrid systems
in mid- to high-rise structures using traditional light-frame wood construction and to
determine their feasibility for future use in practice.
2.1.2 DEFINING TERMS
A variety of terms have been used in the literature on hybrid systems (i.e., Elliot, 2003;
Sakamoto, 2004). The present study will adopt the definition by Gagnon et al. (2006,
2007) which uses the term "hybrid" to describe two different materials that are combined
to take advantage of each other’s properties. These two materials may be interconnected
as a system, or participate in parallel to achieve a common purpose. The term
"composite" will refer to the action created between these two materials when connected
integrally, such as the composite action in wood/concrete hybrid floor systems that is
created by shear connectors. The terms "mixed construction", which generally refers to
two materials combined without optimizing the benefits of each, and "dual system" will
not be used. This study will also focus on the global perspective of a structure, as other
research tends to incorporate the elements of a structure as well (Isoda, 2000; Gagnon,
2007). Thus, the present study will be focused on assessing the overall structure with
11
respect to the systems and assemblies within the structure. The study of individual
elements, such as a single wood/concrete hybrid beam, will not be addressed.
2.2 EVALUATION OF NICHE AREAS
2.2.1 SCOPE
Figure 2-1 shows the spectrum of light-frame wood and concrete hybrid niche areas that
have been considered within the scope of this project. Light-frame wood structures are
listed at the top, representing one end of the spectrum. Concrete components are
progressively added to create other niche areas, leading to all-concrete structures shown
at the bottom. Each niche has been investigated to establish its potential as an area of
growth for the Canadian wood industry. Past research has considered a variety of heavy
timber wood/concrete hybrid systems (i.e. Sakamoto, 2002; Gagnon, 2007) but these will
not be considered in the present study. There are a number of light-frame wood/concrete
hybrid designs that have already been constructed successfully, however, generally these
existing designs address the use of wood and concrete as materials in distinct separate
structures, or uses one of the materials as a non-structural element. Other systems shown
require the wood and concrete to be designed as a hybrid system. Research on some of
these niche areas is ongoing elsewhere, such as in NEWBuildS Network Projects T2-1-
C3: "Techniques for forming multi-functional construction interfaces in hybrid-
buildings" and T2-9-C6: "Movements and deformation incompatibilities of materials in
light wood frame residential buildings" (Chui, 2009). As implied by Figure 2-1, this
chapter will address each of the niche areas listed and then further explore the feasibility
of the following niches: Wood Structure with Wood/concrete Floor Systems, Wood
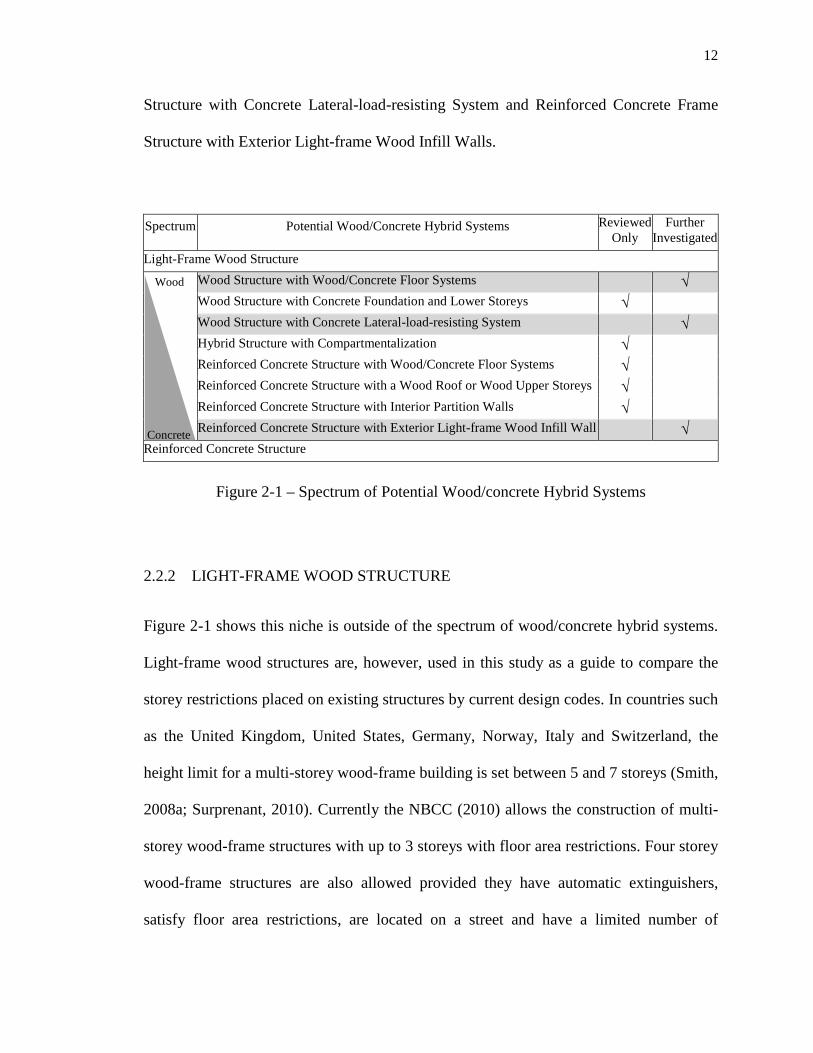
12
Structure with Concrete Lateral-load-resisting System and Reinforced Concrete Frame
Structure with Exterior Light-frame Wood Infill Walls.
Spectrum Potential Wood/Concrete Hybrid Systems Reviewed Only
Further Investigated
Light-Frame Wood Structure
Wood Structure with Wood/Concrete Floor Systems √ Wood Structure with Concrete Foundation and Lower Storeys √ Wood Structure with Concrete Lateral-load-resisting System √ Hybrid Structure with Compartmentalization √ Reinforced Concrete Structure with Wood/Concrete Floor Systems √ Reinforced Concrete Structure with a Wood Roof or Wood Upper Storeys √ Reinforced Concrete Structure with Interior Partition Walls √ Reinforced Concrete Structure with Exterior Light-frame Wood Infill Wall √
Reinforced Concrete Structure
Figure 2-1 – Spectrum of Potential Wood/concrete Hybrid Systems
2.2.2 LIGHT-FRAME WOOD STRUCTURE
Figure 2-1 shows this niche is outside of the spectrum of wood/concrete hybrid systems.
Light-frame wood structures are, however, used in this study as a guide to compare the
storey restrictions placed on existing structures by current design codes. In countries such
as the United Kingdom, United States, Germany, Norway, Italy and Switzerland, the
height limit for a multi-storey wood-frame building is set between 5 and 7 storeys (Smith,
2008a; Surprenant, 2010). Currently the NBCC (2010) allows the construction of multi-
storey wood-frame structures with up to 3 storeys with floor area restrictions. Four storey
wood-frame structures are also allowed provided they have automatic extinguishers,
satisfy floor area restrictions, are located on a street and have a limited number of
Concrete
Wood
13
occupants. These limitations are mainly due to fire prevention considerations
(Surprenant, 2010). Projects such as the Timber Frame 2000 Project (Enjily, 2006; Johal,
2009) and the NEESWood Project (van de Lindt, 2010) led to recent provisions to the BC
Building Code which now allow the use of combustible materials in structures up to 6
storeys as of April 6th, 2009 (BCBC, 2009).
2.2.3 WOOD STRUCTURE WITH WOOD/CONCRETE FLOOR SYSTEMS
Figure 2-1 shows the feasibility of wood structures with wood/concrete floor systems will
be further investigated in this study. Currently these systems are used in low-rise
structures, but do not exist in mid-rise light-frame wood structures. This is because the
accumulation of vertical shrinkage in the wood is considered negligible for structures
with fewer than four storeys (Cheung, 2000). The present study includes a general survey
of this niche, however, in-depth work is being done by NEWBuildS Network – Project
T2-4-C3: "Innovative post-tension composite systems for long-span floor construction"
(Chui, 2009).
Wood/concrete floor systems can be composite or non-composite. Non-composite floor
systems include the use of concrete topping to add fire-resistance and sound-absorbent
properties to the wood floor. This type of design is occasionally used (Cheung, 2008) and
is considered in some sources to be standard practice (e.g. CWC, 2010). Composite floor
systems use shear connectors to ensure full or partial composite behaviour between the
concrete and the wood. They were first researched as floor systems in the 1940s
(Lukeszeska, 2010), however they were used as decking for wood bridges in the 1930s
(Cooke, 1977; Dolan, 2005; Clouston, 2008; Rautenstrauch, 2010; Gutkowski, 2010).
14
More recently they have been used for restoring historic buildings (Piazza, 2000) and
specific connection designs are being used in practice to create hybrid flooring systems
(Lukaszewska, 2008). The use of wood increases the efficiency of the system (load
carrying capacity per unit self-weight), reduces load for better seismic performance, and
markedly reduces environmental impact compared to a concrete slab (Yeoh, 2010). The
concrete improves acoustics, decreases deflection and so increases span length, and
enhances the fire resistance and floor diaphragm stiffness when compared to a timber-
only floor (Gagnon, 2007; Clouston, 2008).
The benefits of wood/concrete composite floor systems have generated considerable
research on innovative shear connectors between the two materials to facilitate an
optimized and predictable composite system (Gagnon, 2007). Current challenges include:
effectively achieving composite action between the materials, long-term behavior of the
wood, creep effects due to the weight of concrete, plasticity developed before collapse,
and the risk of fatigue failure from repetitive loading. There also remains uncertainty
concerning the effect of water in the concrete on the durability of the wood members;
however it is suggested that using precast concrete would resolve this, while also limiting
concrete shrinkage and reducing construction costs (Lukaszewska, 2010). A film could
also be applied as a moisture barrier between the wood and the concrete to protect the
wood from excessive moisture (Clouston, 2005).
In general, the reported range of recently used concrete thicknesses in composite
wood/concrete floor systems is 63.5-120mm for normal-weight concrete and 50-60mm
for high-strength concrete, whether precast or cast in-situ (Clouston, 2005, 2008; Yoeh,
2010; Gutkowski, 2010; Crocetti, 2010; Lukaszewska, 2008, 2010; Kuhlmann, 2008;
15
Chuan, 2009). Spans reported in these studies range from 3.6m to 10.0m with various
type of timber used (traditional lumber, laminated veneer lumber, glued laminated timber,
etc.). The extensive available research on wood/concrete flooring systems has been
summarized by Gagnon et al. (2007), Clouston et al. (2005, 2008), Gutkowski et al.
(2010) and Lukaszewska et al. (2010). Despite this research, such systems are rarely used
because of the difficulty in providing efficient connections, uncertainty in predicting
long-term changes of the system and the lack of guidelines for design (Lukaszewska,
2010). The potential composite action is unclear: some claim that over 95% composite
action can be achieved using a well-designed system (Clouston, 2005; Yeoh, 2010;
Lukaszewska, 2010), while others state that the interaction between the two materials
should be classified as only partially composite (Crocetti, 2010).
2.2.4 WOOD STRUCTURE WITH CONCRETE FOUNDATION AND LOWER
STOREYS
Figure 2-1 indicates that this niche will not be further investigated because existing
wood-to-concrete connections and current code restrictions limit the height of current
mid-rise light-frame wood structures. These connections are required to resist large uplift
and torsional forces to ensure adequate performance of the light-frame wood structure,
while maintaining proper load transfer to the concrete substructure. Elaborate connection
systems used for this type of construction (i.e., holdowns, strappings and continuous tie
down, etc.) have helped to increase the maximum number of storeys with respect to all-
wood structures (Shackelford, 2007). This niche is sensitive, however, to the similar
code restrictions and design limitations placed on light-frame wood structures. Therefore,
16
further development of these connections seems to be limited and this niche will not be
further addressed within this study.
2.2.5 WOOD STRUCTURE WITH CONCRETE LATERAL-LOAD-RESISTING
SYSTEM
Figure 2-1 indicates that a wood structure with a concrete lateral-load-resisting system
will be further developed within this study. Obvious design challenges are material
incompatibilities, such as creep and differential shrinkage, in addition to the questionable
behavior of the structure under lateral loading due to the connection detailing (Wallace,
1998; Sakamoto, 2002). Designs for these connections have been discussed suggesting
that the wood and concrete structural systems be designed to act independently (Cheung,
2000). Further research is being conducted by the NEWBuildS Network – Project T2-9-
C6: "Movements and Deformation incompatibilities of materials in light wood frame
residential buildings" (Chui, 2009; Zhou, 2009).
2.2.6 HYBRID STRUCTURES WITH COMPARTMENTALIZATION
Figure 2-1 indicates that hybrid structures with compartmentalization will not be further
considered within this study. This concept is potentially feasible in the long term. Its
current potential is limited, however, and since the focus of this study is short-term
feasibility, it will not be further developed. Smith et al. (2008b) developed a conceptual
design of a "high-performance composite-construction system for a tall building", shown
in Figure 2-2, based this approach. It is only theoretical at this point, yet has the potential
to amalgamate a number of wood/concrete hybrid systems. The benefits allow the
separation of components of the structural system to prevent, for example, the spread of

17
fire. This approach could also be applied to control shrinkage and creep within each
compartment. To exploit this niche, the challenges of wood/concrete material
incompatibility still require resolution. Further work is being done by NEWBuildS
Network – T2-1-C3: "Techniques for forming multi-functional construction interfaces in
hybrid-buildings" (Chui, 2009).
Figure 2-2 - Conceptual 16 storey Wood/concrete Hybrid Building (Smith, 2008b)
2.2.7 REINFORCED CONCRETE STRUCTURES WITH WOOD/CONCRETE
FLOOR SYSTEMS
Figure 2-1 shows that reinforced concrete structures with wood/concrete floor systems
will not be further considered in the present study due to the consideration of realistic
design criteria when considering light-frame wood versus heavy timber. The wood floor
18
system is likely to be constructed within the structure, confined from expansion and
contraction by concrete beams and/or walls, suggesting that material incompatibilities
may be a concern. These connections will likely need to resist differential changes and
potential moisture transfer while accommodating the deformed shape of the structure
under lateral loading. Most heavy timber systems are typically engineered wood products
and so are potentially more suitable because they exhibit much less expansion and
contraction than light-frame systems. Since the floor system transfers gravity loads to the
concrete walls, instead of the light-frame wood walls discussed in Section 2.2.2, they will
be able to resist the large point loads created by heavy timber beams. Given these
features, as well as the benefit of longer spans, it seems likely that a heavy timber would
be preferable in this type of floor system, limiting the potential of a light-frame
wood/concrete floor system in a reinforced concrete structure.
2.2.8 REINFORCED CONCRETE STRUCTURE WITH A WOOD ROOF OR WOOD
UPPER STOREYS
Figure 2-1 indicates that a reinforced concrete structure with a wood roof or upper storey
will not be further investigated. Although structurally similar to the ‘Wood Structure with
Reinforced Concrete Foundation or Lower Storeys’ described in Section 2.2.3, the
feasibility of this niche is mainly dependant on the potential fire risks in a high-rise light-
frame wood structure. Current design restrictions are largely influenced by the ability to
extinguish the fire on the top storey (Surprenant, 2010) and it is unrealistic to assume that
these restrictions would apply to mid- to high-rise construction in this niche. This design
potentially leads to larger structures, however fire constraints limit its overall feasibility.
19
2.2.9 REINFORCED CONCRETE STRUCTURE WITH INTERIOR WOOD
PARTITION WALLS
Figure 2-1 shows that reinforced concrete structures with interior partition walls will not
be further considered because, in North America, light-frame wood walls are already
commonly used as interior non-load-bearing partition walls where the primary structure
is constructed of a non-combustible material such as concrete or steel (Gagnon, 2006).
These walls are frequently used in mid- to high-rise residential and non-residential
construction and are comparable to similar wall systems that use light-gauge steel studs
or masonry (Gagnon, 2007). With the potential for excellent acoustic performance and
the use of prefabricated construction, light-frame wood walls can be optimal, especially
compared to heavy masonry wall systems. The NBCC (2010) states that light-frame
wood partition walls can be used in non-combustible structures if they are: sprinkled
throughout; not used as a care, treatment or detention occupancy; and not located in exit
enclosures.
2.2.10 REINFORCED CONCRETE STRUCTURE WITH EXTERIOR LIGHT-FRAME
WOOD INFILL WALLS
Figure 2-1 shows that reinforced concrete structures with exterior light-frame wood infill
walls is considered in the present study and, although touched on briefly in this chapter,
will be further developed in the following chapters. A large majority of high-rise
structures use concrete, either precast or cast-in-place, as the primary structural system
and use other materials, such as masonry or light-gage steel framing, for infill walls.
These infill components are typically non-loadbearing; exterior infill walls are only
20
required to transfer localized out-of-plane wind loads to the surrounding concrete frame.
There are currently exterior light-frame wood infill walls in Scandinavia (where they
were introduced in the 1950s), Netherlands, Germany, France, United Kingdom, Austria
and China (Eriksson, 2005). Many existing examples of this system are low-rise
structures or high-rise structures in geographic locations where there is no seismicity,
such as Sweden. These wall systems are cost-competitive up to 20 storeys, especially
current requirements for energy efficiency (EWC, 2010). There is little indication,
however, that this hybrid system is used in North America (Wang, 2011). One of the
current knowledge gaps concerning exterior wood infill walls involves quantification of
the space required between the concrete frame and the infill wall panel. This space and
the connection details must accommodate material volume change incompatibilities,
deformations of the structure due to lateral loading and realistic construction tolerances of
both the wood infill panel and the concrete frame. Light-gauge steel and masonry exterior
wall systems are currently preferred in North America, mainly due to their non-
combustibility.
2.3 ASSESSMENT OF POTENTIAL NICHES
2.3.1 APPROACH
The next goal is to assess the feasibility of the three highlighted niche areas shown in
Figure 2-1 to be 'further investigated'. This is done by computing the potential maximum
number of storeys of each niche alternative and comparing it to a feasibility limit
criterion, which for this study is set at 7 or more storeys. This limit has been chosen to
facilitate surpassing the current code restrictions for light-frame wood structures,
21
discussed in Section 1.1.1, which states that the maximum height of a wood structure in
Canada is currently 6 storeys (in British Columbia). It also exceeds the limit of the full-
scale light-frame wood structures that have been tested in the Timber Frame 2000 Project
(Enjily, 2006; Johal, 2009) and the NEESWood Project (van de Lindt, 2010).
2.3.2 WOOD STRUCTURE WITH WOOD/CONCRETE FLOOR SYSTEM
The load path for a wood structure carrying gravity loads can easily be followed through
the light-frame sheathed wood stud walls, leading directly to the foundation of the
structure. The compressive capacity of these sheathed stud walls will be used in this
study to estimate the maximum number of storeys for various loadings, material types
and floor alternatives.
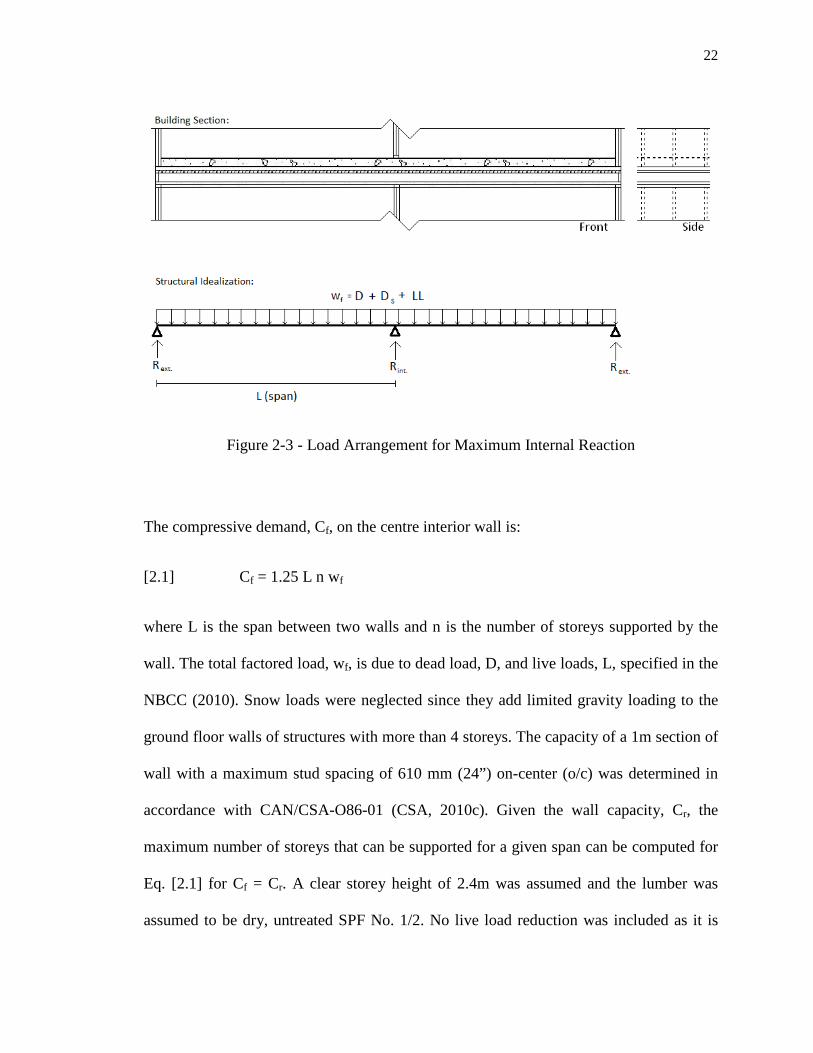
Figure 2-3 shows the cross-section of the simplified interior span investigated. Pin
connections are assumed at the top and bottom of each wall. The floor is assumed to be
continuous over, and so transfers a significant reaction to, the interior supporting wall,
which is therefore the focus of this study. An exterior wall with the same axial capacity
as the interior wall can support a span that is 3.3 times longer. For this simple idealized
structure, the interior wall capacity becomes directly dependent on the properties of its
constituent materials, readily facilitating comparisons for various loading criteria given
different stud sizes and spacings.
22
Figure 2-3 - Load Arrangement for Maximum Internal Reaction
The compressive demand, Cf, on the centre interior wall is:
[2.1] Cf = 1.25 L n wf
where L is the span between two walls and n is the number of storeys supported by the
wall. The total factored load, wf, is due to dead load, D, and live loads, L, specified in the
NBCC (2010). Snow loads were neglected since they add limited gravity loading to the
ground floor walls of structures with more than 4 storeys. The capacity of a 1m section of
wall with a maximum stud spacing of 610 mm (24”) on-center (o/c) was determined in
accordance with CAN/CSA-O86-01 (CSA, 2010c). Given the wall capacity, Cr, the
maximum number of storeys that can be supported for a given span can be computed for
Eq. [2.1] for Cf = Cr. A clear storey height of 2.4m was assumed and the lumber was
assumed to be dry, untreated SPF No. 1/2. No live load reduction was included as it is
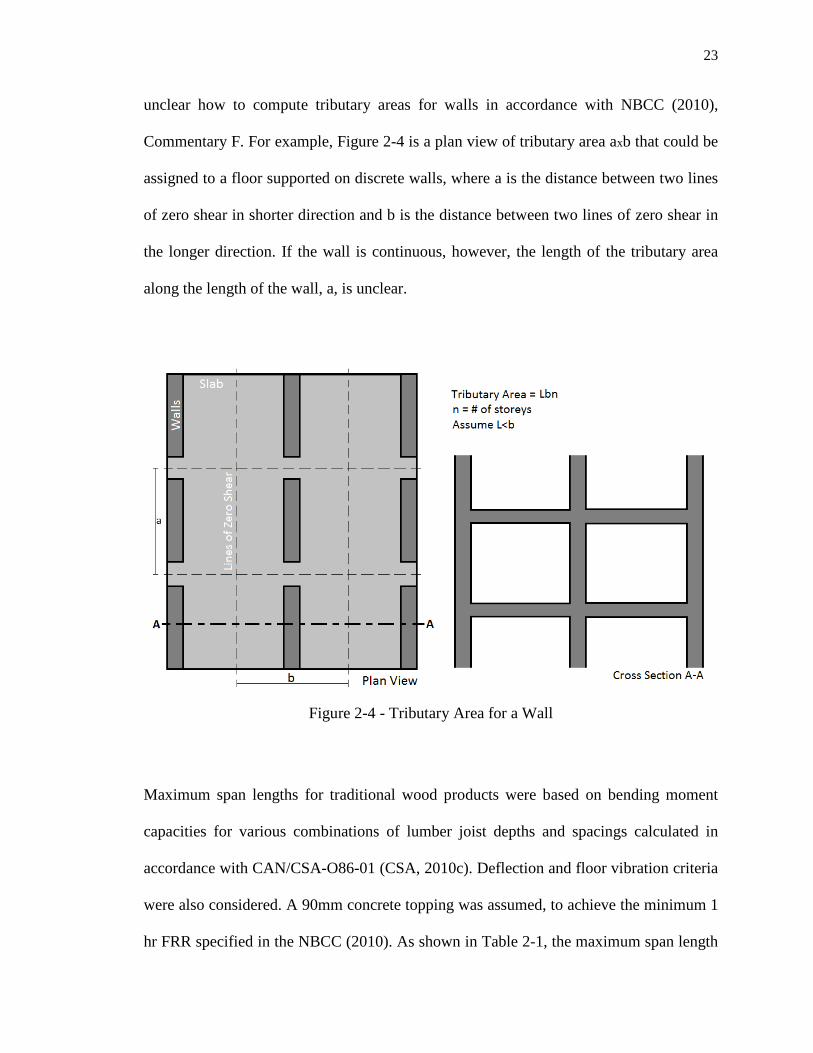
23
unclear how to compute tributary areas for walls in accordance with NBCC (2010),
Commentary F. For example, Figure 2-4 is a plan view of tributary area axb that could be
assigned to a floor supported on discrete walls, where a is the distance between two lines
of zero shear in shorter direction and b is the distance between two lines of zero shear in
the longer direction. If the wall is continuous, however, the length of the tributary area
along the length of the wall, a, is unclear.
Figure 2-4 - Tributary Area for a Wall
Maximum span lengths for traditional wood products were based on bending moment
capacities for various combinations of lumber joist depths and spacings calculated in
accordance with CAN/CSA-O86-01 (CSA, 2010c). Deflection and floor vibration criteria
were also considered. A 90mm concrete topping was assumed, to achieve the minimum 1
hr FRR specified in the NBCC (2010). As shown in Table 2-1, the maximum span length
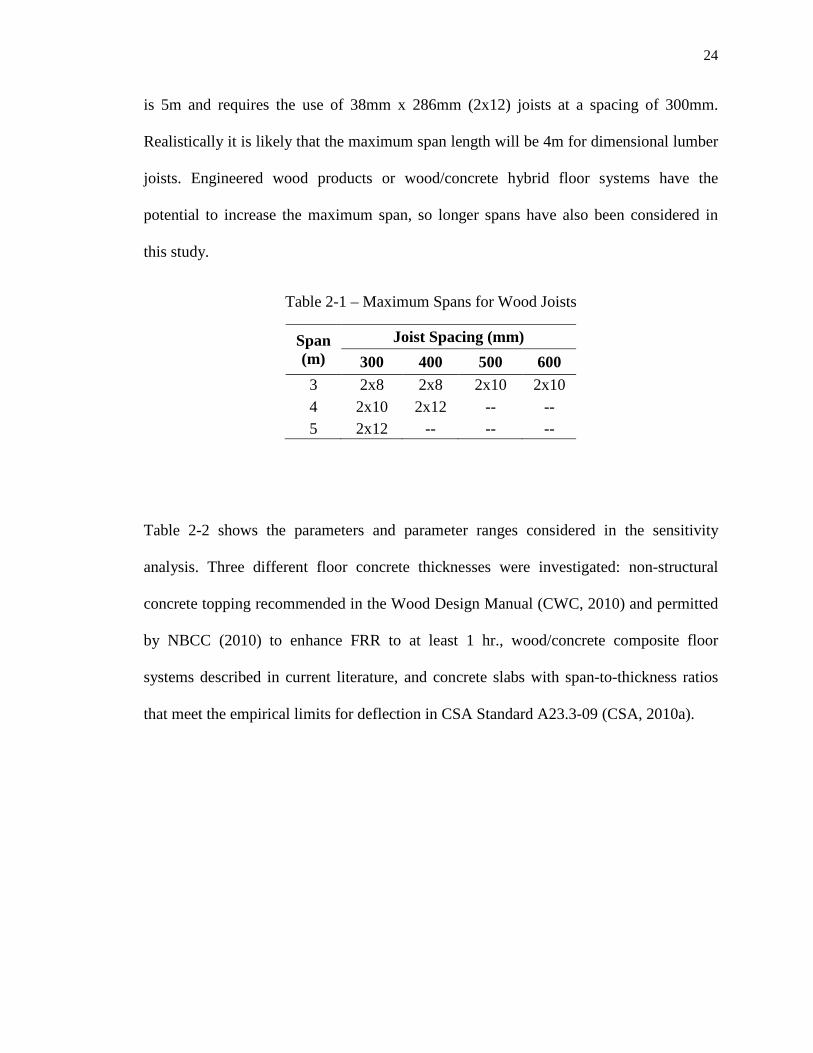
24
is 5m and requires the use of 38mm x 286mm (2x12) joists at a spacing of 300mm.
Realistically it is likely that the maximum span length will be 4m for dimensional lumber
joists. Engineered wood products or wood/concrete hybrid floor systems have the
potential to increase the maximum span, so longer spans have also been considered in
this study.
Table 2-1 – Maximum Spans for Wood Joists
Span (m)
Joist Spacing (mm) 300 400 500 600
3 2x8 2x8 2x10 2x10 4 2x10 2x12 -- -- 5 2x12 -- -- --
Table 2-2 shows the parameters and parameter ranges considered in the sensitivity
analysis. Three different floor concrete thicknesses were investigated: non-structural
concrete topping recommended in the Wood Design Manual (CWC, 2010) and permitted
by NBCC (2010) to enhance FRR to at least 1 hr., wood/concrete composite floor
systems described in current literature, and concrete slabs with span-to-thickness ratios
that meet the empirical limits for deflection in CSA Standard A23.3-09 (CSA, 2010a).
25
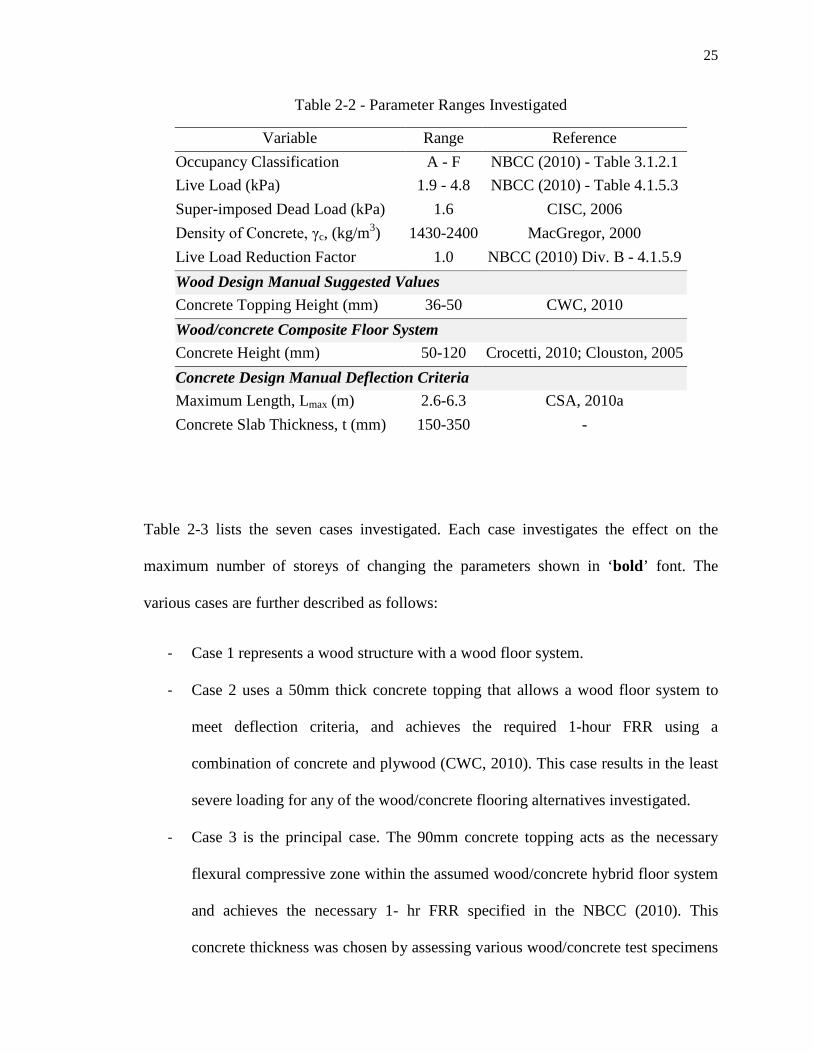
Table 2-2 - Parameter Ranges Investigated
Variable Range Reference Occupancy Classification A - F NBCC (2010) - Table 3.1.2.1 Live Load (kPa) 1.9 - 4.8 NBCC (2010) - Table 4.1.5.3 Super-imposed Dead Load (kPa) 1.6 CISC, 2006 Density of Concrete, γc, (kg/m3) 1430-2400 MacGregor, 2000 Live Load Reduction Factor 1.0 NBCC (2010) Div. B - 4.1.5.9 Wood Design Manual Suggested Values Concrete Topping Height (mm) 36-50 CWC, 2010 Wood/concrete Composite Floor System Concrete Height (mm) 50-120 Crocetti, 2010; Clouston, 2005 Concrete Design Manual Deflection Criteria Maximum Length, Lmax (m) 2.6-6.3 CSA, 2010a Concrete Slab Thickness, t (mm) 150-350 -
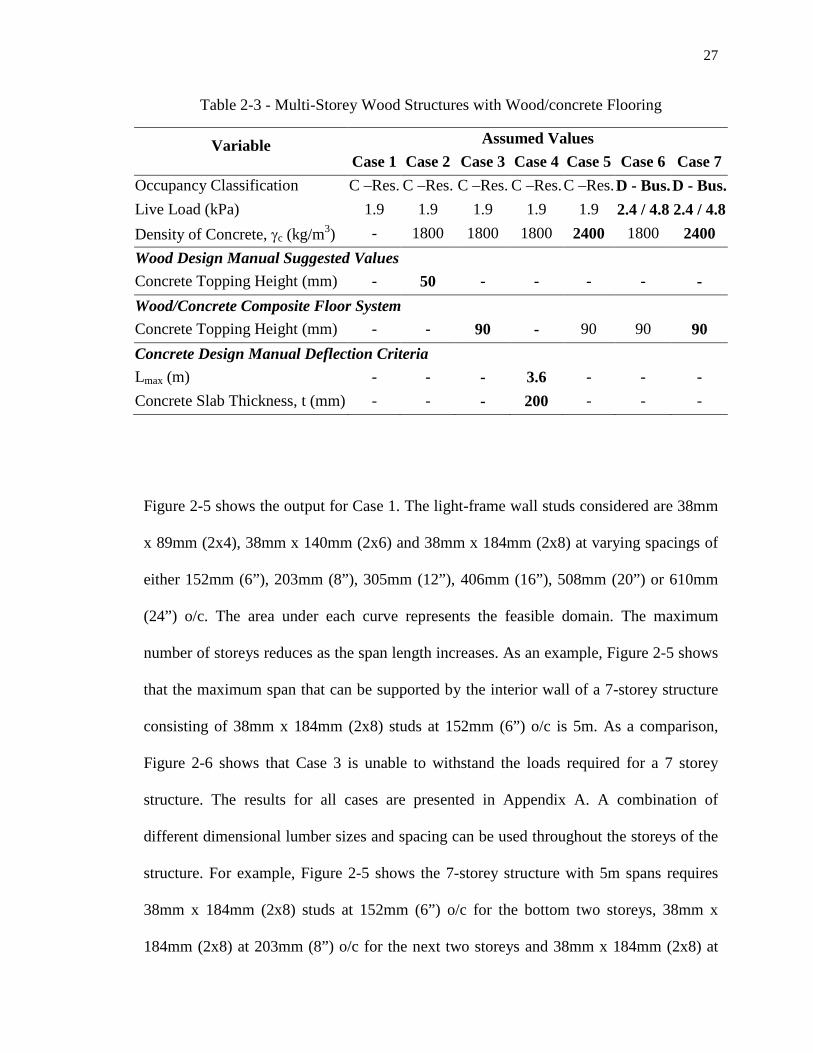
Table 2-3 lists the seven cases investigated. Each case investigates the effect on the
maximum number of storeys of changing the parameters shown in ‘bold’ font. The
various cases are further described as follows:
- Case 1 represents a wood structure with a wood floor system.
- Case 2 uses a 50mm thick concrete topping that allows a wood floor system to
meet deflection criteria, and achieves the required 1-hour FRR using a
combination of concrete and plywood (CWC, 2010). This case results in the least
severe loading for any of the wood/concrete flooring alternatives investigated.
- Case 3 is the principal case. The 90mm concrete topping acts as the necessary
flexural compressive zone within the assumed wood/concrete hybrid floor system
and achieves the necessary 1- hr FRR specified in the NBCC (2010). This
concrete thickness was chosen by assessing various wood/concrete test specimens
26
reported in current literature and has the potential to increase the span length
beyond the limits shown in Table 2-1 (Chuan, 2009; Clouston, 2005, 2008;
Crocetti, 2010; Gutkowski, 2010; Kuhlmann, 2008; Lukaszewska, 2008, 2010;
Yoeh, 2010).
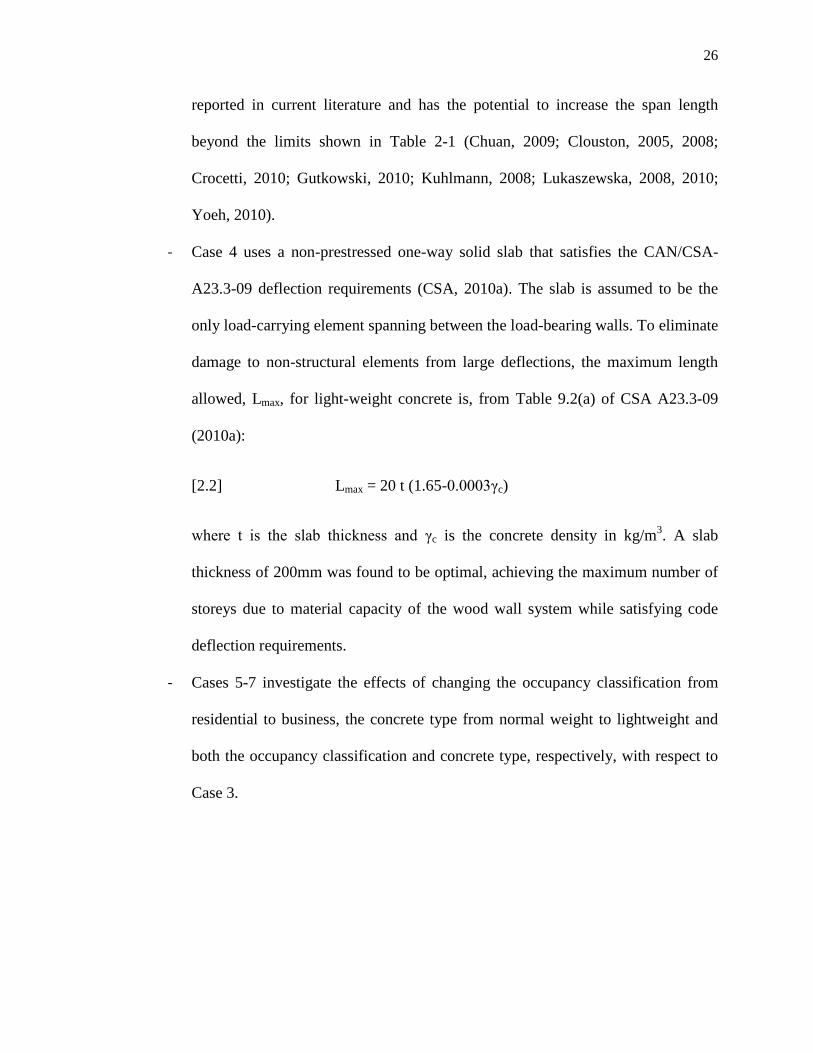
- Case 4 uses a non-prestressed one-way solid slab that satisfies the CAN/CSA-
A23.3-09 deflection requirements (CSA, 2010a). The slab is assumed to be the
only load-carrying element spanning between the load-bearing walls. To eliminate
damage to non-structural elements from large deflections, the maximum length
allowed, Lmax, for light-weight concrete is, from Table 9.2(a) of CSA A23.3-09
(2010a):
[2.2] Lmax = 20 t (1.65-0.0003γc)
where t is the slab thickness and γc is the concrete density in kg/m3. A slab
thickness of 200mm was found to be optimal, achieving the maximum number of
storeys due to material capacity of the wood wall system while satisfying code
deflection requirements.
- Cases 5-7 investigate the effects of changing the occupancy classification from
residential to business, the concrete type from normal weight to lightweight and
both the occupancy classification and concrete type, respectively, with respect to
Case 3.
27
Table 2-3 - Multi-Storey Wood Structures with Wood/concrete Flooring
Variable Assumed Values Case 1 Case 2 Case 3 Case 4 Case 5 Case 6 Case 7
Occupancy Classification C –Res. C –Res. C –Res. C –Res. C –Res. D - Bus. D - Bus. Live Load (kPa) 1.9 1.9 1.9 1.9 1.9 2.4 / 4.8 2.4 / 4.8 Density of Concrete, γc (kg/m3) - 1800 1800 1800 2400 1800 2400 Wood Design Manual Suggested Values Concrete Topping Height (mm) - 50 - - - - - Wood/Concrete Composite Floor System Concrete Topping Height (mm) - - 90 - 90 90 90 Concrete Design Manual Deflection Criteria Lmax (m) - - - 3.6 - - - Concrete Slab Thickness, t (mm) - - - 200 - - -
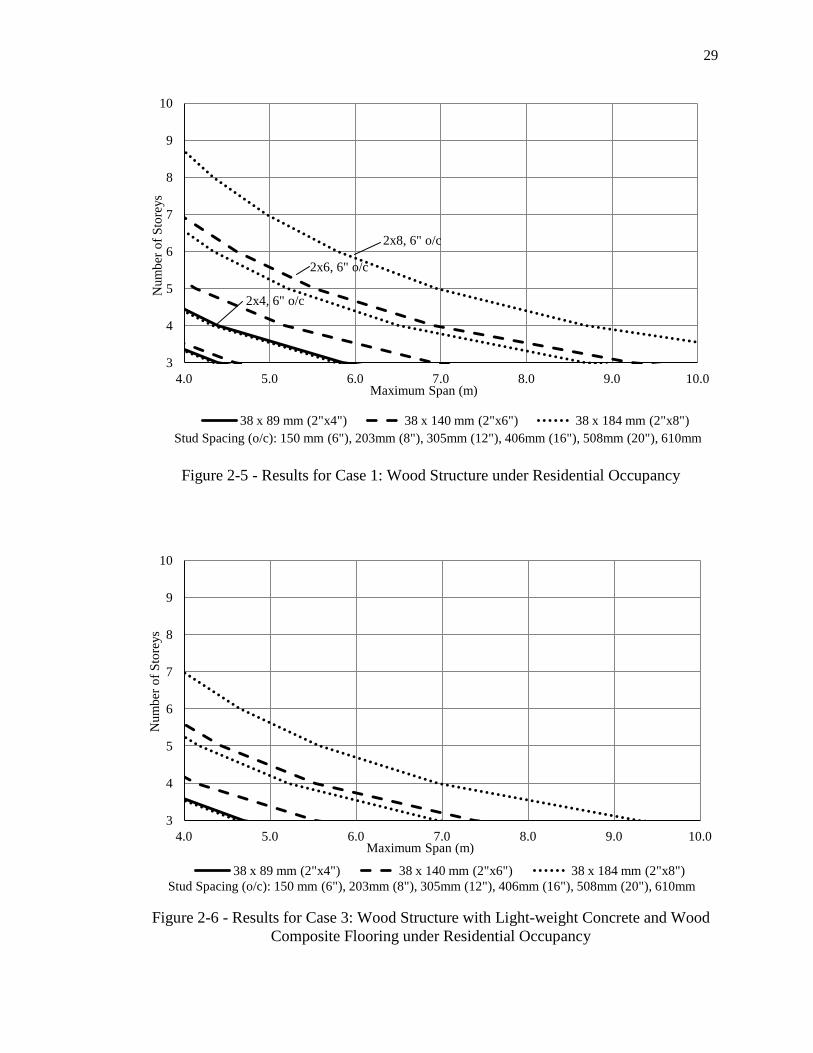
Figure 2-5 shows the output for Case 1. The light-frame wall studs considered are 38mm
x 89mm (2x4), 38mm x 140mm (2x6) and 38mm x 184mm (2x8) at varying spacings of
either 152mm (6”), 203mm (8”), 305mm (12”), 406mm (16”), 508mm (20”) or 610mm
(24”) o/c. The area under each curve represents the feasible domain. The maximum
number of storeys reduces as the span length increases. As an example, Figure 2-5 shows
that the maximum span that can be supported by the interior wall of a 7-storey structure
consisting of 38mm x 184mm (2x8) studs at 152mm (6”) o/c is 5m. As a comparison,
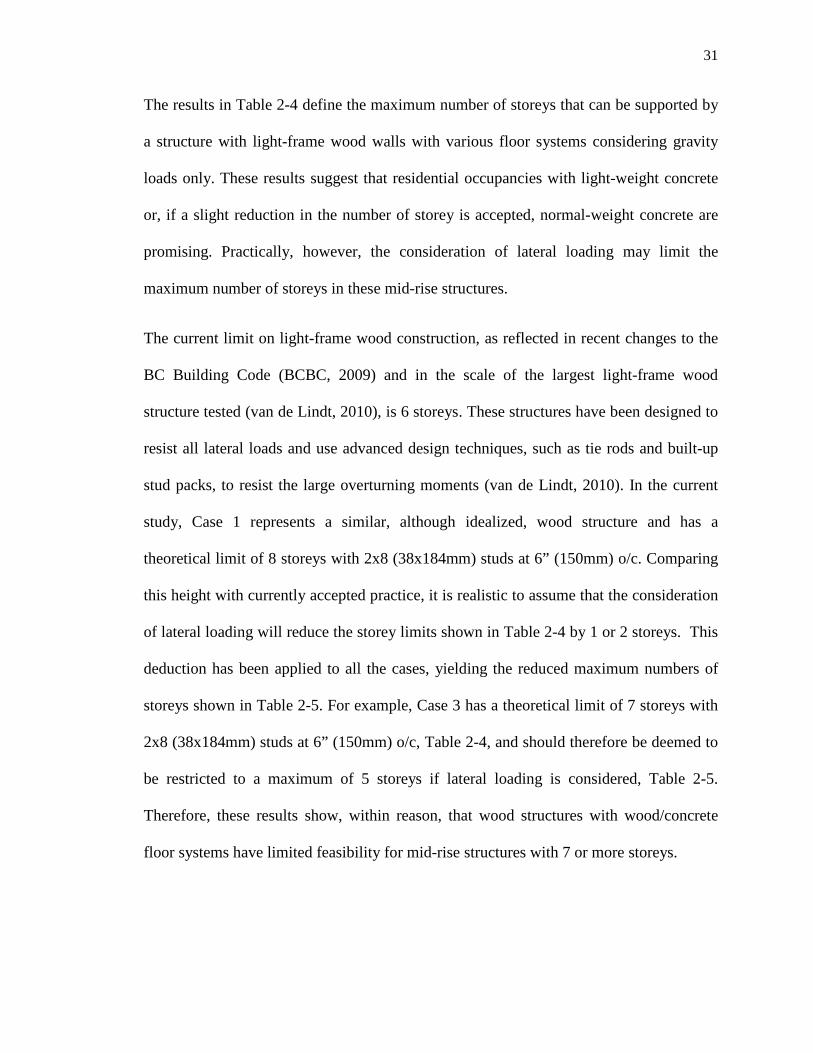
Figure 2-6 shows that Case 3 is unable to withstand the loads required for a 7 storey
structure. The results for all cases are presented in Appendix A. A combination of
different dimensional lumber sizes and spacing can be used throughout the storeys of the
structure. For example, Figure 2-5 shows the 7-storey structure with 5m spans requires
38mm x 184mm (2x8) studs at 152mm (6”) o/c for the bottom two storeys, 38mm x
184mm (2x8) at 203mm (8”) o/c for the next two storeys and 38mm x 184mm (2x8) at
28
305mm (12”) o/c for the remaining upper storeys. Regardless, the maximum wall
compressive capacity in all cases is for 38mm x 184mm (2x8) studs at 152mm (6”) o/c
and this capacity was used to determine the maximum number of storeys for each case.
Table 2-4 summarizes the results for all seven cases. In assessing the maximum number
of storeys it is assumed that the minimum acceptable span is 4.0m. This limit is realistic
for residential construction: for example, the spans used in the NEESWood Project were
approximately 4.0m (van de Lindt, 2010). The maximum span lengths are variables in the
results for Cases 1-7. In all cases, the maximum number of storeys decreases as the span
is increased. Therefore the use of span lengths greater than those shown in Table 2-1 will
markedly reduce the maximum number of storeys.
29
Figure 2-5 - Results for Case 1: Wood Structure under Residential Occupancy
Figure 2-6 - Results for Case 3: Wood Structure with Light-weight Concrete and Wood Composite Flooring under Residential Occupancy
3
4
5
6
7
8
9
10
4.0 5.0 6.0 7.0 8.0 9.0 10.0
Num
ber o
f Sto
reys
Maximum Span (m)
38 x 89 mm (2"x4") 38 x 140 mm (2"x6") 38 x 184 mm (2"x8") Stud Spacing (o/c): 150 mm (6"), 203mm (8"), 305mm (12"), 406mm (16"), 508mm (20"), 610mm
3
4
5
6
7
8
9
10
4.0 5.0 6.0 7.0 8.0 9.0 10.0
Num
ber o
f Sto
reys
Maximum Span (m)
38 x 89 mm (2"x4") 38 x 140 mm (2"x6") 38 x 184 mm (2"x8") Stud Spacing (o/c): 150 mm (6"), 203mm (8"), 305mm (12"), 406mm (16"), 508mm (20"), 610mm
2x8, 6" o/c
2x6, 6" o/c
2x4, 6" o/c

30
Table 2-4 shows that, for this simplified structure, Cases 1 and 2 give the greatest number
of storeys, 8, with 4.3m and 4.0m spans, respectively. For Case 2, this can be attributed to
the thin light-weight concrete topping on the floor system. Case 3 uses 90mm of concrete
and this extra weight reduces the maximum number of storeys by one, irrespective of the
wall stud size. Case 4 shows it is not feasible to design the concrete slab to be a structural
element in a mid-rise structure with wood stud walls as it requires a slab thickness that
markedly increases the dead load and reduces the maximum number of storeys to 5.
When the occupancy classification is changed from C (Residential), Case 3, to D
(Business), Case 6, the increased live load reduces the maximum number of storeys by
two to 5. Normal-weight concrete reduces the maximum number of storeys by one to 6,
as seen in the comparison between Case 5 with Case 3, and hence has potential to be
feasible. When combining the effects considered in Cases 5 and 6, as shown in Case 7,
there is little merit in pursuing a hybrid design for business occupancies using normal-
weight concrete.
Table 2-4 – Maximum Number of Storeys: Gravity Loading Only
Stud Size Result Criteria Case 1 2 3 4 5 6 7
38x184mm (2x8)
Max. Number of Storeys:
8 8 7 5 6 5 4
Span (m): 4.3 4.0 4.0 4.1 4.2 4.2 4.6
38x140mm (2x6)
Max. Number of Storeys:
6 6 5 4 5 4 < 4
Span (m): 4.6 4.2 4.4 4.1 4.0 4.0
38x89mm (2x4)
Max. Number of Storeys:
4 4 < 4 < 4 < 4 < 4 < 4
Span (m): 4.4 4.0
31
The results in Table 2-4 define the maximum number of storeys that can be supported by
a structure with light-frame wood walls with various floor systems considering gravity
loads only. These results suggest that residential occupancies with light-weight concrete
or, if a slight reduction in the number of storey is accepted, normal-weight concrete are
promising. Practically, however, the consideration of lateral loading may limit the
maximum number of storeys in these mid-rise structures.
The current limit on light-frame wood construction, as reflected in recent changes to the
BC Building Code (BCBC, 2009) and in the scale of the largest light-frame wood
structure tested (van de Lindt, 2010), is 6 storeys. These structures have been designed to
resist all lateral loads and use advanced design techniques, such as tie rods and built-up
stud packs, to resist the large overturning moments (van de Lindt, 2010). In the current
study, Case 1 represents a similar, although idealized, wood structure and has a
theoretical limit of 8 storeys with 2x8 (38x184mm) studs at 6” (150mm) o/c. Comparing
this height with currently accepted practice, it is realistic to assume that the consideration
of lateral loading will reduce the storey limits shown in Table 2-4 by 1 or 2 storeys. This
deduction has been applied to all the cases, yielding the reduced maximum numbers of
storeys shown in Table 2-5. For example, Case 3 has a theoretical limit of 7 storeys with
2x8 (38x184mm) studs at 6” (150mm) o/c, Table 2-4, and should therefore be deemed to
be restricted to a maximum of 5 storeys if lateral loading is considered, Table 2-5.
Therefore, these results show, within reason, that wood structures with wood/concrete
floor systems have limited feasibility for mid-rise structures with 7 or more storeys.
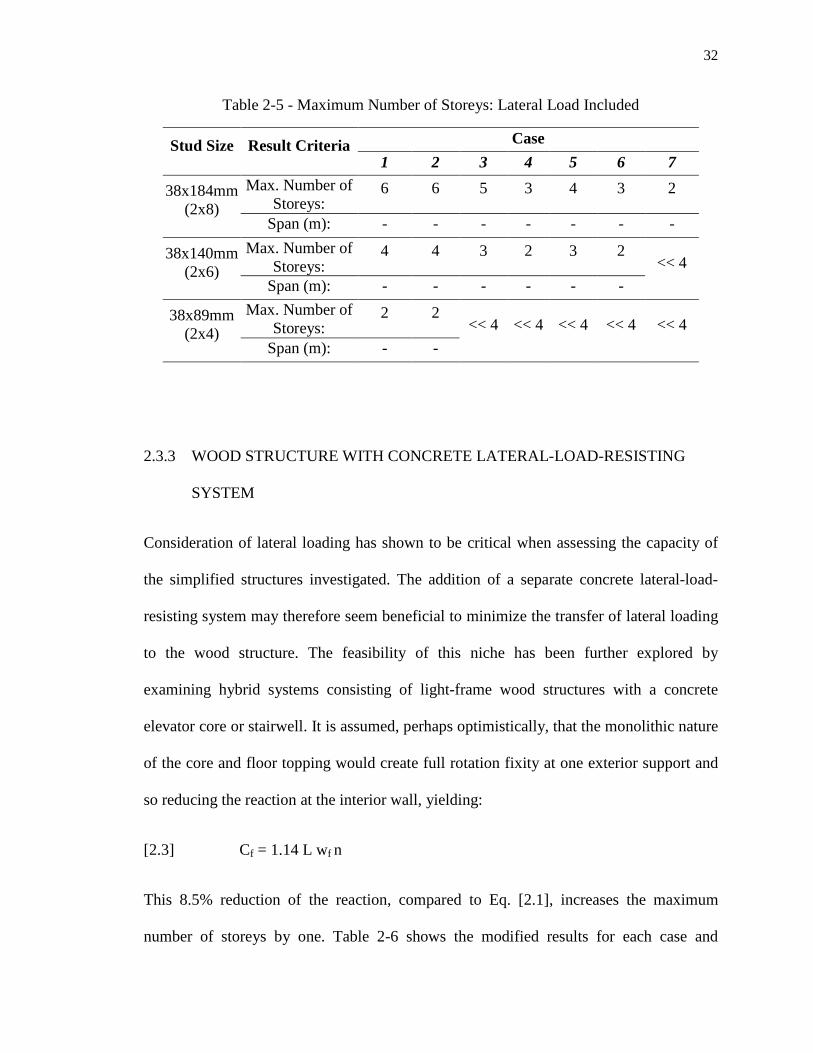
32
Table 2-5 - Maximum Number of Storeys: Lateral Load Included
Stud Size Result Criteria Case 1 2 3 4 5 6 7
38x184mm (2x8)
Max. Number of Storeys:
6 6 5 3 4 3 2
Span (m): - - - - - - -
38x140mm (2x6)
Max. Number of Storeys:
4 4 3 2 3 2 << 4
Span (m): - - - - - -
38x89mm (2x4)
Max. Number of Storeys:
2 2 << 4 << 4 << 4 << 4 << 4
Span (m): - -
2.3.3 WOOD STRUCTURE WITH CONCRETE LATERAL-LOAD-RESISTING
SYSTEM
Consideration of lateral loading has shown to be critical when assessing the capacity of
the simplified structures investigated. The addition of a separate concrete lateral-load-
resisting system may therefore seem beneficial to minimize the transfer of lateral loading
to the wood structure. The feasibility of this niche has been further explored by
examining hybrid systems consisting of light-frame wood structures with a concrete
elevator core or stairwell. It is assumed, perhaps optimistically, that the monolithic nature
of the core and floor topping would create full rotation fixity at one exterior support and
so reducing the reaction at the interior wall, yielding:
[2.3] Cf = 1.14 L wf n
This 8.5% reduction of the reaction, compared to Eq. [2.1], increases the maximum
number of storeys by one. Table 2-6 shows the modified results for each case and

33
demonstrates that attaching a concrete core to the wood structure with wood/concrete
floors creates further potential for this niche area.
Table 2-6 - Maximum Number of Storeys: Gravity Loading with Lateral-load-resisting System
Stud Size Result Criteria Case 1 2 3 4 5 6 7
38x184mm (2x8)
Max. Number of Storeys:
9 9 8 6 7 6 5
Span (m): 4.3 4.0 4.0 4.1 4.2 4.2 4.6
38x140mm (2x6)
Max. Number of Storeys:
7 7 6 5 6 5 <5
Span (m): 4.6 4.2 4.4 4.1 4.0 4.0
38x89mm (2x4)
Max. Number of Storeys:
5 5 <5 <5 <5 <5 <5
Span (m): 4.4 4.0
Within this study, the maximum number of storeys for a wood structure with a
wood/concrete floor system, whether attached or not attached to a concrete lateral-load-
resisting system, has been shown to be limited to 8 or 9 storeys. This limit is based on
optimistic assumptions and is dependent on large 38mm x 184mm (2x8) studs at small
152mm (6”) spacings and short 4m spans. When considering the effect of lateral loading
and incompatibilities between the two materials, the use of light-frame wood as load-
bearing elements in mid-rise wood structures with composite wood/concrete floors is
generally not feasible. Even with future research, there is limited potential to reach more
than eight storeys with load-bearing light-frame timber. The use of non-traditional timber
sizes (i.e., 3”x6”, 910mm x 1830mm) may be necessary to realize the feasibility of hybrid
34
systems with load-bearing wood walls. In Europe, "light-frame" wood construction
includes wood members with a minimum cross-sectional area dimension of 160mm
(Frangi, 2011).
There is little literature on hybrid light-frame wood/concrete systems and currently this
type of design is restricted to structures with up to 4 storeys (Gagnon, 2006) due to the
accumulation of material incompatibilities in taller structures. Further work is currently
being done within the NEWBuildS Network (Chui, 2009) to assess the interaction of the
two materials.
2.3.4 REINFORCED CONCRETE STRUCTURE WITH LIGHT-FRAME WOOD
INFILL WALLS
This niche alternative considers light-frame wood walls in conventional reinforced
concrete frame structures. It has been shown in Sections 2.3.3 that a light-frame wood
wall has limited load-bearing capacity, especially for taller structures. To further
investigate whether these walls are capable participating with the concrete load-carrying
system, the maximum compressive capacity of a 1m wide wall for dry, untreated SPF
timber was computed and compared to the compressive demand due to overturning from
lateral loading, combined with gravitational loads, for a 10 storey reinforced concrete
structure with an aspect ratio of 0.7. The compressive demand at the base of the structure
is approximately twice the capacity of a 1m wide section of a sheathed wood wall
comprising of 2x8 (38mm x 184mm) SPF studs at 6” (152mm) o/c. It was therefore
deemed unrealistic to use light-frame exterior wood infill walls as load-bearing elements
within a mid- to high-rise structure.
35
Non-load-bearing infill walls have been successfully implemented in Europe, including
use in high-rise buildings in non-seismic zones (Eriksson, 2005). This type of infill wall
system is popular due to high energy conservation properties of wood and the simple
construction techniques that can be adaptable to various building systems (Wang, 2011;
Gagnon, 2006). Despite this, the associated design criteria and available literature is
limited. There is little information on design limitations, such as structure height, and
current knowledge seems to be experience-based with little basis in the fundamentals of
structural mechanics.
Standard practice for existing wood infill wall designs feature a gap of 15 to 20mm
(Eriksson, 2005) around the perimeter of the wall to accommodate in-plane deformations
of the reinforced concrete frame and ensuring the infill wall remains non-loadbearing.
This gap also helps to avoid potential material incompatibility issues, as the concrete and
wood are free to expand and contract without being restrained by the other material. In
fact, these material changes are mainly limited to the concrete as the expansion and
contraction of the wood infill wall will only occur in the top and bottom plates in the
radial and tangential directions (i.e., parallel to the grain) (Keenan, 1986). This avoids
accumulated stresses over the height of the structure from attached wood systems, a
concern relevant to other wood/concrete hybrid systems, as well as any significant
contribution from the infill wall to the change in gap. The gap also has the potential to
accommodate concrete construction tolerances. On-site geometric tolerances, however,
may be substantially less or substantially greater than these values since other types of
exterior cladding and wall systems, such as light-gauge steel framing and precast
concrete panels, recommend a tolerance of +/- 1.5 in. (38.1mm) (e.g. CSSBI, 1992).
36
Further research within the present study will focus on connections that effectively
transfer load and isolate material incompatibilities, are readily constructed using
conventional methods and accommodate realistic concrete construction tolerances.
The structural performance of these wall systems is important, however, fire resistance of
the walls may be a more serious constraint. The NBCC (2010) permits an exterior non-
load-bearing wall assembly that includes combustible components to be used in a
building of non-combustible construction, such as an wood infill wall in a concrete
frame, only if the building is sprinklered and the interior surface of the wall assembly is
protected by a thermal barrier. These requirements are readily addressed. Currently, the
most stringent Canadian requirement is that the exterior walls must conform to the ‘Fire
Test of Exterior Wall Assemblies’ (NBCC, 2010), especially if untreated exterior
cladding is used (Mehaffey, 2010). This needs to be addressed before of light-frame
wood wall can be successfully implemented in mid- or high-rise structures.
2.4 SUMMARY AND CONCLUSION
This investigation has define a spectrum of potential niche areas for light-frame
wood/concrete hybrid systems in mid-rise structures. Each alternative considered
represents a hybrid system that allows the two materials to complement each other. A
number of niche areas were reviewed that were limited by challenges such as material
incompatibilities and fire resistance. The following three, out of the eight, potential niche
areas were chosen to be assessed in further detail:
1. Load-bearing light-frame wood walls combined with floor systems featuring non-
composite concrete topping, wood/concrete composite construction or concrete
37
one-way slabs. The feasibility study investigated various combinations of gravity
loading where the axial capacity of the stud wall at the base of the structure was
used to determine the maximum number of storeys. These results were then
compared to existing structures to determine the potential contribution of lateral
loading. With these assumptions, an apporximate maximum number of storeys
was determined.
2. Gravity-load-resisting light-frame wood structure with a reinforced concrete
lateral-load-resisting system, such as concrete elevator shafts and stairwells.
Introducing these systems into a largely light-frame wood structure could mitigate
fire resistance and enhance the overall stability of the structure. The same
procedure used to assess the wood structure without the lateral-load-resisting
system was adopted. The results indicate that the concrete lateral-load-resisting
system allows an increase of an extra storey since the connection of the wood
system to the concrete system is assumed to be fixed. Also, any reduction in
storeys due to the additional demands caused by lateral loading is avoided.
3. Light-frame wood infill walls in reinforced concrete frame structures. A brief
investigation was carried out on a load-bearing infill wall system. There are
existing applications of this type of system throughout Europe, include high-rise
buildings, yet they seem unfeasible according to the requirements of Canadian
codes. Further structural research includes connection detailing, concrete
geometric tolerances that must be accommodated and storey restriction necessary
to ensure minimal damage from the sway deflections of the concrete structure.
38
Upon further review of the three potentially feasible niche areas, the following
conclusions can be made:
1. Light-frame wood structures with wood/concrete floor systems are most
preferable for a residential occupancies, where a maximum of 6 storeys is
possible if light-weight concrete topping is used. The use of normal-weight
concrete reduces the maximum number of storeys by one. Such systems are
clearly not feasible for buildings with business occupancies, particularly as such
structures require span lengths longer than 4m to create open-concept floor
layouts. They are also not feasible for the case of a full-depth concrete slab as the
floor system.
2. Overall, there is limited feasibility in pursuing light-frame wood structures
combined with wood/concrete floor systems for 7 or more storeys, if the
maximum span is 4m and current techniques for light-frame wood structures is
used for resisting lateral loads. The compressive capacity of the load-bearing
dimensional lumber is a limiting factor, however alternatives with larger cross-
sections and/or use engineered wood products, as well as the use of combining
studs to create built-up stud packs, may need consideration.
3. Similar conclusions can be made for gravity-load-resisting light-frame wood
structures with a concrete lateral-load-resisting system, although such systems
have the potential to reach 9 storeys. Material incompatibilities are still a
challenge, however, since their effects accumulate as the height of the structure
increases. These issues are currently being investigated by projects within the
NEWBuildS Network and may therefore be deemed feasible in the future.
39
4. Preliminary calculations have demonstrated that light-frame wood infill walls are
not feasibly for use as a load-bearing element.
5. The most promising niche is the use of light-frame wood infill walls in reinforced
concrete frame structures. These wall systems must remain non-load-bearing
during in-plane deformations of the reinforced concrete frame structure and so
require a gap around the perimeter of the wood wall. Design limitations for this
type of wood/concrete hybrid system, such as the size of the gap, need to be
quantified in the context of Canadian standards before this construction can be
used in mid- to high-rise structures.
40
3
3.1 OBJECTIVE
TEST DESIGN AND CONSTRUCTION
Chapter 2 identified non-load-bearing light-frame wood infill walls in mid- to high-rise
reinforced concrete frame structures as a feasible niche area for hybrid wood/concrete
construction. The research presented in this chapter investigates realistic in-plane
boundary conditions at serviceability and ultimate limit states for a light-frame wood
infill wall created by the deformations of a reinforced concrete frame, and a means to
subject a full-scale wall specimen to these deformations in the laboratory. The application
of out-of-plane wind loading will also be presented.
The specific objectives are:
- To quantify the critical storey deformations in a typical multi-storey reinforced
concrete frame due to in-plane wind loading and differential column creep.
- To design a test apparatus that can replicate these critical concrete frame
deformations, and also facilitate out-of-plane wind loading on a full-scale infill
wall specimen.
- To design the full-scale light-frame wood infill wall, including its connection to
the concrete frame.
The experimental investigation of its response to realistic in-plane and out-of-plane
loading will be presented in Chapter 4.
41
3.2 PROTOTYPE STRUCTURE
Figure 3-1 shows the simple sway frame structure from the Cement Association of
Canada Concrete Design Handbook, 2nd Edition (CAC, 1984), that was used as the
prototype structure for the present study. The frame is 8 storeys tall, excluding the
basement floor, with a typical storey height of 3.3m and a first storey height of 5.5m. The
column lines are at 6.5m o/c in both directions. Analysis of this frame is well
documented, allowing a new second-order analysis to be carried out using SAP2000
(SAP, 2009) which was checked by comparing the predicted first-order analysis response
to that originally reported (CAC, 1984), and to other previous work (Stead, 2010).
Separate linear elastic analyses were conducted to quantify the response for specified and
factored load levels.
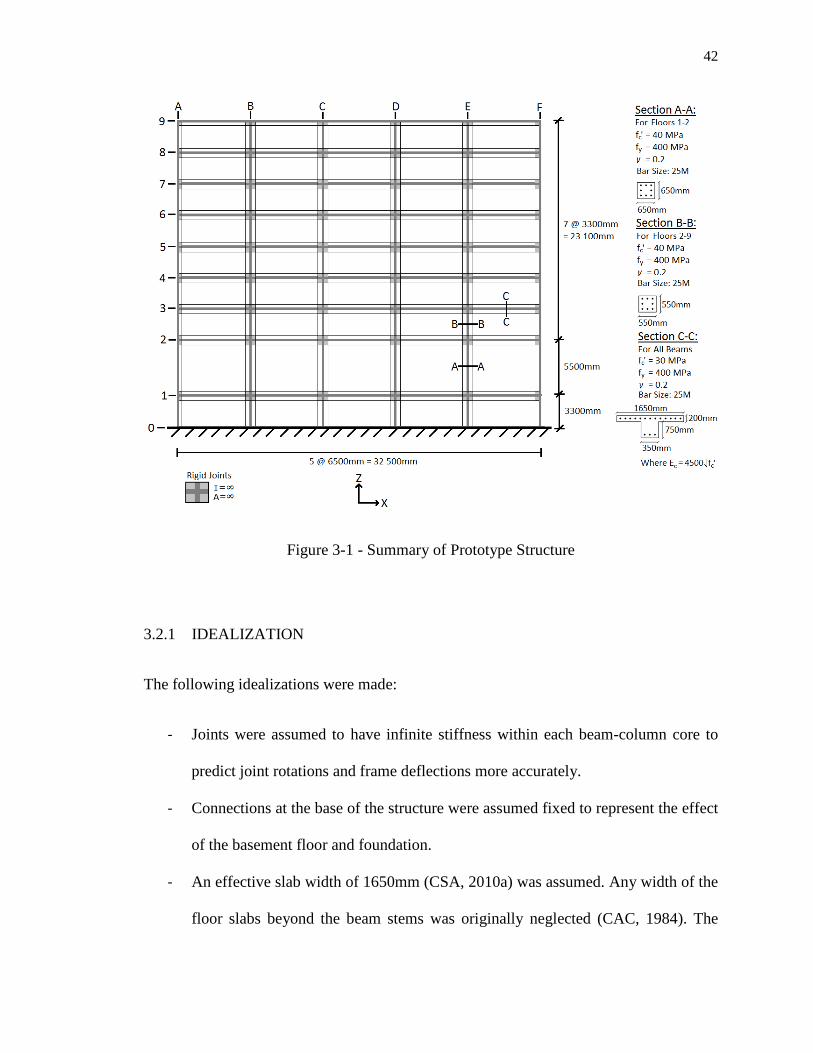
42
Figure 3-1 - Summary of Prototype Structure
3.2.1 IDEALIZATION
The following idealizations were made:
- Joints were assumed to have infinite stiffness within each beam-column core to
predict joint rotations and frame deflections more accurately.
- Connections at the base of the structure were assumed fixed to represent the effect
of the basement floor and foundation.
- An effective slab width of 1650mm (CSA, 2010a) was assumed. Any width of the
floor slabs beyond the beam stems was originally neglected (CAC, 1984). The
43
current idealization increases the moment of inertia of the beams and, therefore,
reduces the overall deflections.
- The column stiffnesses assumed to assess the response at specified load levels to
check Serviceability Limit States (SLS) are the gross (i.e., uncracked) values
whereas the beam stiffnesses are 50% of the gross values to account for cracking.
To investigate Ultimate Limit States at factored load levels, both the beam and
column stiffnesses were reduced by 30% to account for cracking of the concrete
and yielding of steel reinforcement (CSA, 2010a).
3.2.2 LOADING ASSUMPTIONS
A sustained dead load of 7.5 kPa (CAC, 1984) was applied. This accounts for the slab
weight of 4.8 kPa and the T-beam stems, equivalent to an additional dead load of 1.9 kPa.
The additional dead load is due to ceiling and floor finishes, etc. A live load of 5 kPa
(CAC, 1984), comparable to the specified office occupancy load of 4.8 kPa (NBCC,
2010), was also used. The live load was reduced by a Live Load Reduction Factor
(LLRF) of 0.47, which is appropriate for a ground floor interior column (NBCC, 2010).
The wind loads, specified by the NBCC (2010), were derived using the following
parameters:
- A 50-year reference velocity pressure, q, of 0.53 kN/m2, chosen to represent the
higher pressures specified for a building located in Ontario.
- A gust effect factor, Cg, of 2.0 as is appropriate for a slender high-rise structure
with H>20m and H/Ds>1, where H is the height of the building and Ds is the
smaller plan dimension.
44
- An exposure factor, Ce, corresponding to rough terrain that increases with the
height on the windward side and is uniform on the leeward side.
- External pressure coefficients, Cp, of 0.8 (windward side) and -0.5 (leeward side).
A summary of the wind loading details are presented in Appendix B-1. The load
combination at SLS, when wind is the principal action, is D+0.5L+0.75W as specified in
the NBCC (2010). The factored load combinations at ULS are 1.25D+1.5L+0.4W and
1.25D+0.5L+1.4W. The combination with the wind as the principal transient load
governs the sway deflections because the second-order effects are small.
3.2.3 PRINCIPAL IN-PLANE DEFLECTIONS
Figure 3-2 shows the three principal deflections that have been identified for this study,
where:
- ∆L is the lateral (or sway) deformation of the column over one storey;
- ∆vc is the accumulated differential vertical deflection of the columns due to creep,
and;
- ∆vb is the vertical deformation of the beam between the columns including any
long-term deflection due to sustained loading.
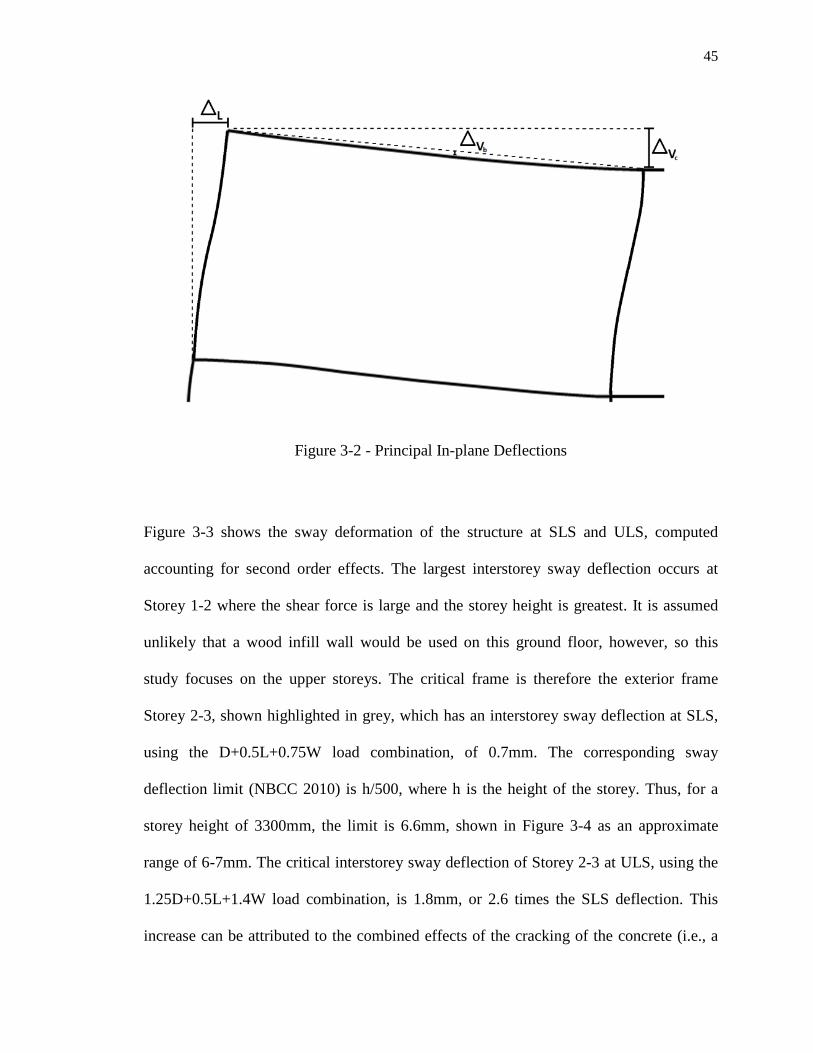
45
Figure 3-2 - Principal In-plane Deflections
Figure 3-3 shows the sway deformation of the structure at SLS and ULS, computed
accounting for second order effects. The largest interstorey sway deflection occurs at
Storey 1-2 where the shear force is large and the storey height is greatest. It is assumed
unlikely that a wood infill wall would be used on this ground floor, however, so this
study focuses on the upper storeys. The critical frame is therefore the exterior frame
Storey 2-3, shown highlighted in grey, which has an interstorey sway deflection at SLS,
using the D+0.5L+0.75W load combination, of 0.7mm. The corresponding sway
deflection limit (NBCC 2010) is h/500, where h is the height of the storey. Thus, for a
storey height of 3300mm, the limit is 6.6mm, shown in Figure 3-4 as an approximate
range of 6-7mm. The critical interstorey sway deflection of Storey 2-3 at ULS, using the
1.25D+0.5L+1.4W load combination, is 1.8mm, or 2.6 times the SLS deflection. This
increase can be attributed to the combined effects of the cracking of the concrete (i.e., a
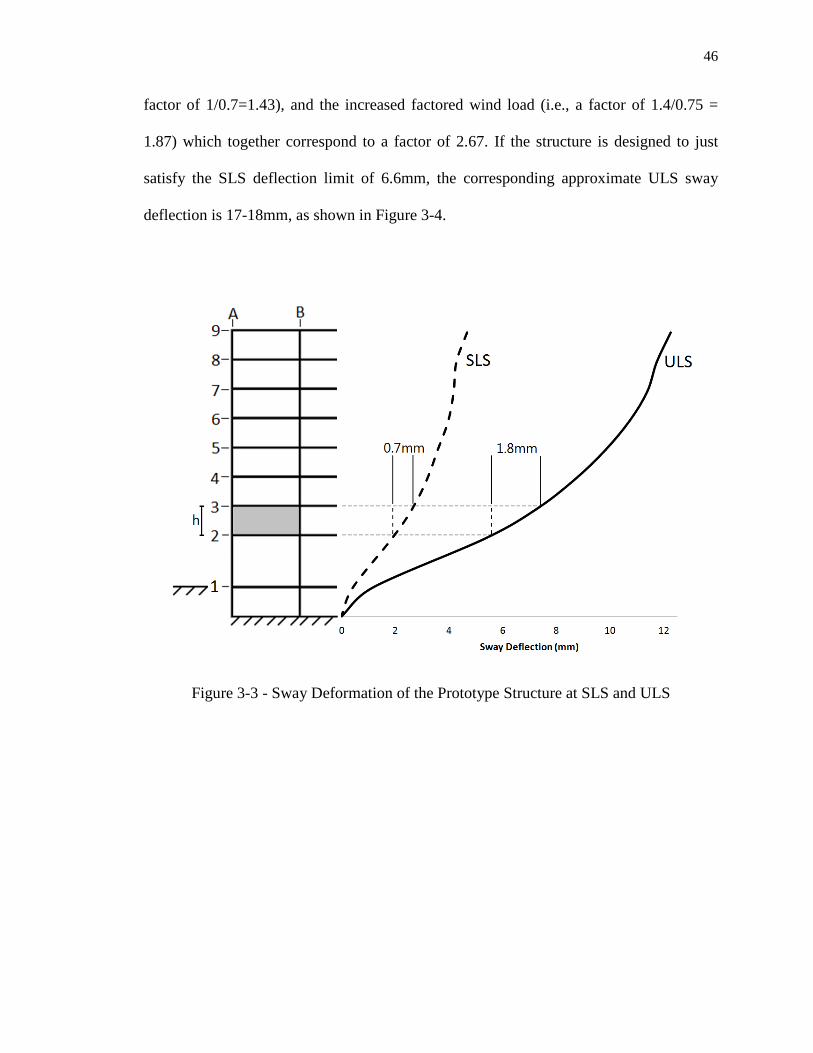
46
factor of 1/0.7=1.43), and the increased factored wind load (i.e., a factor of 1.4/0.75 =
1.87) which together correspond to a factor of 2.67. If the structure is designed to just
satisfy the SLS deflection limit of 6.6mm, the corresponding approximate ULS sway
deflection is 17-18mm, as shown in Figure 3-4.
Figure 3-3 - Sway Deformation of the Prototype Structure at SLS and ULS
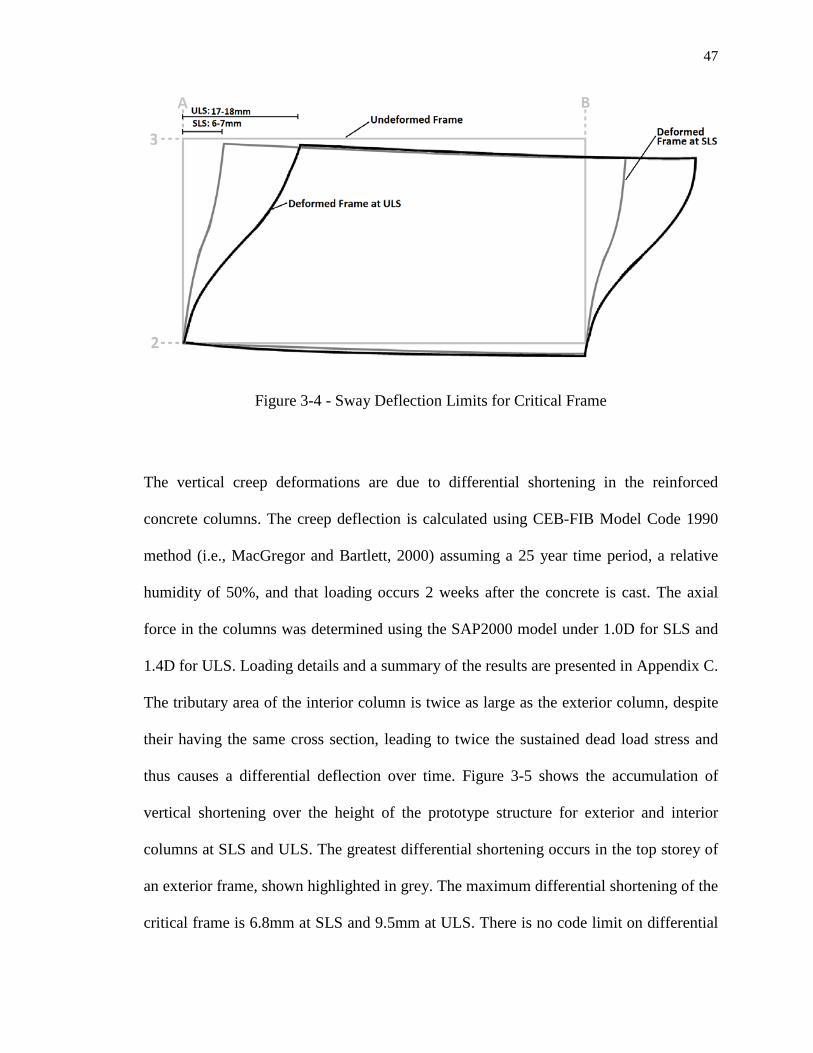
47
Figure 3-4 - Sway Deflection Limits for Critical Frame
The vertical creep deformations are due to differential shortening in the reinforced
concrete columns. The creep deflection is calculated using CEB-FIB Model Code 1990
method (i.e., MacGregor and Bartlett, 2000) assuming a 25 year time period, a relative
humidity of 50%, and that loading occurs 2 weeks after the concrete is cast. The axial
force in the columns was determined using the SAP2000 model under 1.0D for SLS and
1.4D for ULS. Loading details and a summary of the results are presented in Appendix C.
The tributary area of the interior column is twice as large as the exterior column, despite
their having the same cross section, leading to twice the sustained dead load stress and
thus causes a differential deflection over time. Figure 3-5 shows the accumulation of
vertical shortening over the height of the prototype structure for exterior and interior
columns at SLS and ULS. The greatest differential shortening occurs in the top storey of
an exterior frame, shown highlighted in grey. The maximum differential shortening of the
critical frame is 6.8mm at SLS and 9.5mm at ULS. There is no code limit on differential
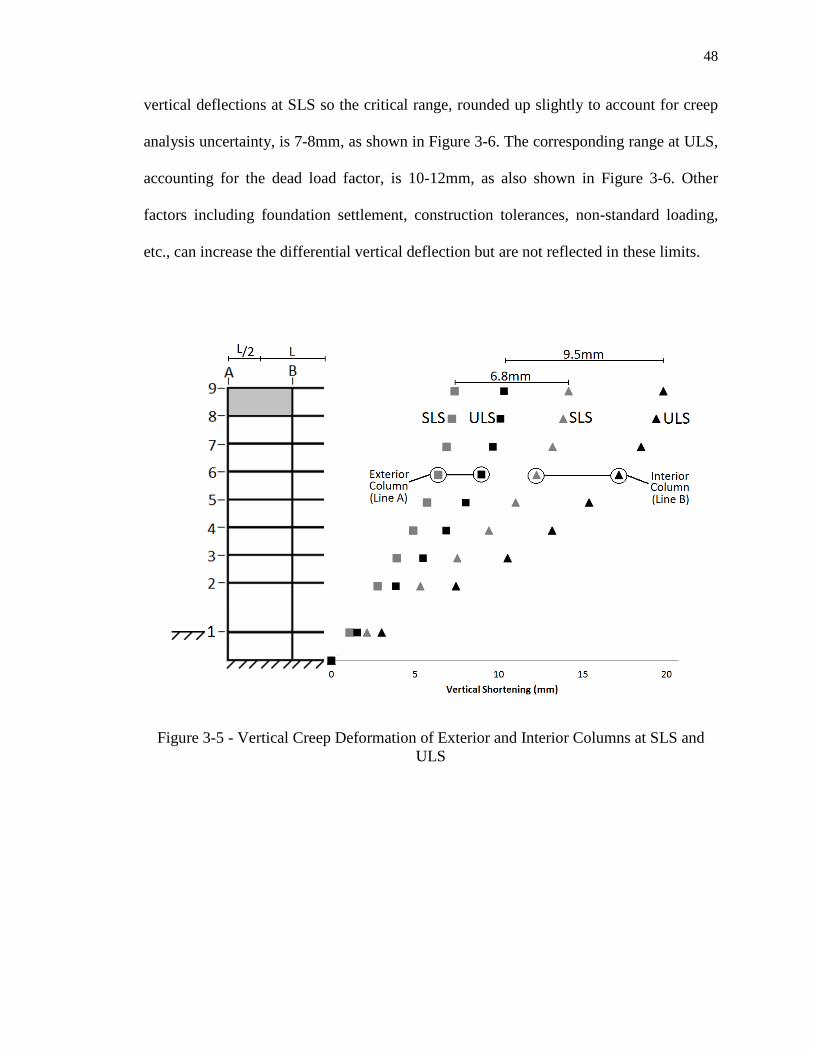
48
vertical deflections at SLS so the critical range, rounded up slightly to account for creep
analysis uncertainty, is 7-8mm, as shown in Figure 3-6. The corresponding range at ULS,
accounting for the dead load factor, is 10-12mm, as also shown in Figure 3-6. Other
factors including foundation settlement, construction tolerances, non-standard loading,
etc., can increase the differential vertical deflection but are not reflected in these limits.
Figure 3-5 - Vertical Creep Deformation of Exterior and Interior Columns at SLS and ULS
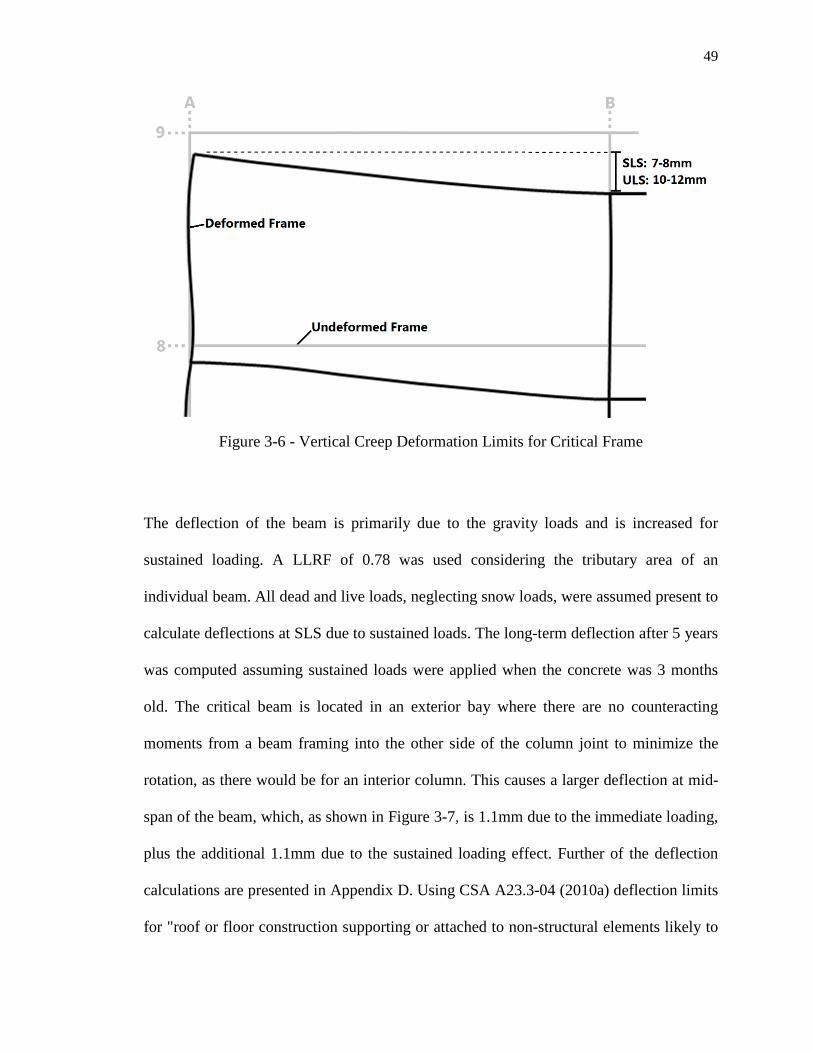
49
Figure 3-6 - Vertical Creep Deformation Limits for Critical Frame
The deflection of the beam is primarily due to the gravity loads and is increased for
sustained loading. A LLRF of 0.78 was used considering the tributary area of an
individual beam. All dead and live loads, neglecting snow loads, were assumed present to
calculate deflections at SLS due to sustained loads. The long-term deflection after 5 years
was computed assuming sustained loads were applied when the concrete was 3 months
old. The critical beam is located in an exterior bay where there are no counteracting
moments from a beam framing into the other side of the column joint to minimize the
rotation, as there would be for an interior column. This causes a larger deflection at mid-
span of the beam, which, as shown in Figure 3-7, is 1.1mm due to the immediate loading,
plus the additional 1.1mm due to the sustained loading effect. Further of the deflection
calculations are presented in Appendix D. Using CSA A23.3-04 (2010a) deflection limits
for "roof or floor construction supporting or attached to non-structural elements likely to
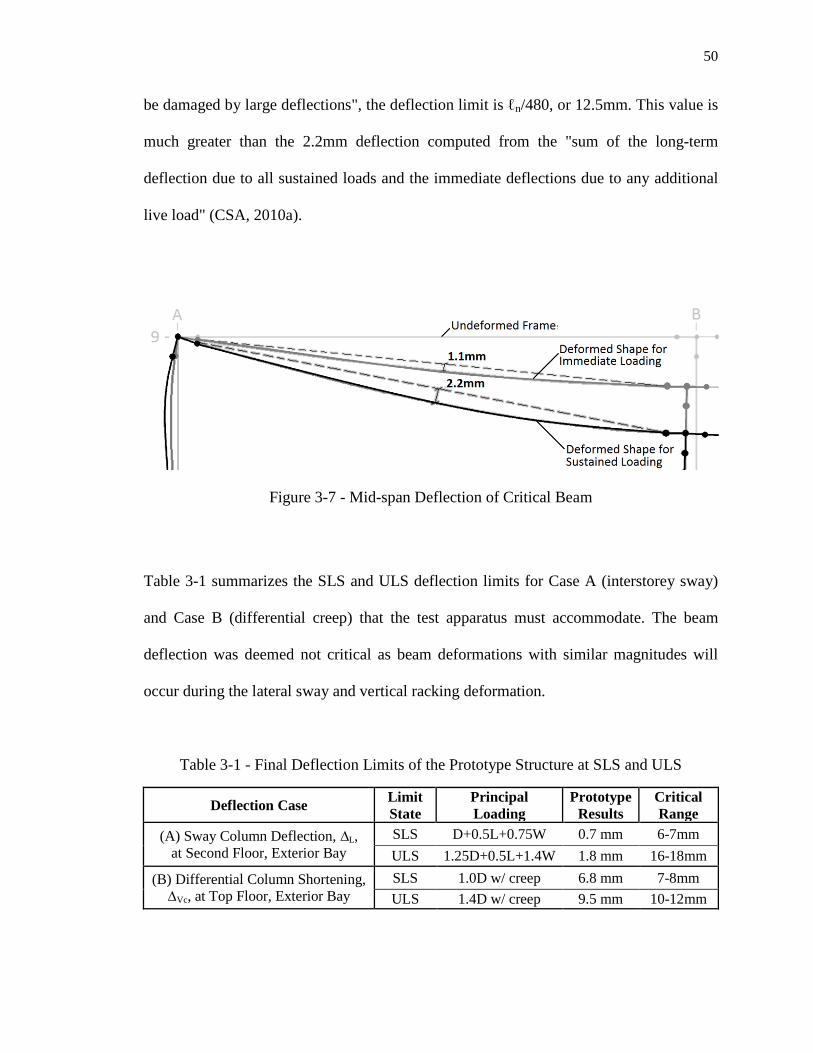
50
be damaged by large deflections", the deflection limit is ℓn/480, or 12.5mm. This value is
much greater than the 2.2mm deflection computed from the "sum of the long-term
deflection due to all sustained loads and the immediate deflections due to any additional
live load" (CSA, 2010a).
Figure 3-7 - Mid-span Deflection of Critical Beam
Table 3-1 summarizes the SLS and ULS deflection limits for Case A (interstorey sway)
and Case B (differential creep) that the test apparatus must accommodate. The beam
deflection was deemed not critical as beam deformations with similar magnitudes will
occur during the lateral sway and vertical racking deformation.
Table 3-1 - Final Deflection Limits of the Prototype Structure at SLS and ULS
Deflection Case Limit State
Principal Loading
Prototype Results
Critical Range
(A) Sway Column Deflection, ∆L, at Second Floor, Exterior Bay
SLS D+0.5L+0.75W 0.7 mm 6-7mm ULS 1.25D+0.5L+1.4W 1.8 mm 16-18mm
(B) Differential Column Shortening, ∆Vc, at Top Floor, Exterior Bay
SLS 1.0D w/ creep 6.8 mm 7-8mm ULS 1.4D w/ creep 9.5 mm 10-12mm
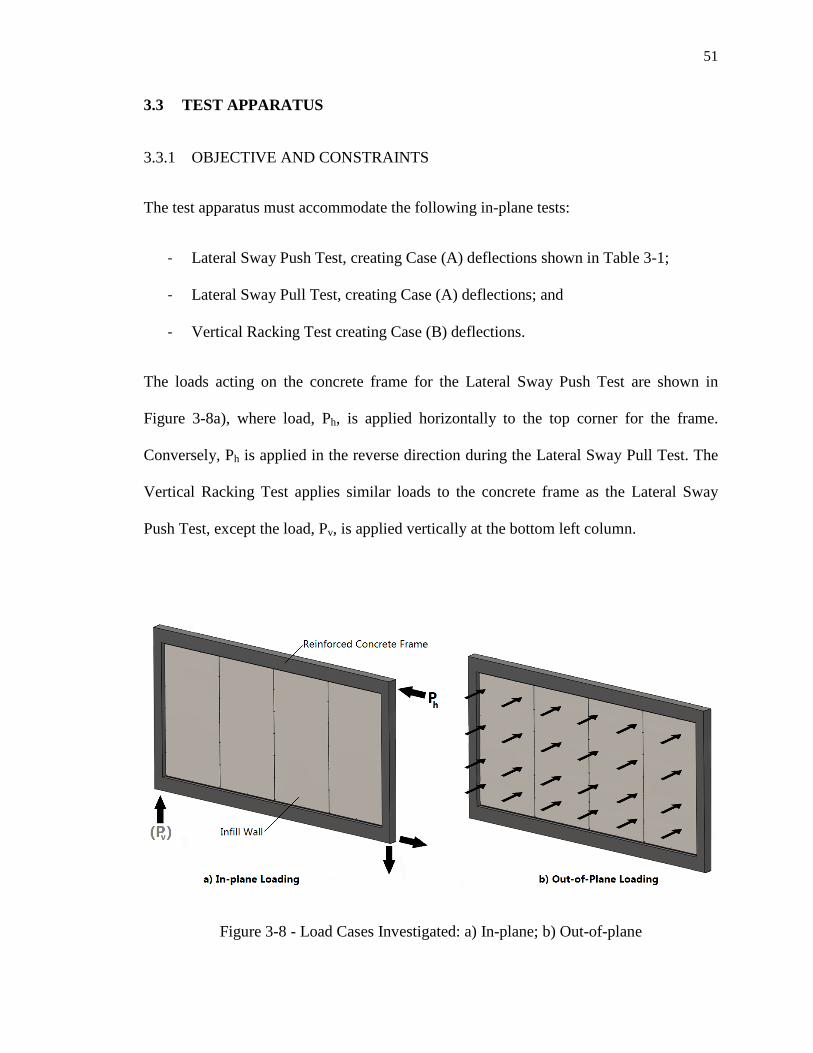
51
3.3 TEST APPARATUS
3.3.1 OBJECTIVE AND CONSTRAINTS
The test apparatus must accommodate the following in-plane tests:
- Lateral Sway Push Test, creating Case (A) deflections shown in Table 3-1;
- Lateral Sway Pull Test, creating Case (A) deflections; and
- Vertical Racking Test creating Case (B) deflections.
The loads acting on the concrete frame for the Lateral Sway Push Test are shown in
Figure 3-8a), where load, Ph, is applied horizontally to the top corner for the frame.
Conversely, Ph is applied in the reverse direction during the Lateral Sway Pull Test. The
Vertical Racking Test applies similar loads to the concrete frame as the Lateral Sway
Push Test, except the load, Pv, is applied vertically at the bottom left column.
Figure 3-8 - Load Cases Investigated: a) In-plane; b) Out-of-plane

52
The Out-of-plane Pressure Test applies a uniform pressure, shown in Figure 3-8b), to the
wood infill wall while restraining out-of-plane movement of the reinforced concrete
frame. The test pressures, shown in Table 3-2, are in accordance with wind loading
criteria in the NBCC (2010). The positive pressure case represents the combined effect of
positive external and negative internal pressures, and vice-versa. The positive pressure is
greater in magnitude because the external pressure coefficients for this case are greater.
Details of the pressure calculations are presented in Appendix B-2.
Table 3-2 - Positive and Negative Test Pressures
Limit State Positive Pressures (kPa) External
Negative Pressures (kPa) Internal Total External Internal Total
Serviceability 1.04 -0.4 1.44 -0.64 0.26 -0.9 Ultimate 1.94 -0.74 2.68 -1.19 0.49 -1.68
The test apparatus must also meet the following objectives:
- The aspect ratio of the test frame, length to height, must be approximately the
same as in the prototype structure, i.e., 2.0
- The vertical clearance between the concrete beams must accommodate an infill
wall of height 95 5/8” (2429mm), which accounts for pre-cut studs and single top
and bottom plates.
- The horizontal clearance between the concrete columns must accommodate an
infill wall of length 16ft (4877mm).

53
- The ratio of the column to beam moments of inertia of the test apparatus must be
approximately the same as that in the prototype structure (i.e., 0.33 based on the
cross section properties).
- The floor connections must provide boundary conditions that replicate the
deformed shape of a single storey within the prototype structure.
The test apparatus must also meet the following constraints:
- The anchor plates in the existing strong floor are spaced at 2439mm (8’) o/c in the
direction of the axis of the frame and 1219mm (4’) o/c normal to the frame axis.
- The maximum applied load should not exceed the capacity of the load cell, 46kN,
and must not exceed the capacity of the actuator, 90 kN.
- The weight of any unit must not exceed the capacity of the existing overhead
crane, 17.8kN (2 tons).
3.3.2 FINAL DESIGN
The final design of the test apparatus, shown in Figure 3-9, has been constructed at the
Insurance Research Lab for Better Homes (IRLBH). The steel frame acts as a reaction
frame for all in-plane tests with two connection points at the joints of the reinforced
concrete frame. A removable base at the bottom left corner facilitates the Vertical
Racking Tests and an Out-of-Plane Pressure Loading System is attached on the ‘exterior’
side of the apparatus for out-of-plane pressure testing.
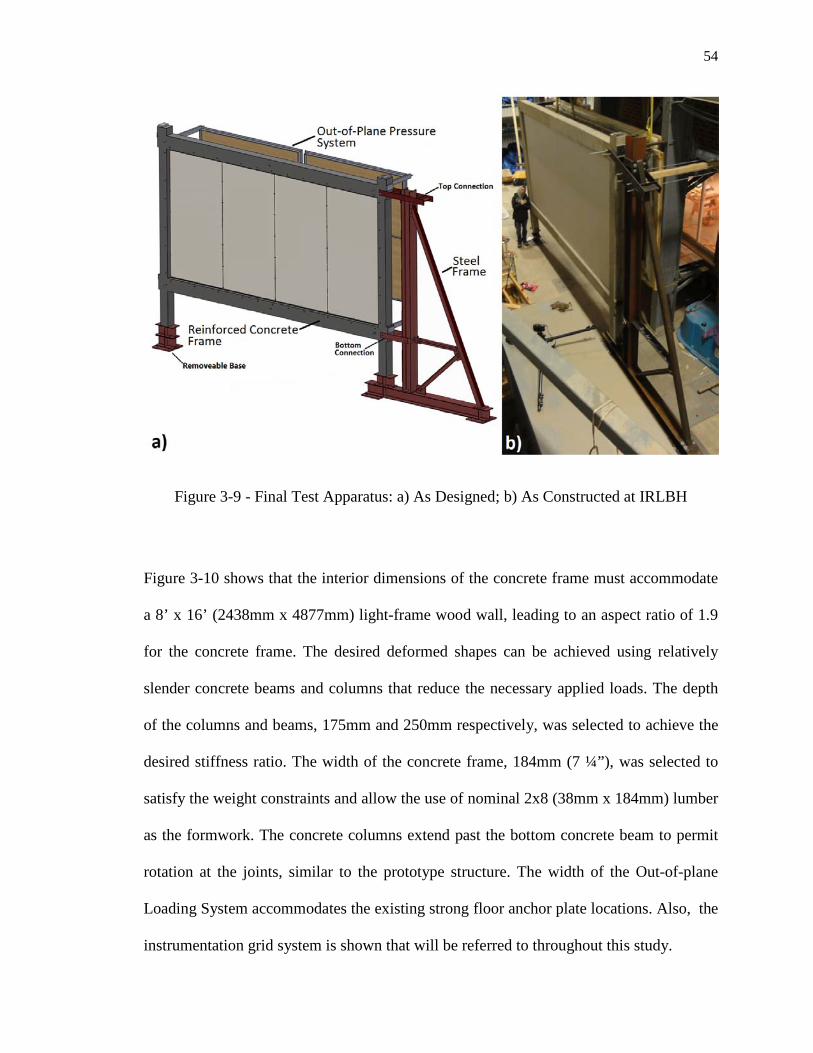
54
Figure 3-9 - Final Test Apparatus: a) As Designed; b) As Constructed at IRLBH
Figure 3-10 shows that the interior dimensions of the concrete frame must accommodate
a 8’ x 16’ (2438mm x 4877mm) light-frame wood wall, leading to an aspect ratio of 1.9
for the concrete frame. The desired deformed shapes can be achieved using relatively
slender concrete beams and columns that reduce the necessary applied loads. The depth
of the columns and beams, 175mm and 250mm respectively, was selected to achieve the
desired stiffness ratio. The width of the concrete frame, 184mm (7 ¼”), was selected to
satisfy the weight constraints and allow the use of nominal 2x8 (38mm x 184mm) lumber
as the formwork. The concrete columns extend past the bottom concrete beam to permit
rotation at the joints, similar to the prototype structure. The width of the Out-of-plane
Loading System accommodates the existing strong floor anchor plate locations. Also, the
instrumentation grid system is shown that will be referred to throughout this study.

55
Figu
re 3
-10
- Gen
eral
Lay
out o
f Tes
t App
arat
us w
ith In
stru
men
tal G
rid S
yste
m
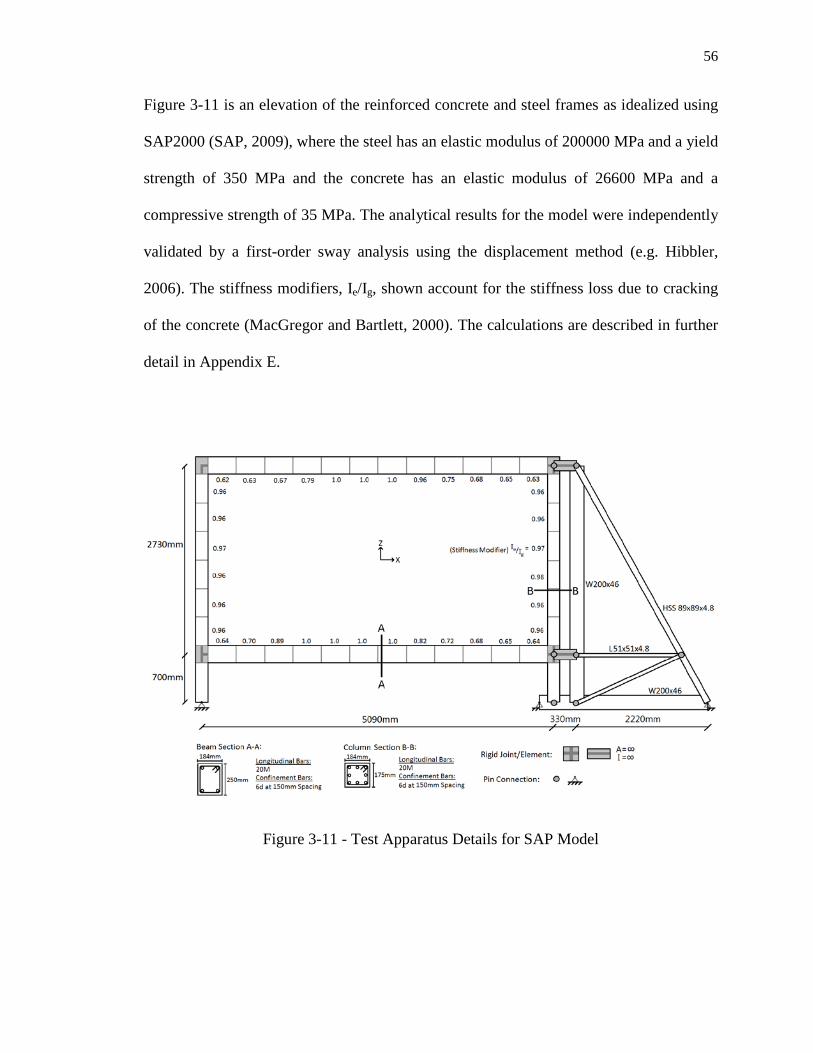
56
Figure 3-11 is an elevation of the reinforced concrete and steel frames as idealized using
SAP2000 (SAP, 2009), where the steel has an elastic modulus of 200000 MPa and a yield
strength of 350 MPa and the concrete has an elastic modulus of 26600 MPa and a
compressive strength of 35 MPa. The analytical results for the model were independently
validated by a first-order sway analysis using the displacement method (e.g. Hibbler,
2006). The stiffness modifiers, Ie/Ig, shown account for the stiffness loss due to cracking
of the concrete (MacGregor and Bartlett, 2000). The calculations are described in further
detail in Appendix E.
Figure 3-11 - Test Apparatus Details for SAP Model
57
The reinforced concrete frame was designed using CSA A23.3-04 (CSA, 2010a) and the
steel frame using CSA-S16-09 (CSA, 2010b). The force effects due to the applied loads
were based on results from a SAP2000 model using a load factor of 1.5. Detailed
engineering drawings for both frames are shown in Appendix F and limits used for design
are presented in Appendix G. To minimize costs, only the following three steel shapes
were used for the steel frame: W200x46, HSS 89x89x4.8 and L51x51x4.8. All
components were connected using pretensioned ASTM A325 3/4” (19mm) diameter
bolts. Table 3-3A and Table 3-3B shows the prototype and test apparatus deflections
under a lateral loading sway case at SLS and ULS, respectively, where the deflected
shape and points of interest are identified in Figure 3-12 and the horizontal displacement
at ∆T1' is used as the control displacement. The difference between the prototype structure
and test apparatus is also shown, where the values without brackets show that the
predicted deflection overestimates the observed response and the values with brackets
show that the predicted deflection underestimates the observed response. A difference of
over 0.5mm, highlighted in bold, has been used to identify points that have not been
accurately predicted. These results shows that the overall deflected shapes are similar,
however the test apparatus does not include the vertical component due to the self-weight
of the structure and live loads seen in the prototype structure. This is shown as an
increased difference between the vertical displacements on the left side of the frame (i.e.,
∆T1y and ∆ B1x) to the right side of the frame (i.e., ∆T1'y and ∆ B1'y). Despite this, the test
apparatus predicts the prototype structure to be within 2.4mm at SLS and 3.3mm at ULS,
which has been deemed to be sufficient.
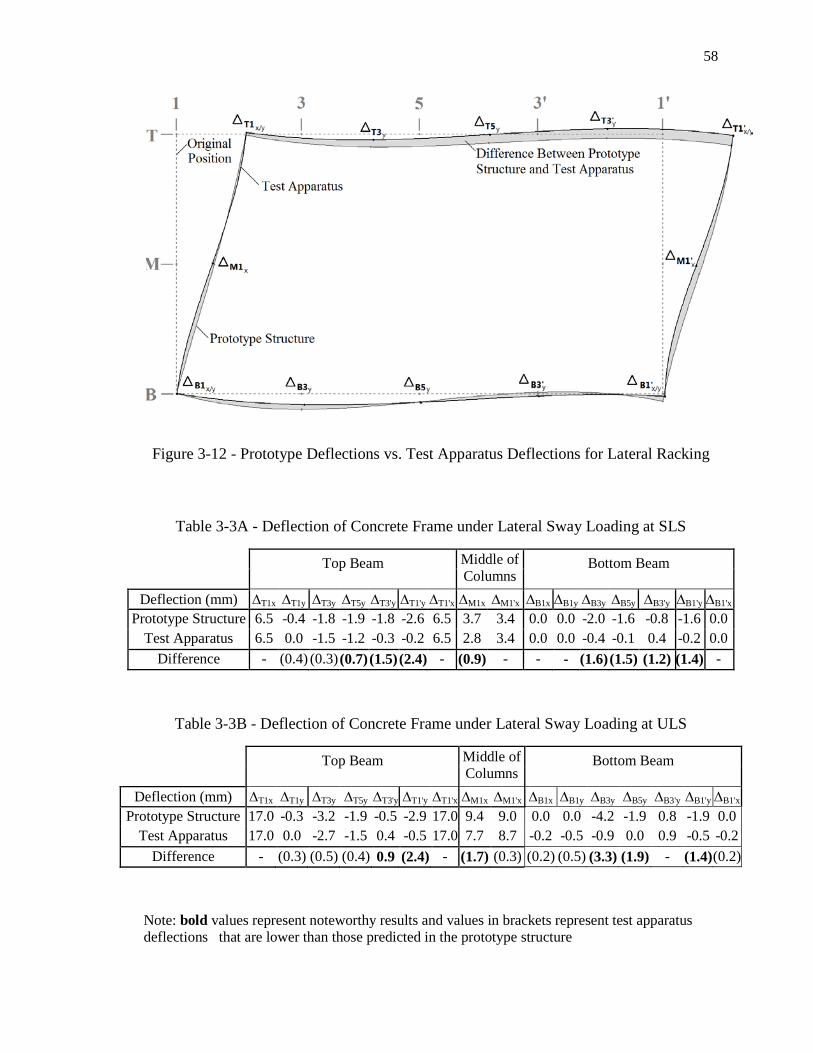
58
Figure 3-12 - Prototype Deflections vs. Test Apparatus Deflections for Lateral Racking
Table 3-3A - Deflection of Concrete Frame under Lateral Sway Loading at SLS
Top Beam Middle of Columns
Bottom Beam
Deflection (mm) ∆T1x ∆T1y ∆T3y ∆T5y ∆T3'y ∆T1'y ∆T1'x ∆M1x ∆M1'x ∆B1x ∆B1y ∆B3y ∆B5y ∆B3'y ∆B1'y ∆B1'x Prototype Structure 6.5 -0.4 -1.8 -1.9 -1.8 -2.6 6.5 3.7
3.4 0.0 0.0
-2.0 -1.6 -0.8 -1.6 0.0 Test Apparatus 6.5 0.0 -1.5 -1.2 -0.3 -0.2 6.5 2.8 3.4 0.0 0.0 -0.4 -0.1 0.4 -0.2 0.0
Difference - (0.4) (0.3) (0.7) (1.5) (2.4) - (0.9) - - - (1.6) (1.5) (1.2) (1.4) -
Table 3-3B - Deflection of Concrete Frame under Lateral Sway Loading at ULS
Top Beam Middle of Columns
Bottom Beam
Deflection (mm) ∆T1x ∆T1y ∆T3y ∆T5y ∆T3'y ∆T1'y ∆T1'x ∆M1x ∆M1'x ∆B1x ∆B1y ∆B3y ∆B5y ∆B3'y ∆B1'y ∆B1'x Prototype Structure 17.0 -0.3 -3.2 -1.9 -0.5 -2.9 17.0
9.4 9.0 0.0 0.0 -4.2 -1.9 0.8 -1.9 0.0 Test Apparatus 17.0 0.0 -2.7 -1.5 0.4 -0.5 17.0 7.7 8.7 -0.2 -0.5 -0.9 0.0 0.9 -0.5 -0.2
Difference - (0.3) (0.5) (0.4) 0.9 (2.4) - (1.7) (0.3) (0.2) (0.5) (3.3) (1.9) - (1.4) (0.2)
Note: bold values represent noteworthy results and values in brackets represent test apparatus deflections that are lower than those predicted in the prototype structure
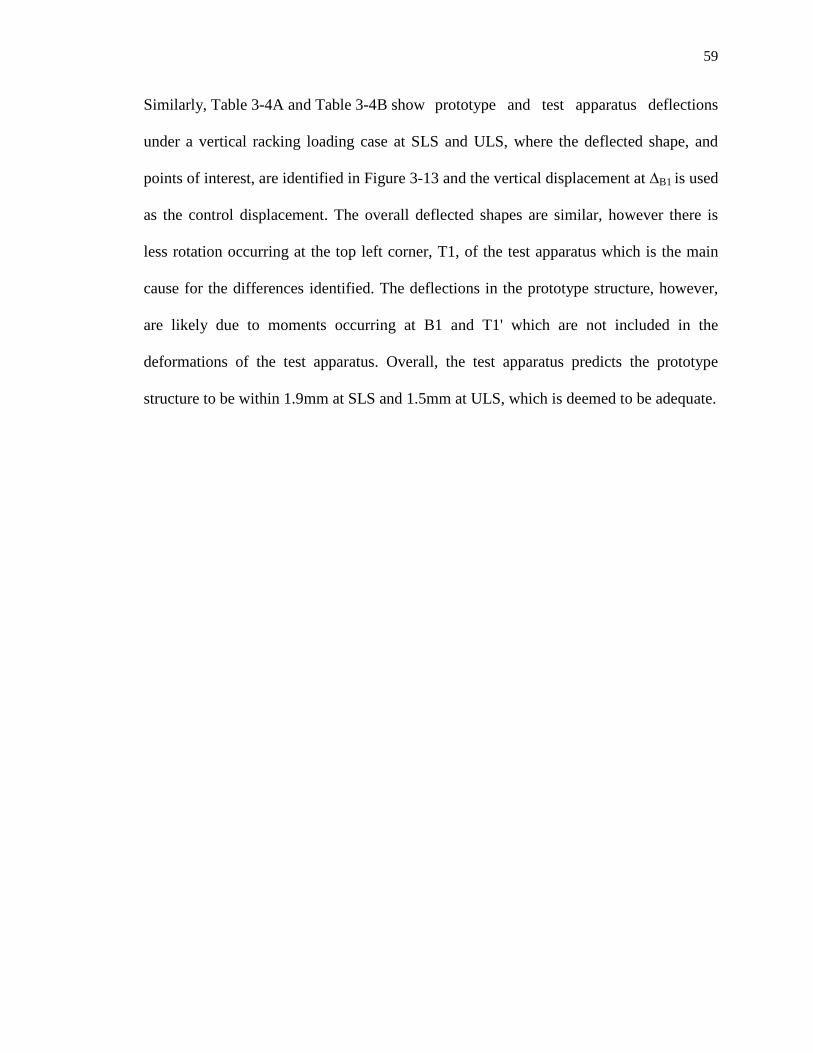
59
Similarly, Table 3-4A and Table 3-4B show prototype and test apparatus deflections
under a vertical racking loading case at SLS and ULS, where the deflected shape, and
points of interest, are identified in Figure 3-13 and the vertical displacement at ∆B1 is used
as the control displacement. The overall deflected shapes are similar, however there is
less rotation occurring at the top left corner, T1, of the test apparatus which is the main
cause for the differences identified. The deflections in the prototype structure, however,
are likely due to moments occurring at B1 and T1' which are not included in the
deformations of the test apparatus. Overall, the test apparatus predicts the prototype
structure to be within 1.9mm at SLS and 1.5mm at ULS, which is deemed to be adequate.
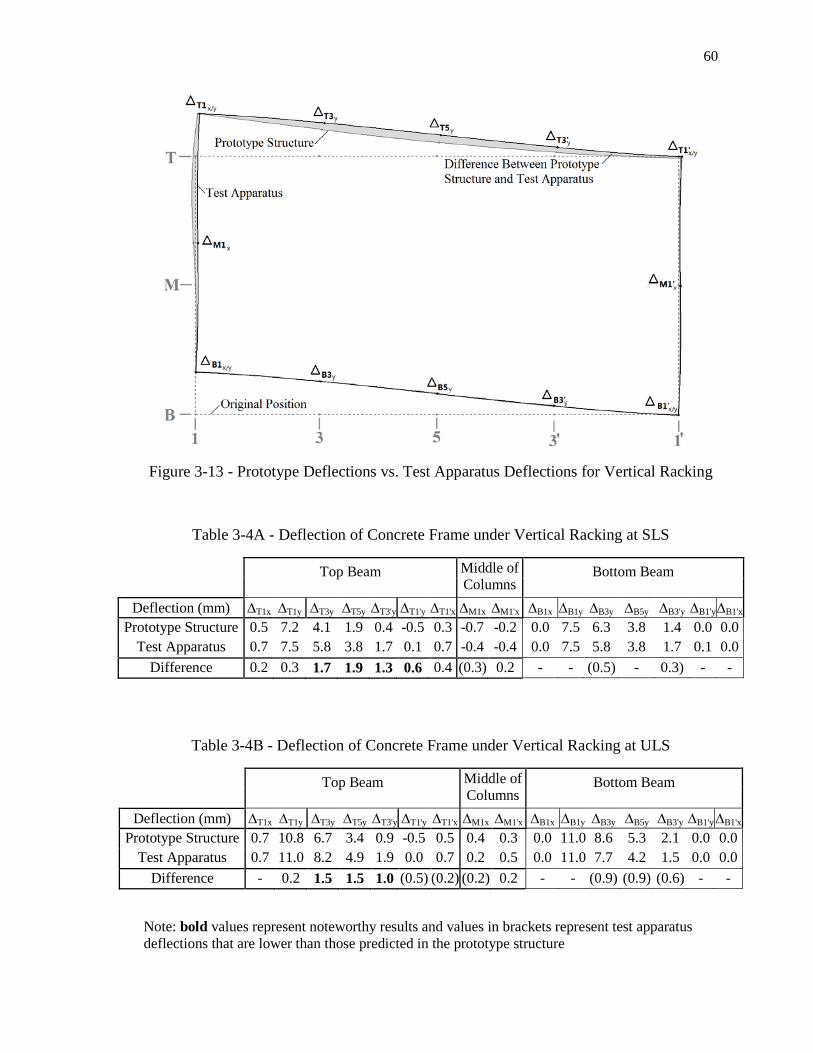
60
Figure 3-13 - Prototype Deflections vs. Test Apparatus Deflections for Vertical Racking
Table 3-4A - Deflection of Concrete Frame under Vertical Racking at SLS
Top Beam Middle of Columns
Bottom Beam
Deflection (mm) ∆T1x ∆T1y ∆T3y ∆T5y ∆T3'y ∆T1'y ∆T1'x ∆M1x ∆M1'x ∆B1x ∆B1y ∆B3y ∆B5y ∆B3'y ∆B1'y ∆B1'x Prototype Structure 0.5 7.2 4.1 1.9 0.4 -0.5 0.3 -0.7 -0.2 0.0 7.5 6.3 3.8 1.4 0.0 0.0
Test Apparatus 0.7 7.5 5.8 3.8 1.7 0.1 0.7 -0.4 -0.4 0.0 7.5 5.8 3.8 1.7 0.1 0.0 Difference 0.2 0.3 1.7 1.9 1.3 0.6 0.4 (0.3) 0.2 - - (0.5) - 0.3) - -
Table 3-4B - Deflection of Concrete Frame under Vertical Racking at ULS
Top Beam Middle of Columns
Bottom Beam
Deflection (mm) ∆T1x ∆T1y ∆T3y ∆T5y ∆T3'y ∆T1'y ∆T1'x ∆M1x ∆M1'x ∆B1x ∆B1y ∆B3y ∆B5y ∆B3'y ∆B1'y ∆B1'x Prototype Structure 0.7 10.8 6.7 3.4 0.9 -0.5 0.5 0.4 0.3 0.0 11.0 8.6 5.3 2.1 0.0 0.0
Test Apparatus 0.7 11.0 8.2 4.9 1.9 0.0 0.7 0.2 0.5 0.0 11.0 7.7 4.2 1.5 0.0 0.0 Difference - 0.2 1.5 1.5 1.0 (0.5) (0.2) (0.2) 0.2 - - (0.9) (0.9) (0.6) - -
Note: bold values represent noteworthy results and values in brackets represent test apparatus deflections that are lower than those predicted in the prototype structure
61
Uniform positive (or negative) out-of-plane pressures are applied to the ‘exterior’ side of
the wall by a sealed pressurized air bag shown in Figure 3-14. Six out-of-plane reaction
points, three along the top concrete beam and three along the bottom beam, restrain out-
of-plane movement of the reinforced concrete frame during testing. Pressure Load
Actuators (PLAs), attached to the back panel, generate positive and negative pressure
inside the airbag using control protocols and calibrations previously developed (e.g.
Nagy, 2008; Kopp, 2006).
Figure 3-14 - Out-of-Plane Pressure Loading System
3.3.3 DESIGN AND CONSTRUCTION CHALLENGES
Figure 3-15 shows that the as-built dimensions are within typical construction tolerances
of 12 to 19mm (1/2 to 3/4in) (CSA, 2010a). The out-of-plumbness of the columns
required minor revisions to the connections to the steel frame, however the as-built
tolerances were readily accommodated.
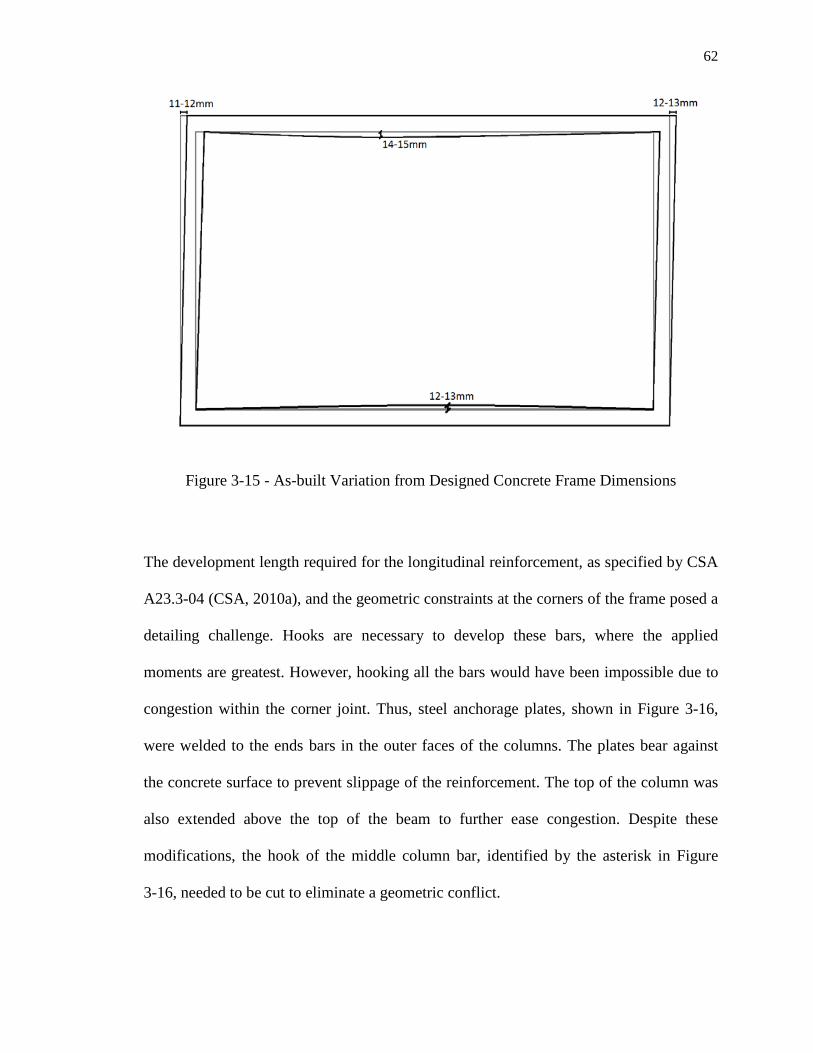
62
Figure 3-15 - As-built Variation from Designed Concrete Frame Dimensions
The development length required for the longitudinal reinforcement, as specified by CSA
A23.3-04 (CSA, 2010a), and the geometric constraints at the corners of the frame posed a
detailing challenge. Hooks are necessary to develop these bars, where the applied
moments are greatest. However, hooking all the bars would have been impossible due to
congestion within the corner joint. Thus, steel anchorage plates, shown in Figure 3-16,
were welded to the ends bars in the outer faces of the columns. The plates bear against
the concrete surface to prevent slippage of the reinforcement. The top of the column was
also extended above the top of the beam to further ease congestion. Despite these
modifications, the hook of the middle column bar, identified by the asterisk in Figure
3-16, needed to be cut to eliminate a geometric conflict.
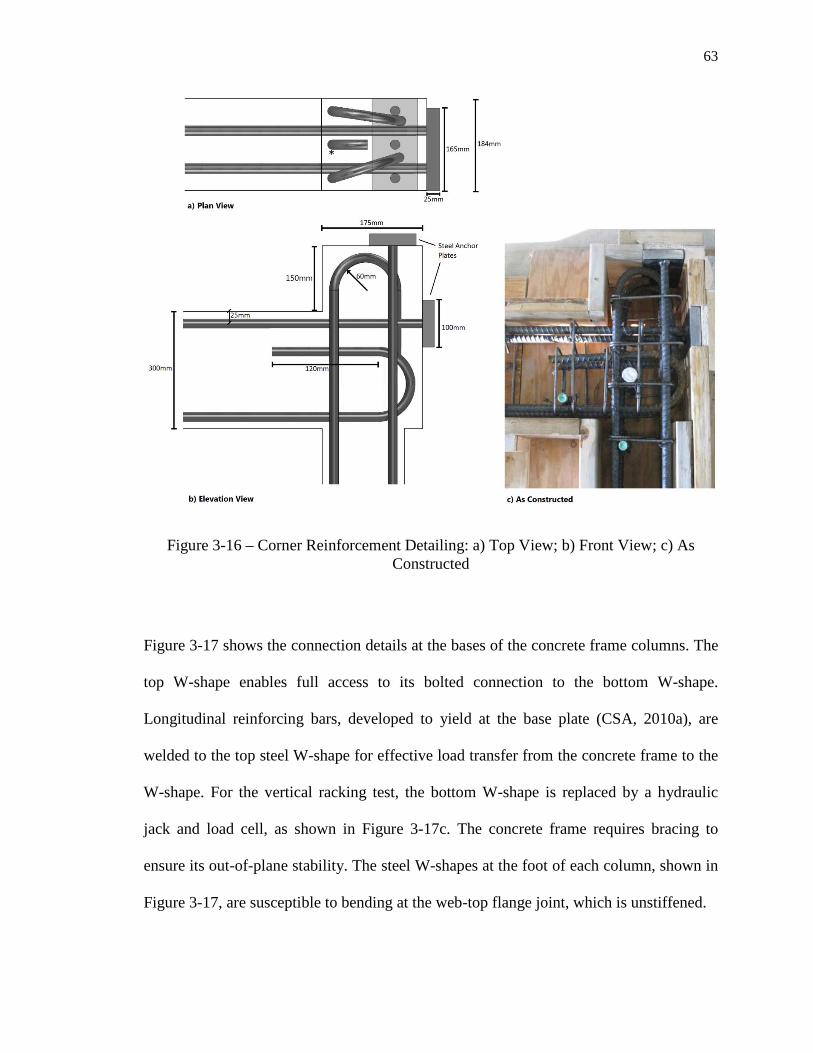
63
Figure 3-16 – Corner Reinforcement Detailing: a) Top View; b) Front View; c) As Constructed
Figure 3-17 shows the connection details at the bases of the concrete frame columns. The
top W-shape enables full access to its bolted connection to the bottom W-shape.
Longitudinal reinforcing bars, developed to yield at the base plate (CSA, 2010a), are
welded to the top steel W-shape for effective load transfer from the concrete frame to the
W-shape. For the vertical racking test, the bottom W-shape is replaced by a hydraulic
jack and load cell, as shown in Figure 3-17c. The concrete frame requires bracing to
ensure its out-of-plane stability. The steel W-shapes at the foot of each column, shown in
Figure 3-17, are susceptible to bending at the web-top flange joint, which is unstiffened.
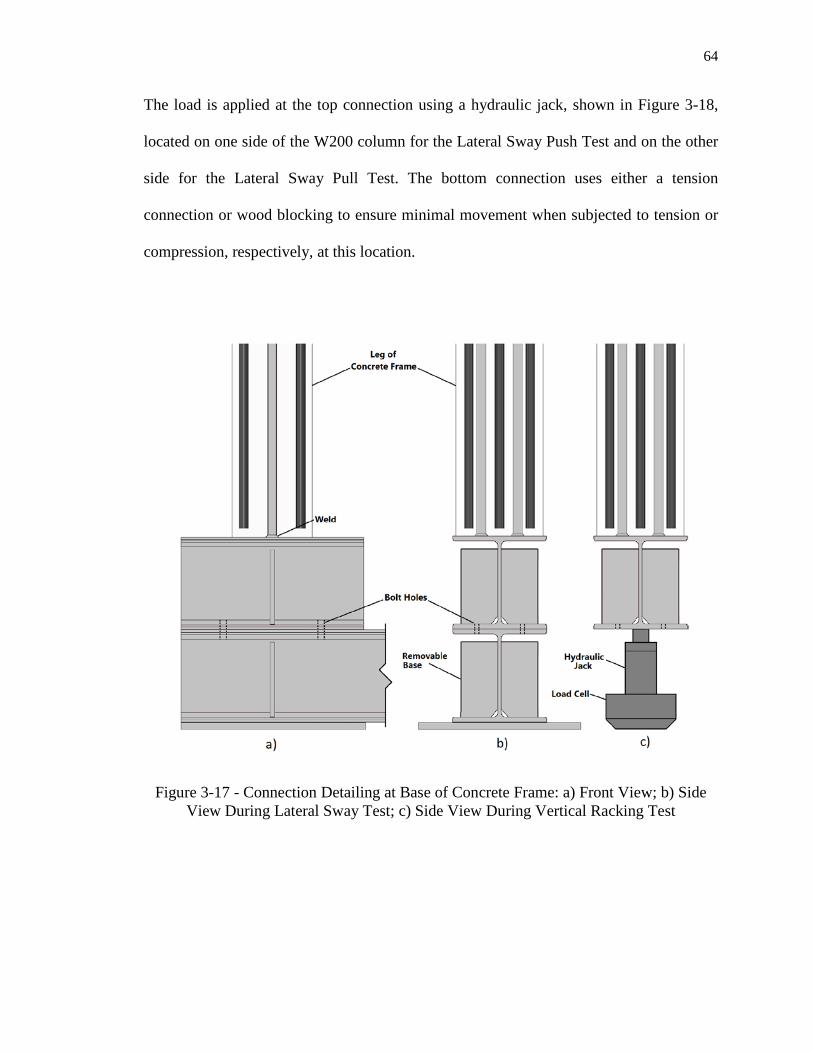
64
The load is applied at the top connection using a hydraulic jack, shown in Figure 3-18,
located on one side of the W200 column for the Lateral Sway Push Test and on the other
side for the Lateral Sway Pull Test. The bottom connection uses either a tension
connection or wood blocking to ensure minimal movement when subjected to tension or
compression, respectively, at this location.
Figure 3-17 - Connection Detailing at Base of Concrete Frame: a) Front View; b) Side View During Lateral Sway Test; c) Side View During Vertical Racking Test
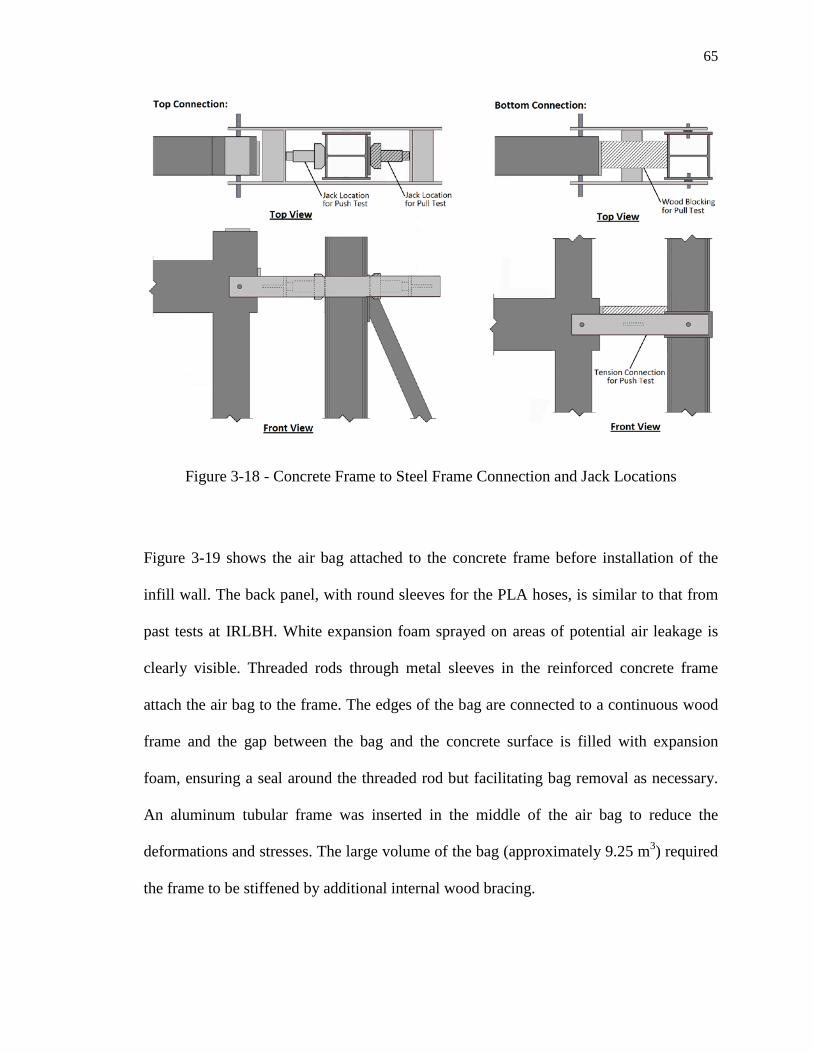
65
Figure 3-18 - Concrete Frame to Steel Frame Connection and Jack Locations
Figure 3-19 shows the air bag attached to the concrete frame before installation of the
infill wall. The back panel, with round sleeves for the PLA hoses, is similar to that from
past tests at IRLBH. White expansion foam sprayed on areas of potential air leakage is
clearly visible. Threaded rods through metal sleeves in the reinforced concrete frame
attach the air bag to the frame. The edges of the bag are connected to a continuous wood
frame and the gap between the bag and the concrete surface is filled with expansion
foam, ensuring a seal around the threaded rod but facilitating bag removal as necessary.
An aluminum tubular frame was inserted in the middle of the air bag to reduce the
deformations and stresses. The large volume of the bag (approximately 9.25 m3) required
the frame to be stiffened by additional internal wood bracing.
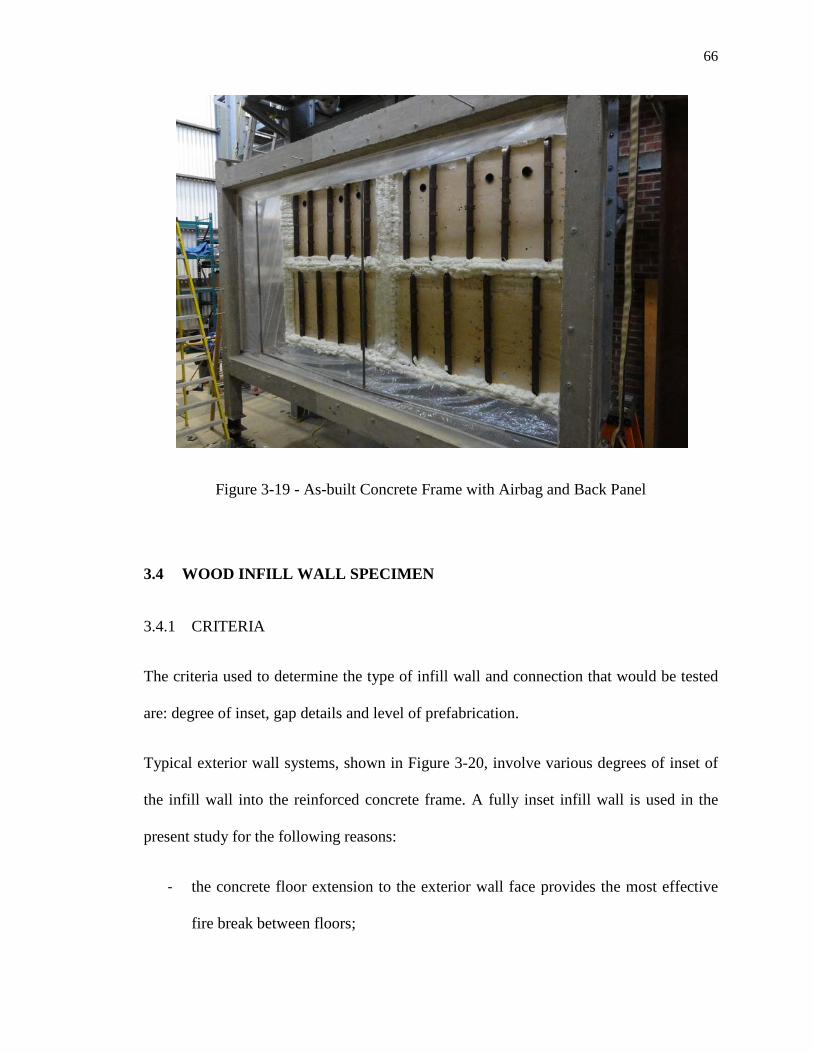
66
Figure 3-19 - As-built Concrete Frame with Airbag and Back Panel
3.4 WOOD INFILL WALL SPECIMEN
3.4.1 CRITERIA
The criteria used to determine the type of infill wall and connection that would be tested
are: degree of inset, gap details and level of prefabrication.
Typical exterior wall systems, shown in Figure 3-20, involve various degrees of inset of
the infill wall into the reinforced concrete frame. A fully inset infill wall is used in the
present study for the following reasons:
- the concrete floor extension to the exterior wall face provides the most effective
fire break between floors;
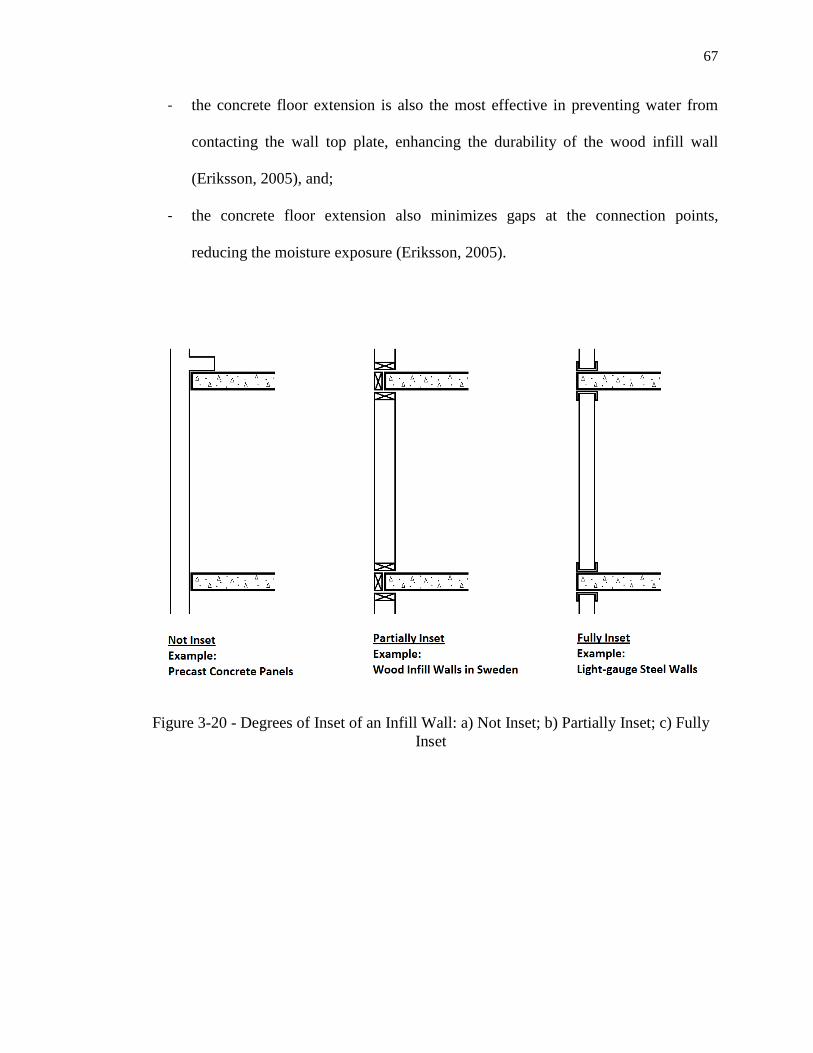
67
- the concrete floor extension is also the most effective in preventing water from
contacting the wall top plate, enhancing the durability of the wood infill wall
(Eriksson, 2005), and;
- the concrete floor extension also minimizes gaps at the connection points,
reducing the moisture exposure (Eriksson, 2005).
Figure 3-20 - Degrees of Inset of an Infill Wall: a) Not Inset; b) Partially Inset; c) Fully Inset
68
In general, exterior infill walls can be:
- fully assembled in-place;
- partially pre-fabricated with no exterior or interior sheathing, as ‘open panels’;
- partially pre-fabricated with only exterior sheathing, as ‘closed panels’, or;
- fully pre-fabricated, with both exterior and interior sheathing.
A fully pre-fabricated wall was selected for the present study because it is likely to
exhibit the highest quality of construction. The fully enclosed wall panel is constructed in
a controlled factory setting either on- or off-site (Eriksson, 2005). Typically all
components of the wall panel are installed beforehand, including electrical conduits,
windows and balcony doors. This option promises reliable quality control during wall
pre-fabrication while minimizing on-site installation time, especially if the installation
can be done from the interior of the building. However, maintaining low moisture levels
in the wall during transportation and accommodating on-site concrete construction
tolerances need to be considered.
A gap around the perimeter of the wall is required to account for movement of the
reinforced concrete frame, as previously described in Table 3-1, to ensure that the infill
wall remains non-loadbearing. The standard practice for existing wood infill walls is to
allow a gap of 16 to 19mm (5/8" to 3/4") (Eriksson, 2005), although on-site geometric
tolerances may be substantially less or substantially greater than these values. Other types
of exterior cladding and wall systems, such as light-gauge steel framing and precast
concrete panels, require a tolerance of +/- 1.5 in. (+/- 38.1mm) (e.g. CSSBI, 1991).
Fortunately, significant expansion and contraction of wood only occurs normal to the
69
grain, with only minor dimensional changes parallel to the grain (Keenan, 1986).
Therefore only the top and bottom plates of the infill walls contribute to gap change due
to moisture changes, which are therefore small.
3.4.2 CONNECTION DESIGN CONCEPT
Different types of connections at various locations can accommodate the in-plane
deflections of the frame surrounding the infill wall. The three cases shown in Figure 3-21
were investigated to find an appropriate type and location of connections for ULS
horizontal deflection summarized in Table 3-1. All connections have adequate out-of-
plane capacities (i.e., in the Y-direction) but allow rotation of the wall edges due to out-
of-plane loading. Layout A requires the top connections to accommodate the positive and
negative lateral (X-direction) displacements of the concrete frame but evenly distributes
the out-of-plane loading between the four connections. Layout B requires the connections
to accommodate less overall movement in the X-direction but increases the out-of-plane
reaction at the top and bottom connections. Layout C, adopted in the present study,
allows unrestricted movement of the top of the infill wall in the X-direction and evenly
distributes the out-of-plane load to the top and bottom connections. This layout only
requires the connections to restrict movement in the X-direction at the bottom of the wall
while ensuring full out-of-plane support from the top and the bottom.
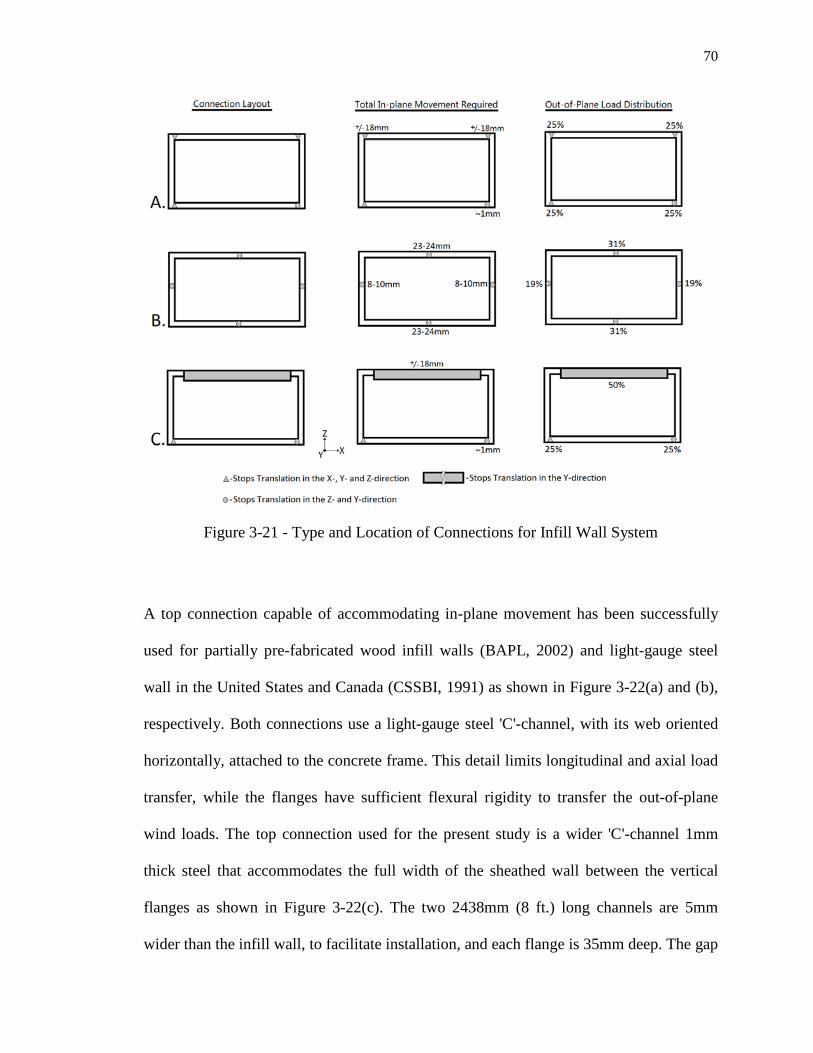
70
Figure 3-21 - Type and Location of Connections for Infill Wall System
A top connection capable of accommodating in-plane movement has been successfully
used for partially pre-fabricated wood infill walls (BAPL, 2002) and light-gauge steel
wall in the United States and Canada (CSSBI, 1991) as shown in Figure 3-22(a) and (b),
respectively. Both connections use a light-gauge steel 'C'-channel, with its web oriented
horizontally, attached to the concrete frame. This detail limits longitudinal and axial load
transfer, while the flanges have sufficient flexural rigidity to transfer the out-of-plane
wind loads. The top connection used for the present study is a wider 'C'-channel 1mm
thick steel that accommodates the full width of the sheathed wall between the vertical
flanges as shown in Figure 3-22(c). The two 2438mm (8 ft.) long channels are 5mm
wider than the infill wall, to facilitate installation, and each flange is 35mm deep. The gap
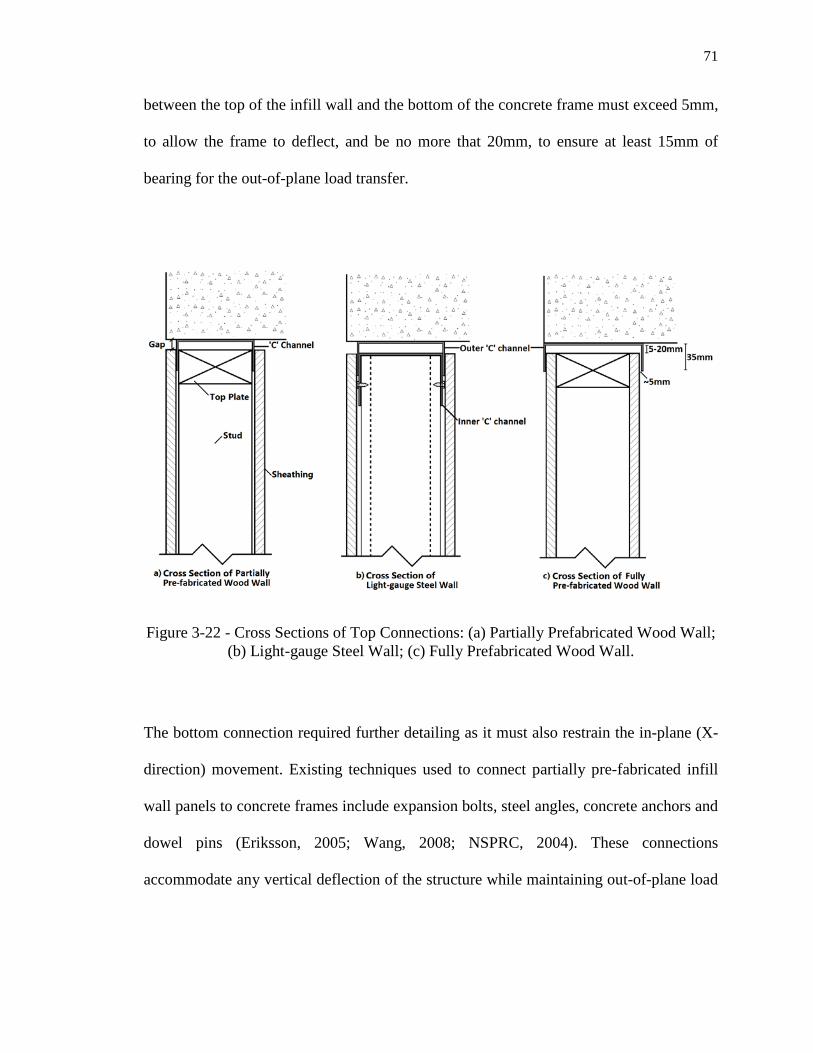
71
between the top of the infill wall and the bottom of the concrete frame must exceed 5mm,
to allow the frame to deflect, and be no more that 20mm, to ensure at least 15mm of
bearing for the out-of-plane load transfer.
Figure 3-22 - Cross Sections of Top Connections: (a) Partially Prefabricated Wood Wall; (b) Light-gauge Steel Wall; (c) Fully Prefabricated Wood Wall.
The bottom connection required further detailing as it must also restrain the in-plane (X-
direction) movement. Existing techniques used to connect partially pre-fabricated infill
wall panels to concrete frames include expansion bolts, steel angles, concrete anchors and
dowel pins (Eriksson, 2005; Wang, 2008; NSPRC, 2004). These connections
accommodate any vertical deflection of the structure while maintaining out-of-plane load
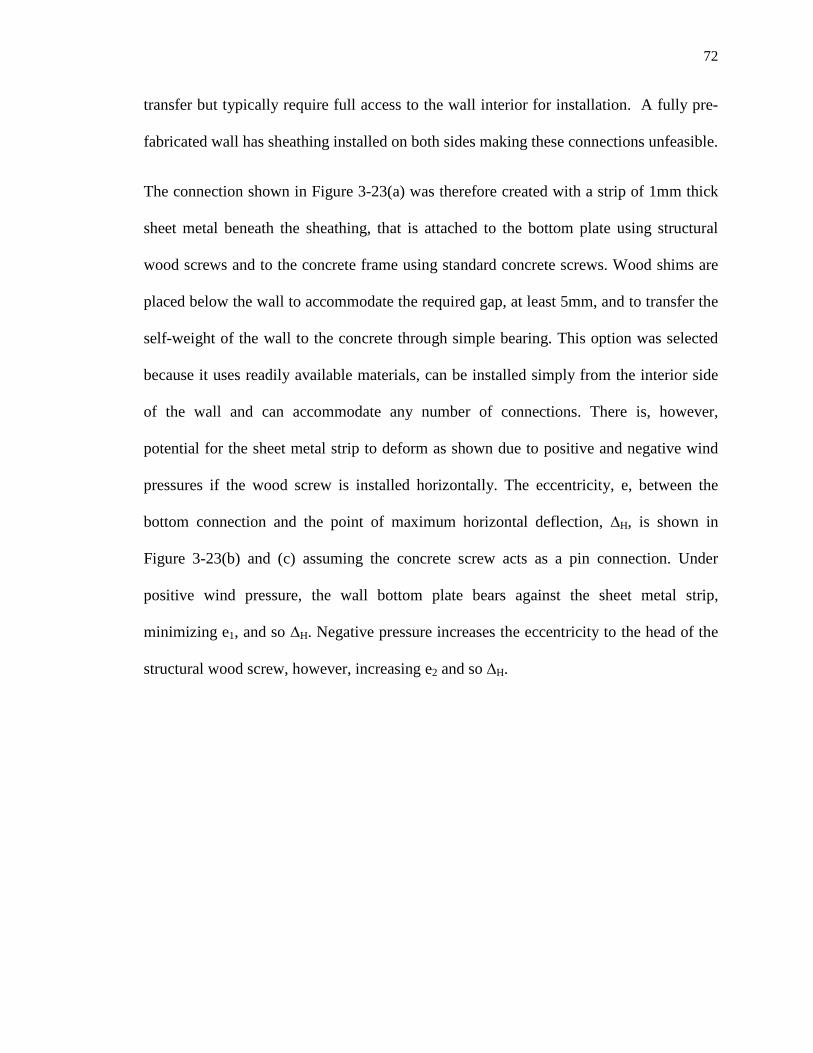
72
transfer but typically require full access to the wall interior for installation. A fully pre-
fabricated wall has sheathing installed on both sides making these connections unfeasible.
The connection shown in Figure 3-23(a) was therefore created with a strip of 1mm thick
sheet metal beneath the sheathing, that is attached to the bottom plate using structural
wood screws and to the concrete frame using standard concrete screws. Wood shims are
placed below the wall to accommodate the required gap, at least 5mm, and to transfer the
self-weight of the wall to the concrete through simple bearing. This option was selected
because it uses readily available materials, can be installed simply from the interior side
of the wall and can accommodate any number of connections. There is, however,
potential for the sheet metal strip to deform as shown due to positive and negative wind
pressures if the wood screw is installed horizontally. The eccentricity, e, between the
bottom connection and the point of maximum horizontal deflection, ∆H, is shown in
Figure 3-23(b) and (c) assuming the concrete screw acts as a pin connection. Under
positive wind pressure, the wall bottom plate bears against the sheet metal strip,
minimizing e1, and so ∆H. Negative pressure increases the eccentricity to the head of the
structural wood screw, however, increasing e2 and so ∆H.
73
Figure 3-23 - Initial Bottom Connection Design: (a) Cross Section; (b) Deformed Shape for Positive Wind Pressure; (c) Deformed for Negative Wind Pressure.
Hence, an additional piece of light-gauge steel, shown in Figure 3-24, was added to the
wood shim to reduce ∆H. The light-gauge steel 'lip' fits under the light-gauge steel strip
and the concrete screw attaches both to the concrete. The structural wood screw is rotated
45 degrees to attach the wood shim to the bottom plate. Under positive wind pressure, the
structural wood screw is placed in tension, causing the wood shim to compress against
the concrete screw and limit lateral deflection. Under negative pressure, the horizontal
component of the compressive forces through the structural wood screw and bottom plate
causes horizontal tension in the shim that is then transferred to the concrete by the
concrete screw.
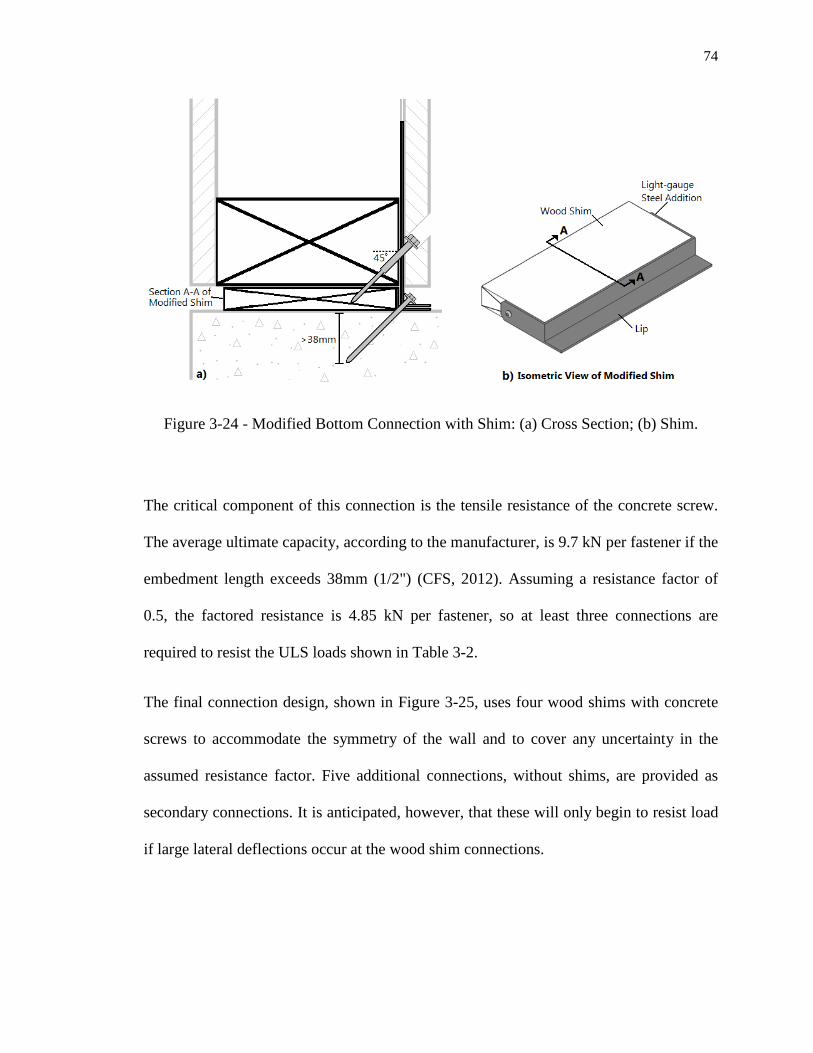
74
Figure 3-24 - Modified Bottom Connection with Shim: (a) Cross Section; (b) Shim.
The critical component of this connection is the tensile resistance of the concrete screw.
The average ultimate capacity, according to the manufacturer, is 9.7 kN per fastener if the
embedment length exceeds 38mm (1/2") (CFS, 2012). Assuming a resistance factor of
0.5, the factored resistance is 4.85 kN per fastener, so at least three connections are
required to resist the ULS loads shown in Table 3-2.
The final connection design, shown in Figure 3-25, uses four wood shims with concrete
screws to accommodate the symmetry of the wall and to cover any uncertainty in the
assumed resistance factor. Five additional connections, without shims, are provided as
secondary connections. It is anticipated, however, that these will only begin to resist load
if large lateral deflections occur at the wood shim connections.
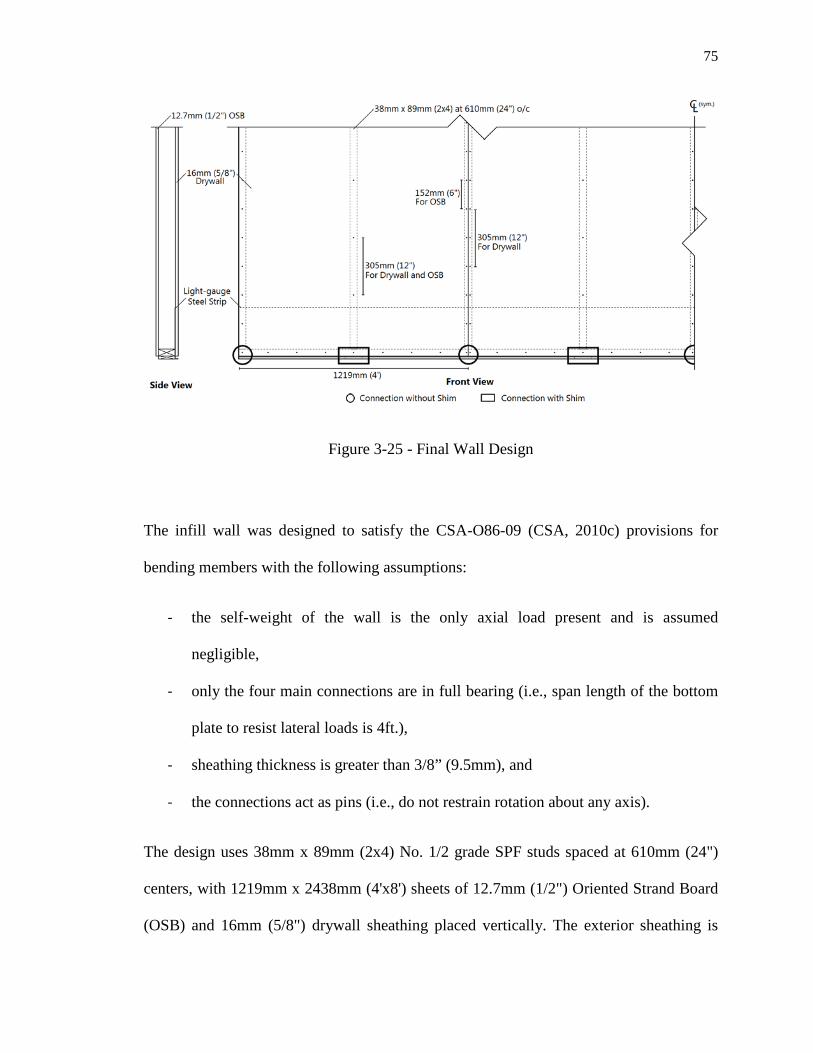
75
Figure 3-25 - Final Wall Design
The infill wall was designed to satisfy the CSA-O86-09 (CSA, 2010c) provisions for
bending members with the following assumptions:
- the self-weight of the wall is the only axial load present and is assumed
negligible,
- only the four main connections are in full bearing (i.e., span length of the bottom
plate to resist lateral loads is 4ft.),
- sheathing thickness is greater than 3/8” (9.5mm), and
- the connections act as pins (i.e., do not restrain rotation about any axis).
The design uses 38mm x 89mm (2x4) No. 1/2 grade SPF studs spaced at 610mm (24")
centers, with 1219mm x 2438mm (4'x8') sheets of 12.7mm (1/2") Oriented Strand Board
(OSB) and 16mm (5/8") drywall sheathing placed vertically. The exterior sheathing is
76
connected to the studs by 6d nails spaced at 152mm (6") around the edge of the panel and
305mm (12") in the centre. The interior sheathing uses standard drywall screws spaced at
305mm (12").
3.4.3 CONSTRUCTION
The infill wall was constructed horizontally on the floor of the IRLBH. The studs were
nailed to the top and bottom plates before attaching the drywall sheathing and then the
OSB sheathing. A lifting harness was constructed and attached 1219mm (4') from each
end of the wall using 15.9mm (5/8") lag screws. Full rotation of the wall was allowed
during lifting, leaving it in an almost vertical position once off the ground. This slightly
off-center position reduced the total height of the wall enabling it to fit between the
bottom concrete beam and the flanges of the previously attached 'C'-channel. Further
details of the lifting method are included in Appendix H. Once lifted into position
beneath the 'C'-channel, the bottom of the infill wall was then pulled in towards the
concrete frame to sit flat on the bottom beam. This allowed the top of the wall to pivot
around the exterior flange of the 'C'-channel, rotating the top plate and sheathing between
the two flanges. The entire wall was then lifted vertically to allow installation of the
wood shims and placed in its final position, as shown in Figure 3-26. The top horizontal
gap between the concrete beam and the infill wall is within the previously listed range of
5mm to 20mm, while the bottom horizontal gap meets the requirements of being greater
than 5mm. The vertical gaps also meets the suggested range of 16mm to 38mm (5/8" to 1
1/2").
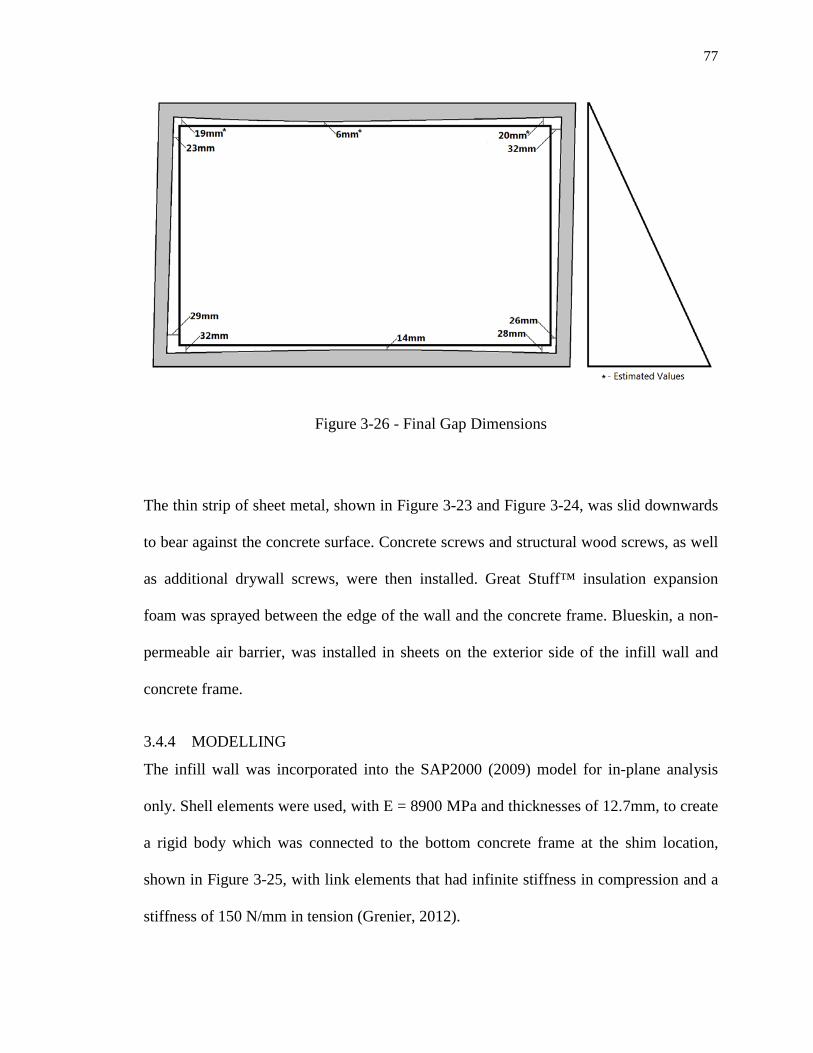
77
Figure 3-26 - Final Gap Dimensions
The thin strip of sheet metal, shown in Figure 3-23 and Figure 3-24, was slid downwards
to bear against the concrete surface. Concrete screws and structural wood screws, as well
as additional drywall screws, were then installed. Great Stuff™ insulation expansion
foam was sprayed between the edge of the wall and the concrete frame. Blueskin, a non-
permeable air barrier, was installed in sheets on the exterior side of the infill wall and
concrete frame.
3.4.4 MODELLING
The infill wall was incorporated into the SAP2000 (2009) model for in-plane analysis
only. Shell elements were used, with E = 8900 MPa and thicknesses of 12.7mm, to create
a rigid body which was connected to the bottom concrete frame at the shim location,
shown in Figure 3-25, with link elements that had infinite stiffness in compression and a
stiffness of 150 N/mm in tension (Grenier, 2012).
78
3.5 SUMMARY AND CONCLUSIONS
This chapter described the design and construction of a full scale test apparatus and wall
specimen used to investigate the chosen wood/concrete hybrid niche: "non-load-bearing
light-frame wood infill walls in reinforced concrete frame structures".
A prototype structure taken from the 1984 Concrete Design Handbook was used to
determine the critical in-plane boundary conditions placed on the infill wall by the
deformed shape of the reinforced concrete frame structure. Two principal in-plane
deformations were determined to have the potential to cause damage: lateral sway due to
wind loads and vertical racking due to differential column shortening caused by the
creep of the concrete. Critical ranges were established for each case at SLS and ULS and
used to design the reinforced concrete frame test apparatus. A pressurized air bag system
was also incorporated into the test apparatus apply realistic out-of-plane wind loading to
the infill wall specimen.
The 8'x16' light-frame wood specimen was designed as a fully prefabricated wall and
was inset into the concrete frame structure. A gap between the infill wall and the
reinforced concrete frame structure of approximately 5-20mm was chosen to
accommodate the in-plane deformations determined by the prototype structure and
general concrete construction tolerances. The top connection of the infill wall uses a
light-gauge steel 'C'-channel, similar to a light-gauge steel infill wall, which allows for
unrestrained in-plane movement, while restraining out-of-plane movement. A novel
bottom connection, using a light-gauge steel sheet and wood shims, was designed for use
in a full sheathed pre-fabricated walls system.
79
The main conclusions that are determined from this chapter are:
1. The lateral sway deformation in a reinforced concrete frame structure due to wind
loading is greatest at the second storey of an exterior frame, assuming the first
storey is designed for a different purpose that would likely avoid the use of a
wood infill wall (i.e., commercial use). The critical differential deflection range of
the frame loaded at SLS is 6-7mm and at ULS, where wind is the principal load,
is 16-18mm.
2. The vertical racking deformation in a reinforced concrete frame structure due to
the differential shortening of columns is greatest at the top storey of an exterior
frame. The critical differential range of the frame at SLS is 7-8mm and at ULS,
where a factor of 1.4 is applied to the DL, is 10-12mm.
3. The predicted deflections of the test apparatus were within 3.3mm of the
prototype deflections for the lateral sway test and 1.9mm for the vertical racking
test. The test apparatus was therefore deemed to simulate accurately the critical
deformations seen in the prototype structure.
4. The design of the test apparatus and wall specimen meet all of the listed
objectives and constraints, including the gap limits.
80
4
4.1 OVERVIEW
EXPERIMENTAL PROGRAM AND RESULTS
The objectives of the research reported in this chapter are to:
- assess the performance of the test apparatus by comparing the observed in-plane
and out-of-plane deflections, and associated applied loads, to those predicted
using SAP2000;
- assess the performance of the wood infill wall by comparing the observed in-
plane and out-of-plane deflections to those predicted using conventional
calculations including code provisions;
- assess the performance of the top and bottom connections subjected to out-of-
plane pressure at SLS, and the effect of in-plane racking on their performance;
- investigate the change in gap, accounting for any resistance of the non-structural
insulation foam; and
- Formulate recommendations about testing methods and procedures.
Five sets of tests at SLS and two at ULS, shown in Table 4-1, were conducted as part of
the present study. The test conducted by Jared Harnish will be reported in detail in a
forthcoming CEE Undergraduate thesis, but data concerning the performance of the test
apparatus are presented and discussed in the present study. The out-of-plane tests were
used as control tests to investigate any behavioral changes of the wall or connections due
to damage sustained during in-plane vertical and horizontal racking tests. The target
values for each test were previously listed in Table 3-1 and a list of all the tests attempted
is included in Appendix J.
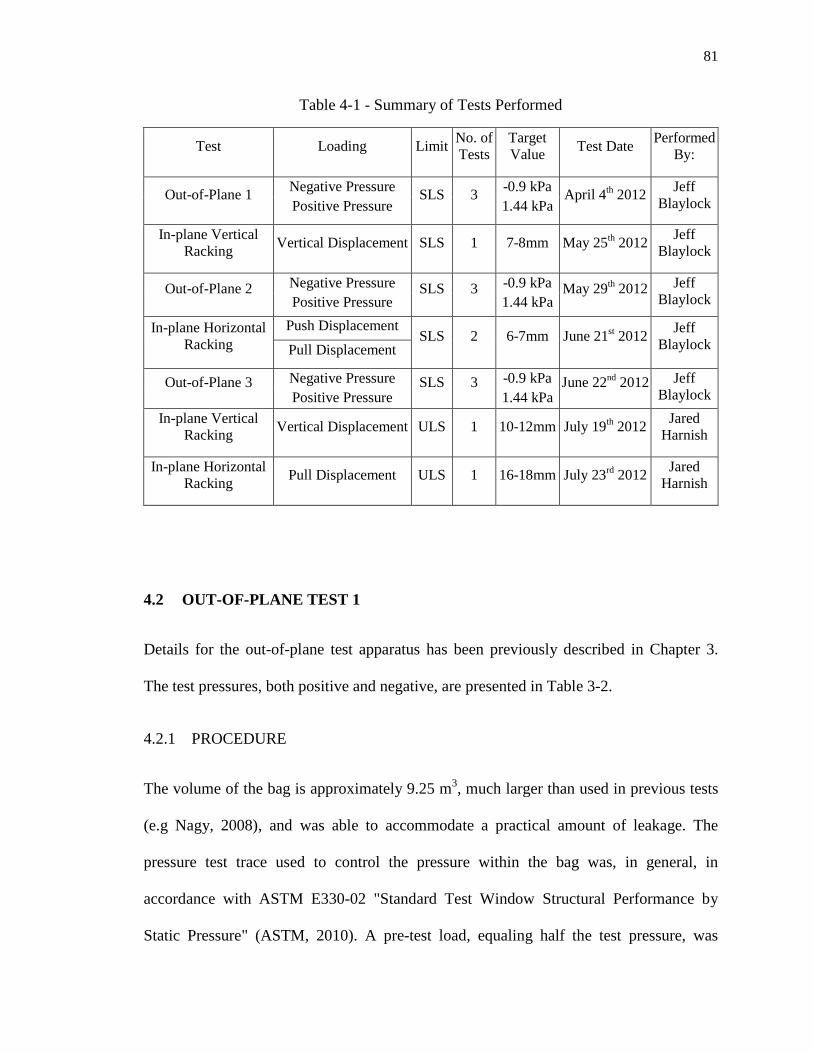
81
Table 4-1 - Summary of Tests Performed
Test Loading Limit No. of Tests
Target Value Test Date Performed
By:
Out-of-Plane 1 Negative Pressure SLS 3 -0.9 kPa April 4th 2012 Jeff Blaylock Positive Pressure 1.44 kPa
In-plane Vertical Racking Vertical Displacement SLS 1 7-8mm May 25th 2012 Jeff
Blaylock
Out-of-Plane 2 Negative Pressure SLS 3 -0.9 kPa May 29th 2012 Jeff Blaylock Positive Pressure 1.44 kPa
In-plane Horizontal Racking
Push Displacement
SLS 2 6-7mm June 21st 2012 Jeff
Blaylock Pull Displacement
Out-of-Plane 3 Negative Pressure SLS 3 -0.9 kPa June 22nd 2012 Jeff Blaylock Positive Pressure 1.44 kPa
In-plane Vertical Racking Vertical Displacement ULS 1 10-12mm July 19th 2012 Jared
Harnish
In-plane Horizontal Racking Pull Displacement ULS 1 16-18mm July 23rd 2012 Jared
Harnish
4.2 OUT-OF-PLANE TEST 1
Details for the out-of-plane test apparatus has been previously described in Chapter 3.
The test pressures, both positive and negative, are presented in Table 3-2.
4.2.1 PROCEDURE
The volume of the bag is approximately 9.25 m3, much larger than used in previous tests
(e.g Nagy, 2008), and was able to accommodate a practical amount of leakage. The
pressure test trace used to control the pressure within the bag was, in general, in
accordance with ASTM E330-02 "Standard Test Window Structural Performance by
Static Pressure" (ASTM, 2010). A pre-test load, equaling half the test pressure, was
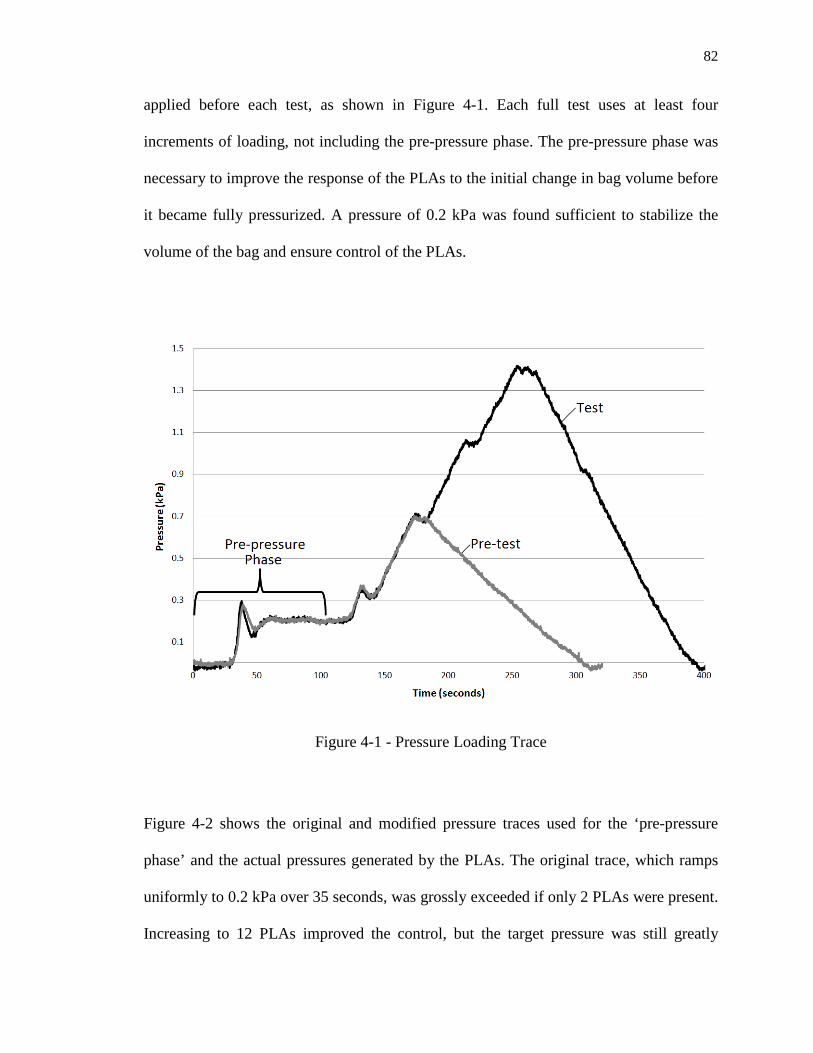
82
applied before each test, as shown in Figure 4-1. Each full test uses at least four
increments of loading, not including the pre-pressure phase. The pre-pressure phase was
necessary to improve the response of the PLAs to the initial change in bag volume before
it became fully pressurized. A pressure of 0.2 kPa was found sufficient to stabilize the
volume of the bag and ensure control of the PLAs.
Figure 4-1 - Pressure Loading Trace
Figure 4-2 shows the original and modified pressure traces used for the ‘pre-pressure
phase’ and the actual pressures generated by the PLAs. The original trace, which ramps
uniformly to 0.2 kPa over 35 seconds, was grossly exceeded if only 2 PLAs were present.
Increasing to 12 PLAs improved the control, but the target pressure was still greatly

83
exceeded at elapsed time of 25-40 and 60-100 seconds. Using a modified trace, ramping
to 0.2 kPa in two steps starting 30 seconds after the PLAs were turned on, the 12 PLAs
were able to generate accurately the target pressure after the initial 60 seconds.
Figure 4-2 - Details of Pre-pressure Phase
4.2.2 INSTRUMENTATION
Linear Variable Displacement Transducer (LVDT's) were used to determine the
deflections of the concrete frame, the steel reaction frame, and the infill wall. The
deflection of half of the wall was measured, at the locations shown in Figure 4-3, as the
wall was assumed to be symmetric about the center (Line 5). Both ends of the wall were

84
measured to check this assumption. The out-of-plane wall deflections near the top
connection were recorded at the edges, T1 and T1', and at stud locations T3 and T5. Out-
of-plane wall deflections near the bottom connections were measured at the edges, B1
and B1'; at two stud locations with shims, B2 and B4; and at two stud locations without
shims, B3 and B5. Out-of-plane wall deflections at mid-height were measured at five
consecutive stud locations over half of the wall, M1 to M5, as well as at the quarter
points, QT5 and QB5, along the center. The out-of-plane displacements at each support,
CT1, CT5, CT1', CB1, CB5 and CB1', and between supports, CT3, CB3, CM1 and CM1',
were also measured to quantify the displacements of the concrete frame.
Figure 4-3 - Out-of-Plane LVDT Locations

85
4.2.3 PERFORMANCE OF SPECIMEN
Table 4-2 shows the out-of-plane displacements at the top and bottom of the infill wall,
near the connections, with respect to the concrete frame at the locations shown in Figure
4-3. The exact displacement of the bottom and top connection cannot be properly
determined because the LVDT's were placed approximately 70mm (2 ¾") from the
surface of the concrete beam, as shown in Figure 4-4, and so captured deflections due to
the end rotations of the wall. Further details can be determined for the data from the
center line of the test apparatus, Line 5, since additional information is collected at points
QT5 and QB5. These quarter point results, as well as a methodology for determining the
displacements at the connections more accurately, are presented in Appendix K.

86
Table 4-2 - Out-of-plane Horizontal Deflections near the Top and Bottom Connections
Location on Wall Test 1.1 Pressures Deflection at Location (mm) 1 2 3 4 5 1'
Near Top Connection (T) Negative (-0.9 kPa) -0.2 - -0.6 - -0.9 -0.2 Positive (1.44 kPa) 0.3 - 1.2 - 1.6 0.3
Near Bottom Connection (B) Negative (-0.9 kPa) -0.3 -0.8* -0.9 -0.9* -0.7 -0.2 Positive (1.44 kPa) 0.4 2.4* 1.8 2.5* 1.8 0.3
* - Near Shim Location
Figure 4-4 - LVDT Location and Points of Rotation at Bottom Connection
(For further details see Figure 3-23)

87
Table 4-2 shows that the displacements near the top of the wall at the center of the wall,
Location 5, are consistently larger than those at Location 3, even though the wall at both
locations has the same tributary area. This may be because the two 2438mm (96 in.) long
halves of the 'C'-channel meet at Location 5 causing a minor reduction in stiffness at this
location. The average stiffness of the top connection in the negative and positive
directions are similar (i.e, -0.9/-0.75 = 1.2 kPa/mm and 1.44/1.4 = 1.03 kPa/mm). This
similarity is expected due to the symmetry of the connection about a vertical axis through
the middle of the 'C'-channel web. Overall, the top connection had an out-of-plane
deflection of less than 1.6m and 0.9mm under positive and negative pressures,
respectively.
The positive and negative displacements of the infill wall at the corners (i.e, T1, T1', B1
and B1') are approximately equal to each other, but are much smaller than expected.
Similarly, the displacement of the wall near the bottom shim connections (i.e, Locations 2
and 4) are approximately the same, as expected. The average stiffness in the negative and
positive directions, however, are not similar (i.e, -0.9/-0.85 = 1.06 kPa/mm and 1.44/2.45
= 0.59 kPa/mm respectively). This extra flexibility in the positive direction may be due to
the rotation of the wall which, as shown in Figure 4-4, will likely occur around Point A
under positive pressure and Point B under negative pressure. The rotation around Point
A, or more specifically the concrete screw, will not be restricted. The rotation around
Point B will, however, be resisted by tension in the light-gauge steel strip, potentially
reducing the displacement under negative pressure. Overall, the bottom connection had
an out-of-plane deflection of less than 2.5mm and 0.9mm under positive and negative
pressures, respectively.
88
The displacement of the wall near the shim connections, Locations 2 and 4, could not be
predicted. The displacement at the bottom of the wall with respect to the shims (i.e., B1',
B3, and B5), however, has been predicted and is compared to the observed results in
Table 4-3. Almost all of the observed deflections are in the opposite direction to the
predicted results, as clearly shown in Figure 4-5. This is especially evident at the corner
of the wall (i.e., B1-B2) under positive pressure where a deflection of 3.5mm greater than
the shim displacement at Line 2 was predicted. The observed displacement, however, is
2mm less than the displacement at the shim. It is likely that the observed lack of
movement of the bottom of the wall is due to the shear stiffness of the insulation foam
filling the horizontal and vertical gaps.
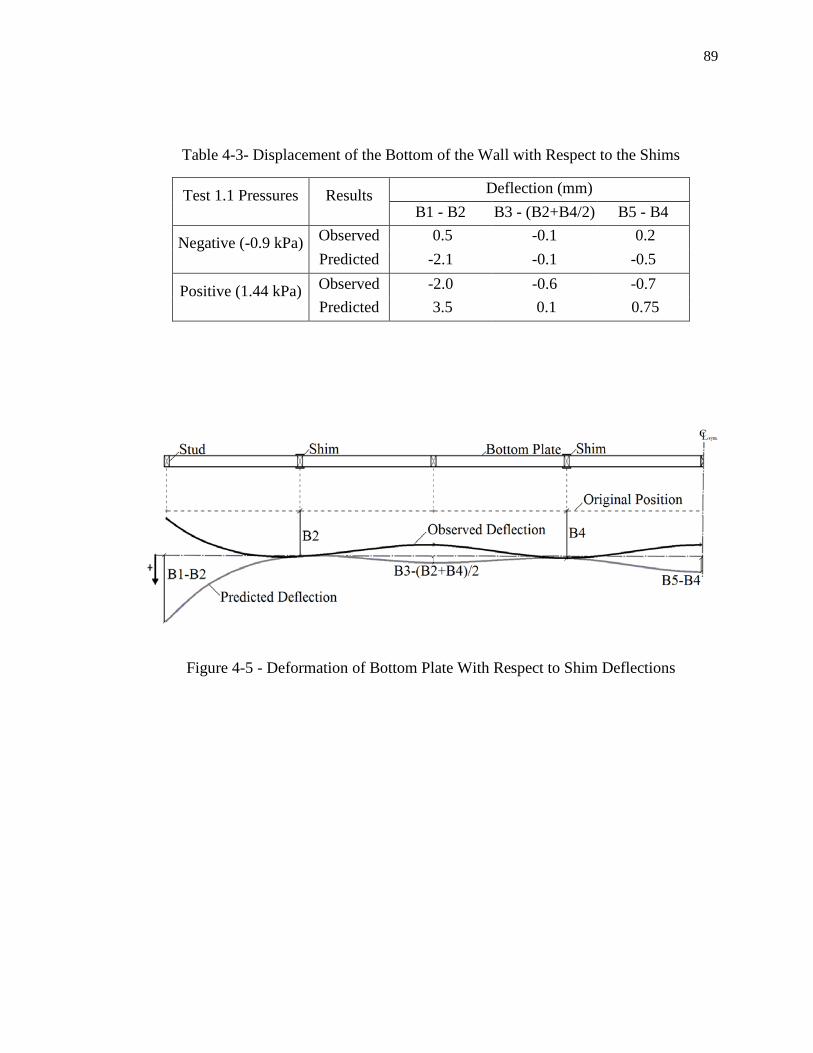
89
Table 4-3- Displacement of the Bottom of the Wall with Respect to the Shims
Test 1.1 Pressures Results Deflection (mm) B1 - B2 B3 - (B2+B4/2) B5 - B4
Negative (-0.9 kPa) Observed 0.5
-0.1 0.2 Predicted -2.1 -0.1 -0.5
Positive (1.44 kPa) Observed -2.0 -0.6 -0.7 Predicted 3.5 0.1 0.75
Figure 4-5 - Deformation of Bottom Plate With Respect to Shim Deflections
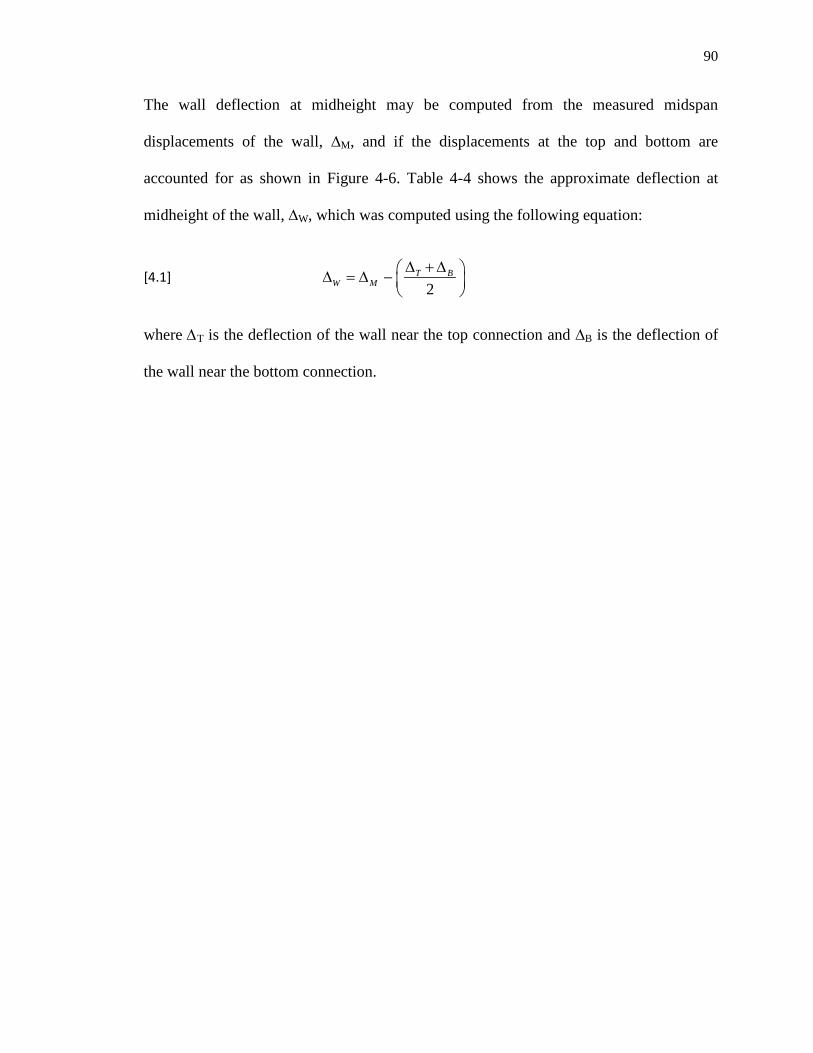
90
The wall deflection at midheight may be computed from the measured midspan
displacements of the wall, ∆M, and if the displacements at the top and bottom are
accounted for as shown in Figure 4-6. Table 4-4 shows the approximate deflection at
midheight of the wall, ∆W, which was computed using the following equation:
[4.1] 2
T BW M
∆ + ∆ ∆ = ∆ −
where ∆T is the deflection of the wall near the top connection and ∆B is the deflection of
the wall near the bottom connection.
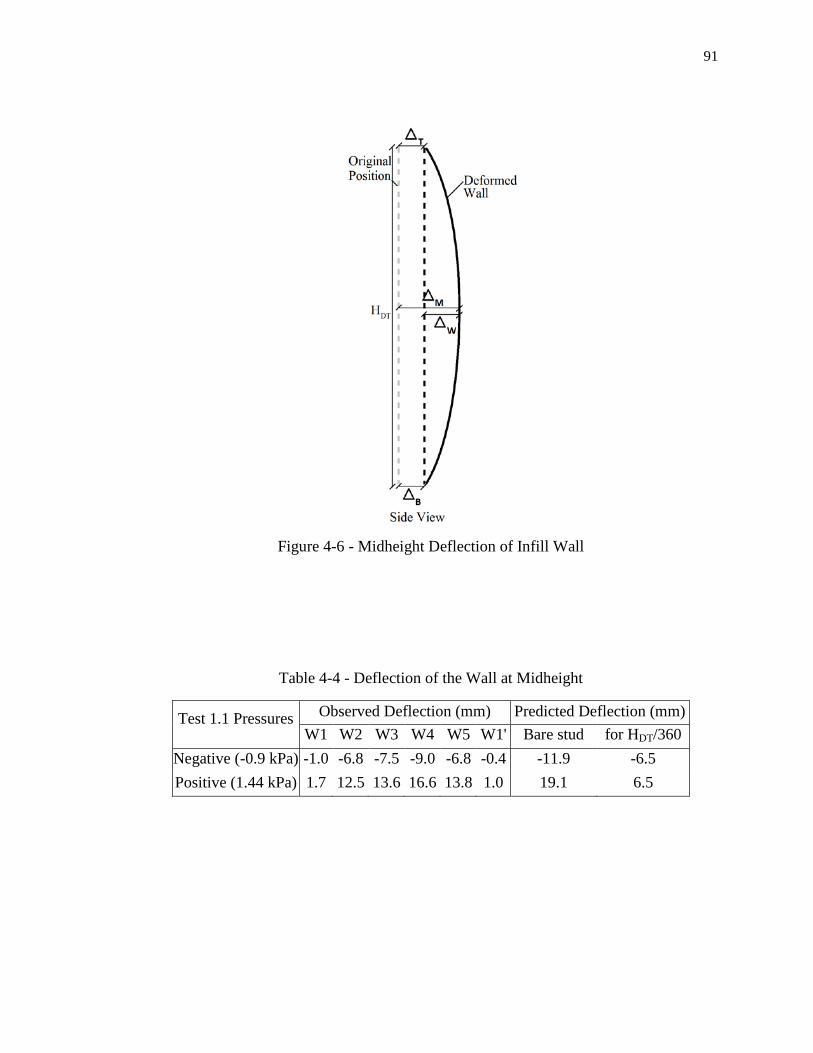
91
Figure 4-6 - Midheight Deflection of Infill Wall
Table 4-4 - Deflection of the Wall at Midheight
Test 1.1 Pressures Observed Deflection (mm) Predicted Deflection (mm) W1 W2 W3 W4 W5 W1' Bare stud for HDT/360
Negative (-0.9 kPa) -1.0 -6.8 -7.5 -9.0 -6.8 -0.4 -11.9 -6.5 Positive (1.44 kPa) 1.7 12.5 13.6 16.6 13.8 1.0 19.1 6.5
92
The wall locations W2, W3, W4 and W5 have the same tributary area and should
therefore have the same deflection. This is observed at W2 and W3. However at W4 and,
to a lesser extent, W5, larger deflections were observed, possibly because the studs at
these locations have a lower Young's Modulus. The observed deflections are less than
those predicted for the bare stud, using the 5% (50%) fractile Young's Modulus values
specified in CSA-086-09 (CSA, 2010c) indicating that these values may be conservative
for the studs tested, as well as some additional stiffness contributed by the exterior and
interior sheathing. All values exceed the SLS limit of HDT/360, where HDT is the distance
between the top and bottom LVDT. Also, the observed deflections along the edge of the
wall, at W1 and W1', are not equal. These deflections should be approximately half the
deflection of the other deflections since the end studs have half the tributary areas of the
interior studs. These deflections are likely dependant on the restraint provided by the
foam insulation in the vertical gaps at the end of the wall, which is not necessarily the
same.
The results from Test 1.2 under positive and negative pressure and Test 1.3 under
negative pressure were all consistent with the Test 1.1 results. Test 1.3 under positive
pressure, however, was slightly more variable. Table 4-5 shows the mean displacements,
and their standard deviations, for Test 1.1 and 1.2 under positive pressure, as compared to
Test 1.1, 1.2 and 1.3. The standard deviations increases consistently with the addition of
the Test 1.3 data. This variability mainly occurs at the mid-height deflection and at the
center top and bottom connections. Figure 4-7 shows the response at Points B5, T5 and
M5. In Test 1.3, there is an increase of 0.2-0.4mm displacement at the bottom and top
connection points, Figure 4-7(a) and (b) respectively, and 0.2-0.7mm displacement mid-
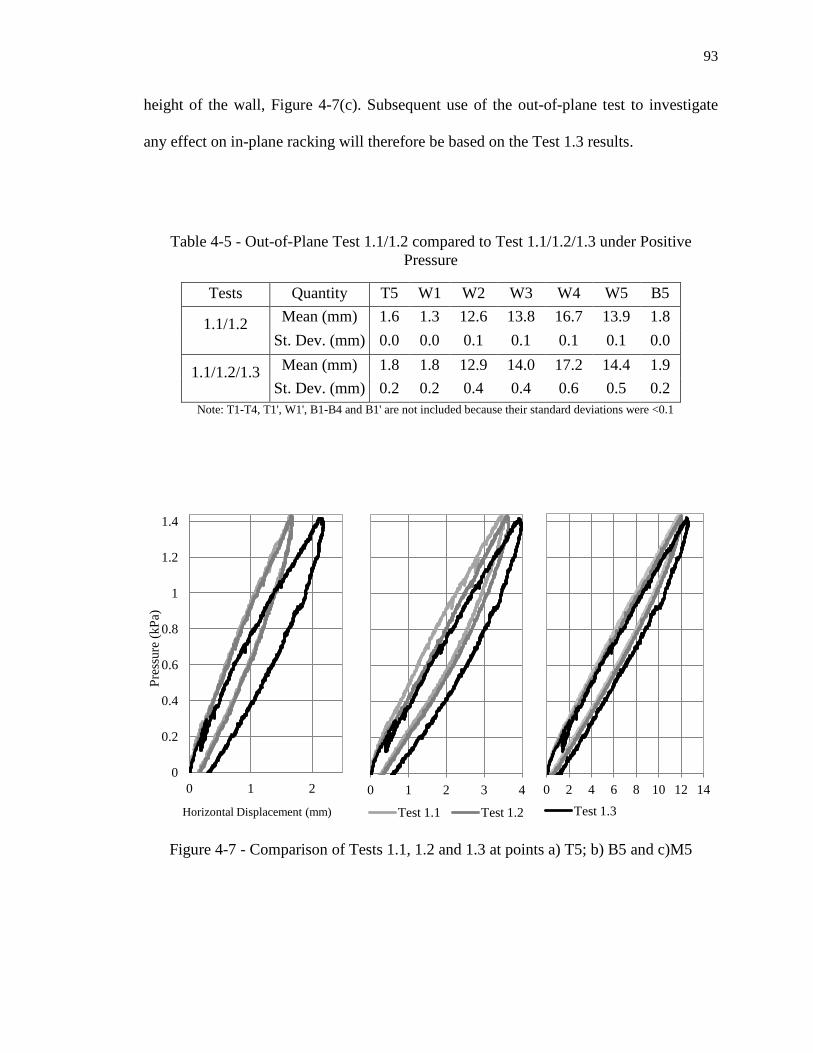
93
height of the wall, Figure 4-7(c). Subsequent use of the out-of-plane test to investigate
any effect on in-plane racking will therefore be based on the Test 1.3 results.
Table 4-5 - Out-of-Plane Test 1.1/1.2 compared to Test 1.1/1.2/1.3 under Positive Pressure
Tests Quantity T5 W1 W2 W3 W4 W5 B5
1.1/1.2 Mean (mm) 1.6 1.3 12.6 13.8 16.7 13.9 1.8 St. Dev. (mm) 0.0 0.0 0.1 0.1 0.1 0.1 0.0
1.1/1.2/1.3 Mean (mm) 1.8 1.8 12.9 14.0 17.2 14.4 1.9 St. Dev. (mm) 0.2 0.2 0.4 0.4 0.6 0.5 0.2
Note: T1-T4, T1', W1', B1-B4 and B1' are not included because their standard deviations were <0.1
Figure 4-7 - Comparison of Tests 1.1, 1.2 and 1.3 at points a) T5; b) B5 and c)M5
0
0.2
0.4
0.6
0.8
1
1.2
1.4
0 1 2
Pres
sure
(kPa
)
Horizontal Displacement (mm)
0 1 2 3 4
Test 1.1 Test 1.2
0 2 4 6 8 10 12 14 Test 1.3

94
4.2.4 PERFORMANCE OF TEST APPARATUS
The out-of-plane supports were designed to control out-of-plane movement of the
concrete frame. The corner connections (i.e., CT1, CT1’, CB1 and CB1’), shown in Table
4-6, had almost no displacement. The deflections of the beams at Location 5 are clearly
larger, especially for the bottom connection, CB5. This is due to the flexibility of
temporary connections that were constructed midspan of the beams.
Table 4-6 - Out-of-plane Support Deflections for Test 1.1
Pressure Deflection (mm) CT1 CT5 CT1' CB1 CB5 CB1'
Negative (-0.9kPa) 0.0 -0.4 0.0 -0.1 -1.8 0.0. Positive (1.44kPa) 0.0 0.8 0.0 0.1 1.7 0.1
The observed deflections of the concrete beams and columns between the out-of-plane
support points is shown in Table 4-7. The predicted values shown are based on the
following assumptions:
- the gross moment of inertia and the transformed moment of inertia, accounting for
the reinforcement, were both considered;
- the elastic modulus of concrete, Ec, is 29900 MPa;
- the top connection applies a uniform distributed load along the top beam and the
bottom connection applies two point loads, transferred by the shim connections,
to the bottom beam;
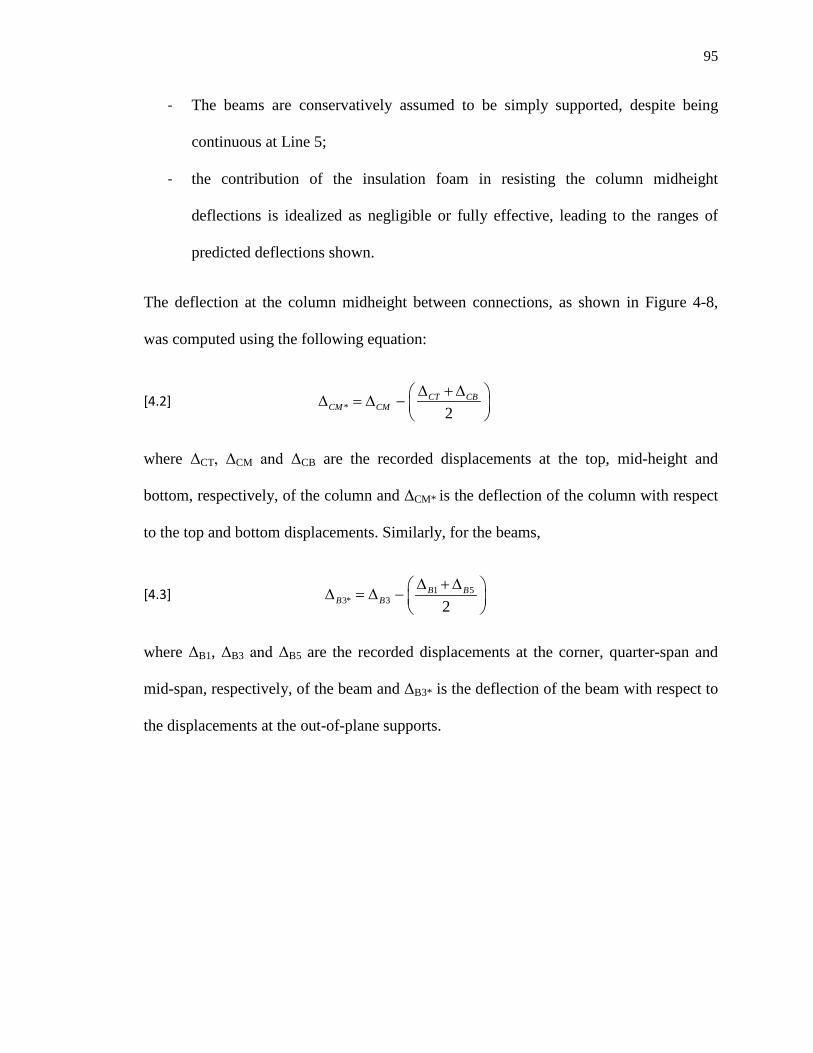
95
- The beams are conservatively assumed to be simply supported, despite being
continuous at Line 5;
- the contribution of the insulation foam in resisting the column midheight
deflections is idealized as negligible or fully effective, leading to the ranges of
predicted deflections shown.
The deflection at the column midheight between connections, as shown in Figure 4-8,
was computed using the following equation:
[4.2] * 2CT CB
CM CM∆ + ∆ ∆ = ∆ −
where ΔCT, ΔCM and ΔCB are the recorded displacements at the top, mid-height and
bottom, respectively, of the column and ΔCM* is the deflection of the column with respect
to the top and bottom displacements. Similarly, for the beams,
[4.3] 1 53* 3 2
B BB B
∆ + ∆ ∆ = ∆ −
where ΔB1, ΔB3 and ΔB5 are the recorded displacements at the corner, quarter-span and
mid-span, respectively, of the beam and ΔB3* is the deflection of the beam with respect to
the displacements at the out-of-plane supports.
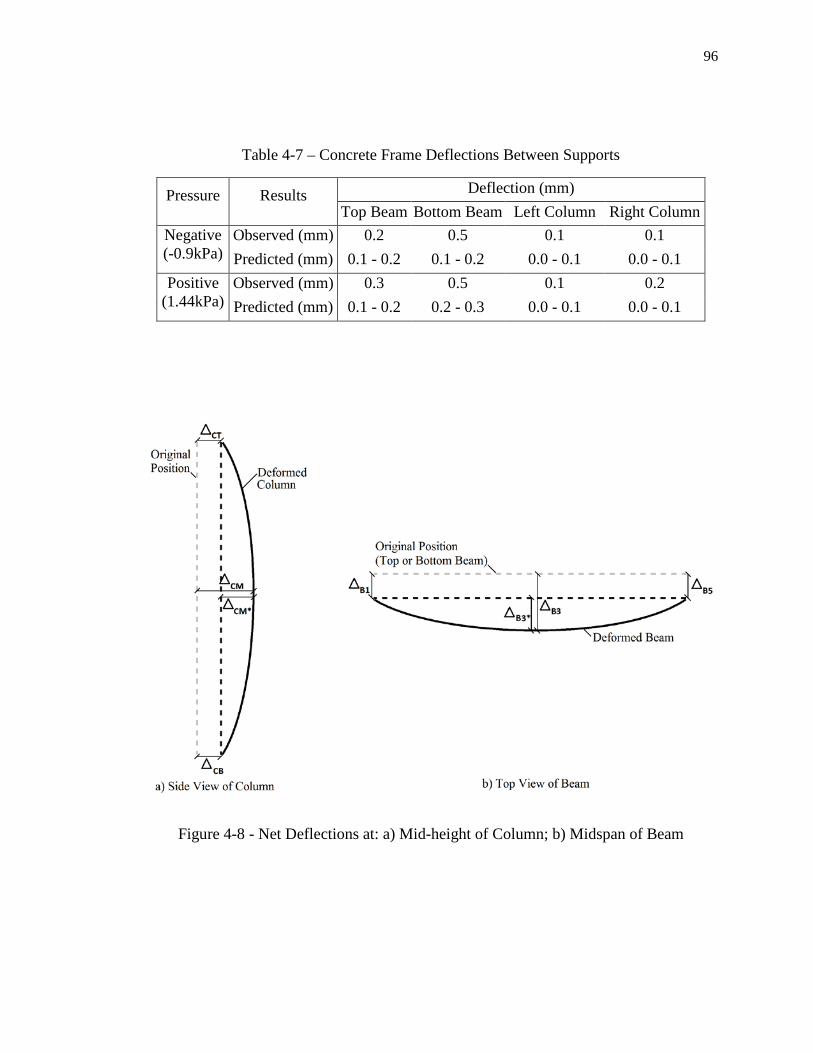
96
Table 4-7 – Concrete Frame Deflections Between Supports
Pressure Results Deflection (mm) Top Beam Bottom Beam Left Column Right Column
Negative (-0.9kPa)
Observed (mm) 0.2 0.5 0.1 0.1 Predicted (mm) 0.1 - 0.2 0.1 - 0.2 0.0 - 0.1 0.0 - 0.1
Positive (1.44kPa)
Observed (mm) 0.3 0.5 0.1 0.2 Predicted (mm) 0.1 - 0.2 0.2 - 0.3 0.0 - 0.1 0.0 - 0.1
Figure 4-8 - Net Deflections at: a) Mid-height of Column; b) Midspan of Beam
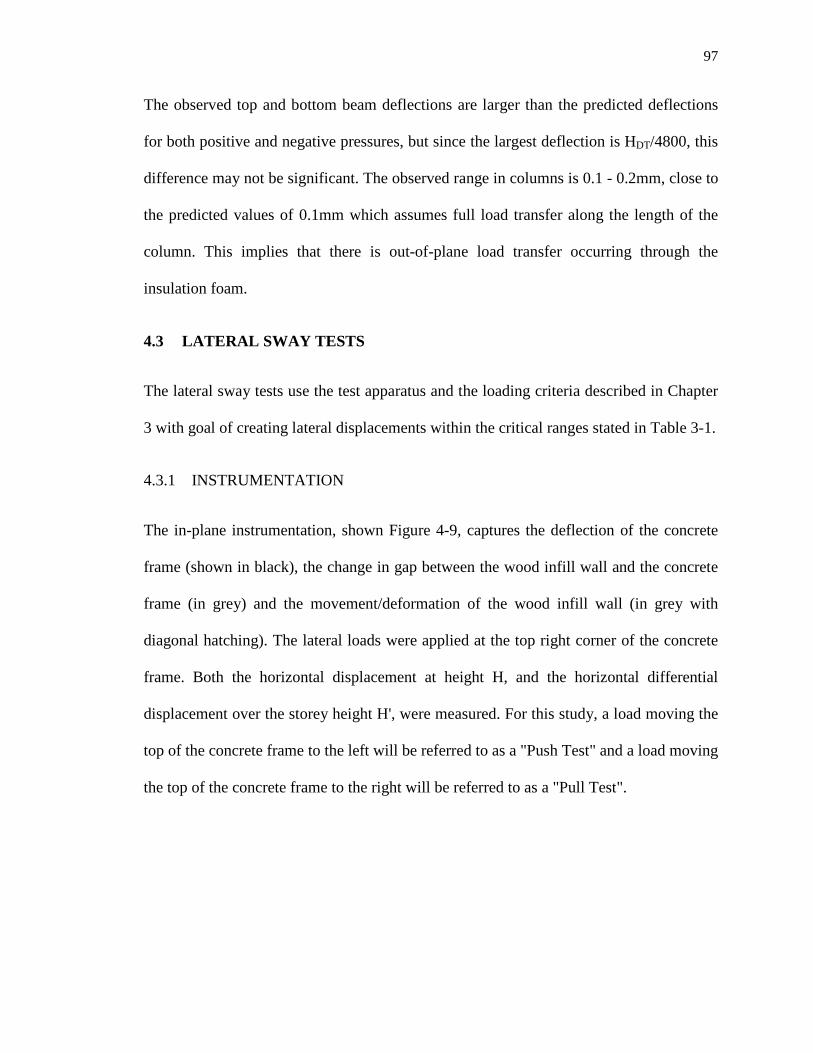
97
The observed top and bottom beam deflections are larger than the predicted deflections
for both positive and negative pressures, but since the largest deflection is HDT/4800, this
difference may not be significant. The observed range in columns is 0.1 - 0.2mm, close to
the predicted values of 0.1mm which assumes full load transfer along the length of the
column. This implies that there is out-of-plane load transfer occurring through the
insulation foam.
4.3 LATERAL SWAY TESTS
The lateral sway tests use the test apparatus and the loading criteria described in Chapter
3 with goal of creating lateral displacements within the critical ranges stated in Table 3-1.
4.3.1 INSTRUMENTATION
The in-plane instrumentation, shown Figure 4-9, captures the deflection of the concrete
frame (shown in black), the change in gap between the wood infill wall and the concrete
frame (in grey) and the movement/deformation of the wood infill wall (in grey with
diagonal hatching). The lateral loads were applied at the top right corner of the concrete
frame. Both the horizontal displacement at height H, and the horizontal differential
displacement over the storey height H', were measured. For this study, a load moving the
top of the concrete frame to the left will be referred to as a "Push Test" and a load moving
the top of the concrete frame to the right will be referred to as a "Pull Test".
98
Figure 4-9 - In-plane Instrumentation Location and Test Apparatus Details
4.3.2 PERFORMANCE OF TEST APPARATUS
The lateral sway response of the concrete frame are shown in Figure 4-10 for Pull Tests 1
and 2, represented by positive load and displacement, and Push Tests 1 and 2, represented
by negative load and displacement. The displacements shown are the differential
displacements over the storeys height, H. Maximum displacements and the associated
applied loads are also presented in Table 4-8. The predicted linear response is also
shown, which assumes a measured elastic modulus of the concrete of 29900 MPa. The
uncracked moments of inertia of the beams and columns in the SAP model are increased
by factors of 1.3 and 1.56, respectively, to account for the relatively heavy reinforcement
in the members.

99
Figure 4-10 - Lateral Sway Response at SLS
Table 4-8 - Concrete Frame Response During Lateral Sway Test at SLS
(Associated with Figures 4-10 and 4-11)
Test Stiffness (kN/mm) Max. Observed Displacement
Load (kN) Percent Error (%) Observed Predicted Observed Predicted
Pull SLS 1 H 3.1 3.2 6.6mm 22.1 23.4 6 Pull SLS 2 3.0 7.2mm 23.7 25.3 7 Push SLS 1 H 3.7 3.1 6.4mm 26.3 23.3 -13 Push SLS 2 3.3 6.2mm 23.4 22.7 -3 Pull ULS 1 H 3.1/2.1 3.2/2.6 17.6mm 46.8 51.5 9
-27
-18
-9
0
9
18
27
-8 -6 -4 -2 0 2 4 6 8
Load
ing
(kN
)
Lateral Differential Displacement (mm, positive = right)
Test 1 Test 2 Predicted
Pull Test
Push Test
100
Figure 4-10 shows the load-deflection response of the frame subjected to specified wind
loads. The load was initially applied at a rate of 0.36 kN/sec, and the evident 'saw tooth'
response is due to the manual pumping of the hydraulic jack. The unloading response is
relatively smooth because the load was released continuously when the jack pressure was
relieved. Residual displacements, of approximately +1mm and -0.5mm occurred after
each Pull and Push Test, respectively. Accounting for these residual displacements, the
stiffnesses predicted using the linear elastic SAP model are close to the observed values.
Table 4-8 shows that there is a slight decrease in stiffness between Pull Test 1 and Pull
Test 2, yet the results are fairly repeatable. There is a larger decrease in stiffness,
however, between Push Test 1 and Push Test 2. The overall observed stiffnesses of the
frame are larger during the Push Tests, especially Push Test 1, than the Pull Tests. The
predicted stiffness is slightly greater than the observed value for the Pull Test and less
than the observed value for the Push Test. The maximum observed lateral differential
displacements between the top and bottom beams for the right side of the concrete frame
are generally within the target range of 6-7mm. The predicted loads to reach the
maximum SLS displacements are within 6% of the observed load, except for Push Test 1
which showed a stiffer response.
An ultimate pull test was also performed, shown in Figure 4-11, to a maximum observed
lateral differential displacement of 17.6mm, within the target range of 16-18mm. There is
clearly a reduction in stiffness, from 3.2 kN/mm to approximately 2.1 kN/mm, at an
approximate lateral differential displacement of 10mm. It is likely that this response is
due to cracking in the concrete, although no visible cracks were observed in the test
frame. Despite this, a bi-linear response is assumed with a reduction of stiffness from the
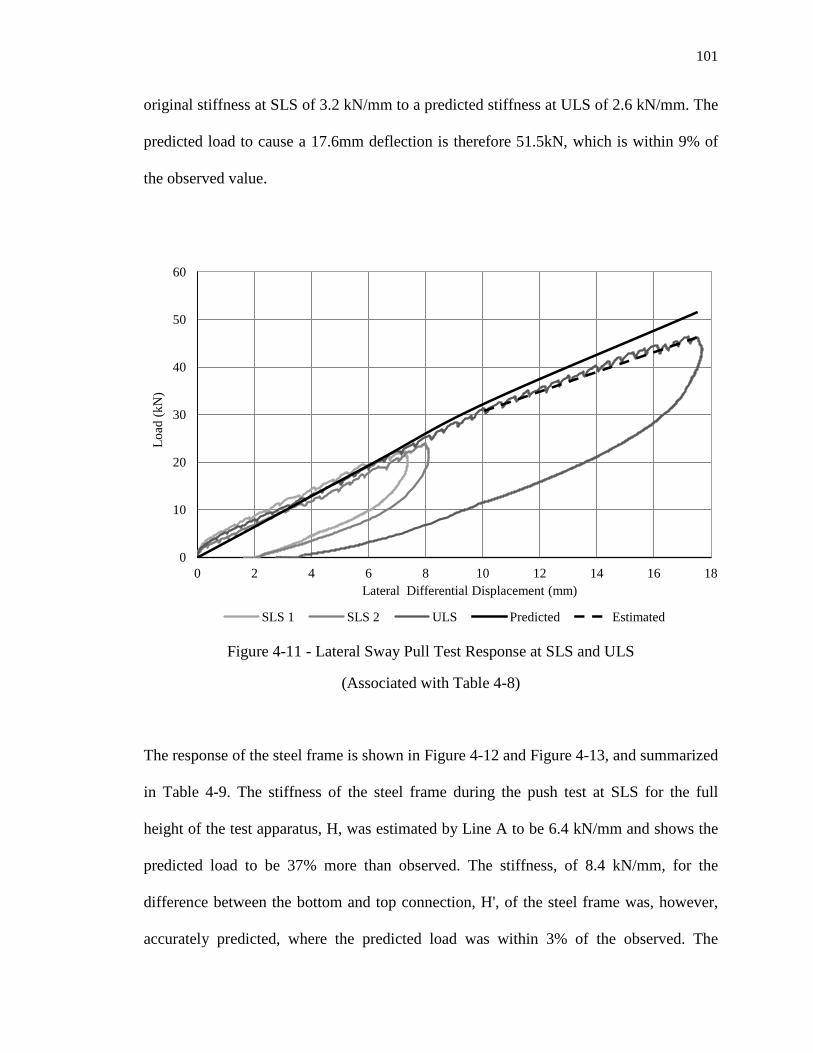
101
original stiffness at SLS of 3.2 kN/mm to a predicted stiffness at ULS of 2.6 kN/mm. The
predicted load to cause a 17.6mm deflection is therefore 51.5kN, which is within 9% of
the observed value.
Figure 4-11 - Lateral Sway Pull Test Response at SLS and ULS
(Associated with Table 4-8)
The response of the steel frame is shown in Figure 4-12 and Figure 4-13, and summarized
in Table 4-9. The stiffness of the steel frame during the push test at SLS for the full
height of the test apparatus, H, was estimated by Line A to be 6.4 kN/mm and shows the
predicted load to be 37% more than observed. The stiffness, of 8.4 kN/mm, for the
difference between the bottom and top connection, H', of the steel frame was, however,
accurately predicted, where the predicted load was within 3% of the observed. The
0
10
20
30
40
50
60
0 2 4 6 8 10 12 14 16 18
Load
(kN
)
Lateral Differential Displacement (mm)
SLS 1 SLS 2 ULS Predicted Estimated
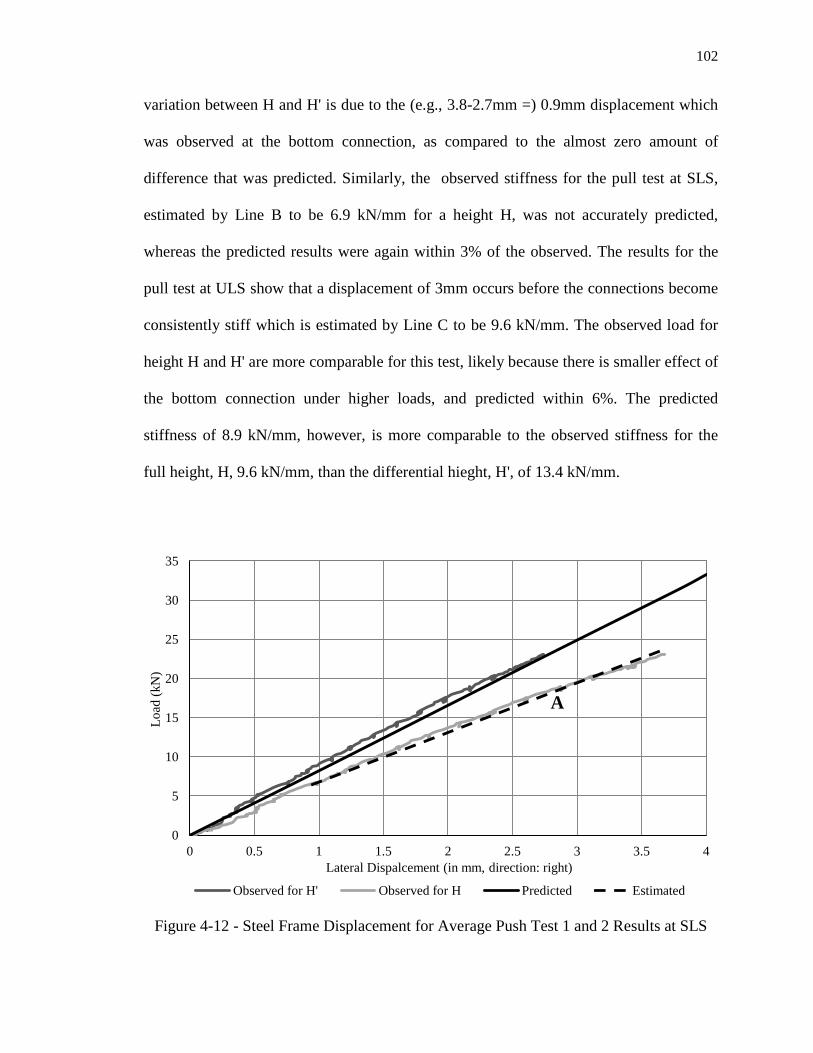
102
variation between H and H' is due to the (e.g., 3.8-2.7mm =) 0.9mm displacement which
was observed at the bottom connection, as compared to the almost zero amount of
difference that was predicted. Similarly, the observed stiffness for the pull test at SLS,
estimated by Line B to be 6.9 kN/mm for a height H, was not accurately predicted,
whereas the predicted results were again within 3% of the observed. The results for the
pull test at ULS show that a displacement of 3mm occurs before the connections become
consistently stiff which is estimated by Line C to be 9.6 kN/mm. The observed load for
height H and H' are more comparable for this test, likely because there is smaller effect of
the bottom connection under higher loads, and predicted within 6%. The predicted
stiffness of 8.9 kN/mm, however, is more comparable to the observed stiffness for the
full height, H, 9.6 kN/mm, than the differential hieght, H', of 13.4 kN/mm.
Figure 4-12 - Steel Frame Displacement for Average Push Test 1 and 2 Results at SLS
0
5
10
15
20
25
30
35
0 0.5 1 1.5 2 2.5 3 3.5 4
Load
(kN
)
Lateral Dispalcement (in mm, direction: right)
Observed for H' Observed for H Predicted Estimated
A
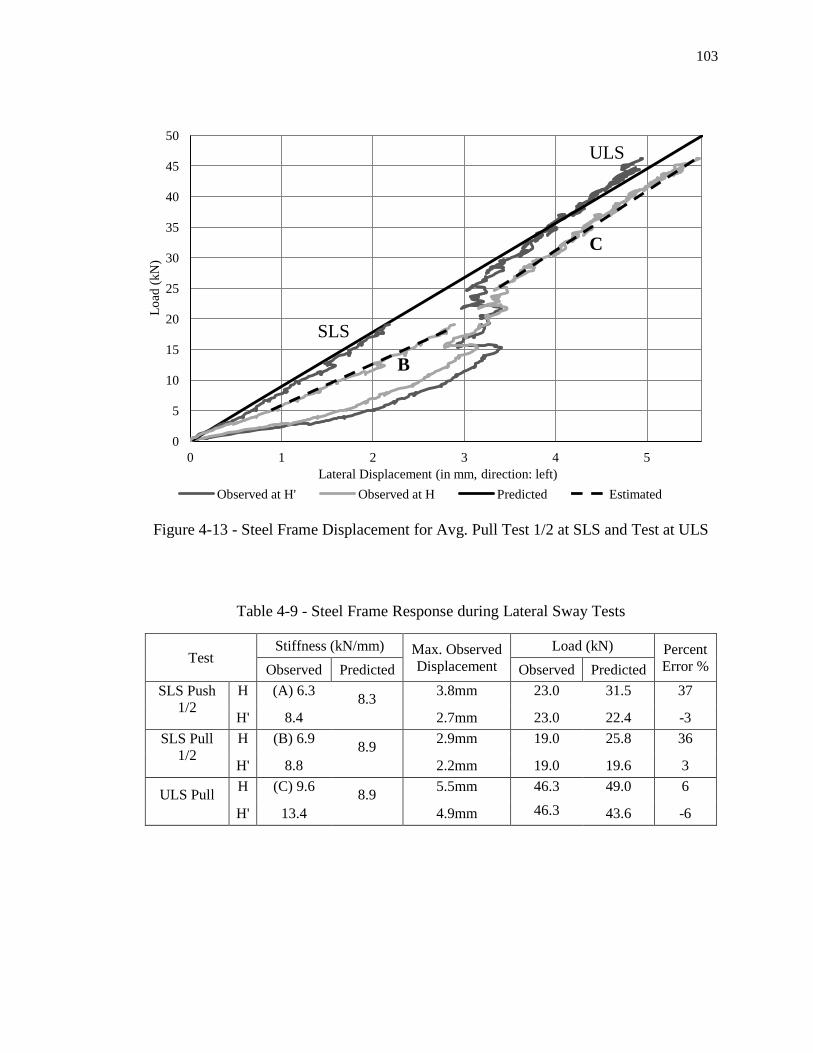
103
Figure 4-13 - Steel Frame Displacement for Avg. Pull Test 1/2 at SLS and Test at ULS
Table 4-9 - Steel Frame Response during Lateral Sway Tests
Test Stiffness (kN/mm) Max. Observed
Displacement Load (kN) Percent
Error % Observed Predicted Observed Predicted SLS Push
1/2 H (A) 6.3 8.3 3.8mm 23.0 31.5 37
H' 8.4 2.7mm 23.0 22.4 -3 SLS Pull
1/2 H (B) 6.9 8.9 2.9mm 19.0 25.8 36
H' 8.8 2.2mm 19.0 19.6 3
ULS Pull H (C) 9.6 8.9 5.5mm 46.3 49.0 6
H' 13.4 4.9mm 46.3
43.6 -6
0
5
10
15
20
25
30
35
40
45
50
0 1 2 3 4 5
Load
(kN
)
Lateral Displacement (in mm, direction: left) Observed at H' Observed at H Predicted Estimated
B
C
ULS
SLS

104
Table 4-10A, B, and C shows the average observed and predicted displacements of the
concrete frame for the push and pull test at SLS and ULS, where the displacement points
are identified in Figure 4-14 and the horizontal displacement at ∆T1' is used as the control
displacement. The differences between the predicted and observed values are also shown,
where the values shown in brackets represent instances where the predicted deflection
underestimates the observed response. Differences greater than 0.5mm are likely
significant.
Figure 4-14 - Deflected Shape of Concrete Frame under Lateral Sway Loading
(Associated with Table 4-10A, B and C)
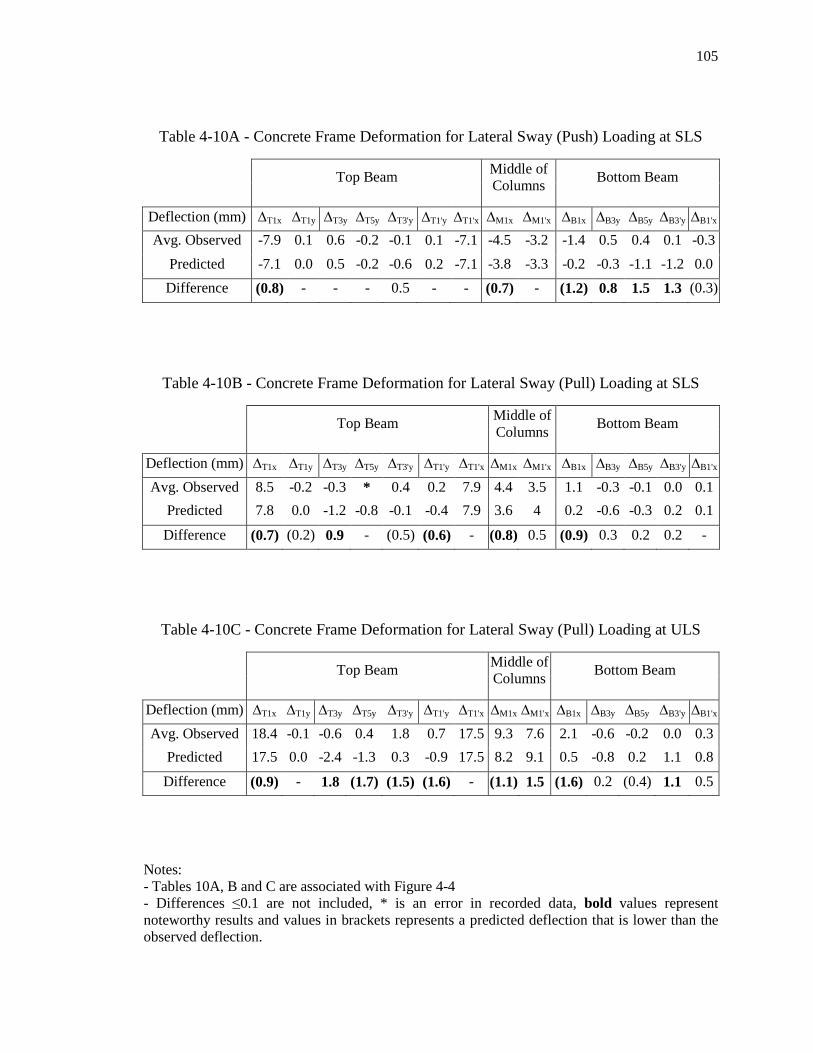
105
Table 4-10A - Concrete Frame Deformation for Lateral Sway (Push) Loading at SLS
Top Beam Middle of Columns Bottom Beam
Deflection (mm) ∆T1x ∆T1y ∆T3y ∆T5y ∆T3'y ∆T1'y ∆T1'x ∆M1x ∆M1'x ∆B1x ∆B3y ∆B5y ∆B3'y ∆B1'x Avg. Observed -7.9 0.1 0.6 -0.2 -0.1 0.1 -7.1 -4.5 -3.2 -1.4 0.5 0.4 0.1 -0.3
Predicted -7.1 0.0 0.5 -0.2 -0.6 0.2 -7.1 -3.8 -3.3 -0.2 -0.3 -1.1 -1.2 0.0 Difference (0.8) - - - 0.5 - - (0.7) - (1.2) 0.8 1.5 1.3 (0.3)
Table 4-10B - Concrete Frame Deformation for Lateral Sway (Pull) Loading at SLS
Top Beam Middle of Columns Bottom Beam
Deflection (mm) ∆T1x ∆T1y ∆T3y ∆T5y ∆T3'y ∆T1'y ∆T1'x ∆M1x ∆M1'x ∆B1x ∆B3y ∆B5y ∆B3'y ∆B1'x Avg. Observed 8.5 -0.2 -0.3 * 0.4 0.2 7.9 4.4 3.5 1.1 -0.3 -0.1 0.0 0.1
Predicted 7.8 0.0 -1.2 -0.8 -0.1 -0.4 7.9 3.6 4 0.2 -0.6 -0.3 0.2 0.1 Difference (0.7) (0.2) 0.9 - (0.5) (0.6) - (0.8) 0.5 (0.9) 0.3 0.2 0.2 -
Table 4-10C - Concrete Frame Deformation for Lateral Sway (Pull) Loading at ULS
Top Beam Middle of Columns Bottom Beam
Deflection (mm) ∆T1x ∆T1y ∆T3y ∆T5y ∆T3'y ∆T1'y ∆T1'x ∆M1x ∆M1'x ∆B1x ∆B3y ∆B5y ∆B3'y ∆B1'x Avg. Observed 18.4 -0.1 -0.6 0.4 1.8 0.7 17.5 9.3 7.6 2.1 -0.6 -0.2 0.0 0.3
Predicted 17.5 0.0 -2.4 -1.3 0.3 -0.9 17.5 8.2 9.1 0.5 -0.8 0.2 1.1 0.8 Difference (0.9) - 1.8 (1.7) (1.5) (1.6) - (1.1) 1.5 (1.6) 0.2 (0.4) 1.1 0.5
Notes: - Tables 10A, B and C are associated with Figure 4-4 - Differences ≤0.1 are not included, * is an error in recorded data, bold values represent noteworthy results and values in brackets represents a predicted deflection that is lower than the observed deflection.
106
Overall the deformed shape for the push test at SLS, presented in Table 4-10A, is
accurately predicted. The horizontal displacements of the right column, Line 1', are
accurately predicted, however the left column displacements, Line 1, are slightly
underestimated. The predict response suggests that the left and right column should be
similar, although the observed results show the left side displacing 0.7-1.2mm more than
the right side where the load is applied. The observed vertical displacements of the top
beam, Line T, are fairly close to the predicted values. The predicted displacements of
bottom beam, Line B, are all larger than the observed displacements, indicating that the
bottom beam maybe stiffer than expected.
Similarly, the observed deformed shape for the pull test at SLS, presented in Table
4-10B, is accurately predicted. The predicted horizontal displacements of the right
column, Line 1', are again accurate, yet the left column, Line 1, displaced 0.7-0.9mm
more than predicted, similar to the push test results. The predicted displacements of
bottom beam, Line B, are much closer to the observed values, however the displacements
of the top beam, Line T, show some inconsistencies. A similar, although larger, response
was observed during the Pull Test at ULS, shown in Table 4-10C. All predicted
displacements of the concrete frame are within 1.7mm of the observed values.

107
4.3.3 PERFORMANCE OF SPECIMEN
Table 4-11A and B compares the predicted and observed wall movement during the
lateral test at SLS for both the push and pull test, respectively. The variables listed in the
column heading are shown in Figure 4-15. There is very little predicted movement of the
wall, i.e, no expected deformation, as shown by ∆D, for both the push and pull tests. The
observed results indicated that the top of the wall moving laterally with the deformation
of the concrete frame with some smaller vertical displacements, and that this movement
includes a change of the wall diagonal length of 3.2-4.5mm. The differences highlighted
between the predicted and observed results are likely due to the insulation foam which
again seems to be transferring load from the concrete frame to the wood infill wall, which
is not accounted for in the predicted results.
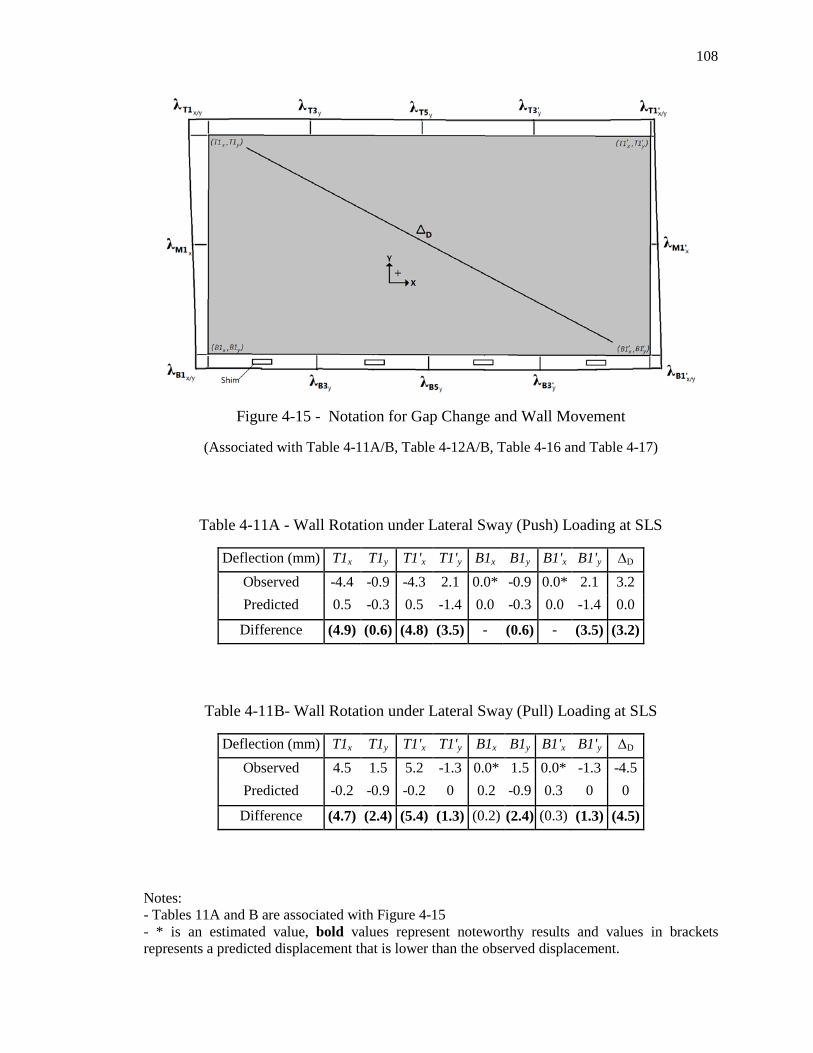
108
Figure 4-15 - Notation for Gap Change and Wall Movement
(Associated with Table 4-11A/B, Table 4-12A/B, Table 4-16 and Table 4-17)
Table 4-11A - Wall Rotation under Lateral Sway (Push) Loading at SLS
Deflection (mm) T1x T1y T1'x T1'y B1x B1y B1'x B1'y ∆D Observed -4.4 -0.9 -4.3 2.1 0.0* -0.9 0.0* 2.1 3.2 Predicted 0.5 -0.3 0.5 -1.4 0.0 -0.3 0.0 -1.4 0.0 Difference (4.9) (0.6) (4.8) (3.5) - (0.6) - (3.5) (3.2)
Table 4-11B- Wall Rotation under Lateral Sway (Pull) Loading at SLS
Deflection (mm) T1x T1y T1'x T1'y B1x B1y B1'x B1'y ∆D Observed 4.5 1.5 5.2 -1.3 0.0* 1.5 0.0* -1.3 -4.5 Predicted -0.2 -0.9 -0.2 0 0.2 -0.9 0.3 0 0 Difference (4.7) (2.4) (5.4) (1.3) (0.2) (2.4) (0.3) (1.3) (4.5)
Notes: - Tables 11A and B are associated with Figure 4-15 - * is an estimated value, bold values represent noteworthy results and values in brackets represents a predicted displacement that is lower than the observed displacement.
109
Table 4-12A and B compare the predicted and observed change in gap during the lateral
sway test at SLS for both the push and pull test, respectively, with positive values
representing an increase in gap. The maximum predicted changes in gap 6.4 - 7.8mm
occur at the top corners of the wall, λT1x and λT1'x in Figure 4-15. As shown in Figure
4-16 for the top right corner, these correspond approximately to the predicted lateral
displacements of the concrete frame. The observed gap changes at these locations,
however, was only 1.6 - 1.8mm with a similar response in both an increase and decrease
in gap. This further indicates that the infill wall is clearly moving with the lateral sway
displacement of the concrete frame, again emphasizing the likelihood that the insulation
foam is transferring load to the infill wall. Table 4-12A and B also show minor
discrepancies between the observed and predicted gap changes along the bottom and top
beams, especially at the corners of the infill wall as the wall starts to rotate.

110
Table 4-12A - Change in Gap under Lateral Sway (Push) Loading at SLS
Top Beam Middle of
Columns
Bottom Beam
Deflection λT1x λT1y λT3y λT5y λT3'y λT1'x λT1'y λM1x λM1'x λB1x λB1y λB3y λB5y λB3'y λB1'x λB1'y Observed 1.7 1.2 0.4 0.3 -1.0 -1.8 -2.1 -0.1 0.0 -1.7 -1.0 -0.8 1.0 0.7 1.4 2.1 Predicted 7.1 0.4 1.1 0.7 0.6 -6.4 1.4 3.5 -4.0 0.2 -0.3 -0.3 0.3 0.0 -0.4 -1.4 Difference 5.4 (0.8) 0.7 0.4 (1.6) 4.6 (3.5) 3.6 4.0 (1.9) (0.7) (0.5) 0.7 0.7 1.8 3.5
Table 4-12B - Change in Gap under Lateral Sway (Pull) Loading at SLS
Top Beam Middle of Columns Bottom Beam
Deflection λT1x λT1y λT3y λT5y λT3'y λT1'x λT1'y λM1x λM1'x λB1x λB1y λB3y λB5y λB3'y λB1'x λB1'y Observed -1.6 -1.7 -1.1 -1.0 -0.4 1.7 1.3 0.3 -0.5 1.9 1.5 1.4 0.6 -0.1 -2.3 1.3 Predicted -7.7 0.9 -0.5 -0.4 0.1 7.8 -0.3 4.0 -3.7 -0.2 -0.8 -0.1 -0.1 -0.4 -0.1 0.3
Difference 6.1 (2.6) (0.6) (0.6) (0.5) 6.1 (1.6) 3.7 3.2 (2.1) (2.3) (1.5) (0.7) 0.3 (2.2) (1.0)
Notes: - Tables 12A and B are associated with Figure 4-15 - Differences ≤0.1 are not included, bold values represent noteworthy results, positive deflection represents an increase in gap and a negative displacement represents a decrease in gap, and differences in brackets represents a predicted change in gap that is lower than the observed change in gap.

111
Figure 4-16 - Change in Gap at Top Right Corner for Lateral Sway Loading at SLS
4.4 VERTICAL RACKING TESTS
The vertical racking test uses the test apparatus and the loading criteria described in
Chapter 3, with goal of creating vertical displacements within the critical ranges stated in
Table 3-1. The in-plane instrumentation is the same as for the lateral racking tests shown
in Figure 4-9. The vertical load is applied at the bottom left corner of the concrete frame
to achieve the target vertical differential displacement between the two columns spaced a
distance, L, apart. During the jack installation for the vertical load, a temporary jack was
required, at the locations shown, to support the frame near the bottom left corner.
-8
-6
-4
-2
0
2
4
6
8
-8 -6 -4 -2 0 2 4 6 8
Late
ral D
ispl
acem
ent o
f Con
cret
e Fr
ame
(mm
)
Change in Gap (in mm, positive = larger gap, i.e. pull test)
Push 1 Push 2 Pull 1 Pull 2 predicted
112
4.4.1 PERFORMANCE OF TEST APPARATUS
The combined response of the concrete frame under vertical loading at SLS and ULS is
shown in Figure 4-17, and is also summarized in Table 4-13. The initial predicted
response, as seen in Figure 4-17, shows no vertical deflection until the jacking load
exceeded the vertical reaction due to the self-weight of the concrete frame and
attachments, which was determined in a separate test to be 12.7kN. This was simulated in
the SAP model as the self-weight of the concrete frame and reinforcement, including
details such as the steel W-shape attached to the leg, the wood infill wall, and the wood
bag attachment. The initial observed response at SLS at the frame lift-off (i.e., the point
where the stiffness of the frame is engaged), say at a deflection of 0.6mm, was 16.2kN.
The observed response at ULS at the frame lift-off, for this case say 4.2mm, was 18.3kN.
The variation in initial response, or reduced initial stiffness, between the test at SLS and
ULS is due to the added effect of the temporary loading device, shown in Figure 4-9,
during the test at ULS which was accidently left to support the weight of the frame during
jacking. The extra (16.2kN-12.7kN=) 3.5kN at SLS and (18.3-12.7=) 5.6kN at ULS,
when compared to the predicted 12.7kN, may have been caused by wood blocking
between the top right corner of the concrete frame and the steel frame, which preloaded
the concrete frame before testing. The difference between these two values (i.e., 3.5kN
vs. 5.5kN) could be attributed to the varied amount of preloading that occurred between
tests.
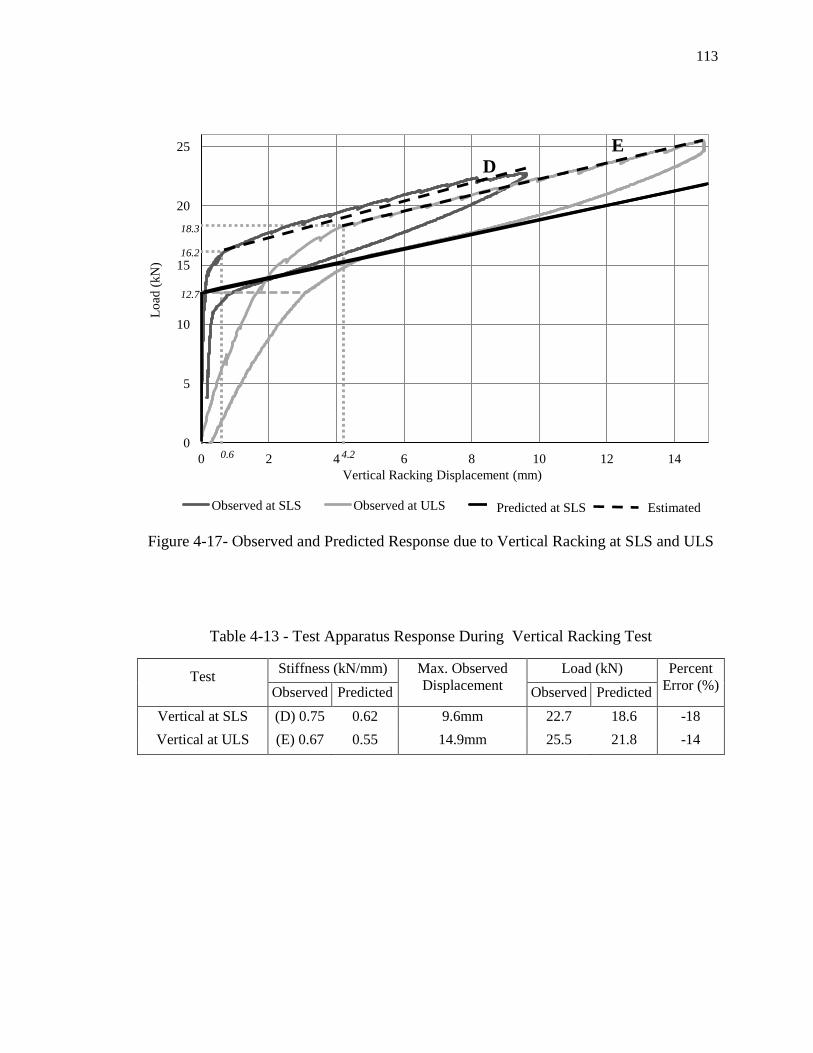
113
Figure 4-17- Observed and Predicted Response due to Vertical Racking at SLS and ULS
Table 4-13 - Test Apparatus Response During Vertical Racking Test
Test Stiffness (kN/mm) Max. Observed Displacement
Load (kN) Percent Error (%) Observed Predicted Observed Predicted
Vertical at SLS (D) 0.75 0.62 9.6mm 22.7
18.6 -18 Vertical at ULS (E) 0.67 0.55 14.9mm 25.5 21.8 -14
0
5
10
15
20
25
0 2 4 6 8 10 12 14
Load
(kN
)
Vertical Racking Displacement (mm)
Observed at SLS Observed at ULS Predicted
12.7
16.2
4.2 0.6
18.3
D E
Predicted at SLS Estimated
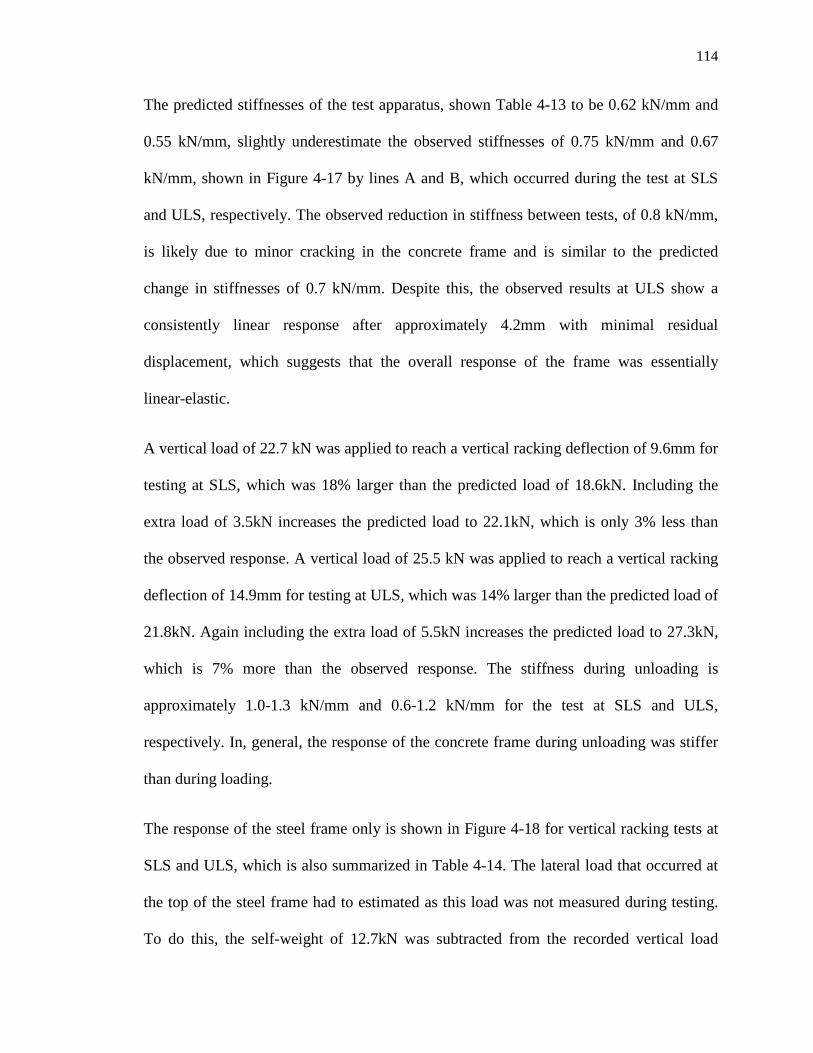
114
The predicted stiffnesses of the test apparatus, shown Table 4-13 to be 0.62 kN/mm and
0.55 kN/mm, slightly underestimate the observed stiffnesses of 0.75 kN/mm and 0.67
kN/mm, shown in Figure 4-17 by lines A and B, which occurred during the test at SLS
and ULS, respectively. The observed reduction in stiffness between tests, of 0.8 kN/mm,
is likely due to minor cracking in the concrete frame and is similar to the predicted
change in stiffnesses of 0.7 kN/mm. Despite this, the observed results at ULS show a
consistently linear response after approximately 4.2mm with minimal residual
displacement, which suggests that the overall response of the frame was essentially
linear-elastic.
A vertical load of 22.7 kN was applied to reach a vertical racking deflection of 9.6mm for
testing at SLS, which was 18% larger than the predicted load of 18.6kN. Including the
extra load of 3.5kN increases the predicted load to 22.1kN, which is only 3% less than
the observed response. A vertical load of 25.5 kN was applied to reach a vertical racking
deflection of 14.9mm for testing at ULS, which was 14% larger than the predicted load of
21.8kN. Again including the extra load of 5.5kN increases the predicted load to 27.3kN,
which is 7% more than the observed response. The stiffness during unloading is
approximately 1.0-1.3 kN/mm and 0.6-1.2 kN/mm for the test at SLS and ULS,
respectively. In, general, the response of the concrete frame during unloading was stiffer
than during loading.
The response of the steel frame only is shown in Figure 4-18 for vertical racking tests at
SLS and ULS, which is also summarized in Table 4-14. The lateral load that occurred at
the top of the steel frame had to estimated as this load was not measured during testing.
To do this, the self-weight of 12.7kN was subtracted from the recorded vertical load
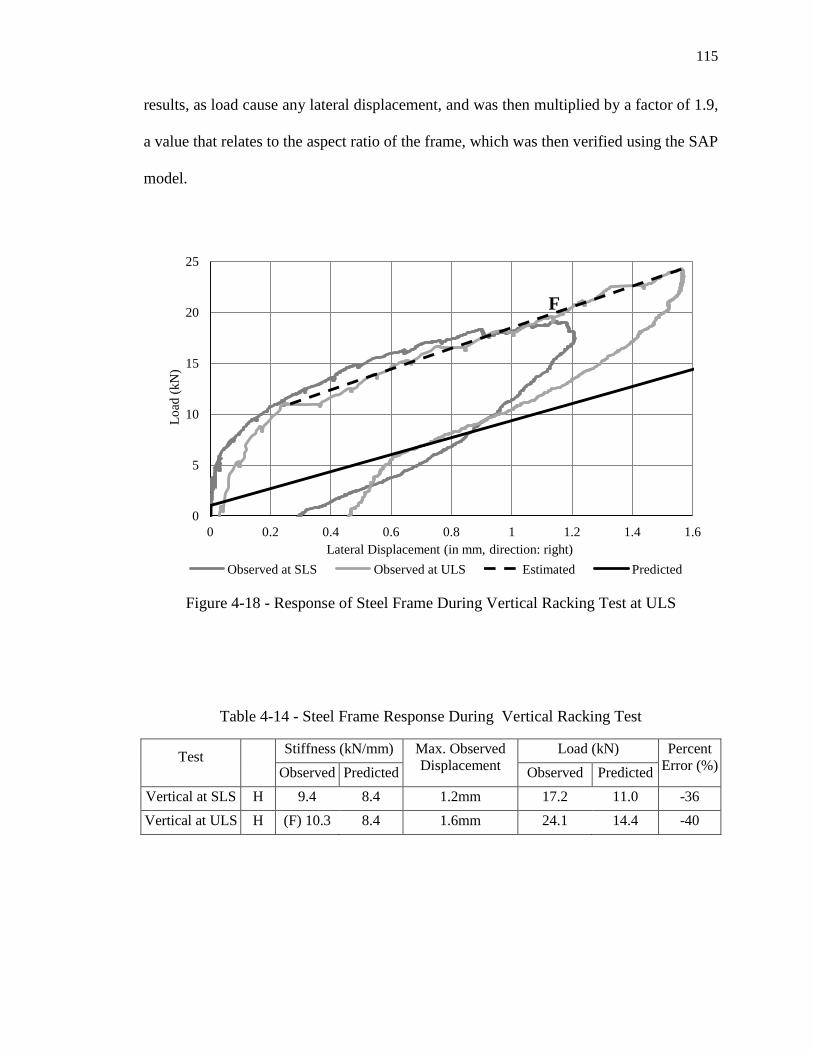
115
results, as load cause any lateral displacement, and was then multiplied by a factor of 1.9,
a value that relates to the aspect ratio of the frame, which was then verified using the SAP
model.
Figure 4-18 - Response of Steel Frame During Vertical Racking Test at ULS
Table 4-14 - Steel Frame Response During Vertical Racking Test
Test Stiffness (kN/mm) Max. Observed Displacement
Load (kN) Percent Error (%) Observed Predicted Observed Predicted
Vertical at SLS H
9.4 8.4 1.2mm 17.2
11.0
-36 Vertical at ULS H (F) 10.3
8.4 1.6mm 24.1 14.4 -40
0
5
10
15
20
25
0 0.2 0.4 0.6 0.8 1 1.2 1.4 1.6
Load
(kN
)
Lateral Displacement (in mm, direction: right) Observed at SLS Observed at ULS Estimated Predicted
F
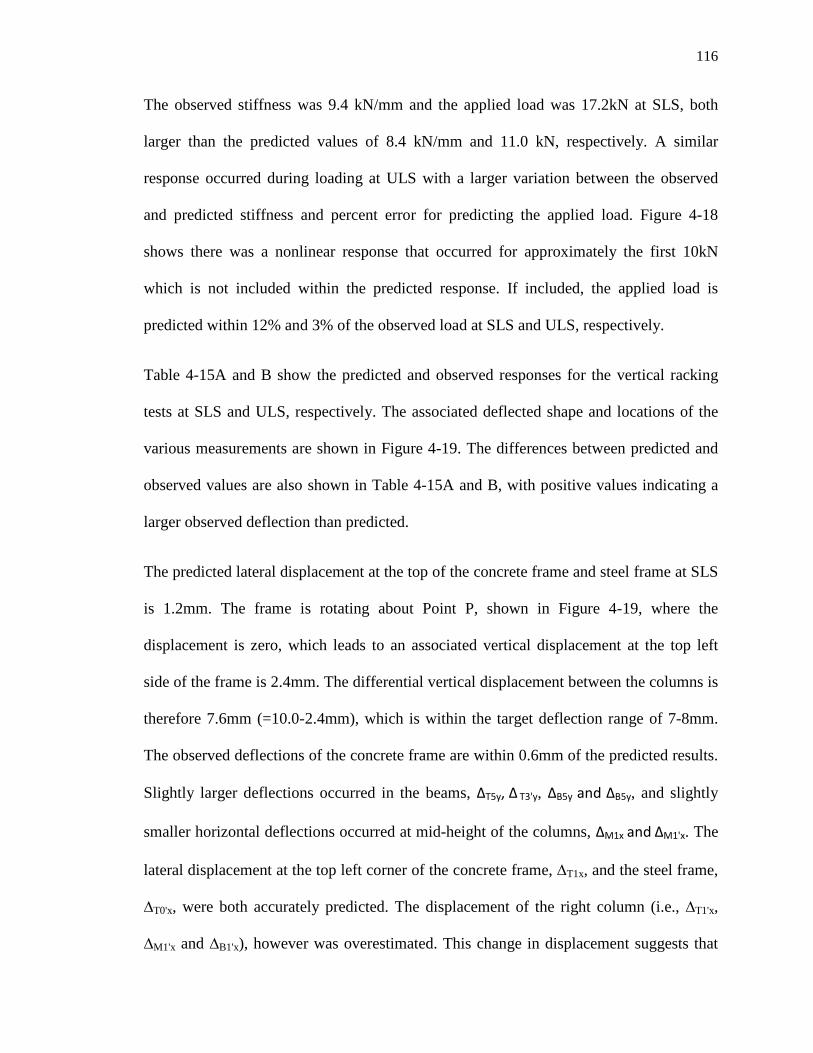
116
The observed stiffness was 9.4 kN/mm and the applied load was 17.2kN at SLS, both
larger than the predicted values of 8.4 kN/mm and 11.0 kN, respectively. A similar
response occurred during loading at ULS with a larger variation between the observed
and predicted stiffness and percent error for predicting the applied load. Figure 4-18
shows there was a nonlinear response that occurred for approximately the first 10kN
which is not included within the predicted response. If included, the applied load is
predicted within 12% and 3% of the observed load at SLS and ULS, respectively.
Table 4-15A and B show the predicted and observed responses for the vertical racking
tests at SLS and ULS, respectively. The associated deflected shape and locations of the
various measurements are shown in Figure 4-19. The differences between predicted and
observed values are also shown in Table 4-15A and B, with positive values indicating a
larger observed deflection than predicted.
The predicted lateral displacement at the top of the concrete frame and steel frame at SLS
is 1.2mm. The frame is rotating about Point P, shown in Figure 4-19, where the
displacement is zero, which leads to an associated vertical displacement at the top left
side of the frame is 2.4mm. The differential vertical displacement between the columns is
therefore 7.6mm (=10.0-2.4mm), which is within the target deflection range of 7-8mm.
The observed deflections of the concrete frame are within 0.6mm of the predicted results.
Slightly larger deflections occurred in the beams, ∆T5y, ∆ T3'y, ∆B5y and ∆B5y, and slightly
smaller horizontal deflections occurred at mid-height of the columns, ∆M1x and ∆M1'x. The
lateral displacement at the top left corner of the concrete frame, ∆T1x, and the steel frame,
∆T0'x, were both accurately predicted. The displacement of the right column (i.e., ∆T1'x,
∆M1'x and ∆B1'x), however was overestimated. This change in displacement suggests that
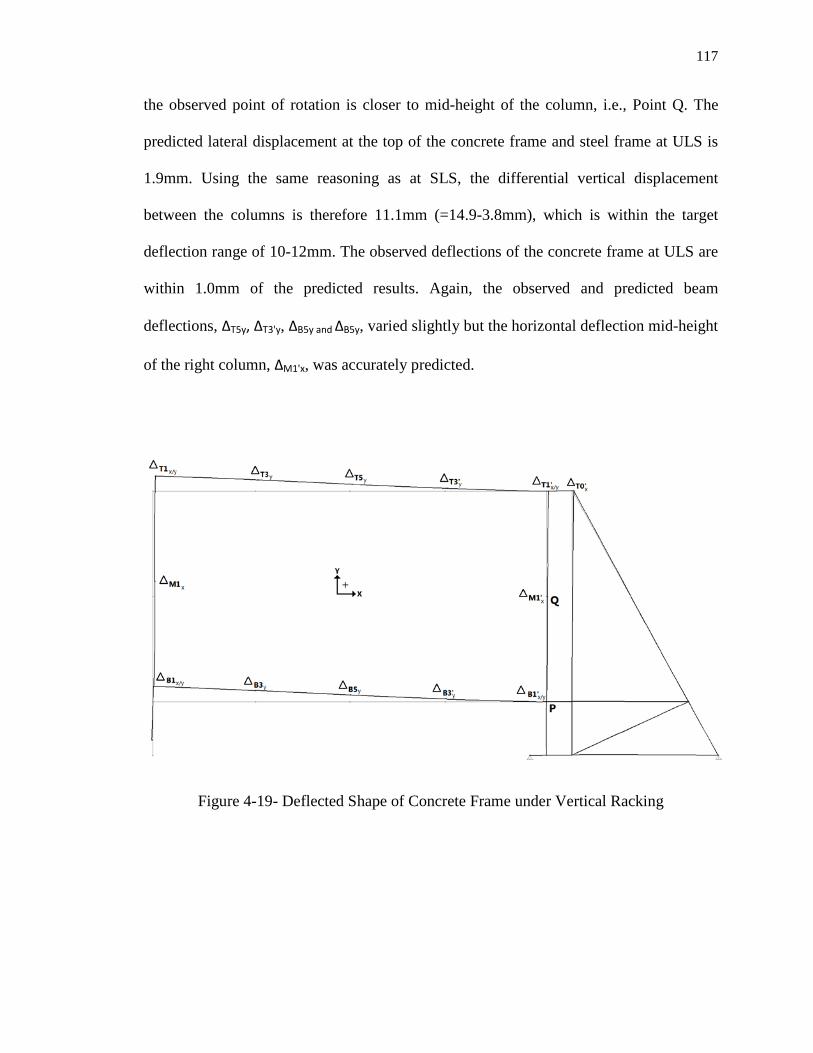
117
the observed point of rotation is closer to mid-height of the column, i.e., Point Q. The
predicted lateral displacement at the top of the concrete frame and steel frame at ULS is
1.9mm. Using the same reasoning as at SLS, the differential vertical displacement
between the columns is therefore 11.1mm (=14.9-3.8mm), which is within the target
deflection range of 10-12mm. The observed deflections of the concrete frame at ULS are
within 1.0mm of the predicted results. Again, the observed and predicted beam
deflections, ∆T5y, ∆T3'y, ∆B5y and ∆B5y, varied slightly but the horizontal deflection mid-height
of the right column, ∆M1'x, was accurately predicted.
Figure 4-19- Deflected Shape of Concrete Frame under Vertical Racking
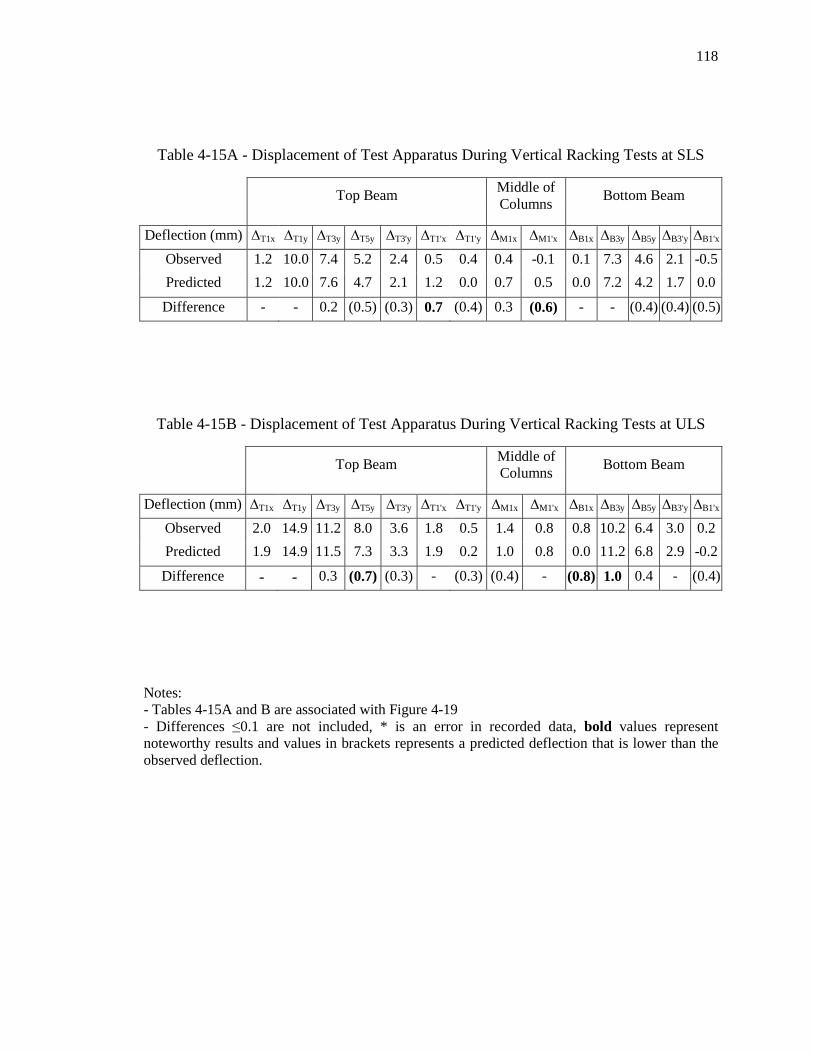
118
Table 4-15A - Displacement of Test Apparatus During Vertical Racking Tests at SLS
Top Beam Middle of Columns Bottom Beam
Deflection (mm) ∆T1x ∆T1y ∆T3y ∆T5y ∆T3'y ∆T1'x ∆T1'y ∆M1x ∆M1'x ∆B1x ∆B3y ∆B5y ∆B3'y ∆B1'x
Observed 1.2 10.0 7.4 5.2 2.4 0.5 0.4 0.4 -0.1 0.1 7.3 4.6 2.1 -0.5 Predicted 1.2 10.0 7.6 4.7 2.1 1.2 0.0 0.7 0.5 0.0 7.2 4.2 1.7 0.0
Difference - - 0.2 (0.5) (0.3) 0.7 (0.4) 0.3 (0.6) - - (0.4) (0.4) (0.5)
Table 4-15B - Displacement of Test Apparatus During Vertical Racking Tests at ULS
Top Beam Middle of Columns Bottom Beam
Deflection (mm) ∆T1x ∆T1y ∆T3y ∆T5y ∆T3'y ∆T1'x ∆T1'y ∆M1x ∆M1'x ∆B1x ∆B3y ∆B5y ∆B3'y ∆B1'x
Observed 2.0 14.9 11.2 8.0 3.6 1.8 0.5 1.4 0.8 0.8 10.2 6.4 3.0 0.2 Predicted 1.9 14.9 11.5 7.3 3.3 1.9 0.2 1.0 0.8 0.0 11.2 6.8 2.9 -0.2 Difference - - 0.3 (0.7) (0.3) - (0.3) (0.4) - (0.8) 1.0 0.4 - (0.4)
Notes: - Tables 4-15A and B are associated with Figure 4-19 - Differences ≤0.1 are not included, * is an error in recorded data, bold values represent noteworthy results and values in brackets represents a predicted deflection that is lower than the observed deflection.
119
4.4.2 PERFORMANCE OF SPECIMEN
Table 4-16 compares the predicted and observed wall movement during the vertical
racking test at SLS, where the variables are shown in Figure 4-15. Table 4-17 compares
the predicted and observed change in gaps during the vertical racking test at SLS, where
positive values represent an increase in gap. The predicted movement of the upper left
corner of the infill wall is 9.5mm upwards. At the bottom right corner, the wall displaces
downwards 0.9mm, rotating around the closest shim, so that the gap at the bottom of the
wall decreases 1.1mm while the gap at the top of the wall increases 1.1mm. The shims
preserved the gap between the bottom of the wall and the lower beam so that as the beam
rotates, the wall rotates with it, causing a lateral displacement of 5.5mm at the top of the
wall. The largest change in gap, 4.5mm, therefore occurs at the top corners. Throughout
the test the infill wall is predicted to stay square. Overall, the observed rotation of the
infill wall is very slight and the observed gaps do not significantly change. This implies
that the wall is moving with the concrete frame, not independently at the top of the wall
as predicted. It is likely that any gap changes have been restrained by the insulation foam.
The observed corner displacements show that the wall is deforming slightly (i.e., the wall
is no longer square) and that the increase in the diagonal length which was not measured
experimentally should be approximately 3.4mm.
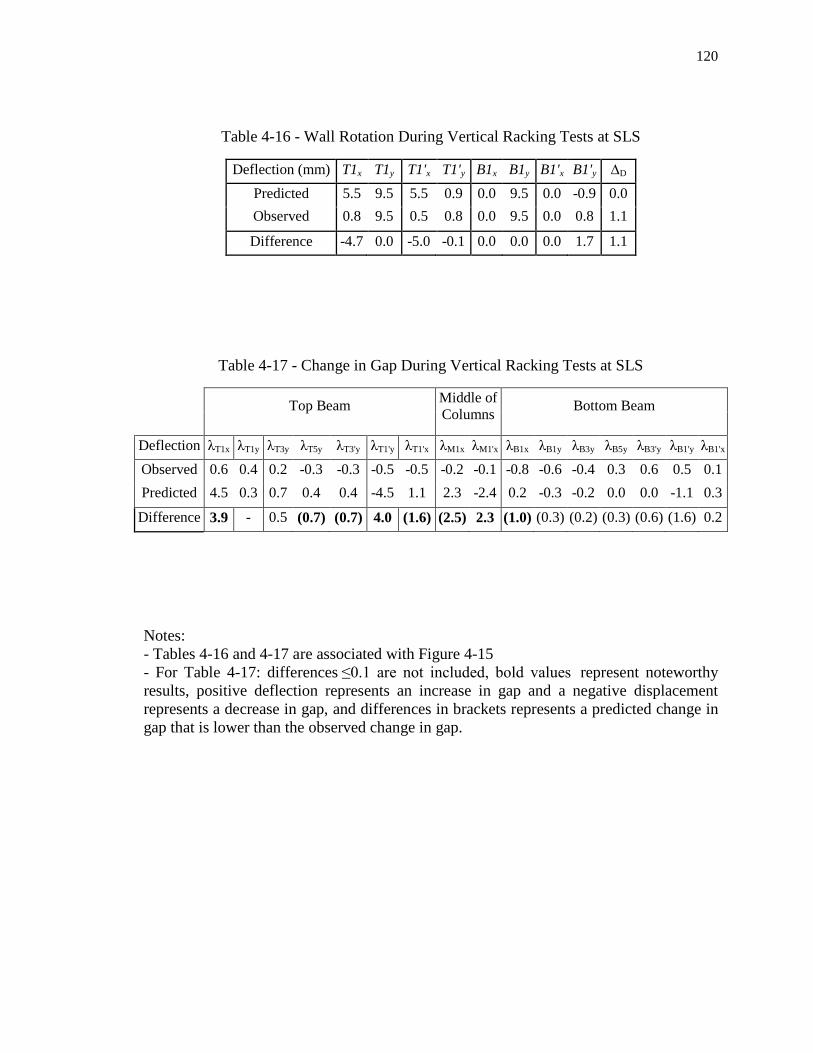
120
Table 4-16 - Wall Rotation During Vertical Racking Tests at SLS
Deflection (mm) T1x T1y T1'x T1'y B1x B1y B1'x B1'y ∆D Predicted 5.5 9.5 5.5 0.9 0.0 9.5 0.0 -0.9 0.0 Observed 0.8 9.5 0.5 0.8 0.0 9.5 0.0 0.8 1.1 Difference -4.7 0.0 -5.0 -0.1 0.0 0.0 0.0 1.7 1.1
Table 4-17 - Change in Gap During Vertical Racking Tests at SLS
Top Beam Middle of Columns Bottom Beam
Deflection λT1x λT1y λT3y λT5y λT3'y λT1'y λT1'x λM1x λM1'x λB1x λB1y λB3y λB5y λB3'y λB1'y λB1'x Observed 0.6 0.4 0.2 -0.3 -0.3 -0.5 -0.5 -0.2 -0.1 -0.8 -0.6 -0.4 0.3 0.6 0.5 0.1 Predicted 4.5 0.3 0.7 0.4 0.4 -4.5 1.1 2.3 -2.4 0.2 -0.3 -0.2 0.0 0.0 -1.1 0.3
Difference 3.9 - 0.5 (0.7) (0.7) 4.0 (1.6) (2.5) 2.3 (1.0) (0.3) (0.2) (0.3) (0.6) (1.6) 0.2
Notes: - Tables 4-16 and 4-17 are associated with Figure 4-15 - For Table 4-17: differences ≤0.1 are not included, bold values represent noteworthy results, positive deflection represents an increase in gap and a negative displacement represents a decrease in gap, and differences in brackets represents a predicted change in gap that is lower than the observed change in gap.
121
4.5 OUT-OF-PLANE TEST 2 AND 3
4.5.1 EFFECT OF VERTICAL RACKING TEST
The effect of the vertical racking test is assessed by comparing Out-of-plane Test 1.3 and
Test 2, as shown in Table 4-18, where a positive difference indicates an increase in
deflection after the vertical racking test. The vertical racking has caused a reduction in
stiffness near the top middle of the connection at T5, midspan of the wall at W4 and W5,
and near the bottom connections B3, B4 and B5, especially under negative pressure.
Overall these are very minor changes in displacement which shows that the vertical
racking test at SLS had very little effect on wall specimen.
4.5.2 EFFECT OF LATERAL SWAY TEST
The effect of the lateral sway test is assessed by comparing Out-of-plane Test 2 and Test
3, as shown in Table 4-19, where a positive difference indicates an increase in deflection
after the lateral sway test. There was a consistent reduction in stiffness under both
positive and negative pressures at the top connection. This change is to be expected,
however, as there was movement of the infill wall during the lateral test at the top of the
wall which may have potentially weaken the restraint created by the insulation in the top
gap. Similarly, the reduction in stiffness at midspan of the infill is likely due to the
deformations experienced by the infill which caused the connections throughout the wall
loosen slightly. Overall, the effects of the lateral racking test at SLS were fairly small, but
may be cumulative if the lateral sway is due to repeated loading.
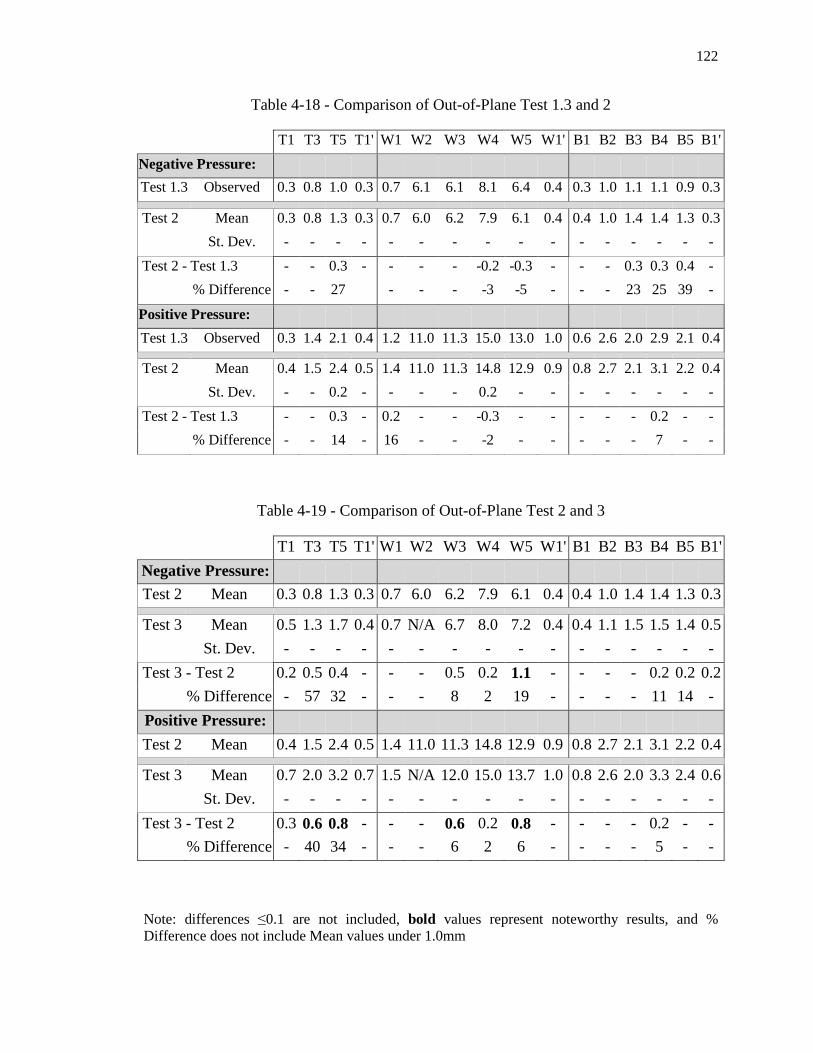
122
Table 4-18 - Comparison of Out-of-Plane Test 1.3 and 2
T1 T3 T5 T1' W1 W2 W3 W4 W5 W1' B1 B2 B3 B4 B5 B1'
Negative Pressure:
Test 1.3 Observed 0.3 0.8 1.0 0.3 0.7 6.1 6.1 8.1 6.4 0.4 0.3 1.0 1.1 1.1 0.9 0.3
Test 2 Mean 0.3 0.8 1.3 0.3 0.7 6.0 6.2 7.9 6.1 0.4 0.4 1.0 1.4 1.4 1.3 0.3
St. Dev. - - - - - - - - - - - - - - - -
Test 2 - Test 1.3 - - 0.3 - - - - -0.2 -0.3 - - - 0.3 0.3 0.4 -
% Difference - - 27
- - - -3 -5 - - - 23 25 39 -
Positive Pressure:
Test 1.3 Observed 0.3 1.4 2.1 0.4 1.2 11.0 11.3 15.0 13.0 1.0 0.6 2.6 2.0 2.9 2.1 0.4
Test 2 Mean 0.4 1.5 2.4 0.5 1.4 11.0 11.3 14.8 12.9 0.9 0.8 2.7 2.1 3.1 2.2 0.4
St. Dev. - - 0.2 - - - - 0.2 - - - - - - - -
Test 2 - Test 1.3 - - 0.3 - 0.2 - - -0.3 - - - - - 0.2 - -
% Difference - - 14 - 16 - - -2 - - - - - 7 - -
Table 4-19 - Comparison of Out-of-Plane Test 2 and 3
T1 T3 T5 T1' W1 W2 W3 W4 W5 W1' B1 B2 B3 B4 B5 B1'
Negative Pressure:
Test 2 Mean 0.3 0.8 1.3 0.3 0.7 6.0 6.2 7.9 6.1 0.4 0.4 1.0 1.4 1.4 1.3 0.3
Test 3 Mean 0.5 1.3 1.7 0.4 0.7 N/A 6.7 8.0 7.2 0.4 0.4 1.1 1.5 1.5 1.4 0.5
St. Dev. - - - - - - - - - - - - - - - -
Test 3 - Test 2 0.2 0.5 0.4 - - - 0.5 0.2 1.1 - - - - 0.2 0.2 0.2
% Difference - 57 32 - - - 8 2 19 - - - - 11 14 -
Positive Pressure:
Test 2 Mean 0.4 1.5 2.4 0.5 1.4 11.0 11.3 14.8 12.9 0.9 0.8 2.7 2.1 3.1 2.2 0.4
Test 3 Mean 0.7 2.0 3.2 0.7 1.5 N/A 12.0 15.0 13.7 1.0 0.8 2.6 2.0 3.3 2.4 0.6
St. Dev. - - - - - - - - - - - - - - - -
Test 3 - Test 2 0.3 0.6 0.8 - - - 0.6 0.2 0.8 - - - - 0.2 - -
% Difference - 40 34 - - - 6 2 6 - - - - 5 - -
Note: differences ≤0.1 are not included, bold values represent noteworthy results, and % Difference does not include Mean values under 1.0mm
123
4.6 SUMMARY AND CONCLUSIONS
The 2.4m x 4.8m (8 ft. x 16 ft.) infill wall specimen was subjected to an initial out-of-
plane pressure test at SLS, followed by lateral sway and vertical racking tests at both SLS
and ULS. Between these racking tests, the out-of-plane pressure test at SLS was repeated
to investigate the effect of the in-plane tests on the infill wall specimen. Conclusions
associated with each test will be presented separately.
4.6.1 OUT-OF-PLANE PRESSURE TEST 1
A pressurized airbag, using a method similar to ASTM E330-02 Standard Test Window
Structural Performance by Static Pressure (ASTM, 2010), was used to apply realistic out-
of-plane pressures at SLS. The following conclusions can be made concerning the
procedure and results:
1. A pre-pressure phase must be included in the pressure trace for large airbags to
create an initial state of constant pressure, i.e., 0.2 kPa for this specific airbag,
before loading to the test pressures begins. This enables a more accurate response
from the PLAs before the pressure is increased. Increasing the number of PLAs
from 2 to 12 also helped increase the accuracy of the overall response.
2. The overall midspan deflections of the infill wall exceeded the SLS limit of
HDT/360. These deflections were slightly less than the predicted results for a bare
stud, likely due to the variability in the Young's Modulus values and the
contribution of the sheathing.
3. The observed out-of-plane deflections around edges of the wall were much
smaller than predicted, likely due to restraint from the expansion foam. This is
124
especially apparent along the edges at midspan of the wall where the deflections
were predicted to be in the order of 10-15mm. The maximum out-of-plane
deflection that occurred along the edge of the wall was no more than 1mm at the
top and bottom and 2mm at midspan.
4. The overall repeatability for the results within Tests 1.1, 1.2 and 1.3 was good,
except for Test 1.3 under positive pressure which showed a slight reduction in the
stiffness of the wall.
5. The concrete frame performed well with little out-of-plane movement at the
corner connection points of the concrete frame. Slightly larger deflections did
occur at midspan of the beams due to the ‘modified’ support.
4.6.2 LATERAL SWAY TEST
A lateral load was applied to the concrete frame to create a sway displacement between
the top and bottom beams that was within the pre-established critical range for SLS and
ULS. The following conclusions can be concerning from the procedure and results:
1. The predicted response of the test apparatus at SLS was fairly closely the
observed response, with the predicted loads being within 3 to 13% of the observed
loads. The predicted response of the test apparatus at ULS was also fairly close to
the observed response, with the predicted load being within 9% of the observed.
2. The predicted response of the steel frame for the push and pull test at SLS was
very close, within 3%, to the observed results when considering the differential
height, H'. There was larger variability when considering the full height, H, due to
the minor displacements, between 0.7-0.9mm, that occurred at the bottom
125
connection. The predict applied load for the pull test at ULS was predicted within
6% for both height H and H', however, the observed stiffness was larger than
predicted.
3. The predicted deformed shape of the concrete frame is within 1.7mm of the
observed shape for all observed tests, including deflections at ULS, which is
deemed to be adequate.
4. It was predicted that there would be no in-plane movement of the infill wall as an
adequate gap had been provided between the wall and the concrete frame. The
observed results, however, show that the infill wall moved up to 4.5mm laterally,
causing the wall to deform diagonally by +3.2mm and -4.5mm for the push and
pull test, respectively, at SLS. This is consistent with the changes observed during
the push tests, where the maximum predicted gap change was 7.8mm and the
maximum observed gap change is 2.3mm. This indicates that there is in-plane
load transfer through the insulation foam, even for gaps as large as 32mm, which
is not accounted for in the current predictions.
4.6.3 VERTICAL RACKING TEST
A vertical load was applied to the concrete frame to create a racking displacement
between the left and right columns within the pre-established critical range for SLS and
ULS. The following conclusions can be concerning from the procedure and results:
1. The predicted stiffnesses of the test apparatus at SLS and ULS are reasonably
close to the observed stiffnesses. The predicted loads, however, are 18% and 14%
less than the observed loads at SLS and ULS, respectively. This may be due to
126
pretensioning of the concrete frame before testing which created a larger observed
load.
2. The observed response of the steel frame was not accurately predicted, within
40%, as there was an initial non-linear response that was not accounted for in the
model.
3. The racking displacement of the concrete frame at ULS was predicted to be
7.6mm to stay within the target deflection range of 7-8mm. The observed results
are within 0.6mm of the predicted results.
4. The observed displacement of the infill wall was not as predicted. The observed
maximum gap change was 0.8mm, whereas the maximum predicted change in
gap was up to 4.5mm. This is again attributed to restraint provided by the
insulation foam.
4.6.4 OUT-OF-PLANE PRESSURE TESTS 2 AND 3
Out-of-plane pressure tests were performed after the lateral sway test at SLS and vertical
racking test at SLS. These responses were compared to Out-of-plane Pressure Test 1 to
determine if the sway or racking deflections had any effects on the infill wall specimen.
The following conclusions can be made:
1. Out-of-plane Pressure Test 2 and 3 were almost completely repeatable.
2. There was generally no effect on the infill wall specimen from the vertical racking
test at SLS.
3. There was minor reduction in stiffness at the top connection and a midspan of the
wall due to the lateral sway test at SLS.
127
5
5.1 SUMMARY
SUMMARY AND CONCLUSIONS
The focus of this study was to improve the use of wood/concrete hybrid systems in mid-
to high-rise structures. There are a number of methods to do this, although some of these
niche areas have more potential than other. Current research has focused on using heavy
timber methods for these larger structures, however there is little literature that addresses
the use of light-frame timber. This study has therefore been carried out, by the support of
the NEWBuildS Network, to identify and pursue avenues that may enhance the use of
light-frame lumber in a mid- to high-rise market.
Chapter 2 reviewed spectrum of potential wood/concrete hybrid systems and identified
three niche areas that are potentially feasible for mid- to high-rise structures. The
potential maximum number of storeys of light-frame wood structures with wood/concrete
hybrid flooring was investigated, and the investigation was repeated for structures with
concrete lateral-load-resisting systems. The third niche area, wood infill walls in
reinforced concrete structures, was explored by considering whether such wall should be
load-bearing and identifying other factors that currently restrict their use in Canada.
Chapter 3 describes the basis of an experimental investigation of the structural aspects of
light-frame wood infill walls in reinforced concrete frame structures. Analysis of a
prototype reinforced concrete frame established the critical deflection ranges for lateral
sway and vertical racking displacements in a single storey at Serviceability and Ultimate
limit states. These in-plane racking limits were then adopted as design criteria for a full-
scale, reinforced concrete frame test apparatus. An out-of-plane pressure system, applied
128
pressures to the exposed wall surface that were consistent with the wind loads specified
in the NBCC (2010). Details of the 2.4m x 4.8m (8 ft. x 16 ft.) infill wall specimen are
presented, and the basis of the design of the top and bottom connections to the concrete
frame. These connections were intended to isolate the infill wall from the in-plane sway
and racking deflections but transfer horizontal reactions due to out-of-plane wind loading
from the wall to the frame.
Chapter 4 compares the experimental response of the test apparatus and wall specimen
with predicted responses from linear-elastic analytical modeling. This assessment of the
test specimen and test apparatus was performed for each of the following tests: Out-of-
plane Pressure at SLS, In-plane Lateral Sway at SLS and ULS and In-plane Vertical
Racking at SLS and ULS. Out-of-plane tests were also performed before and after each
in-plane test to investigate its effect on the response of the infill wall specimen.
5.2 CONCLUSIONS
The conclusions that concerning feasible niches of light-frame wood/concrete hybrid
construction (Chapter 2) are:
1. The use of light-frame wood structures with wood/concrete floor systems is
infeasible for structures with 7 or more storeys due to the limited axial capacity of
wood stud walls.
2. The use of light-frame wood structures with wood/concrete floor systems and a
concrete lateral-load-resisting system is potentially feasible for structures up to 9
storeys.
129
3. Light-frame wood infill walls in reinforced concrete structures are feasible in
mid- to high-rise structures if sufficient gap is provided around the perimeter of
the wall to ensure that the wall remains non-load-bearing and prevents material
incompatibility issues.
The conclusions concerning the design of a test apparatus to subject a wood infill wall to
realistic concrete frame racking deformations (Chapter 3) are:
1. The critical in-plane racking deformations of a typical 8-storey reinforced
concrete frame structure that must be accommodated by infill wall are:
- a lateral sway deflection due to wind loading, which is largest at the base of
the structure in an exterior frame with a maximum storey sway deflection
range of 7-8mm at SLS and 16-18mm at ULS and;
- a vertical racking deflection due to differential creep shortening, which is
largest at the top of the structure at an exterior frame with a maximum
storey racking deflection range of 7-8mm at SLS and 10-12mm at ULS.
2. The full-scale reinforced concrete frame test apparatus, which was designed to
achieve the specified lateral sway and vertical racking displacements, accurately
replicates the overall deformed shape of the critical frames.
3. Connections at the top and bottom of the wall were designed and implemented
that allow a fully sheathed pre-fabricated infill wall to be used.
The conclusions concerning the performance of the test apparatus and wall test
specimen (Chapter 4) are:

130
1. Due to the large (9.25m3) volume of the airbag, the out-of-plane pressure loading
system required 12 PLAs and a modified trace to generate positive and negative
pressures of +1.44 and -0.9kPa, corresponding to the SLS wind loads specified in
the NBCC (2010).
2. The wall specimen with 2x4 (38mm x 89mm) studs did not satisfy the SLS
deflection limit of L/360, but the top and bottom connections performed
adequately with out-of-plane deflections less than 2.5mm and 0.9mm,
respectively.
3. The predicted displacements for the edges of the infill wall were approximately
10 times larger than the observed values, likely due to the expansion foam acting
as a structural link between the wood infill wall and the concrete frame.
4. The concrete frame successfully withstood the out-of-plane pressures with almost
no displacements at the corners and minor displacements, less than 2mm, at the
middle supports.
5. The observed results for the deformed shape of the concrete frame during the
lateral sway and vertical racking tests were within 1.7mm and 0.6mm,
respectively, of the predicted results. The racking deformations in a typical sway
frame structure at SLS and ULS were therefore adequately simulated by the test
apparatus.
6. The predicted loads applied to the concrete frame during the lateral sway and
vertical racking tests were within 8% and 18%, respectively, of the observed
loads. This indicates that the linear-elastic analysis using SAP2000 (2009) was
reasonably accurate.
131
7. The observed response of the infill wall during the in-plane tests at SLS was not
well predicted. The observed change in gap was no more than 2.3mm, instead of
the maximum predicted change of 7.8mm, again likely due to load being
transferred from the concrete frame to the infill wall by the expansion foam.
8. The lateral in-plane test caused a minor reduction in out-of-plane stiffness of the
infill wall and the top connection, where as the vertical in-plane tests had almost
no effect.
Conclusions 3 and 7 pertain to the type of foam used (i.e. Great Stuff™) and may change
if a different product is applied.
5.3 SUGGESTIONS FOR FUTURE WORK
The following future work is recommended:
1. Further out-of-plane pressure tests should be performed under loading at ULS to
determine adequate performance, and mode of failure, of the infill wall and
connections.
2. The infill wall should be redesigned to satisfy SLS limits. This should include
using 2x6 (38mm x 140mm) lumber, instead of reducing the stud spacings the
deeper stud allows more insulation in the wall cavity and so provides additional
thermal benefits.
3. Repeat horizontal sway and vertical racking tests without an infill wall specimen
to quantify the in-plane stiffness contributions of the infill wall.
132
4. The LVDTs should be placed closer to the connection points to minimize lateral
measurements from the rotation of the wall.
5. During preparation for a vertical racking test, care should be taken when installing
the top wood blocking to avoid pretensioning of the test apparatus.
6. Initial tests at ULS showed that minor cracking may be occurring, which may
need to be accounted for in further predictions using an elastic-cracked analysis.
7. Repeated in-plane tests at SLS may cumulatively impact the out-of-plane stiffness
of the infill wall, although only minor stiffness reductions were observed in the
present study. Further tests should therefore include repetition of SLS in-plane
sway deformations.
133
ASTM (American Society for Testing and Material). (2010) "ASTM E330-02 Standard Test Method for Structural Performance of Exterior Windows, Doors, Skylights and Curtain Walls by Uniform Static Air Pressure Difference". Annual Book of ASTM Standards, Vol. 04.11.
REFERENCES
BCBC (British Columbia Building Code). (2009) “BC Building Code Provisions”. Victoria, British Columbia. BAPL (Boral Australian Plasterboard Limited). (2002) "Plasterboard Exterior Wall Systems - Commercial Construction, Issue 3". Technical Product Information. Accessible at: http://www.boral.com.au/brochures/ordering/html_version/extwall/extwall_1.htm.
Crocetti, R.; Sartori, T.; and Flansbjer, M. (2010) "Timber-Concrete Composite Structures with Prefabricated FRC Slab". Proceedings for the World Conference on Timber Engineering 2010. Trentino, Italy. CSSBI (Canadian Sheet Steel Building Institute). (1991). "Lightweight Steel Framing Design Manual". Willowdale, Ontario.
CAC (Cement Association of Canada). (1984) " Concrete Design Handbook, 2nd Edition, Part of National Standard of Canada CAN/CSA-A23.3-84 Design of Concrete Structures". Canadian Standards Association, Mississauga.
CFS (Concrete Fastening Systems). (2012) "Tapcon® Concrete Screws Technical Information". Cleveland, Ohio. Website: http://www.concretescrews.com/technical-info/tapcon-concretescrew.aspx
Chuan, D.; Fragiacomo, M.; Buchanan, A.; Crews, K.; Haskell, J.; and Deam, B. (2009) "Development of Semi-Prefabricated Timber-Concrete Composite Floors in Australasia". New Zealand Timber Engineering Design Journal. Vol. 17, Issue 1. Chui, Ying Hei. (2009) “NEWBuildS Proposal Plan - NSERC Strategic Network on Innovative Wood Products and Building Systems”. Draft Copy. Cheung, Kevin. (2000) "Multi-storey Wood-frame Construction." Western Wood Products Association, USA. Cheung, Kevin. (2008). "Multi-storey Timber and Mixed Timber-RC/Steel Construction in USA." Structural Engineering International. 18(2). Pg. 122-125. CISC (Canadian Institute of Steel Construction). (2006) "Steel-framed Commercial Building Design Notes". Willowdale, Ontario.
134
Clouston, P.; Bathon, L.; and Schreyer, A. (2005) "Shear and Bending Performance of a Novel Wood-concrete Composite System". Journal of Structural Engineering. Pg. 1404 – 1412. Clouston, Peggi and Schreyer, Alexander. (2008) "Design and use of Wood-Concrete Composites." Practice Periodical on Structural Design and Construction. ASCE. Pg. 167 – 174. CMHC (Central Mortgage and Housing Corporation). (1970) "Canadian Wood-Frame House Construction". Ottawa, Ontario. Cook, John. (1977) "Composite Construction Methods". John Wiley and Sons Inc. CSA (Canadian Standards Association). (2010a) "National Standard of Canada CAN/CSA-A23.3-09 (R2010) Design of Concrete Structures". Canadian Standards Association, Mississauga, Ontario.
CSA (Canadian Standards Association). (2010b) "National Standard of Canada CAN/CSA-S16-09, Update No. 2 (2010), Design of Steel Structures". Canadian Standards Association, Mississauga, Ontario.
CSA (Canadian Standards Association). (2010c) "National Standard of Canada CAN/CSA-086-09, Update No. 1 (2010), Engineering Design in Wood". Canadian Standards Association, Mississauga, Ontario.
CWC (Canadian Wood Council). (2010) “Wood Design Manual 2010”. Canadian Wood Council, Ottawa. Dolan, D. (2005) "Handbook of Structural Engineering, Second Edition: Chapter 10 – Timber Structures." Editors: Chen, W.; Lui, E. CRC Press. Florida, United States of America. Elliot, K. (2003) "Mixed Options for Precast Concrete Construction." Concrete. 37, pp. 18-23. Nottingham, United Kingdom. Enjily, Vahik. (2006) "The TF2000 Project and its Impact on Medium-rise Timber Frame Construction in UK". Time for Timber in Europe Conference. Gdansk, Poland Eriksson, Per-Erik. (2005) “Wood Components in Steel and Concrete Buildings – In-fill Exterior Wall Panels”. Nordic Industrial Fund Project 02077. EWC (European Wood China). (2010) “Strategies for Sustainable Construction: Building with wood in China.” Technical Literature. Accessible at: http://www.canadawood.cn/english/downloads/tech_lit.php
135
Fragiacomo, M.; Schänzlin, J. (2010) "The Effect of Moisture and Temperature Variations on Timber-Concrete Composite Beams." Proceedings for the World Conference on Timber Engineering. Trentino, Italy. Frangi, Andrea. (2011) 'Keynote Address'. Presentation at the Theme 2 (Hybrid Building Systems) Research Exchange. Ottawa, Ontario, Canada. Gagnon, S., and O’Connor, J. (2006) “Hybrid Building Systems Problem Analysis Background and Literature Review. " Project No. 4614, FPInnovations-Forintek Eastern Region, Quebec, Canada. Gagnon, S. March, (2007) “Hybrid Building Systems: Now Opportunities for the Wood Products Industry.” Forintek Canada Corporation - General Revenue Report Project No. 5318. FPInnovations-Forintek Eastern Region, Quebec, Canada. Grenier, Daniel. 2012. Personal Communication. London, Ontario, Canada. Gutkowski, R.; Balogh, J.; To, L. (2010) "Finite-Element Modeling of Short-Term Field Response of Composite Wood-Concrete Floors/Decks." Journal for Structural Engineering. Pg. 707-714. Hibbler, R. C. (2006) "Structural Analysis - Sixth Edition". New Jersey. Published by Pearson Prentice Hall. Holmes, Mike. (2006) “Make It Right – Inside Home Renovation with Canada’s Most Trusted Contractor.” Harper Collins. Isoda, H., Okada, H., Kawai, N., and Yamaguchi N. (2000) “Research and development programs on timber structures in Japan.” Proceedings on World Conference of Timber Engineering 2000. pp. 8.4.1-1—8.4.1-7. Whistler, Canada. Johal, S. (2009) "History and Use of Midrise Buildings in Other Jurisdictions". Wood WORKS! Project. Technical Advisor. Keenan, F. J. (1986) “Limit States Design of Wood Structures - First Edition". Morrison Hershfield Limited. Kopp, G.A., Bartlett, F.M., Galsworthy, J., Henderson, D., Hong, H.P., Inculet, D.R., Savory, E., St. Pierre, L.M., & Surrey, D. (2006) "The Three Little Pigs full-scale Testing Facility". Proc. 1st CSCE Specialty Conference on Disaster Mitigation, Calgary, AB, 8-page paper on CD-ROM.
Krisciunas, R. (2010) “Wood‐Concrete Composite Deck Questions UWO”. Personal Communication. Kuhlmann, U.; and Schänzlin, J. (2008) "A Timber-Concrete Composite Slab System for use in Tall Buildings." Structural Engineering International. 18(2). Pg. 174-178.
136
Lukaszewska, E.; Johnsson, H.; and Fragiacomo, M. (2008) "Performance of Connections for Prefabricated Timber-concrete Composite Floors." Material and Structures. Vol. 41, pg. 1533-1550. Lukaszewska, E.; Fragiacomo, M.; and Johnsson, H. (2010) "Laboratory Tests and Numerical Analyses of Prefabricated Timber-Concrete Composite Floors." Journal of Structural Engineering. Pg. 46 – 55. MacGregor, J., Bartlett, F.M. (2000) "Reinforced Concrete: Mechanics and Design - First Edition." Pearson. Toronto, Ontario, Canada. Mehaffey, Jim R. (2010) "Exterior Infill Walls Fire Safety Requirements in Canada". Personal Communication.
Nagy, S., Bartlett, F.M., (2008) "Simulated Wind Load Tests of Large FRP/Foam Sandwich Panels". Proceedings for the CSCE 2008 Annual Conference. Quebec City, Quebec.
NBCC (National Building Code of Canada). (2010) "National Building Code of Canada 2010". National Research Council of Canada. NSPRC (National Standard of the Peoples Republic of China). (2004) “Technical Code for Partitions with Timber Framework.” Standard Classification: GBT 50361-2005.
Piazza, Maurizio, Ballerini, Marco. (2000) “Experimental and Numerical Results on Timber-concrete Composite Floors with Different Connection Systems”. Proceedings on World Conference of Timber Engineering 2000. Whistler, Canada. Rautenstrauch, K.; Mueller, J.; and Simon, A. (2010) "The First Timber-Concrete Composite Road Bridge in Germany." Proceedings for the World Conference on Timber Engineering 2010. Trentino, Italy. Sakamoto, I.; Kawai, N.; Okada, H. and Isoda, H. (2002) "A Report of a Research and Development project on Timber-based Hybrid Building Structures". Proceedings for the World Conference on Timber Engineering 2002. Shah Alam, Malaysia. Sakamoto, Isao. (2004) “Final Report of a Research and Development Project on Timber-based Hybrid Building Structures”. Proceedings for the World Conference on Timber Engineering 2004. Lahti, Finland.
Sakamoto, I.; Kawai, N.; Okada, H.; Yanaguchi, N.; Isoda, H, and Yusa, S. (2004) "Final Report of a Research and Development Project on Timber‐based Hybrid Building Structures". Proceedings for the World Conference on Timber Engineering 2004. Lahti, Finland. SAP (Structural Analysis Program) (2009) "SAP 2000 Version 12 – Structural Analysis Program". Computers and Structures Inc. Berkeley, California.
137
Shackelford, Randy and Pryor, Steve. (2007) "Design Solutions for Wood-Frame Multi-Storey Buildings – Resisting Uplift and Lateral Forces". Construction Specifier Magazine. Simpson Strong-Tie. Smith, Ian; and Frangi, Andrea. (2008a) "Tall Timber Buildings: Introduction." Structural Engineering International. 18(2). Pg. 114. Smith, Ian; and Frangi, Andrea. (2008b) "Overview of Design Issues for Tall Timber Buildings." Structural Engineering International. 18(2). Pg. 141-147. Stead, M. and Bartlett, F. M. (2010) "Comparison of Sway Moment Magnifiers for Plane Concrete Frames Using CSA Standard A23.3". Masters in Engineering Project Course Submission (ES 9500).
Surprenant, D. (2010) "The National Building Code of Canada: A Tool for Recovery in the Forest Industry?". Industry, Infrastructure and Resources Division. Parliamentary Information and Research Service. Background Paper. Library of Parliament. Publication No. 2010-27-E. van de Lindt, J.; Pei, S.; Pryor, S.; Shimizu, H. and Isoda, H. (2010) "Experimental Seismic Response of a Full-Scale Six-Storey Light-frame Wood Building." Journal of Structural Engineering, Vol. 136 Pg. 1262-1273. Wallace, D.; Cheung, K.; and Williamson, T. (1998). "Multi-Storey Wood Frame Construction in the United States." New Zealand Timber Design Journal. Vol. 7, Pg.11-23. Wang, Jieying. (2008). “Non-Load-Bearing Wood-Framed Exterior Wall in Concrete, Steel and Masonry Structures”. FPInnovations Forintek Presentation.
Wang, Jieying. (2011) Personal Communication.
Yeoh, D.; Fragiacomo, M.; Buchanan, A.; Deam, B. (2010) "Experimental Performance of LVL-Concrete Composite Floor Beams." Proceedings for the World Conference on Timber Engineering 2010. Trentino, Italy. Zhou, Lina. (2009) “Structural Response of Mid-rise Hybrid Building System Consisting of a Light Wood Frame Structure and Concrete Core – Thesis Proposal.” University of New Brunswick.

138
APPENDIX A FEASIBILITY STUDY RESULTS FOR CASES 2, 4-7
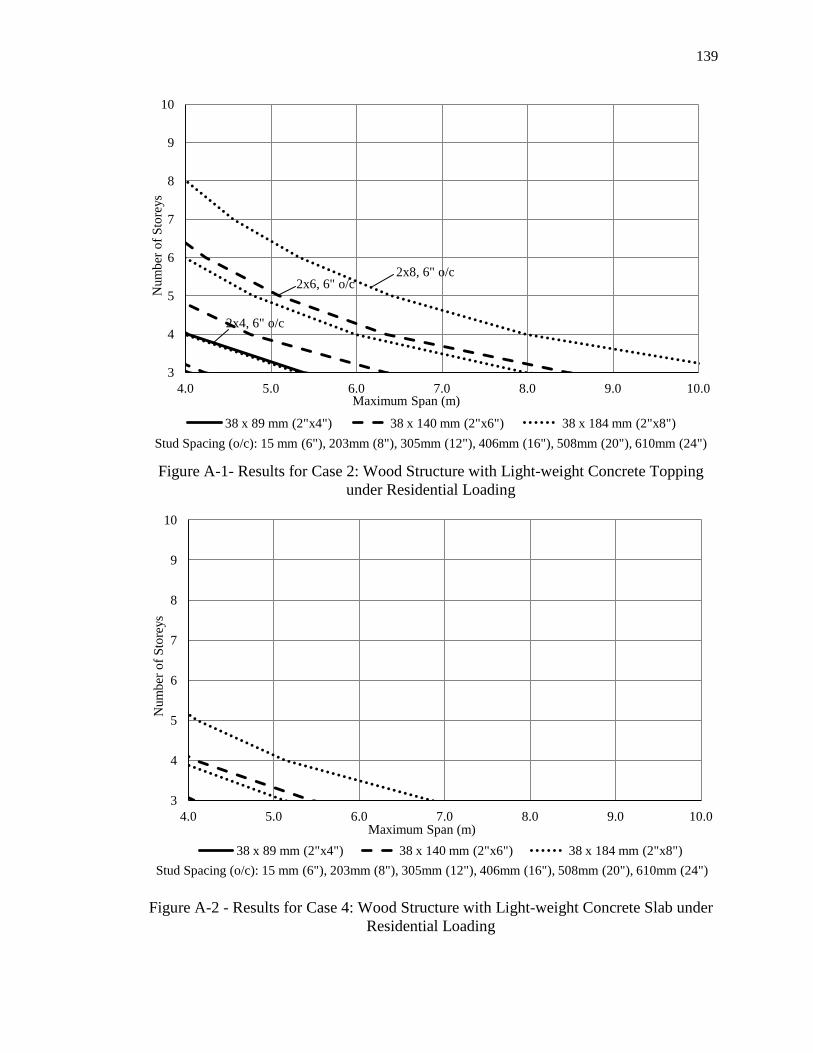
139
Figure A-1- Results for Case 2: Wood Structure with Light-weight Concrete Topping
under Residential Loading
Figure A-2 - Results for Case 4: Wood Structure with Light-weight Concrete Slab under Residential Loading
3
4
5
6
7
8
9
10
4.0 5.0 6.0 7.0 8.0 9.0 10.0
Num
ber o
f Sto
reys
Maximum Span (m)
38 x 89 mm (2"x4") 38 x 140 mm (2"x6") 38 x 184 mm (2"x8") Stud Spacing (o/c): 15 mm (6"), 203mm (8"), 305mm (12"), 406mm (16"), 508mm (20"), 610mm (24")
3
4
5
6
7
8
9
10
4.0 5.0 6.0 7.0 8.0 9.0 10.0
Num
ber o
f Sto
reys
Maximum Span (m) 38 x 89 mm (2"x4") 38 x 140 mm (2"x6") 38 x 184 mm (2"x8")
Stud Spacing (o/c): 15 mm (6"), 203mm (8"), 305mm (12"), 406mm (16"), 508mm (20"), 610mm (24")
2x8, 6" o/c 2x6, 6" o/c
2x4, 6" o/c
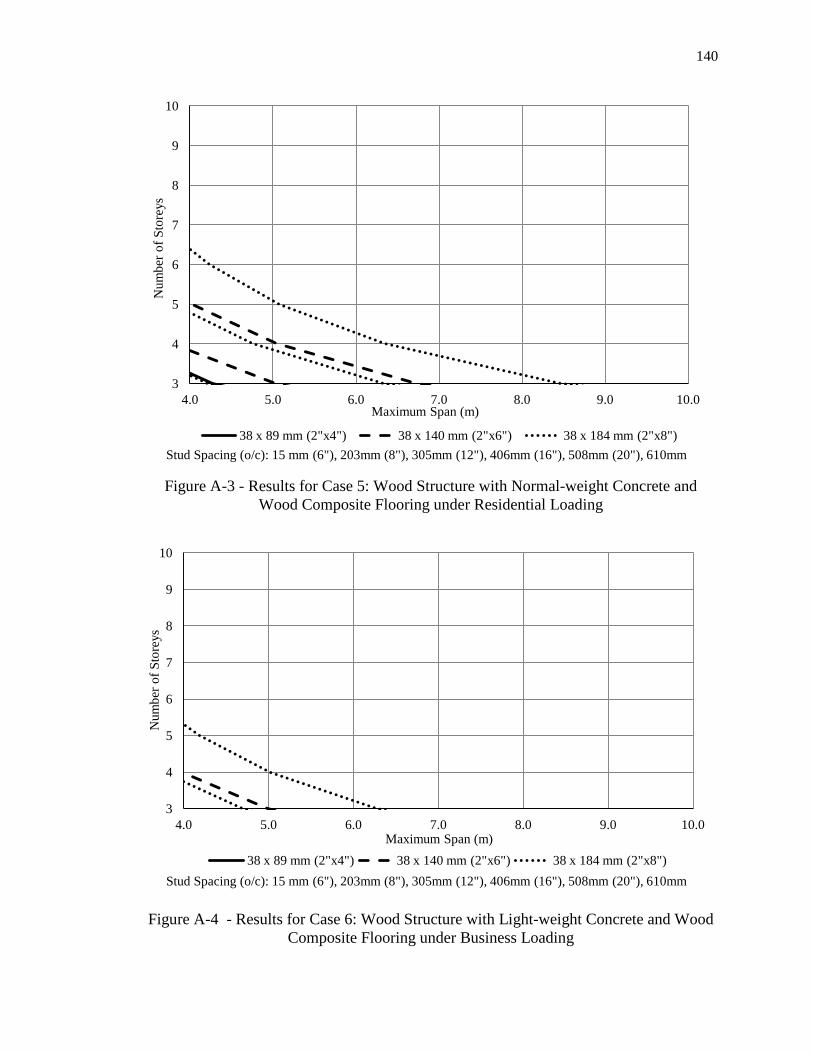
140
Figure A-3 - Results for Case 5: Wood Structure with Normal-weight Concrete and Wood Composite Flooring under Residential Loading
Figure A-4 - Results for Case 6: Wood Structure with Light-weight Concrete and Wood Composite Flooring under Business Loading
3
4
5
6
7
8
9
10
4.0 5.0 6.0 7.0 8.0 9.0 10.0
Num
ber o
f Sto
reys
Maximum Span (m)
38 x 89 mm (2"x4") 38 x 140 mm (2"x6") 38 x 184 mm (2"x8") Stud Spacing (o/c): 15 mm (6"), 203mm (8"), 305mm (12"), 406mm (16"), 508mm (20"), 610mm
3
4
5
6
7
8
9
10
4.0 5.0 6.0 7.0 8.0 9.0 10.0
Num
ber o
f Sto
reys
Maximum Span (m) 38 x 89 mm (2"x4") 38 x 140 mm (2"x6") 38 x 184 mm (2"x8")
Stud Spacing (o/c): 15 mm (6"), 203mm (8"), 305mm (12"), 406mm (16"), 508mm (20"), 610mm
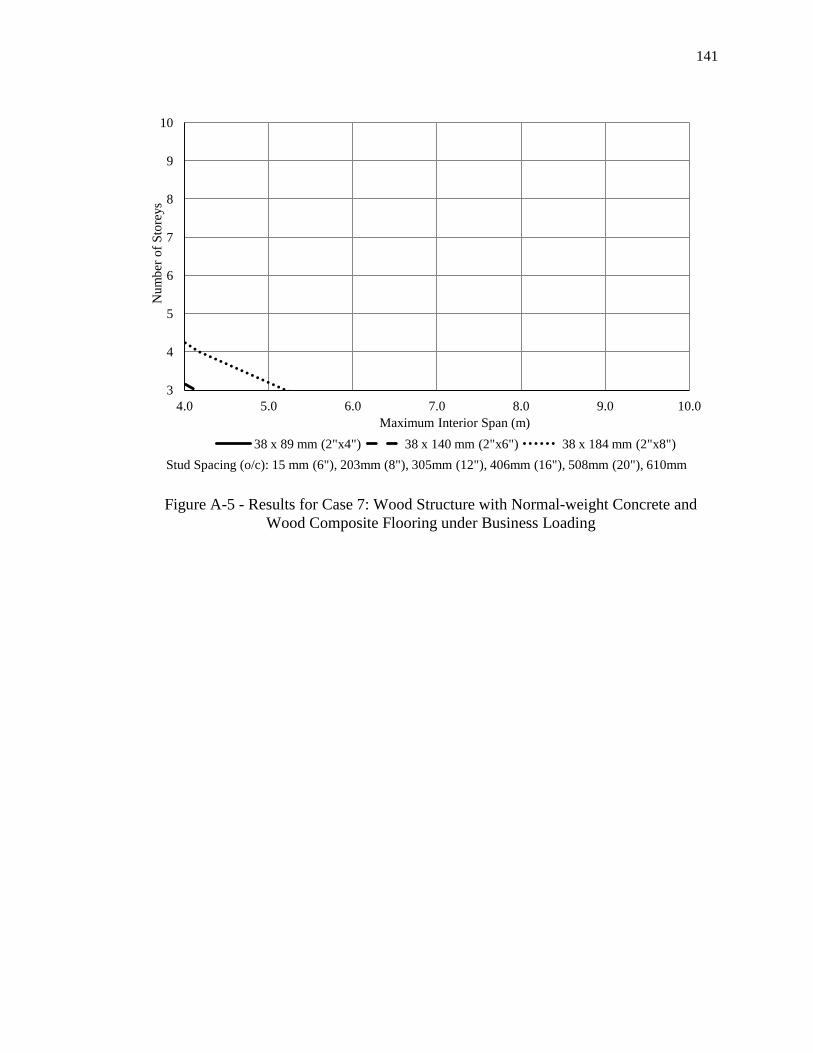
141
Figure A-5 - Results for Case 7: Wood Structure with Normal-weight Concrete and Wood Composite Flooring under Business Loading
3
4
5
6
7
8
9
10
4.0 5.0 6.0 7.0 8.0 9.0 10.0
Num
ber o
f Sto
reys
Maximum Interior Span (m) 38 x 89 mm (2"x4") 38 x 140 mm (2"x6") 38 x 184 mm (2"x8")
Stud Spacing (o/c): 15 mm (6"), 203mm (8"), 305mm (12"), 406mm (16"), 508mm (20"), 610mm
142
APPENDIX B WIND LOADING
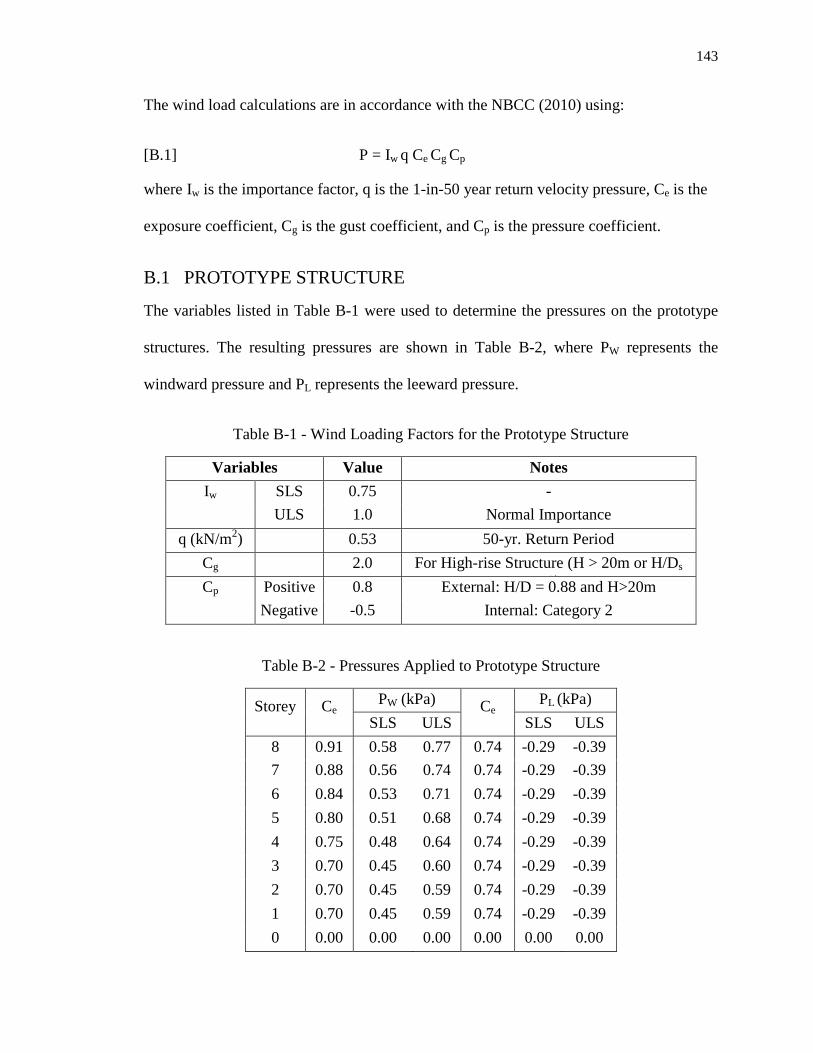
143
The wind load calculations are in accordance with the NBCC (2010) using:
[B.1] P = Iw q Ce Cg Cp
where Iw is the importance factor, q is the 1-in-50 year return velocity pressure, Ce is the
exposure coefficient, Cg is the gust coefficient, and Cp is the pressure coefficient.
B.1 PROTOTYPE STRUCTURE
The variables listed in Table B-1 were used to determine the pressures on the prototype
structures. The resulting pressures are shown in Table B-2, where PW represents the
windward pressure and PL represents the leeward pressure.
Table B-1 - Wind Loading Factors for the Prototype Structure
Variables
Value Notes Iw SLS 0.75 -
ULS 1.0 Normal Importance
q (kN/m2)
0.53 50-yr. Return Period Cg
2.0 For High-rise Structure (H > 20m or H/Ds 1) Cp Positive 0.8 External: H/D = 0.88 and H>20m
Negative -0.5 Internal: Category 2
Table B-2 - Pressures Applied to Prototype Structure
Storey Ce PW (kPa) Ce PL (kPa) SLS ULS SLS ULS
8 0.91 0.58 0.77 0.74 -0.29 -0.39 7 0.88 0.56 0.74 0.74 -0.29 -0.39 6 0.84 0.53 0.71 0.74 -0.29 -0.39 5 0.80 0.51 0.68 0.74 -0.29 -0.39 4 0.75 0.48 0.64 0.74 -0.29 -0.39 3 0.70 0.45 0.60 0.74 -0.29 -0.39 2 0.70 0.45 0.59 0.74 -0.29 -0.39 1 0.70 0.45 0.59 0.74 -0.29 -0.39 0 0.00 0.00 0.00 0.00 0.00 0.00
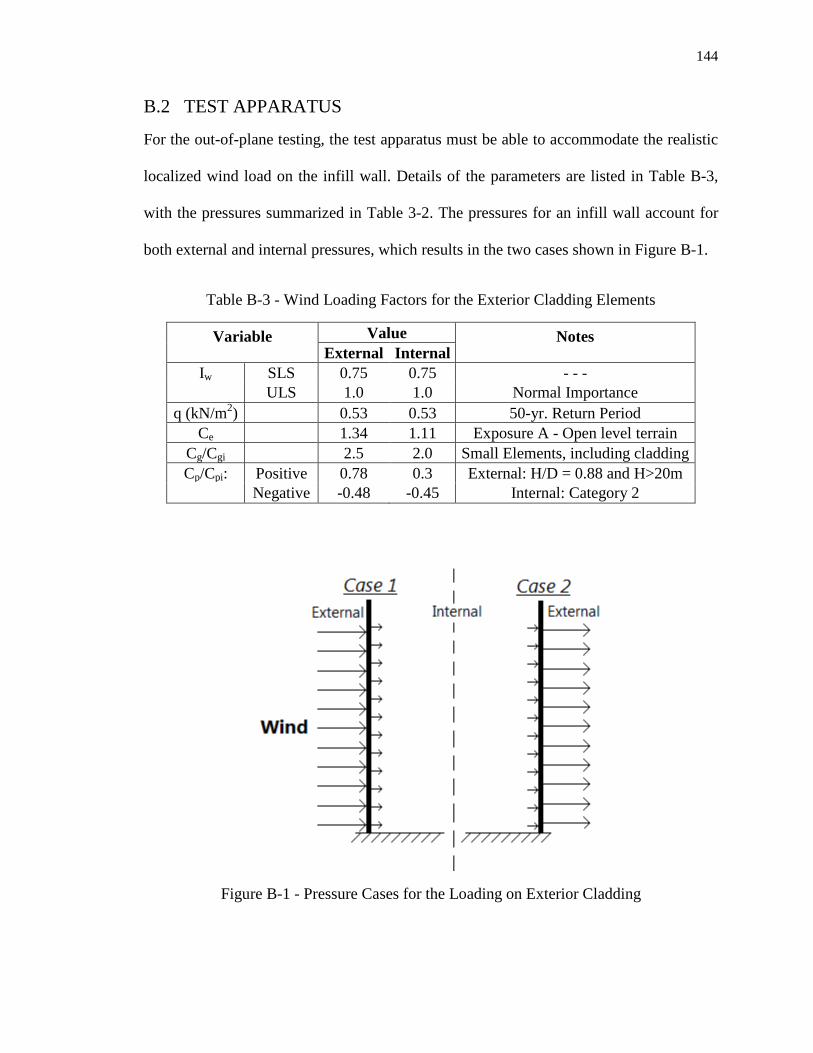
144
B.2 TEST APPARATUS
For the out-of-plane testing, the test apparatus must be able to accommodate the realistic
localized wind load on the infill wall. Details of the parameters are listed in Table B-3,
with the pressures summarized in Table 3-2. The pressures for an infill wall account for
both external and internal pressures, which results in the two cases shown in Figure B-1.
Table B-3 - Wind Loading Factors for the Exterior Cladding Elements
Variable Value Notes External Internal
Iw SLS 0.75 0.75 - - -
ULS 1.0 1.0 Normal Importance q (kN/m2) 0.53 0.53 50-yr. Return Period
Ce 1.34 1.11 Exposure A - Open level terrain Cg/Cgi 2.5 2.0 Small Elements, including cladding Cp/Cpi: Positive 0.78 0.3 External: H/D = 0.88 and H>20m
Negative -0.48 -0.45 Internal: Category 2
Figure B-1 - Pressure Cases for the Loading on Exterior Cladding

145
APPENDIX C VERTICAL CREEP CALCULATIONS
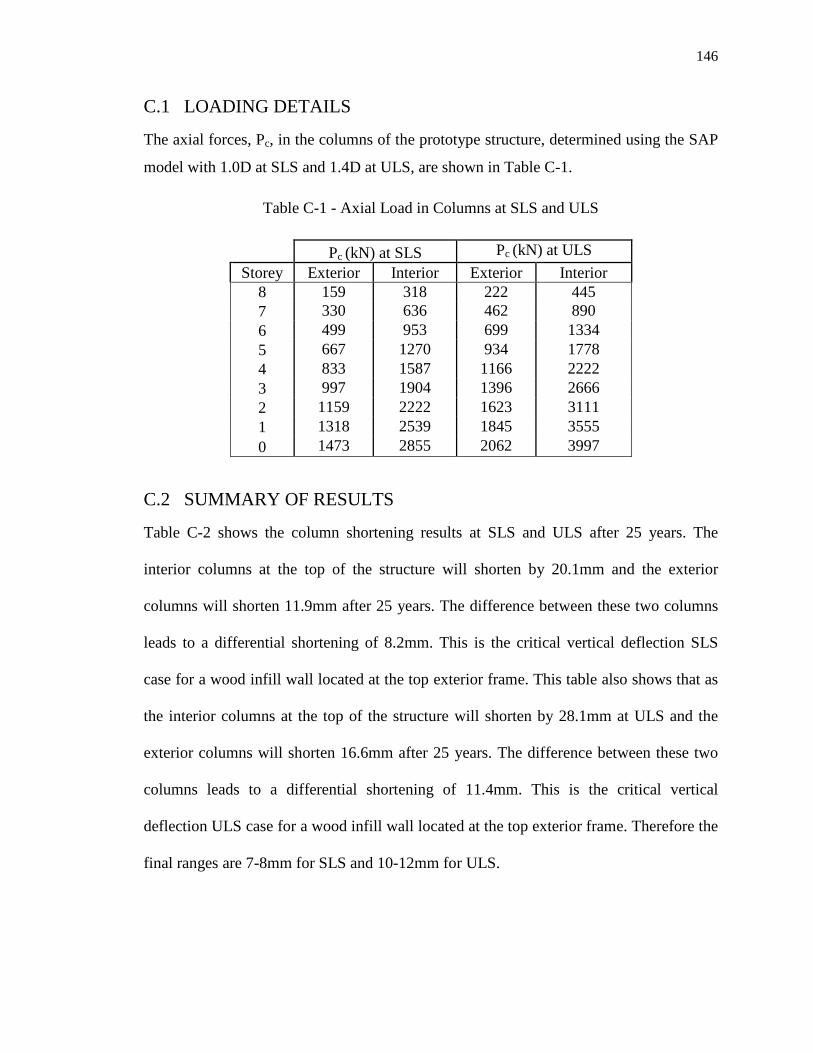
146
C.1 LOADING DETAILS
The axial forces, Pc, in the columns of the prototype structure, determined using the SAP
model with 1.0D at SLS and 1.4D at ULS, are shown in Table C-1.
Table C-1 - Axial Load in Columns at SLS and ULS
Pc (kN) at SLS Pc (kN) at ULS
Storey Exterior Interior Exterior Interior 8 159 318 222 445 7 330 636 462 890 6 499 953 699 1334 5 667 1270 934 1778 4 833 1587 1166 2222 3 997 1904 1396 2666 2 1159 2222 1623 3111 1 1318 2539 1845 3555 0 1473 2855 2062 3997
C.2 SUMMARY OF RESULTS
Table C-2 shows the column shortening results at SLS and ULS after 25 years. The
interior columns at the top of the structure will shorten by 20.1mm and the exterior
columns will shorten 11.9mm after 25 years. The difference between these two columns
leads to a differential shortening of 8.2mm. This is the critical vertical deflection SLS
case for a wood infill wall located at the top exterior frame. This table also shows that as
the interior columns at the top of the structure will shorten by 28.1mm at ULS and the
exterior columns will shorten 16.6mm after 25 years. The difference between these two
columns leads to a differential shortening of 11.4mm. This is the critical vertical
deflection ULS case for a wood infill wall located at the top exterior frame. Therefore the
final ranges are 7-8mm for SLS and 10-12mm for ULS.
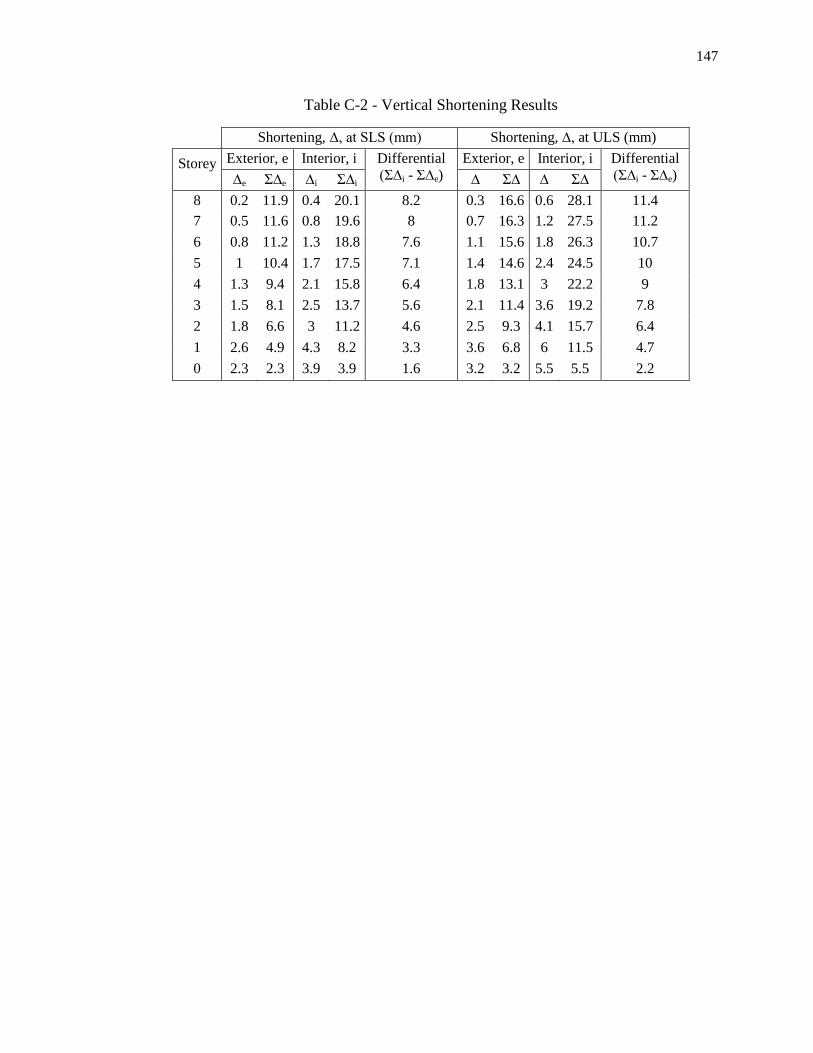
147
Table C-2 - Vertical Shortening Results
Shortening, ∆, at SLS (mm) Shortening, ∆, at ULS (mm)
Storey Exterior, e Interior, i Differential (Σ∆i - Σ∆e)
Exterior, e Interior, i
Differential (Σ∆i - Σ∆e) ∆e Σ∆e ∆i Σ∆i ∆ Σ∆ ∆ Σ∆
8 0.2 11.9 0.4 20.1 8.2 0.3 16.6 0.6 28.1 11.4 7 0.5 11.6 0.8 19.6 8 0.7 16.3 1.2 27.5 11.2 6 0.8 11.2 1.3 18.8 7.6 1.1 15.6 1.8 26.3 10.7 5 1 10.4 1.7 17.5 7.1 1.4 14.6 2.4 24.5 10 4 1.3 9.4 2.1 15.8 6.4 1.8 13.1 3 22.2 9 3 1.5 8.1 2.5 13.7 5.6 2.1 11.4 3.6 19.2 7.8 2 1.8 6.6 3 11.2 4.6 2.5 9.3 4.1 15.7 6.4 1 2.6 4.9 4.3 8.2 3.3 3.6 6.8 6 11.5 4.7 0 2.3 2.3 3.9 3.9 1.6 3.2 3.2 5.5 5.5 2.2

148
APPENDIX D OVERVIEW OF BEAM DEFLECTION CALCULATIONS
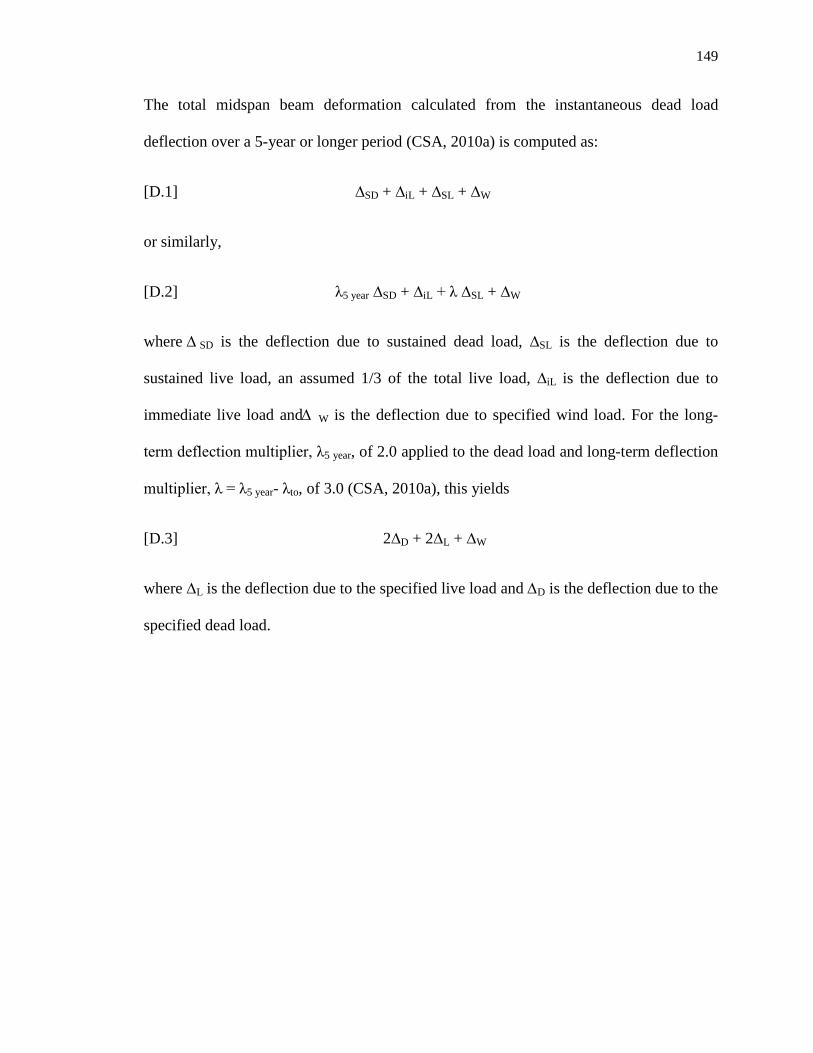
149
The total midspan beam deformation calculated from the instantaneous dead load
deflection over a 5-year or longer period (CSA, 2010a) is computed as:
[D.1] ∆SD + ∆iL + ∆SL + ∆W
or similarly,
[D.2] λ5 year ∆SD + ∆iL + λ ∆SL + ∆W
where ∆ SD is the deflection due to sustained dead load, ∆SL is the deflection due to
sustained live load, an assumed 1/3 of the total live load, ∆iL is the deflection due to
immediate live load and ∆ W is the deflection due to specified wind load. For the long-
term deflection multiplier, λ5 year, of 2.0 applied to the dead load and long-term deflection
multiplier, λ = λ5 year- λto, of 3.0 (CSA, 2010a), this yields
[D.3] 2∆D + 2∆L + ∆W
where ∆L is the deflection due to the specified live load and ∆D is the deflection due to the
specified dead load.

150
APPENDIX E EFFECTIVE MOMENT OF INTERIA CALCULATIONS
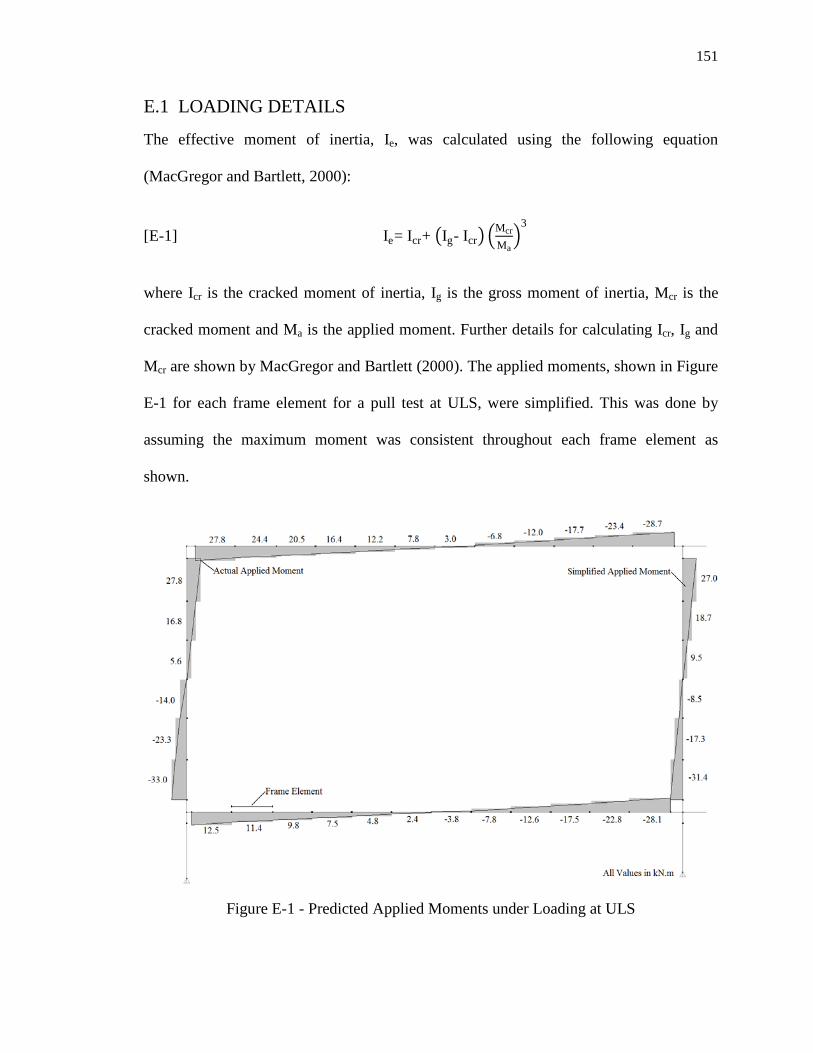
151
E.1 LOADING DETAILS
The effective moment of inertia, Ie, was calculated using the following equation
(MacGregor and Bartlett, 2000):
[E-1] Ie= Icr+ �Ig- Icr� �McrMa�
3
where Icr is the cracked moment of inertia, Ig is the gross moment of inertia, Mcr is the
cracked moment and Ma is the applied moment. Further details for calculating Icr, Ig and
Mcr are shown by MacGregor and Bartlett (2000). The applied moments, shown in Figure
E-1 for each frame element for a pull test at ULS, were simplified. This was done by
assuming the maximum moment was consistent throughout each frame element as
shown.
Figure E-1 - Predicted Applied Moments under Loading at ULS

152
APPENDIX F ENGINEERING DRAWINGS FOR TEST APPARATUS
Dimensions in mm [inches]
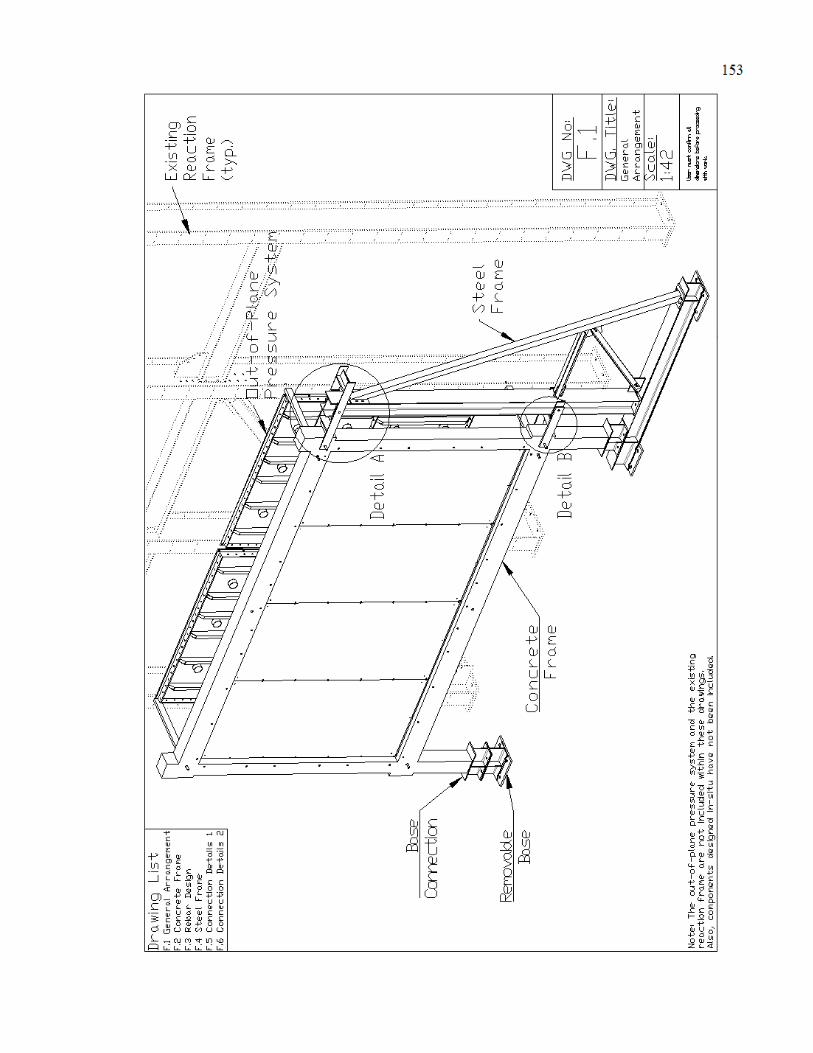
153
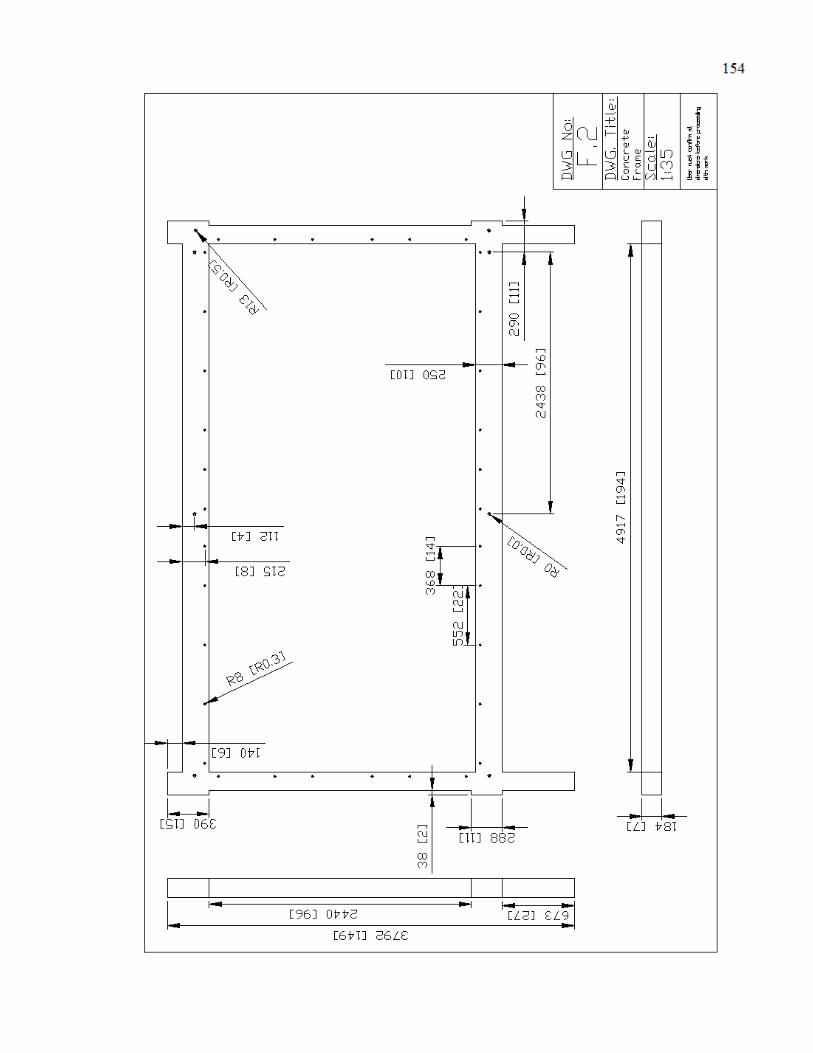
154
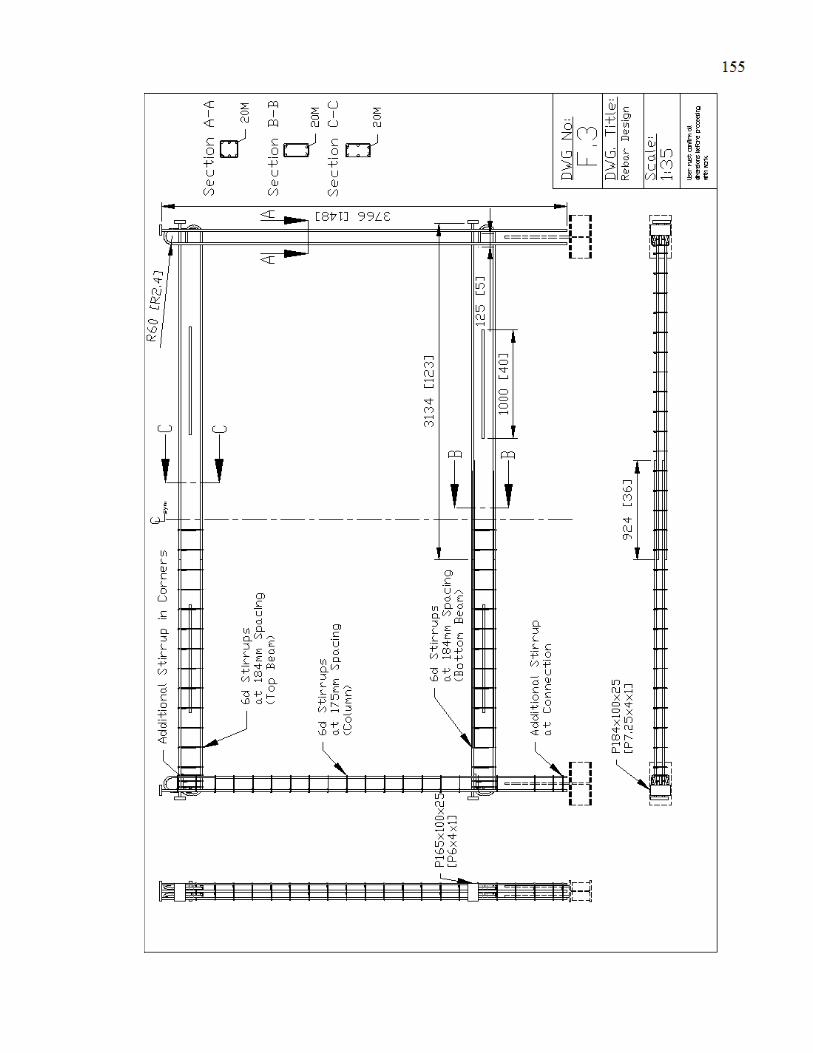
155
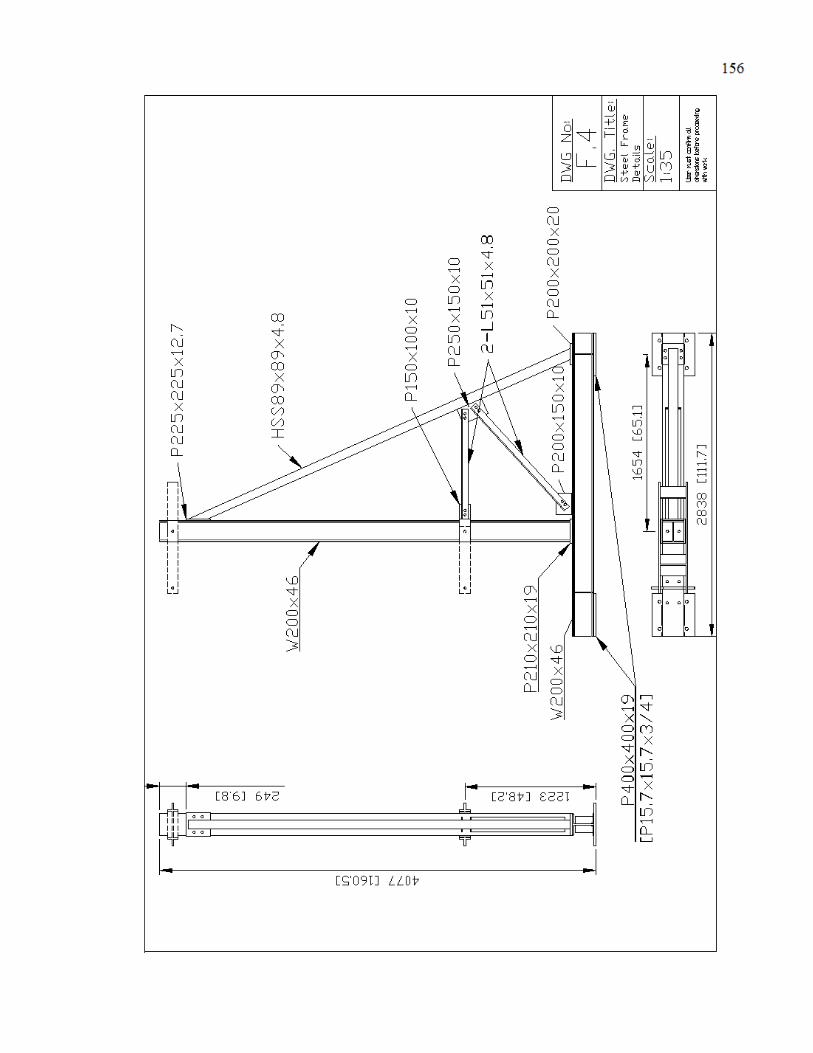
156

157
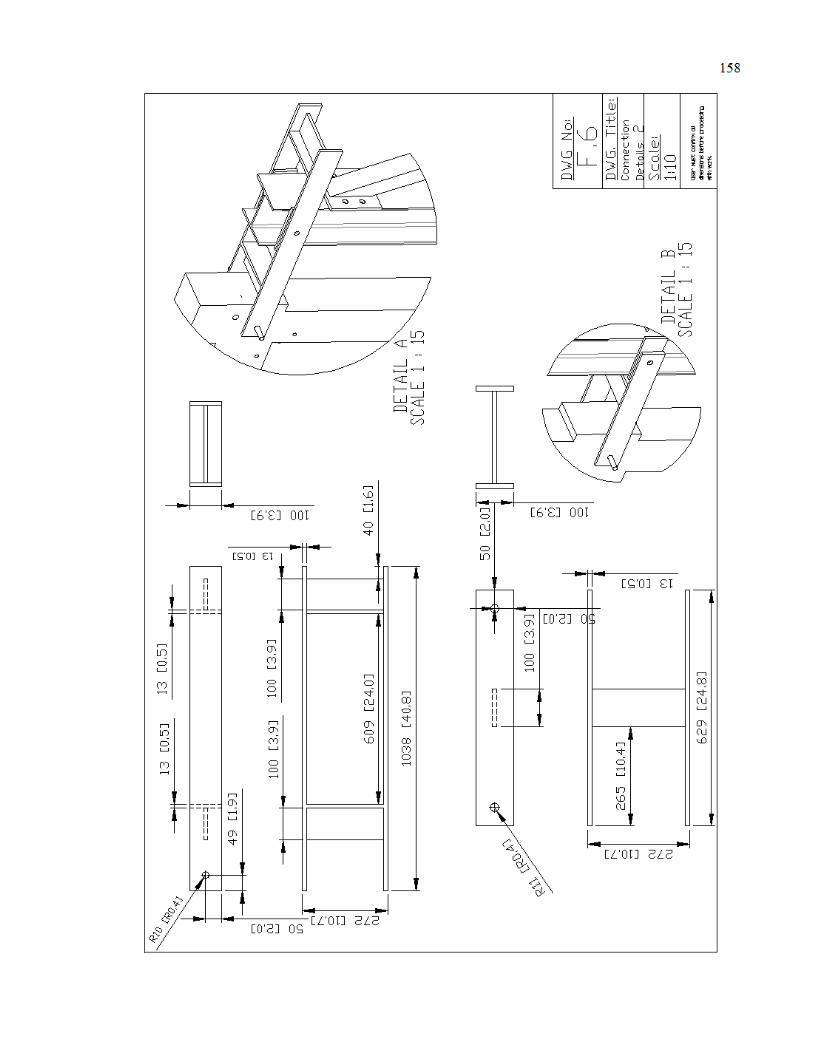
158
159
APPENDIX G
DESIGN LIMITS OF TEST APPARATUS
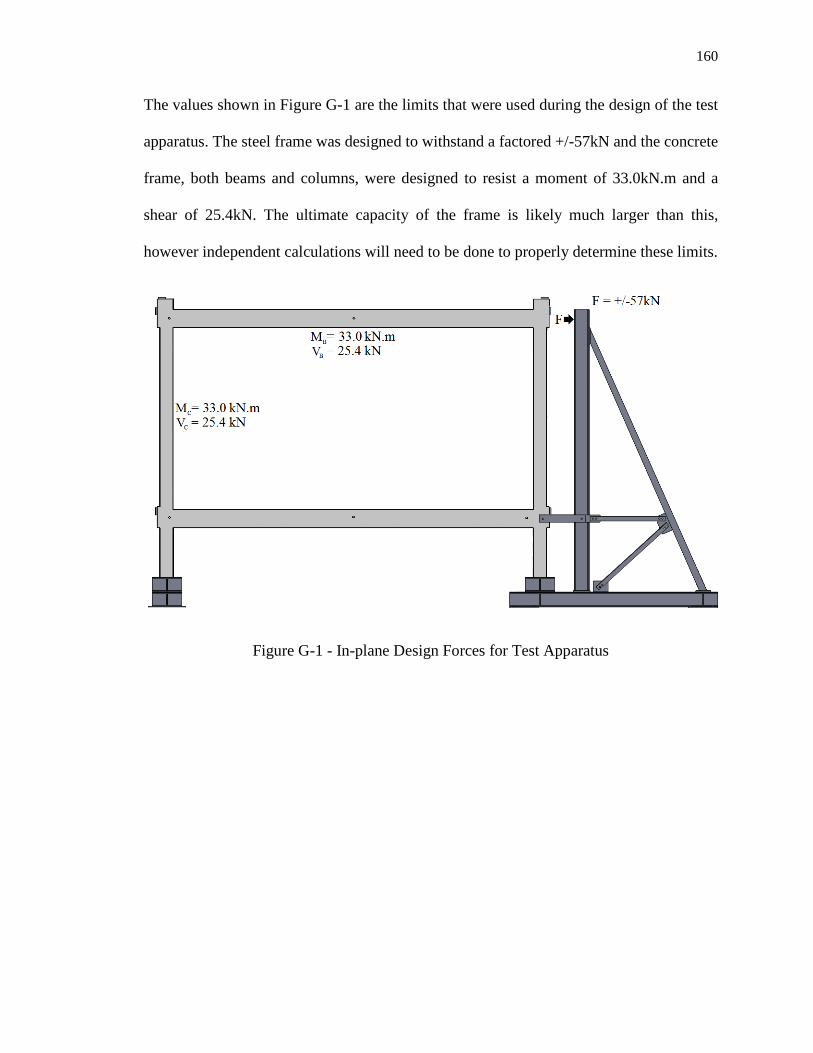
160
The values shown in Figure G-1 are the limits that were used during the design of the test
apparatus. The steel frame was designed to withstand a factored +/-57kN and the concrete
frame, both beams and columns, were designed to resist a moment of 33.0kN.m and a
shear of 25.4kN. The ultimate capacity of the frame is likely much larger than this,
however independent calculations will need to be done to properly determine these limits.
Figure G-1 - In-plane Design Forces for Test Apparatus

161
APPENDIX H
WALL LIFT DETAILS
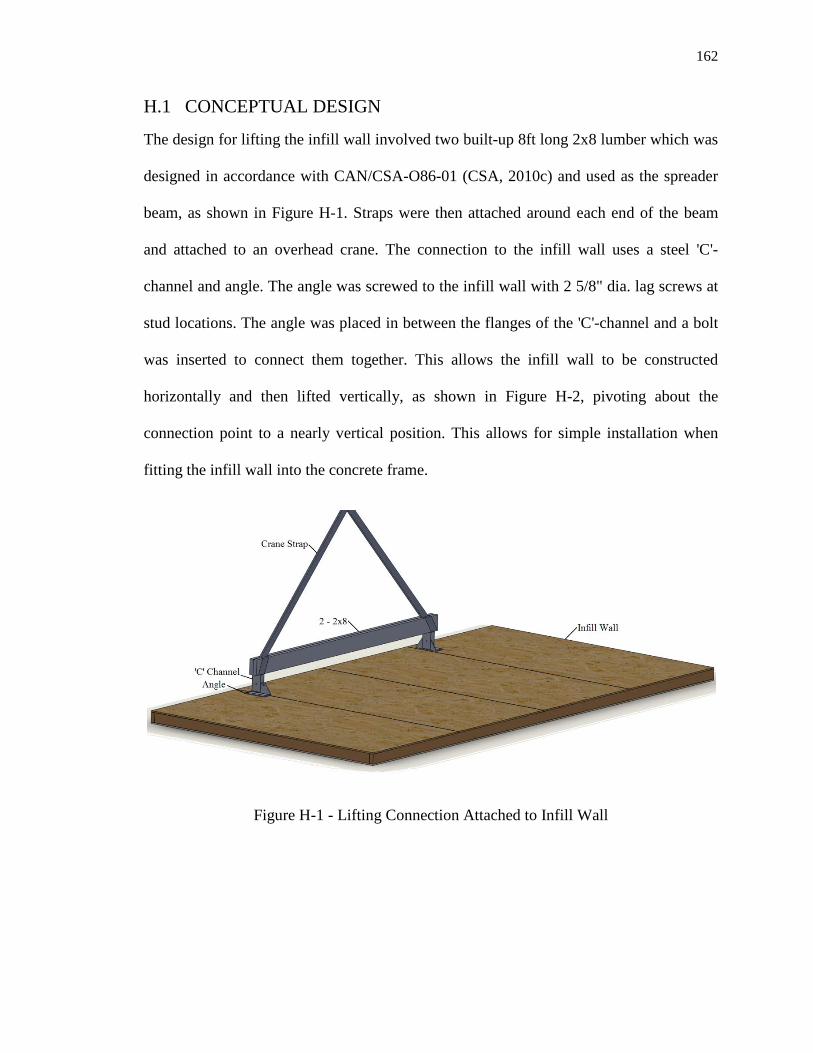
162
H.1 CONCEPTUAL DESIGN
The design for lifting the infill wall involved two built-up 8ft long 2x8 lumber which was
designed in accordance with CAN/CSA-O86-01 (CSA, 2010c) and used as the spreader
beam, as shown in Figure H-1. Straps were then attached around each end of the beam
and attached to an overhead crane. The connection to the infill wall uses a steel 'C'-
channel and angle. The angle was screwed to the infill wall with 2 5/8" dia. lag screws at
stud locations. The angle was placed in between the flanges of the 'C'-channel and a bolt
was inserted to connect them together. This allows the infill wall to be constructed
horizontally and then lifted vertically, as shown in Figure H-2, pivoting about the
connection point to a nearly vertical position. This allows for simple installation when
fitting the infill wall into the concrete frame.
Figure H-1 - Lifting Connection Attached to Infill Wall
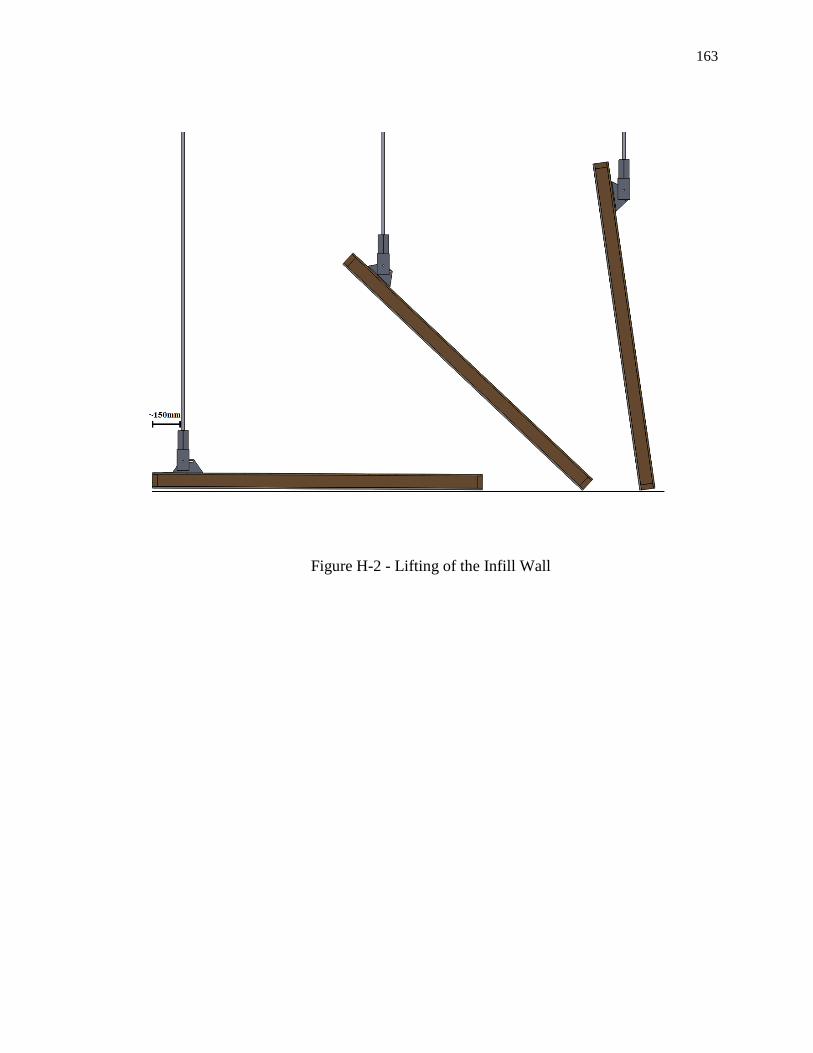
163
Figure H-2 - Lifting of the Infill Wall

164
APPENDIX I
WALL DEFORMATION CALCULATIONS

165
I.1 OVERVIEW
Figure I-1a) shows the original position of the infill wall and the approximate location of
LVDTs T5, QT5, W5, QB5 and B5. As previously mentioned, the displacement of the
top and bottom connections cannot be accurately determined by the displacements at T5
and B5 as an unknown amount of wall rotation is also being measured. Figure I-1b)
shows the displacement of the wall, and the connections, under negative pressure. For
Case 1, the original position at midheight of the infill wall is used as the center axis,
where the results are shown in Table I-1. The goal is to determine an equation which
represents the deformed shape of the infill wall, using a fifth-degree polynomial, and use
it to solve for the predicted displacements at the top and bottom connection. To simplify
the equation, Case 2 is introduced which changes the location of the axis to midheight of
the deformed shape and switches the x and y axis, leading to the results shown in Table I-
1. Using this data, the polynomial for the deformed shape is:
[I.1] y = 2.4x10-9x4 + 5.0x10-6x3 - 4.6x10x2 - 5.8x
where y is the displacement of the infill wall and x is the vertical position along the wall.
With this, the displacements at the top and bottom connections can be determined, as
shown in Table I-1.
Similarly, the equations for the deformed shape under positive pressure is :
[I.2] y = 8.2x10-9x4 + 6.8x10-6x3 - 9.6x10x2 - 8.7x
where the results are shown in Table I-2.
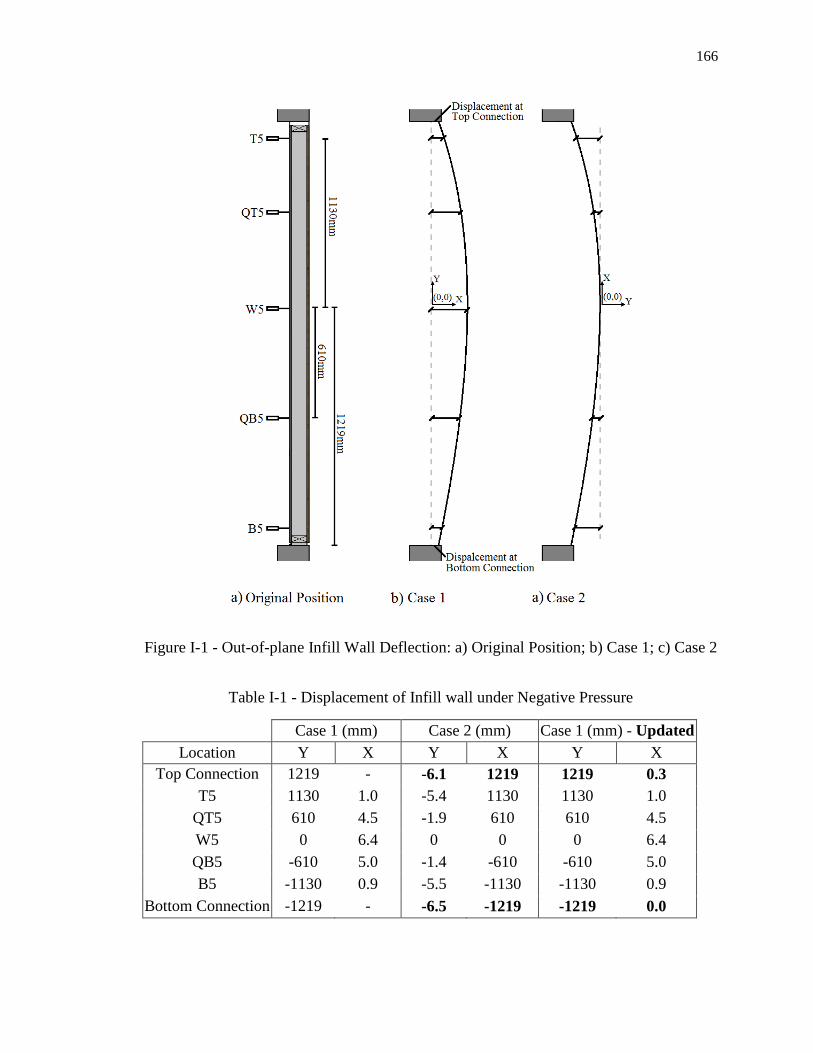
166
Figure I-1 - Out-of-plane Infill Wall Deflection: a) Original Position; b) Case 1; c) Case 2
Table I-1 - Displacement of Infill wall under Negative Pressure
Case 1 (mm) Case 2 (mm) Case 1 (mm) - Updated
Location Y X Y X Y X Top Connection 1219 - -6.1 1219 1219 0.3
T5 1130 1.0 -5.4 1130 1130 1.0 QT5 610 4.5 -1.9 610 610 4.5 W5 0 6.4 0 0 0 6.4 QB5 -610 5.0 -1.4 -610 -610 5.0 B5 -1130 0.9 -5.5 -1130 -1130 0.9
Bottom Connection -1219 - -6.5 -1219 -1219 0.0
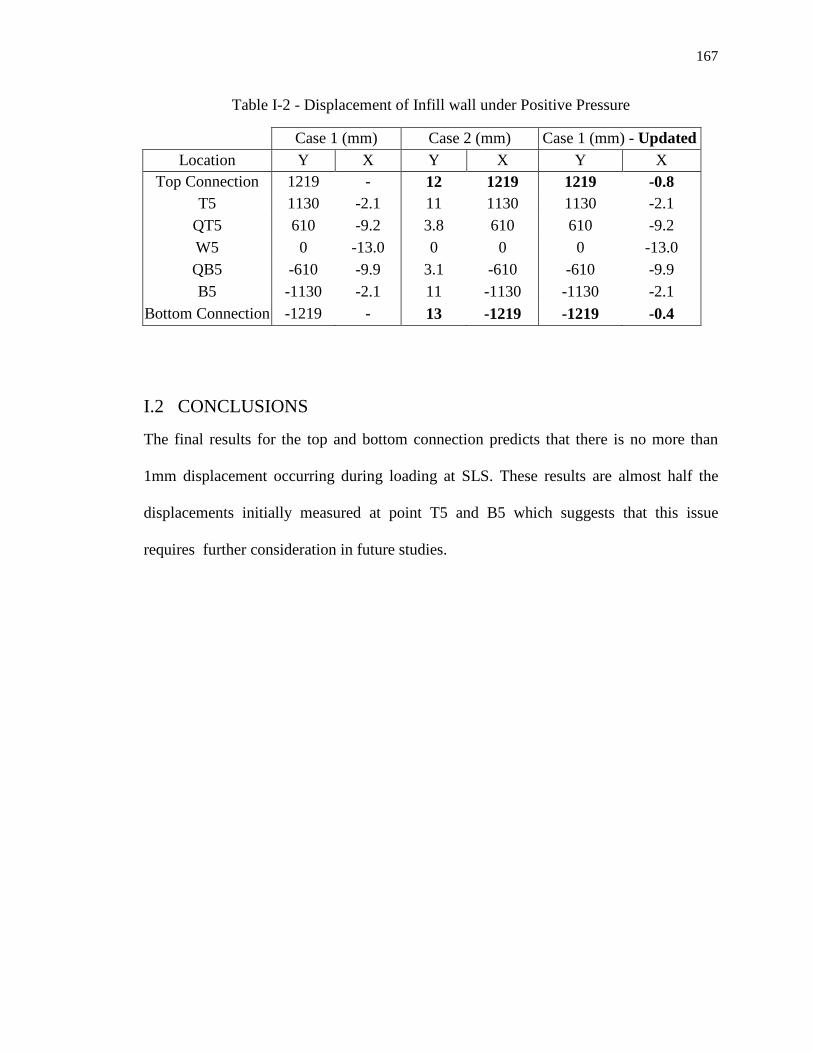
167
Table I-2 - Displacement of Infill wall under Positive Pressure
Case 1 (mm) Case 2 (mm) Case 1 (mm) - Updated
Location Y X Y X Y X Top Connection 1219 - 12 1219 1219 -0.8
T5 1130 -2.1 11 1130 1130 -2.1 QT5 610 -9.2 3.8 610 610 -9.2 W5 0 -13.0 0 0 0 -13.0 QB5 -610 -9.9 3.1 -610 -610 -9.9 B5 -1130 -2.1 11 -1130 -1130 -2.1
Bottom Connection -1219 - 13 -1219 -1219 -0.4
I.2 CONCLUSIONS
The final results for the top and bottom connection predicts that there is no more than
1mm displacement occurring during loading at SLS. These results are almost half the
displacements initially measured at point T5 and B5 which suggests that this issue
requires further consideration in future studies.
168
APPENDIX J
TESTING DETAILS
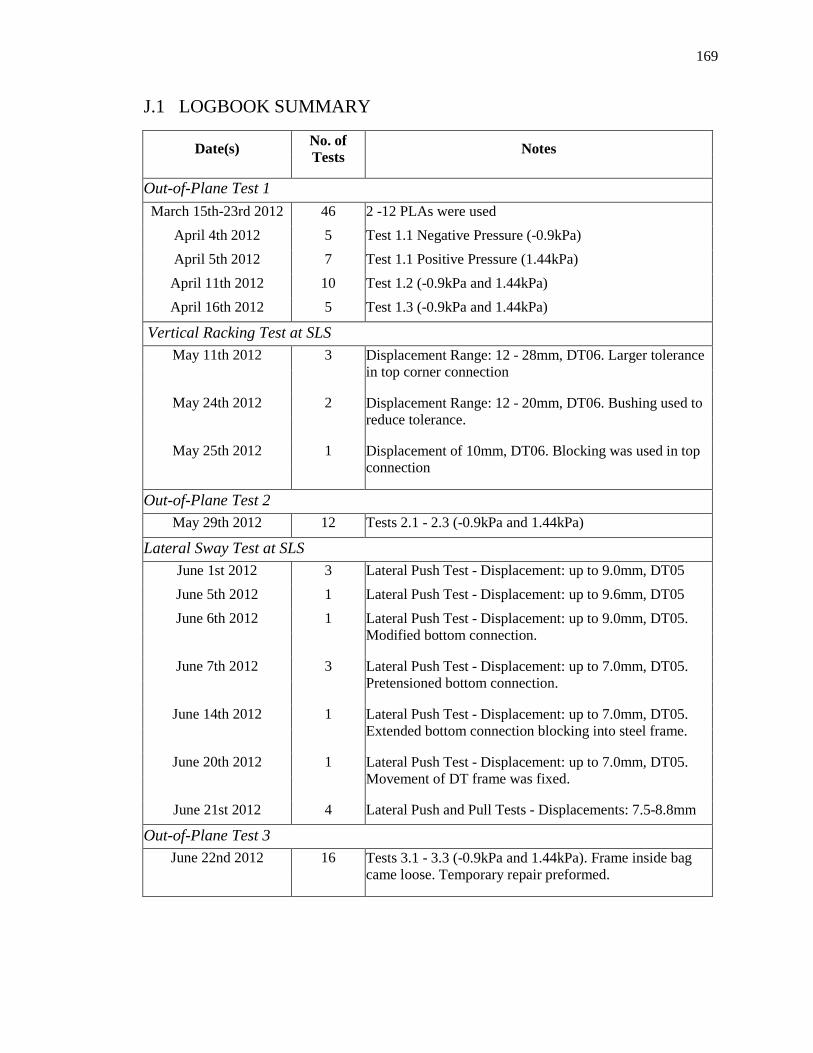
169
J.1 LOGBOOK SUMMARY
Date(s) No. of Tests Notes
Out-of-Plane Test 1 March 15th-23rd 2012 46 2 -12 PLAs were used
April 4th 2012 5 Test 1.1 Negative Pressure (-0.9kPa) April 5th 2012 7 Test 1.1 Positive Pressure (1.44kPa)
April 11th 2012 10 Test 1.2 (-0.9kPa and 1.44kPa) April 16th 2012 5 Test 1.3 (-0.9kPa and 1.44kPa)
Vertical Racking Test at SLS May 11th 2012 3 Displacement Range: 12 - 28mm, DT06. Larger tolerance
in top corner connection
May 24th 2012 2 Displacement Range: 12 - 20mm, DT06. Bushing used to reduce tolerance.
May 25th 2012 1 Displacement of 10mm, DT06. Blocking was used in top
connection
Out-of-Plane Test 2 May 29th 2012 12 Tests 2.1 - 2.3 (-0.9kPa and 1.44kPa)
Lateral Sway Test at SLS June 1st 2012 3 Lateral Push Test - Displacement: up to 9.0mm, DT05 June 5th 2012 1 Lateral Push Test - Displacement: up to 9.6mm, DT05 June 6th 2012 1 Lateral Push Test - Displacement: up to 9.0mm, DT05.
Modified bottom connection.
June 7th 2012 3 Lateral Push Test - Displacement: up to 7.0mm, DT05. Pretensioned bottom connection.
June 14th 2012 1 Lateral Push Test - Displacement: up to 7.0mm, DT05.
Extended bottom connection blocking into steel frame.
June 20th 2012 1 Lateral Push Test - Displacement: up to 7.0mm, DT05. Movement of DT frame was fixed.
June 21st 2012 4 Lateral Push and Pull Tests - Displacements: 7.5-8.8mm
Out-of-Plane Test 3 June 22nd 2012 16 Tests 3.1 - 3.3 (-0.9kPa and 1.44kPa). Frame inside bag
came loose. Temporary repair preformed.
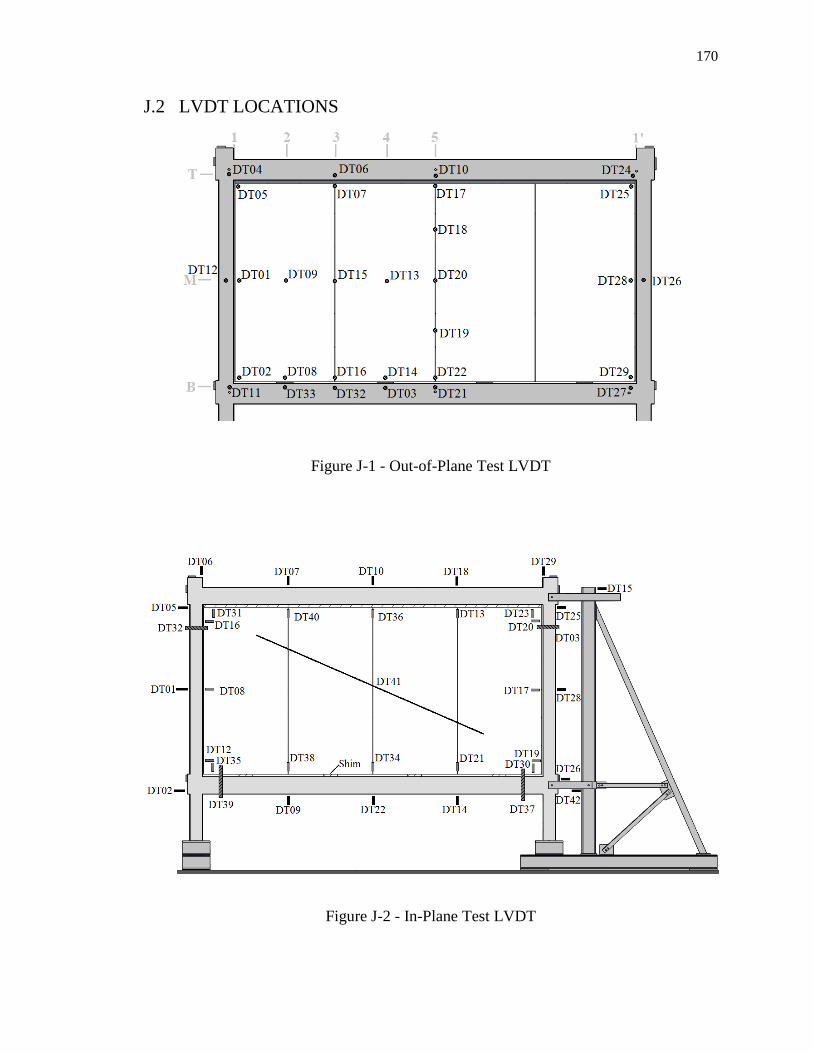
170
J.2 LVDT LOCATIONS
Figure J-1 - Out-of-Plane Test LVDT
Figure J-2 - In-Plane Test LVDT
171
Identification
CURRICULUM VITAE
Jeffrey R. L. Blaylock, b. Brampton, Ontario, Canada, 1986
Post-Secondary Education and Degrees 2009 - 2012
2005 - 2009
Master of Engineering Science, Structural Western University, London Canada Bachelor of Engineering Science, Structural Western University, London Canada
Honors and Awards 2011
2010
2009
2009 2008
Graduate Teaching Assistant Union Scholarship Award for Community Involvement. Graduate Teaching Assistant Union Scholarship Award for Community Involvement. Canadian Society for Civil Engineering (CSCE) Best Student Award for Class of 2009. Dean's List, Faculty of Engineering, Western University. Dean's List, Faculty of Engineering, Western University.
Related Employment 2009 - 2011
May - July 2009
May - Aug. 2008
Teaching Assistant Western University London, Canada Employee, Assisted Facility Manager Insurance Research Lab for Better Homes London, Canada Junior Project Coordinator NAC (North America Construction) Constructors Ltd. Morriston, Ontario, Canada
Related Presentations May 2012
February 2012
January 2011
2nd NEWBuildS Workshop, Vancouver, British Columbia NEWBuildS Mid-rise Building Project: Highly Qualified Personnel Workshop, Ottawa, Ontario 1st NEWBuildS Workshop, Vancouver, British Columbia
Publications Blaylock, J. and Bartlett, M. 2011. " Niche Areas for Mid-rise Light-frame Wood-
Concrete Hybrid Construction", Proceedings of the CSCE 2011 General Conference, Ottawa, ON, GC-136, 10-page paper in CD-ROM Proceedings