wongjasont oshp b&w improvement... · graphical display of data plotted over time ... time 24...
TRANSCRIPT

4/11/2017
1
OSHP Annual Seminar 2017
Practical Improvement
Science in Medication
Safety Jason Timothy Wong, PharmD
PGY1 Health-System Pharmacy Administration ResidentOregon Health and Science University
DATE: Apri l 28, 2017
2
Disclosure Statement
Jason Timothy Wong, PharmD
� Potential conflicts of interest: none
� Sponsorship: none
� Presentation is educational in nature and indicates agreement to abide
by the non-commercialism guidelines provided
3
Learning Objectives
By the end of this presentation, you will be able to:
� Explain the role of improvement science in healthcare
� Apply improvement science methodology to ensure safe medication
management
� Identify and create an improvement project
4/11/2017
2
4
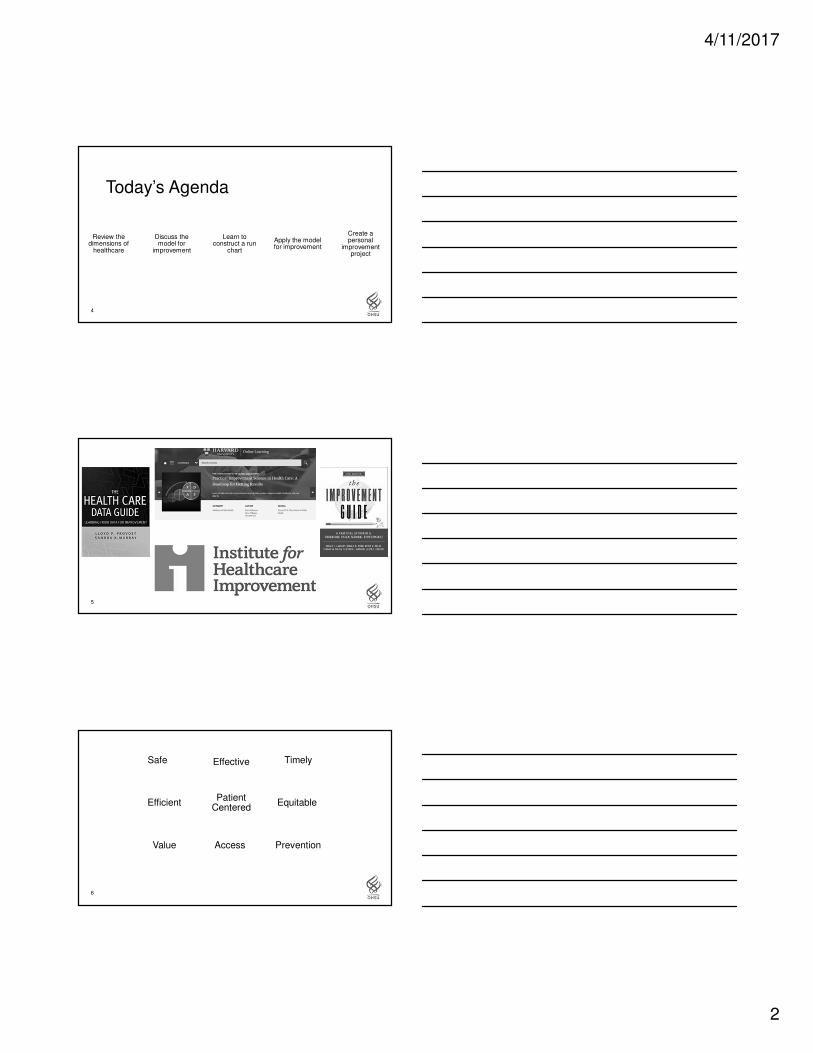
Today’s Agenda
Review the dimensions of
healthcare
Discuss the model for
improvement
Learn to construct a run
chart
Apply the model for improvement
Create a personal
improvement project
5
6
Safe Effective Timely
EfficientPatient
CenteredEquitable
Value Access Prevention

4/11/2017
3
7
What is improvement science?
Improvement
� Change that produces visible, positive differences in results
Science
� A system of acquiring knowledge attained through study or practice
8
Scientific Knowledge
Profound Knowledge
Greater Improvement
9
Model for Improvement
Plan
DoStudy
ActWhat are we trying to accomplish?
How will we know change is an improvement?
What change will result in improvement?
4/11/2017
4
10
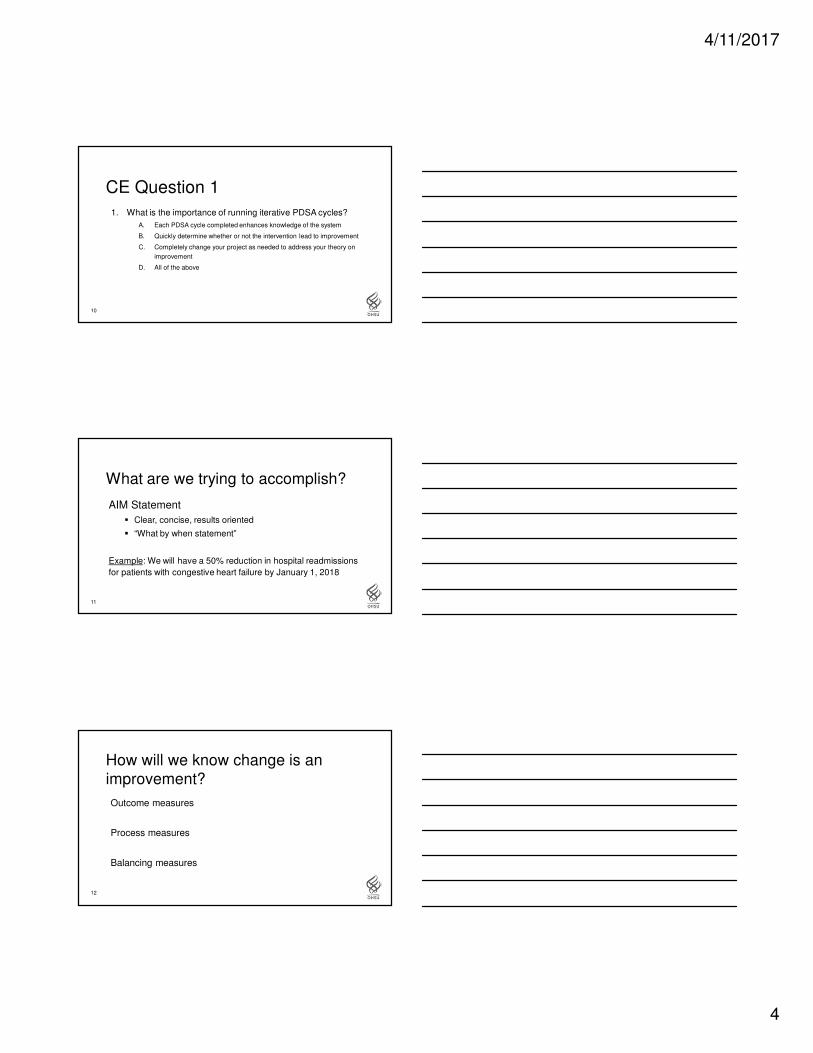
CE Question 1
1. What is the importance of running iterative PDSA cycles?
A. Each PDSA cycle completed enhances knowledge of the system
B. Quickly determine whether or not the intervention lead to improvement
C. Completely change your project as needed to address your theory on
improvement
D. All of the above
11
What are we trying to accomplish?
AIM Statement
� Clear, concise, results oriented
� “What by when statement”
Example: We will have a 50% reduction in hospital readmissions
for patients with congestive heart failure by January 1, 2018
12
How will we know change is an improvement?
Outcome measures
Process measures
Balancing measures
4/11/2017
5
13
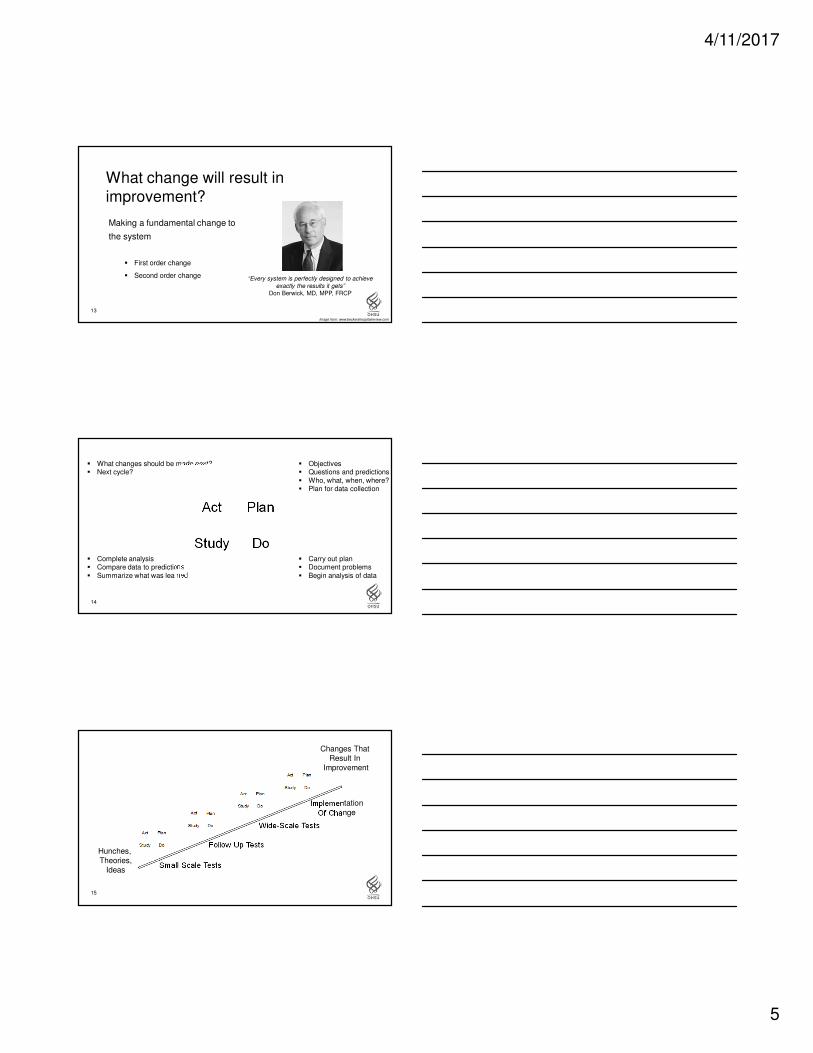
What change will result in improvement?
Making a fundamental change to
the system
� First order change
� Second order change “Every system is perfectly designed to achieve
exactly the results it gets”
Don Berwick, MD, MPP, FRCP
Image from: www.beckershospitalreview.com
14
� Objectives� Questions and predictions� Who, what, when, where?� Plan for data collection
� Carry out plan� Document problems� Begin analysis of data
� Complete analysis� Compare data to predictions� Summarize what was learned
� What changes should be made next?� Next cycle?
Plan
DoStudy
Act
15
Hunches, Theories,
Ideas
Changes That Result In
Improvement
Small Scale Tests
Follow Up Tests
Wide-Scale Tests
ImplementationOf Change
Plan
DoStudy
Act
Plan
DoStudy
Act
Plan
DoStudy
Act
Plan
DoStudy
Act

4/11/2017
6
16
CE Question 2
2. Which of the following is a reason to include a balancing
measure in your improvement project?
A. To ensure you are making progress toward your AIM statement
B. To ensure the changes you have made to one area are not having a
negative effect on another part of your system
C. To ensure you are accurately measuring your outcome
D. All of the above
17
What is a run chart?
Graphical display of data plotted over time
Illustration of data to make performance visible
18
Median
0
2
4
6
8
10
12
14
16
1 2 3 4 5 6 7 8 9 10
11
12
13
14
15
16
17
18
19
20
Value
Time
TITLE
Goal

4/11/2017
7
19
Constructing a run chart
1. Date/observation
2. Value/data
3. Median
4. Goal
Date Value Median Goal
1
2
3
4
5
6
7
8
9
10
20
Median
0
2
4
6
8
10
12
14
16
1 2 3 4 5 6 7 8 9 10
11
12
13
14
15
16
17
18
19
20
# of CrossFit Workouts
Week
Improving CrossFit Class Attendance Summer 2016
Start of OHSU Residency
Goal
21
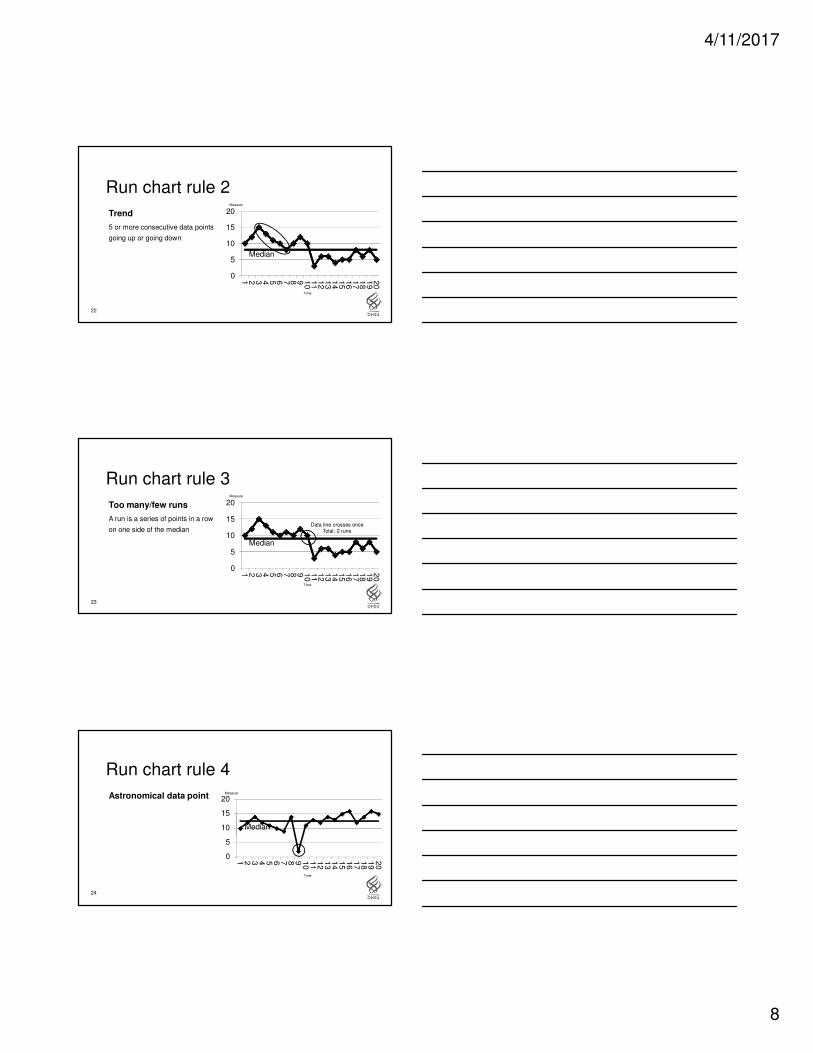
Run chart rule 1
Shift
6 or more consecutive data points
above or below the median
Median
0
5
10
15
20
1 2 3 4 5 6 7 8 9 10
11
12
13
14
15
16
17
18
19
20
Measure
Time
4/11/2017
8
22
Run chart rule 2
Trend
5 or more consecutive data points
going up or going down
Median
0
5
10
15
20
1 2 3 4 5 6 7 8 9 10
11
12
13
14
15
16
17
18
19
20
Measure
Time
23
Run chart rule 3
Too many/few runs
A run is a series of points in a row
on one side of the median
Median
0
5
10
15
20
1 2 3 4 5 6 7 8 9 10
11
12
13
14
15
16
17
18
19
20
Measure
Data line crosses once Total: 2 runs
Time
24
Run chart rule 4
Astronomical data point
Median
0
5
10
15
20
1 2 3 4 5 6 7 8 9 10
11
12
13
14
15
16
17
18
19
20
Measure
Time
4/11/2017
9
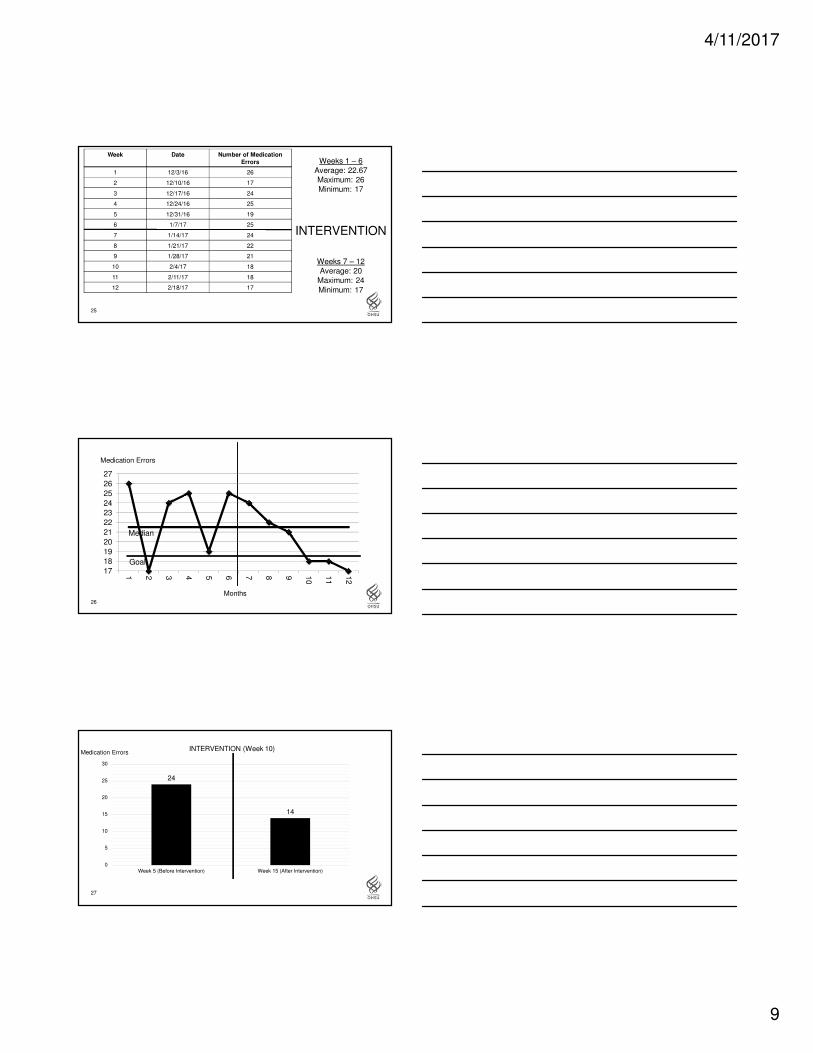
25
Week Date Number of Medication
Errors
1 12/3/16 26
2 12/10/16 17
3 12/17/16 24
4 12/24/16 25
5 12/31/16 19
6 1/7/17 25
7 1/14/17 24
8 1/21/17 22
9 1/28/17 21
10 2/4/17 18
11 2/11/17 18
12 2/18/17 17
Weeks 1 – 6Average: 22.67Maximum: 26Minimum: 17
INTERVENTION
Weeks 7 – 12Average: 20
Maximum: 24
Minimum: 17
26
Median
17
18
19
20
21
22
23
24
25
26
27
1 2 3 4 5 6 7 8 9 10
11
12
Medication Errors
Months
Goal
27
24
14
0
5
10
15
20
25
30
Week 5 (Before Intervention) Week 15 (After Intervention)
Medication ErrorsINTERVENTION (Week 10)

4/11/2017
10
28
Median
10111213141516171819202122232425
1 2 3 4 5 6 7 8 9 10
11
12
13
14
15
16
17
18
19
20
INTERVENTION (Week 10)Medication Errors
Months
Goal
29
CE Question 33. Please select the following run chart graph that illustrates
improvement over time resulting from your intervention:
0
2
4
6
8
10
12
1 2 3 4 5 6 7 8 9 10
11
12
13
14
Hours
0
2
4
6
8
10
12
1 2 3 4 5 6 7 8 9 10
11
12
13
14
Hours
0
2
4
6
8
10
12
1 2 3 4 5 6 7 8 9 10
11
12
13
14
Hours
A B C
30RUN CHART QUESTIONS?Image from: www.wallpapercave.com

4/11/2017
11
31
Case study
32
Situation
Patient admitted to
trauma ward
MD obtains medication list from daughter
Phenobarbital 300mg QHS + Phenobarbital 50mg QAM
MD starts phenobarbital
Med rec completed by
PharmD 3 days after
admit
Phenobarbital 97.2mg QD
MD awaiting neuro/geriatric recs (4 days)
Patientcombative
towards staff
Phenobarbital reduced to
97.2 mg QDPSI reported
33
Model for Improvement
Plan
DoStudy
ActWhat are we trying to accomplish?
How will we know change is an improvement?
What change will result in improvement?

4/11/2017
12
34
What are we trying to accomplish?
There will be a 50% reduction in the number
of medication reconciliation errors per patient measured each
week on the trauma ward by January 1, 2018
AIM Statement
35
How will we know change is an improvement?
Outcome Measure
Rate of medication reconciliation errors per
patient
Process Measure
Number of medication reconciliation errors
identified by pharmacist
Balancing Measure
Pharmacist clock out time
36
What change will result in improvement?
HYPOTHESIS
If we implement a risk stratification tool, we will reduce the
number of medication errors that will lead to a decrease in
adverse medication related events
4/11/2017
13
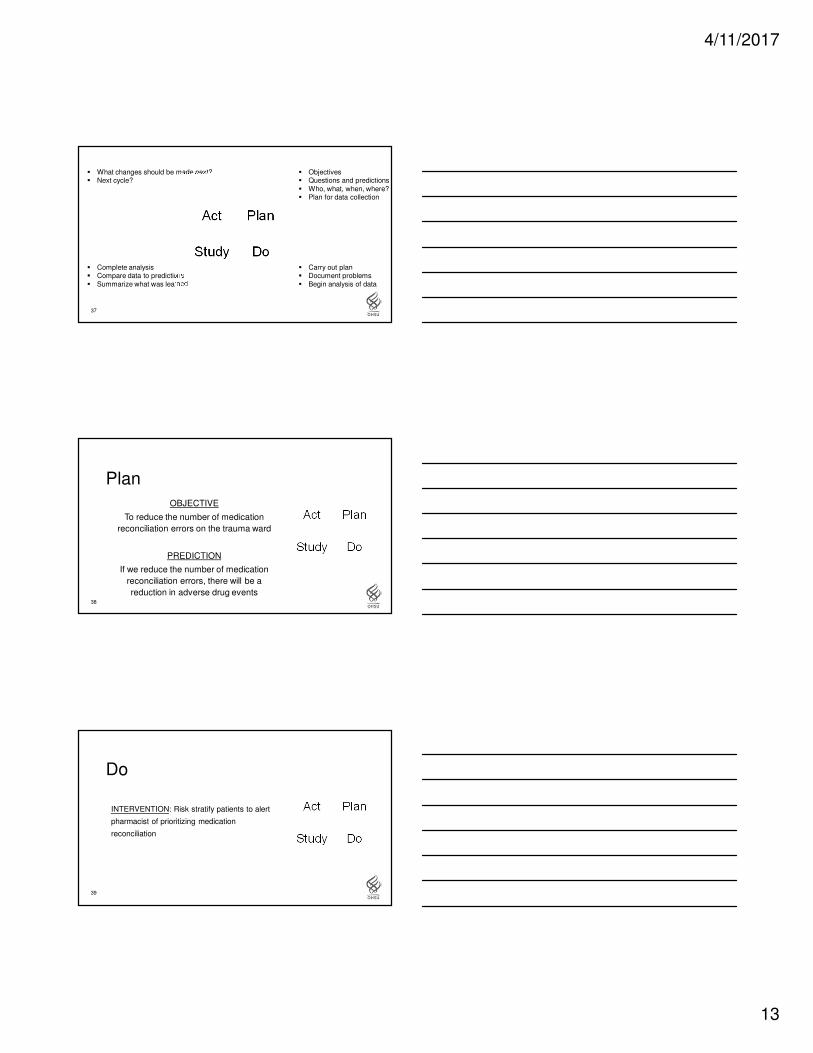
37
� Objectives� Questions and predictions� Who, what, when, where?� Plan for data collection
� Carry out plan� Document problems� Begin analysis of data
� Complete analysis� Compare data to predictions� Summarize what was learned
� What changes should be made next?� Next cycle?
Plan
DoStudy
Act
38
Plan
Plan
DoStudy
ActOBJECTIVE
To reduce the number of medication
reconciliation errors on the trauma ward
PREDICTION
If we reduce the number of medication
reconciliation errors, there will be a
reduction in adverse drug events
39
Do
INTERVENTION: Risk stratify patients to alert
pharmacist of prioritizing medication
reconciliation
Plan
DoStudy
Act
4/11/2017
14
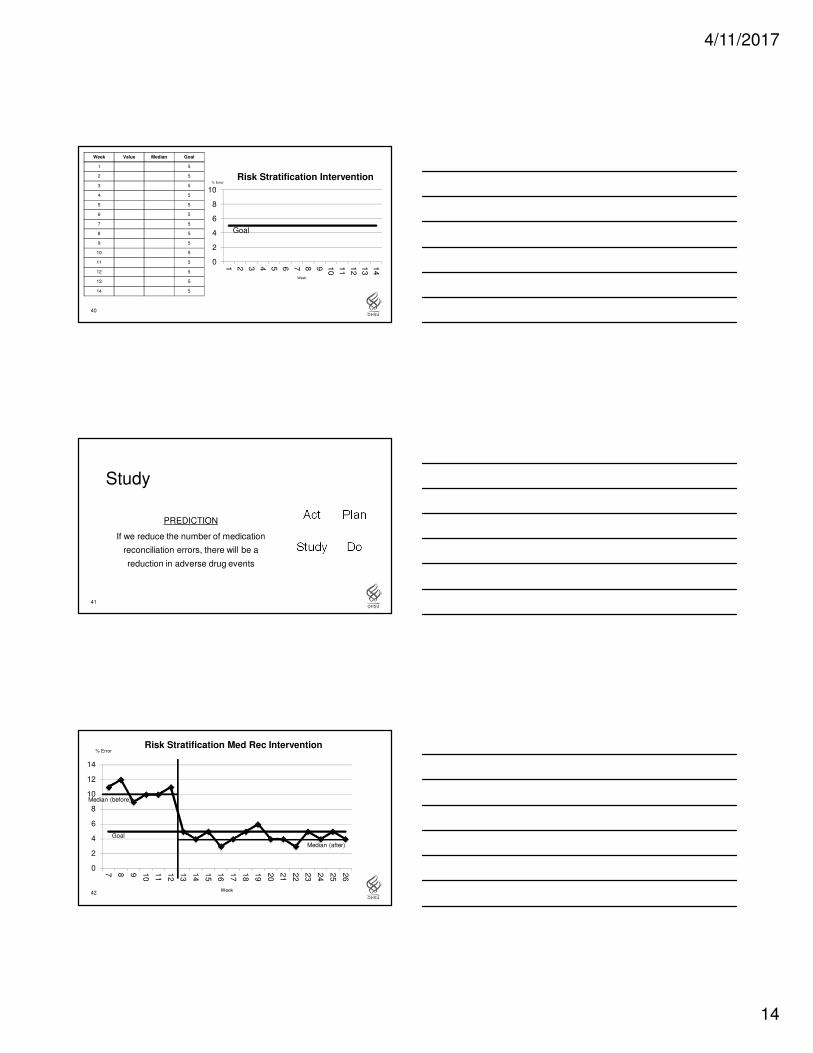
40
Week Value Median Goal
1 5
2 5
3 5
4 5
5 5
6 5
7 5
8 5
9 5
10 5
11 5
12 5
13 5
14 5
Goal
0
2
4
6
8
10
1 2 3 4 5 6 7 8 9 10
11
12
13
14
Risk Stratification Intervention% Error
Week
41
Study
PREDICTION
If we reduce the number of medication
reconciliation errors, there will be a
reduction in adverse drug events
Plan
DoStudy
Act
42
Goal
0
2
4
6
8
10
12
14
7 8 9 10
11
12
13
14
15
16
17
18
19
20
21
22
23
24
25
26
Risk Stratification Med Rec Intervention% Error
Median (before)
Median (after)
Week

4/11/2017
15
43
Act
Data from the run chart indicate a
change after the intervention
Where do we go from here?
Plan
DoStudy
Act
44
Hunches, Theories,
Ideas
Changes That Result In
Improvement
Small Scale Tests
Follow Up Tests
Wide-Scale Tests
Implementationof Change
Plan
DoStudy
Act
Plan
DoStudy
Act
Plan
DoStudy
Act
Plan
DoStudy
Act
45
Your turn!1. What are you trying to accomplish?
� Issue, rationale, AIM statement
2. How will you know change is an improvement?
� Outcome, process, and balancing measures
3. What changes can you make to improve?
� Ideas of change, stakeholders, barriers
4/11/2017
16
46Image from: www.hrpayrollsystems.net
Thank YouJason Timothy Wong, PharmD
Acknowledgements:
Jason Christensen, PharmD, MBA, MS
Joe Fazio, Rph, MHA, MBI
Seth Hartman, PharmD
Jess Lassiter, PharmD, BCPS
John Mackay, PharmD, BCPS AQ Cardiology
Jake McFarland, PharmD, BCPS
Renita Patel, PharmD, BCPS
Colleen Shipman, PharmD, MPH, BCPS
48
References1. Berwick DM. Developing and testing changes in delivery of care. Ann Intern Med 1998;128:651–6.
2. Institute for Healthcare Improvement. (2016, February). Retrieved from http://www.ihi.org/resources/Pages/HowtoImprove/default.aspx
3. Institute of Medicine (U.S.). (2001). Crossing the quality chasm: A new health system for the 21st century. Washington, D.C: National
Academy Press.
4. Langley G.J., Moen R.D., Nolan K.M., Nolan T.W., Norman C.L., & Provost L.P. (2009). The Improvement Guide, 2nd ed. San
Francisco, CA: Jossey-Bass.
5. Øvretveit J. Understanding the conditions for improvement: research to discover which context influences affect improvement success.
BMJ Qual Saf 2011;20(Suppl 1):i18–23.
6. McGlynn, E.A., S.M. Asch, J. Adams, J. Keesey, J. Hicks, A. DeCristofaro, and E.A. Kerr. 2003. "The quality of health care delivered to
adults in the United States." New England Journal of Medicine348(26):2635-45.
7. Practical Improvement Science in Health Care: A Roadmap for Getting Results. Harvard edX, 28 Feb. 2016,
https://www.edx.org/course
8. Provost L.P., & Murray S.K. (2011). The Health Care Data Guide: Learning From Data For Improvement. San Francisco, CA: Jossey-
Bass.
9. Taylor, M. J., McNicholas, C., Nicolay, C., Darzi, A., Bell, D., & Reed, J. E. (2013). Systematic review of the application of the plan-do-
study-act method to improve quality in healthcare. BMJ Qual Saf, 10(1136), 1-9.