wonders efficacy and success brochure
TRANSCRIPT

Efficacy and Success

Table of Contents Third-Party Evaluation: All Green Ratings from EdReports .............................................................4
ESSA Evidence: Compilation ............................................................................................................5
Academic Study: Journal of Organizational and Educational Leadership* ..........................6
Case Study: Champaign Community Schools* ............................................................................8Success Story—Instruction for All Students: Miami-Dade County Public Schools ................ 12Success Story—Trending Upward: Lincoln Public Schools ........................................................... 15Success Story—Finding Balance: Delta Elementary Charter School ......................................... 16Reading Score Analysis: California State ELA Assessment ........................................................... 18Customers’ Choice: Educator Perception Study .............................................................................. 23
The purpose of this document is to demonstrate clearly and explicitly the scientific research evidence for Wonders. Wonders is built around effective instruction to meet the needs of all learners.
* This section exhibits Tier III promising evidence based on ESSA Guidelines. This evidence is derived through an
analysis of scientific study results.
2 Efficacy and Success | Table of Contents

Introduction | Efficacy and Success 3
A Shared Commitment to Student SuccessWe have an ongoing commitment to providing academically and educationally sound instructional materials.
To deliver on this promise, we work with world-class researchers and practitioners in education to assemble an expert authorship team, which includes Dr. Douglas Fisher and Dr. Timothy Shanahan, among others. Our team works with these experts to design, develop, and validate instructional models, so you can be assured that Wonders® is based on current research and best practices and supports effective teaching and learning.
We are continually learning from educators to evolve and improve the instructional quality and academic integrity of our materials.
Wonders is currently in use and enjoyed by thousands of teachers and millions of students across the United States. Wonders presents compelling indicators of success, available for your review in this piece:
• Third-party evaluation of text complexity and quality, knowledge building, and usability, in which Wonders met all expectations and achieved several of the highest possible scores.
• An independent efficacy study, in which the students using Wonders showed significant gains from beginning-of-year to end-of-year exams.
• Case studies and testimonials from a range of customers in districts with differing needs, all of whom acknowledge that Wonders contributed to student success.
• A wide-scale educator perception study, in which Wonders scored more favorably than its peers on every factor surveyed, including overall quality.
Thank you for both your dedication to the success of your learners, as well as your efforts to support our joint commitment to empowering great teaching and student achievement.

Wonders Grades K–5: All Green Ratings from EdReportsBuilding on a Foundation of SuccessEdReports.org, a widely respected independent K–12 curriculum review organization, evaluated Wonders ©2020 and rated it highly with all green scores across the three gateways: Text Quality and Complexity, Building Knowledge, and Usability.
Wonders (C) 2020—the most recent addition to the Wonders family— has added program enhancements to its established, research-based instruction, resulting in all Green Ratings from EdReports.
Efficacy and Success | EdReports4
Text Quality
0 27 52 58
54 / 58
Building Knowledge
0 15 28 32
30 / 32
Usability
0 23 30 34
30 / 34
Kindergarten
Meets Expectations
Text Quality
0 20 37 42
42 / 42
Building Knowledge
0 15 28 32
32 / 32
Usability
0 23 30 34
31 / 34
Third Grade
Meets Expectations
Third Grade
Meets Expectations
Text Quality
0 27 52 58
55 / 58
Building Knowledge
0 15 28 32
30 / 32
Usability
0 23 30 34
30 / 34
First Grade
Meets Expectations
Text Quality
0 20 37 42
42 / 42
Building Knowledge
0 15 28 32
32 / 32
Usability
0 23 30 34
31 / 34
Fourth Grade
Meets Expectations
Text Quality
0 27 52 58
55 / 58
Building Knowledge
0 15 28 32
30 / 32
Usability
0 23 30 34
32 / 34
Second Grade
Meets Expectations
Text Quality
0 20 37 42
42 / 42
Building Knowledge
0 15 28 32
32 / 32
Usability
0 23 30 34
31 / 34
Fifth Grade
Meets Expectations
HIGHLY RATEDEdReports

5
Wonders ESSA EvidenceJournal of Organizational and Educational LeadershipA study recently published in the Journal of Organizational and Educational Leadership found that Wonders users in six Title I public schools in North Carolina significantly increased their performance from pre-test to post-test on three measures of reading and literacy, including DIBELS (Dorsey, 2015). This study meets the criteria for ESSA Tier III, or “Promising” evidence based on the statistically significant positive correlation between Wonders use and student outcomes. For more information, see pages 6–7.
Progress Through Partnership: Champaign Community Schools and WondersAn analysis of NWEA MAP reading assessment data revealed that, on average, more than 600 fifth-grade students using Wonders in the Champaign Unit 4 School District in Illinois significantly outperformed their norm-based projected growth scores during the 2015–2016 school year. The findings from this correlational study meet the criteria for ESSA Tier III, or “Promising” evidence. For more information, see pages 8–11.
ESSA Evidence | Efficacy and Success
6
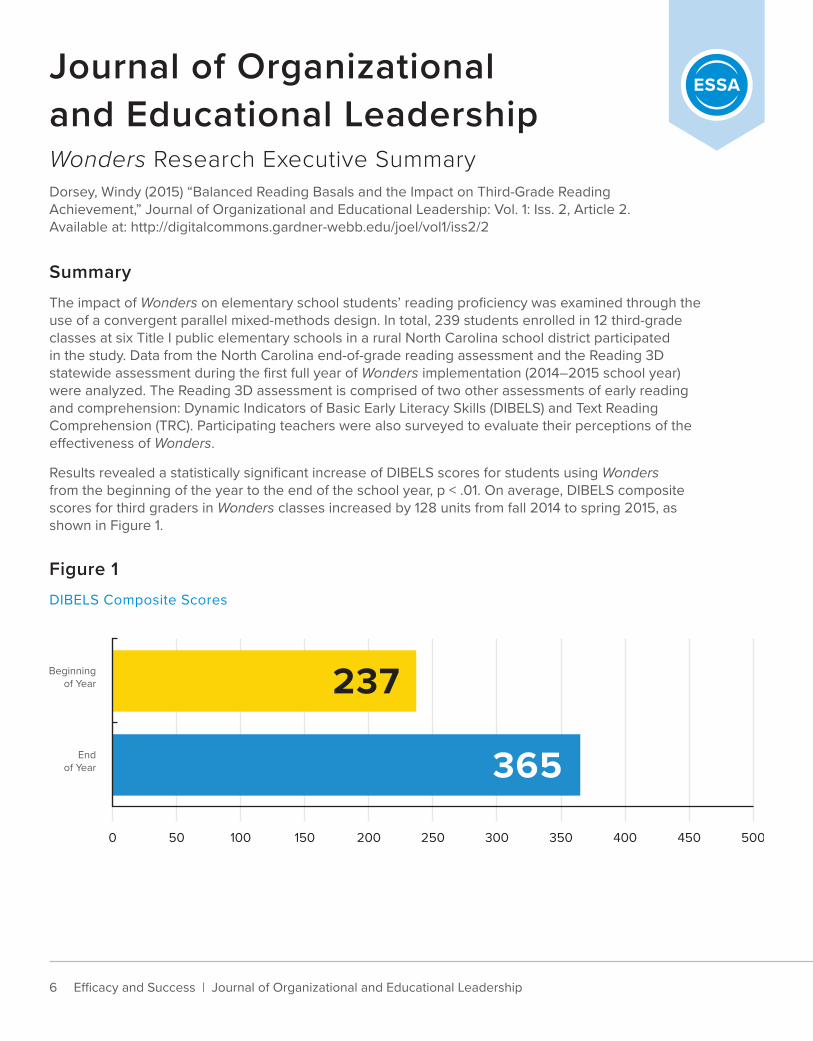
Journal of Organizational and Educational LeadershipWonders Research Executive SummaryDorsey, Windy (2015) “Balanced Reading Basals and the Impact on Third-Grade Reading Achievement,” Journal of Organizational and Educational Leadership: Vol. 1: Iss. 2, Article 2. Available at: http://digitalcommons.gardner-webb.edu/joel/vol1/iss2/2
SummaryThe impact of Wonders on elementary school students’ reading proficiency was examined through the use of a convergent parallel mixed-methods design. In total, 239 students enrolled in 12 third-grade classes at six Title I public elementary schools in a rural North Carolina school district participated in the study. Data from the North Carolina end-of-grade reading assessment and the Reading 3D statewide assessment during the first full year of Wonders implementation (2014–2015 school year) were analyzed. The Reading 3D assessment is comprised of two other assessments of early reading and comprehension: Dynamic Indicators of Basic Early Literacy Skills (DIBELS) and Text Reading Comprehension (TRC). Participating teachers were also surveyed to evaluate their perceptions of the effectiveness of Wonders.
Results revealed a statistically significant increase of DIBELS scores for students using Wonders from the beginning of the year to the end of the school year, p < .01. On average, DIBELS composite scores for third graders in Wonders classes increased by 128 units from fall 2014 to spring 2015, as shown in Figure 1.
Figure 1DIBELS Composite Scores
500450400350300250200150100500
Beginningof Year
Endof Year 365
237
Efficacy and Success | Journal of Organizational and Educational Leadership

10%5%0%
20%25%
15%
30%35%40%45%
Far Below Proficient Below Proficient Proficient Above Proficient
KEY
Beginning of Year
End of Year
7
Students who used Wonders also significantly increased TRC scores by an average of 27%, from 14.3 to 18.1, from fall 2014 to spring 2015, p < .01. As shown in Figure 2, the percentage of students scoring far below proficient on TRC dropped from 42% at the beginning of the year to 23% at the end of the year. Additionally, the percentage of students scoring above proficient doubled from 13% to 26% over the course of the school year using Wonders (Figure 2).
Figure 2Text Reading Comprehension Score Improvement
Performance on the North Carolina end-of-grade reading assessment also revealed significant positive trends for students using Wonders. The percent of students achieving both grade-level proficiency and college and career readiness standards (Levels 4 and 5) rose from 11% at the beginning of the year to 36% at the end of the year. These results are shown in Figure 3.
Figure 3North Carolina End-of-Grade Proficiency
An end-of-year survey was sent to all teachers who participated in the study. The survey results revealed overwhelmingly positive perceptions of the effectiveness of Wonders.
10%
5%
0%
20%
25%
15%
30%
Level 4 Level 5
KEY
Beginning of Year
End of Year
35%
Journal of Organizational and Educational Leadership | Efficacy and Success
8
Progress Through Partnership: Champaign Community Schools and WondersChallengeIn 2011, Champaign Community School District, in Illinois, was dealing with a significant achievement gap among its more than 9,600 students. The district found its existing resources and programs were disconnected. The district decided it needed a new, unified K–5 ELA curriculum to help its struggling readers while continuing to support and challenge its on-level learners. During their next reading adoption, Champaign created a thorough process to identify the best possible curriculum for the district.
SolutionChampaign’s superintendent, Dr. Susan Zola, looked for three critical elements when considering a new curriculum adoption:
• High-quality resources that support the district’s work.• Professional learning that helps build staff capacity.• Assessments and data that indicate student growth.
After a thorough, multi-year pilot of Wonders® and several other programs, Champaign adopted Wonders in grades K–5 to serve its more than 4,000 elementary students. When surveyed, 100 percent of the teachers piloting Wonders determined that Wonders materials met students’ academic needs.
According to Dr. Zola, “We landed on Wonders for several reasons. We have various levels of teacher experience; finding a resource that fits for both veteran teachers as well as our new teachers is one of many reasons that we chose Wonders. The team at McGraw Hill was very willing to work collaboratively with us building staff capacity. They were responsive to our existing literacy and assessment structure and respected that Wonders was a piece of a bigger picture.”
ResultsChampaign Community Schools has continued their use of Wonders from their initial pilot through to a full district implementation, including the addition of WonderWorks literacy intervention and Maravillas Spanish Language Arts. Dr. Zola shared, “We’ve seen our early literacy efforts pay off after our investment in staff capacity. We’re seeing stronger outcomes in early reading both from our PARCC® and MAP® data. That’s a trend that we want to see grow over the next several years.”
To support that growth, Champaign has continued to adapt, and so has Wonders. Since their initial adoption, Champaign has implemented the newest version of Wonders digital resources—which their voices influenced. “We shared our feedback with the team at McGraw Hill, and they passed it along to the folks who develop the program. We saw the new version actually change based on our suggestions and the feedback of other districts,” said Dr. Zola.
Efficacy and Success | Champaign Community School District

9
Dr. Zola appreciates the continued partnership and collaboration with McGraw Hill. “It feels like McGraw Hill has been a very different partner than my experiences with other curriculum providers. They have continued to collaborate with us through the adoption process and beyond. Their willingness to listen to ongoing feedback and stay connected with our work is refreshing. McGraw Hill wants to ensure we find success with their resource and has been a part of our shared work since implementation.”
“I have been surprised, liberated, excited by what Wonders has
offered my students and me.
Champaign Community School District | Efficacy and Success
Quantitative results, tables, and figures on the following pages.

10
Champaign Community Schools scores on NWEA MAP® reading assessment increased significantly from fall 2015 to spring 2016A series of t-tests were used to determine if student scores significantly increased across the 2015–16 school year. Overall, student scores on the NWEA MAP Reading Fluency assessment increased by an average of 11 points from fall 2015 (M=185.83) to spring 2016 (M=196.93). This increase was statistically significant, t(3367) = 64.08, p < .01, d = .49 (Table 1 & Figure 1).
For each grade, increases in students’ scores from fall to spring were statistically significant. Average score increases ranged from 17.2 units in grade 1 to 7.4 units in grade 5 (Table 1).
Table 1NWEA MAP Reading Fluency Assessment Growth: Fall 2015 to Spring 2016
Figure 1NWEA MAP Scores by Grade: Fall 2015 to Spring 2016
**Statistically significant, p < .05
Grade n FallMean
Fall SD
Spring Mean
Spring SD
Gain Mean
Gain SD
Effect Size (d)
1 450 159.79 17.58 176.96 17.98 17.18** 9.46 .97
2 770 176.83 17.89 190.40 17.53 13.57** 8.67 .77
3 744 185.29 19.03 196.22 18.27 10.94** 10.22 .58
4 731 195.76 19.45 204.09 18.66 8.33** 9.49 .44
5 673 203.36 20.35 210.74 20.16 7.38** 9.64 .36
Overall 3368 185.83 23.47 196.93 21.35 11.10** 10.05 .49
165
155
175
185
195
205
215
First Grade Second Grade Third Grade Fourth Grade OverallFifth Grade
Fall 2015 Average Spring 2016 Average
Efficacy and Success | Champaign Community School District
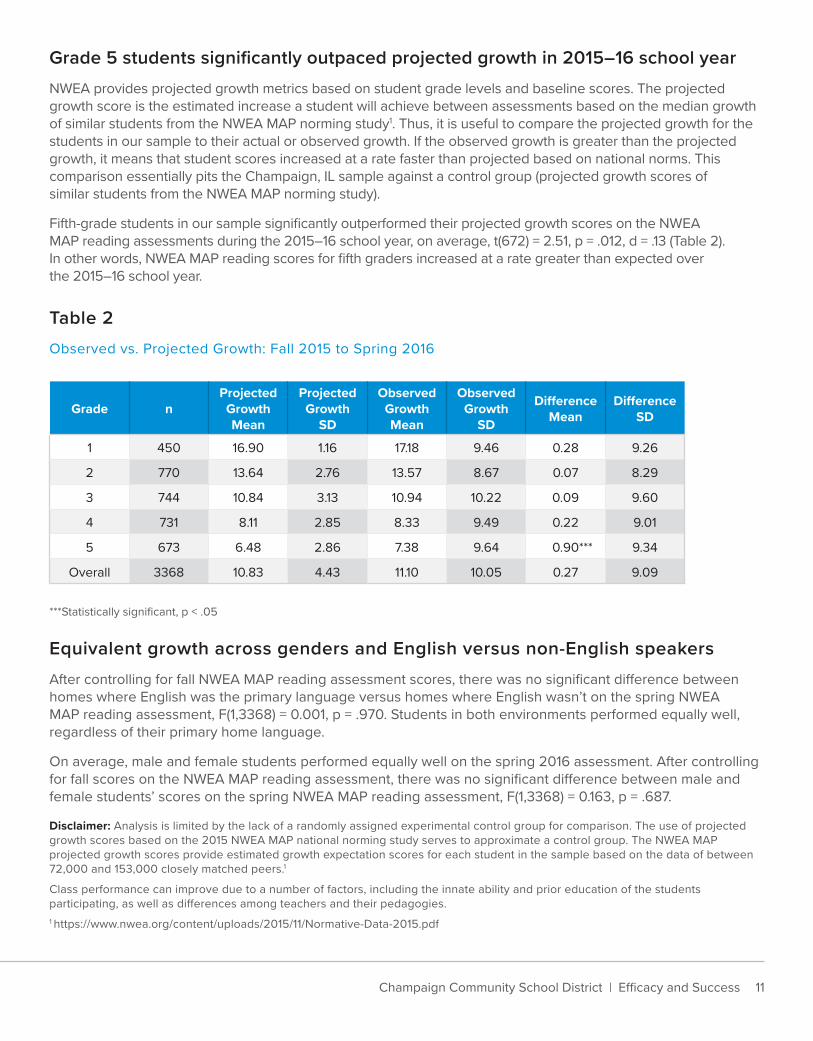
Table 2Observed vs. Projected Growth: Fall 2015 to Spring 2016
Grade nProjected Growth Mean
Projected Growth
SD
Observed Growth Mean
Observed Growth
SD
Difference Mean
Difference SD
1 450 16.90 1.16 17.18 9.46 0.28 9.26
2 770 13.64 2.76 13.57 8.67 0.07 8.29
3 744 10.84 3.13 10.94 10.22 0.09 9.60
4 731 8.11 2.85 8.33 9.49 0.22 9.01
5 673 6.48 2.86 7.38 9.64 0.90*** 9.34
Overall 3368 10.83 4.43 11.10 10.05 0.27 9.09
11
Grade 5 students significantly outpaced projected growth in 2015–16 school yearNWEA provides projected growth metrics based on student grade levels and baseline scores. The projected growth score is the estimated increase a student will achieve between assessments based on the median growth of similar students from the NWEA MAP norming study1. Thus, it is useful to compare the projected growth for the students in our sample to their actual or observed growth. If the observed growth is greater than the projected growth, it means that student scores increased at a rate faster than projected based on national norms. This comparison essentially pits the Champaign, IL sample against a control group (projected growth scores of similar students from the NWEA MAP norming study).
Fifth-grade students in our sample significantly outperformed their projected growth scores on the NWEA MAP reading assessments during the 2015–16 school year, on average, t(672) = 2.51, p = .012, d = .13 (Table 2). In other words, NWEA MAP reading scores for fifth graders increased at a rate greater than expected over the 2015–16 school year.
***Statistically significant, p < .05
Disclaimer: Analysis is limited by the lack of a randomly assigned experimental control group for comparison. The use of projected growth scores based on the 2015 NWEA MAP national norming study serves to approximate a control group. The NWEA MAP projected growth scores provide estimated growth expectation scores for each student in the sample based on the data of between 72,000 and 153,000 closely matched peers.1
Class performance can improve due to a number of factors, including the innate ability and prior education of the students participating, as well as differences among teachers and their pedagogies. 1 https://www.nwea.org/content/uploads/2015/11/Normative-Data-2015.pdf
Equivalent growth across genders and English versus non-English speakersAfter controlling for fall NWEA MAP reading assessment scores, there was no significant difference between homes where English was the primary language versus homes where English wasn’t on the spring NWEA MAP reading assessment, F(1,3368) = 0.001, p = .970. Students in both environments performed equally well, regardless of their primary home language.
On average, male and female students performed equally well on the spring 2016 assessment. After controlling for fall scores on the NWEA MAP reading assessment, there was no significant difference between male and female students’ scores on the spring NWEA MAP reading assessment, F(1,3368) = 0.163, p = .687.
Champaign Community School District | Efficacy and Success

12 Efficacy and Success | Miami-Dade County Public Schools
Miami-Dade County Public SchoolsStrengthening Instruction for All Levels Across a Large DistrictChallengeAs the fourth-largest district in the United States, Miami-Dade County Public Schools experience many challenges that face large, diverse districts. Since their ELA curriculum is selected by a committee consisting of reading coaches, teachers, and district staff, addressing their varied concerns was top of mind for Vanessa De La Peña, Elementary Executive Director at Miami-Dade.
De La Peña and her team needed an ELA solution that would meet the needs of a district that serves more than 150,000 students in grades K–5. Getting consensus from the committee was one goal, but there were several other factors to consider. With their diverse student population and varied instructional needs, ensuring that every student was getting equitable instruction was a priority. As De Le Peña noted, “increasing the rigor of instruction in all classrooms is really a difficult task.”
Miami-Dade County Public Schools SolutionAs in 2013, the selection committee in Miami-Dade County Public Schools chose to adopt Wonders in a rare unanimous vote.
While reflecting on what influenced that decision, Ms. De Le Peña shared that, “There were a few things that were unique about the program, like the tight connections between the core Wonders ELA program, WonderWorks intervention, and Maravillas Spanish language arts, and the match of skills taught and text used.”
This aspect of Wonders has helped Miami-Dade to “...understand how we can have the seamless connection across disciplines. For students who are struggling, the connection between WonderWorks and Wonders is seamless: the same skill, genre, and vocabulary. With EFL students, Maravillas helps us develop students who are biliterate and bilingual; they build an academic vocabulary in the second language, and it’s also seamless.”
“We were looking for texts that addressed the complexity and rigor of the new standards,” said De Le Peña, “and Wonders was the only solution that presented three pieces of text to the students each week that met that benchmark.” The Reading/Writing Workshop serves as the foundation, “where we start teaching the weekly skills and strategies.” The Literature Anthology features authentic texts that increase in complexity and length, and the paired texts are the basis for thematic analysis. According to De Le Pena, “Having those three pieces of text connected thematically, including half fiction and half nonfiction, helps our students understand how to apply the standards across multiple genres and in longer texts, which builds stamina.”
Ms. De La Peña called out the Access Complex Text (ACT) routine in the Teacher’s Edition as “a great scaffolding tool that helps make our teachers aware of what makes that text complex and what students might be tripping over. It gives them tools and strategies to support those elements and, by extension, provides teachers with a bridge to help their students.”

FCAT 2013–2014
Miami-Dade State of Florida
2013
52%53%54%55%56%57%
2014
Third Grade% Proficient On FCAT
2013
58%59%60%61%62%63%
2014
Fourth Grade% Proficient On FCAT
2013
58%59%60%61%62%63%
2014
Fifth Grade% Proficient On FCAT
Miami-Dade County Public Schools | Efficacy and Success 13
Wonders’ digital resources, which are housed on the ConnectED platform, have also made an impact in Miami-Dade: “All of the teacher resource books, the different skills and lessons, and even Vicki Gibson’s Managing Small Groups. Being able to easily navigate the plethora of resources on ConnectED ensures that our teachers are using them. The professional development on ConnectED is really a great resource. All of these resources build a digital professional library for our teachers.”, said Ms. De La Peña.
ResultsMiami-Dade has seen both qualitative and quantitative results since their implementation of Wonders. In April 2013, when the annual Florida Comprehensive Assessment Test (FCAT 2.0) was administered, the percentage of Miami-Dade students in third, fourth, and fifth grade scoring “Proficient” in reading was well below the state average.
After just eight months of Wonders instruction, Miami-Dade students took the FCAT 2.0 again in April 2014. Not only did Miami-Dade close its achievement gap, its students’ reading proficiency levels exceeded the state average.
“Being able to easily navigate the plethora of resources on ConnectED ensures that our teachers are using them.”
“It is clear that the reading instruction and selections within Wonders prepare students for Florida State Assessments by giving the
students the reading confidence and stamina they need.”

14
Miami-Dade has continued its ELA success through the transition to the new Florida State Assessments (FSA) in 2015. The percent of Miami-Dade students in grades three through five who scored at level 3 (satisfactory) or above has met—or exceeded—the state average all three years the FSA has been administered. They’ve experienced increases in the percentage of students achieving the highest level (5) as well as decreases in the percentage of students scoring at the lowest level (1). The results in third grade have been particularly impressive; the percentage of students scoring at level 3 or above rose by 4% from 2016 to 2017, outpacing all of the other large districts in Florida.
According to the M-DCPS Department of English Language Arts, “After four years of implementation and three years of our new state assessment, it is clear that the reading instruction and selections within Wonders prepare students for Florida State Assessments by giving the students the reading confidence and stamina they need. It helps our teachers scaffold instruction to build comprehension.”
Wonders digital resources continue to help Miami-Dade effectively address student and teacher mobility. Ms. De La Peña recommends the Wonders implementation course on ConnectED to principals, new teachers, and teachers who are new to a grade. “We simply do not have the staff to provide that training repetitively; we are a very large district and a very mobile district, so there are new teachers coming in and out of our schools continuously,” she noted, “as years go by, principals will move teachers from grade level to grade level, and that can be a pretty big paradigm shift. Therefore, having digital resources readily available is very helpful to school-site administrators and teachers.”
Miami-Dade
FSA 2015–2017
State of Florida
2015
52%53%54%55%56%57%58%
2016 2017
Third Grade Level 3 or Higher
Fifth Grade Level 3 or Higher
Fourth Grade Level 3 or Higher
2015
51%52%53%54%55%56%57%
2016 2017
2015
51%52%53%54%55%56%57%
2016 2017
Efficacy and Success | Miami-Dade County Public Schools
Miami-Dade County Public Schools Solution (continued)

Lincoln Public Schools PercentProficient NeSA—Reading
2013
82%83%84%85%86%87%88%89%
80%81%
ThirdGrade
FourthGradeYear Fifth
Grade
83%
82%
85%
88%
2013
2014
2015
2016
83%
83%
84%
88%
83%
81%
85%
87%
2014 2015 2016
15
Lincoln Public Schools Reading Scores Trending Upward With Continued Use and Refinement of WondersIn 2013, Lincoln Public Schools (LPS) educators were searching for a core literacy program that would get them ahead of the curve in the adoption and implementation of a standards-based curriculum. After a careful and thorough pilot process—in which pilot teachers especially enjoyed the text complexity and genre variety in the program—LPS selected Wonders as their core ELA curriculum.
Several years after Lincoln’s 2013 implementation of Wonders, the district is showing clear evidence of success. Since implementation, LPS students have trended upwards on the reading portions of the Nebraska State Assessments (NeSA) for grades three, four, and five. This upward trend culminated in all-time high percentages of students scoring proficient on the 2016 NeSA in grades three, four, and five. Additionally, in these grades, the percentage of LPS students scoring proficient in reading exceeded the state average.
Why has the partnership been so beneficial? In addition to the ease of implementation and the immediate approval from students, Lincoln teachers have been most impressed with the high quality of Wonders content and the research-based instructional practices in the program. LPS has found success using Wonders in a blended learning format, taking full advantage of the program’s robust and engaging print and digital features.
“Continued use and refinement of the rigorous instruction in McGraw Hill’s Wonders curriculum has led to
increases in reading scores.”
Lincoln Public Schools | Efficacy and Success

Delta Elementary Charter School: Finding Balance With WondersVanessa Belair has been an educator for 13 years. She spent 10 years as a classroom teacher and just finished her third year as principal of Delta Elementary Charter School. Principal Belair describes her school as a “rural charter school outside of Sacramento, California,” where about a third of the student population receives free and reduced lunch, and slightly more than a quarter are English Language Learners. In 2013, Delta Charter began the search for a new literacy curriculum for their school.
ChallengeIn the past, the curricula that Principal Belair used as a classroom teacher were not hitting the mark. “I was at a district-level school, and the curriculum was very rigid,” she shared. “As a teacher, you had to read verbatim what was printed in the book. Then I taught at a private school where I had no program to support me at all.” Her list of requirements for Delta Charter’s new ELA program included a proven research base, a strong close-reading strategy, a flexible instructional model, and support for the shifts in ELA standards.
SolutionAs Delta Charter began their search, Wonders came highly recommended by an administrator in a neighboring district that had adopted it the previous school year. From her research, Mrs. Belair felt that “Wonders knew what it was doing with close reading strategy and was on the forefront of the shifts” to the new standards. She was impressed by the research behind the program and the flexibility of Wonders and appreciated the candid discussions she was able to have with her sales representative. After determining that their requirements would be met, Delta Charter implemented Wonders in grades K–6 for the 2014–2015 school year.
Delta Charter Elementary School ResultsDelta Charter has been using Wonders since it was originally implemented in 2014. Mrs. Belair reports that the teachers at Delta Charter “all enjoy using the Reading/Writing Workshop” and “love the differentiation in Wonders.” Whether a student is approaching level, on level, beyond level, or an English language learner, the differentiation supports provide equity of access for all learners. The teachers refer to the differentiated instruction as WINN—“What I Need Now time”—and have indicated that it’s really helpful to students at all levels.
16
“Wonders knew what it was doing with close reading strategy and was on the forefront of the shifts.”
Efficacy and Success | Delta Elementary Charter School
Quantitative results, tables, and figures on the following page.

17
It’s been the right fit for the school, according to Principal Belair. “With charter schools comes freedom,” she commented, and Wonders has provided her teachers with the flexible instructional model she was looking for, along with the freedom to implement the program based on their students’ needs and their professional judgment.
When asked how Wonders differs from other reading programs, Mrs. Belair replied, “I like the balance. I like that Wonders is a curriculum you can jump right into. Our new teachers appreciate the structure the Wonders curriculum gives them because, without that, it can be really overwhelming for new teachers.” Some of her more experienced teachers choose to use Wonders in a less structured and more flexible fashion—several treat the curriculum as a guide to ensure consistency of instruction, while others have adopted it as a set of resources so they “don’t have to find ways to create their own.” Principal Belair is supportive of these various models and said, “Teachers have different avenues of being successful; as long as they are successful, it doesn’t matter what avenue they take.”
Note: We understand that class performance can improve due to a number of factors, including the innate and prior education of the students participating, as well as differences among professors and their pedagogies. We believe that even taking these into account, Wonders can contribute to improvements in student outcomes.
Percent of Students Who Met or Exceeded ELA Standards onthe California Smarter Balanced Assessment by Cohort
2015 2016
Third Grade Fourth Grade Fourth Grade Fifth Grade
Delta Elementary Charter School80%
0%
10%
20%
30%
40%
50%
60%
70%
63%46% 45%40%
Delta Elementary Charter School | Efficacy and Success

18
California ELA Test Score Analysis: Wonders Research ReportReview of Smarter Balanced Assessment Achievement Levels in California Districts That Use WondersOverviewAnalysis of Smarter Balanced test results from every California district that implemented Wonders before 2015 shows a pattern of increasing performance for students in districts in year one and two of standard implementations of Wonders across the state. Analyses of student cohorts reveal an average increase of 8.6 percentage points in the proportion of students meeting and exceeding grade standards in English language arts/literacy in these districts/schools. Cohort increases range from five percentage points (Antioch Unified 2015 fourth grade to 2016 fifth grade) to 18 percentage points (Bellevue Union 2015 fourth grade to 2016 fifth grade).
Key Findings• Nearly every cohort (13 of 14) from Wonders districts/schools increased the percentage of students
meeting or exceeding standards from 2015 to 2016. (Table 1)• The average increase in percentage of students meeting or exceeding standards from 2015 to 2016 was
greater for Wonders districts than the state average. (Figure 1) • Every cohort from the districts/schools that implemented Wonders in fall 2014 showed increases from:
2015–2016. (Figures 2–5)• The percent of students meeting or exceeding ELA standards grew by an average of 8.4 percentage
points from 2015 to 2016 in districts/schools that started using Wonders in fall 2014.• Among the districts that implemented Wonders in fall 2013, the percent of students meeting or exceeding
ELA standards grew by an average of 9 percentage points from 2015 to 2016.
Tables and figures on the following pages.
Efficacy and Success | California ELA Test Score Analysis

19
Table 1Percentage of Students Meeting or Exceeding Standard for ELA on Smarter Balanced Assessment
Figure 1Average Percentage Point Increase in Students Meeting/Exceeding ELA Standard: 2015–2016
Wonders Districts vs. California State Average The average increase in the percentage of students meeting or exceeding the ELA standard of the Smarter Balanced Assessment from 2015 to 2016 was greater for Wonders districts than the state average.
Cohort A Cohort B
DistrictWonders
Implementation Term
Third Grade(2015)
Fourth Grade (2015)
Increase (in %
points)
Fourth Grade (2015)
Fifth Grade (2016)
Increase (in %
points)
Adelanto Fall 2014 16% 25% 9 19% 28% 9
Antioch Fall 2014 25% 31% 6 29% 34% 5
Bellevue Fall 2013 28% 28% 0 14% 32% 18
Brentwood Fall 2014 51% 58% 7 49% 58% 9
Delta Elementary Charter School Fall 2014 46% 63% 17 40% 45% 5
Lakeside Fall 2013 10% 20% 10 11% 19% 8
Visalia Fall 2013 32% 40% 8 34% 44% 10
State of California N/A 38% 44% 6 40% 49% 9
0
1
2
3
4
5
7
6
8
9
8.1
CA
Grades Three to Four Grades Four to Five Total
6
9.19 8.67.5
10
Wonders
California ELA Test Score Analysis | Efficacy and Success

25% 28%
10%
20%
0%
30%
40%
50%
60%
Third Grade Fourth Grade Fourth Grade Fifth Grade
KEY
2015
2016
16% 19%
20
Figure 3Percent of Students Who Met or Exceeded Standard by Cohort: Antioch Unified School District
Figure 2Percent of Students Who Met or Exceeded Standard by Cohort: Adelanto ESD
California Districts that Implemented Wonders in Fall 2014 Each of the eight cohorts from the districts that implemented Wonders in fall 2014 showed increases in the proportion of students who met or exceeded the ELA standard on the Smarter Balanced Assessment from 2015 to 2016.
The percent of students meeting or exceeding ELA standards grew by an average of 8.4 percentage points from 2015 to 2016 in districts that began using Wonders in fall 2014.
10%
20%
0%
30%
40%
50%
60%
Third Grade Fourth Grade Fourth Grade Fifth Grade
KEY
2015
201625%31% 29% 34%
Efficacy and Success | California ELA Test Score Analysis

21
Figure 4Percent of Students Who Met or Exceeded Standard by Cohort: Brentwood Union ESD
Figure 5Percent of Students Who Met or Exceeded Standard by Cohort: Delta Elementary Charter School
Figure 6Percent of Students Who Met or Exceeded Standard by Cohort: Bellevue Union ESD
California Districts that Implemented Wonders in Fall 2013Districts that implemented Wonders in fall 2013 averaged a nine percentage point increase in the proportion of students meeting or exceeding the ELA standards on the Smarter Balanced Assessment from 2015 to 2016.
10%
20%
0%
30%
40%
50%
60%
Third Grade Fourth Grade Fourth Grade Fifth Grade
KEY
2015
201628% 28%
14%
32%
10%
20%
0%
30%
40%
50%
60%
Third Grade Fourth Grade Fourth Grade Fifth Grade
KEY
2015
2016
51%
63%
40% 45%
10%
20%
0%
30%
40%
50%
60%
Third Grade Fourth Grade Fourth Grade Fifth Grade
KEY
2015
2016
58%51% 49%
58%
California ELA Test Score Analysis | Efficacy and Success

22
Figure 7Percent of Students Who Met or Exceeded Standard by Cohort: Brentwood Union ESD
Figure 8Percent of Students Who Met or Exceeded Standard by Cohort: Delta Elementary Charter School
Analysis Procedure The findings presented above are from a series of test score achievement-level comparisons from several districts in the state of California. The analyses are based on publicly available data from the California Assessment of Student Performance and Progress (CAASPP) website. All comparisons are made across years by cohort, as demonstrated by the CAASPP test results online dashboard. The website explains these comparisons: “For example, if grade four is selected, then 2016 results for grade four and 2015 results for grade three will appear. Please note that the data is populating at the entity level, so students whose results are shown for the previous year may not be the exact same group as the students whose data is being shown for the current year.” Given that the state uses this method of comparison as their preferred approach, the findings presented in this report are based on analyses of test score achievement levels using this approach.
Note: Class performance can improve due to a number of factors, including the innate ability and prior education of the students participating, as well as differences among teachers and their pedagogies. We believe that, even taking these factors into account, Wonders can contribute to improvements in student outcomes.
10%
20%
0%
30%
40%
50%
60%
Third Grade Fourth Grade Fourth Grade Fifth Grade
KEY
2015
201632%
40%34%
44%
10%
20%
0%
30%
40%
50%
60%
Third Grade Fourth Grade Fourth Grade Fifth Grade
KEY
2015
201610%20%
11%19%
Efficacy and Success | California ELA Test Score Analysis
California Districts that Implemented Wonders in Fall 2013 (continued)

Wondersn=176
Program An=264
Program Bn=194
Favorable opinion of product/program 31% 23% 18%
Recognition 50% 38% 27%
Ease of use 48% 30% 30%
Relevance to educators 47% 27% 29%
Relevance to students 45% 25% 33%
Technology 42% 21% 24%
Efficacy 36% 22% 25%
Quality 33% 18% 21%
Value 31% 15% 18%
Uniqueness 27% 12% 17%
23
Educator Perception StudyIn May 2017, we conducted a proprietary blind quantitative study to identify perceptions of McGraw Hill and key competitor programs among K–12 teachers and administrators. From May 3–14, 2017, a total of 3,875 responses were received, with 375 pertaining to core elementary (K–5) ELA programs. Respondents evaluated Wonders and other market-leading programs. Results showed that 1) Wonders was viewed by educators more favorably than all competitor programs, per top two box ratings on a seven-point scale, and 2) Wonders outperformed all programs on perceptions of ease of use and led the industry on all other attributes—recognition, relevance, technology, efficacy, quality, value, and uniqueness, per top two box ratings on a five-point scale.
McGraw Hill School Product Awareness and Perceptions Survey, May 2017
0%
10%
20%
30%
40%
50%
Recognition Easeof use
Relevance foreducators
Relevance tostudents
Technology E�cacy Quality Value Uniqueness
Program AWonders Program B
Favorable opinion of product orprogram
% favorable reflects top two box ratings on a seven-point scale; product perceptions reflect top two box ratings on a five-point scale.
Educator Perception | Efficacy and Success

Every Student is a Success Story
For more information, please visit:
mheonline.com/getwonders
L1.1028372