woking capital
TRANSCRIPT

CHAPTER-IINTRODUCTION
1

INTRODUCTION OF FINANCE
Finance is the lifeblood of the organization, irrespective of its size and mission.
Management of finance in the organization has been changing at a rapid place after the
inception of the computers in the field. in the modern phase the financial manager is not in a
passive role of a scorekeeper of accounting information and arranging funds, whenever
diversified to do so. rather, he is confronted with the various issues and decisions to ensure
that the funds are raised economically and canalized in the most effective manner.
The information of recent economic policies and fiscal policies has further order
changes in competitiveness of India n industry. some of the main measures like
liberalization, globalization, encouraging foreign direct investments and foreign institutional
investments have made the financial manager to have broader and foresighted outlook
indicating the financial implication like
What kind of plant and machinery should the firm buy?
How should it raise finance?
How much should it invest in inventories?
How should its credit policies be?
How much profit should it secure on sales keeping an eye on competitors?
Accounting is the language of business the important stage of accounting are passing
journal entries in the book; posting them into the ledger, balancing the accounts and
preparing the trial balance preparation of final statement of accounts. Final statement of
accounts can also be called as financial statements. The term ‘final statements’ as used in
accounting, refers to two statements:
2

Profit and loss accounts (income statement) and balance sheet.
The purpose of preparing profit and loss account is to ascertain the net result of
trading activities carried on during a particular period, generally on a year. the profit and
loss ascertain by preparing the profit and loss account will have its own impact on owner’s
equity. Balance sheet is prepared with a view to know/show the financial position of the
business unit on a given date, generally the date of business year ending. in case of joint
stock company, financial statement include ‘profit and loss account’ also accounting
principles, concepts and conventions are not only followed in making the journal entries and
posting them into the ledger but also in preparing the final statement of accounts.
The financial statements provide rich information about the operation results and the
financial position of a business enterprise. The financial statements are of much interest to a
number of groups of persons. Management requires them for the purpose of evaluation of
trading activities and decision-making. Apart from the management, there are certain other
interested persons such as shareholders, debenture holders, investors, bankers, govt. trade
creditors, journalists, legislators, researchers and the like.
Financial Statements
Accounting process starts with recording day-to-day business transaction in journal
and ends with the preparation of final/financial statements of accounts.
Financial statements are prepared for the purpose of presenting a periodical
review achieved during the period under review. They reflect a combination of recorded
facts, accounting principles and personal judgments.
American institute of accountant.
3

NEED FOR STUDY
In order to maintain revenue from operations every firm needed certain amount of
current assets for example cash is in require to pay for expenses or to meet obligation for
service received etc. By a firm identical plan inventories are required to provide the link
between production and sales similarly accounts receivables generate when goods are sold
on credit.
Needless to maintain cash, bank, debtors, bills receivables, closing stock (including
raw material work-in progress finished goods) prepayments certain other deposits and invest
which are temporary in nature represents current assets of a firm.
4

SCOPE AND PERIOD OF THE STUDY
The scope of the study is defined below in term of concepts adopted and period
under focus.
First the study management or working capital is confined only to the Kotak
Mahindra Bank.
Secondly, the binary concepts o working capital i.e. gross and net are used in
measuring profitability and liquidity respectively and also to arrive at various objectives of
the study.
5

OBJECTIVES OF THE STUDY:
To study the liquidity position of the Kotak Mahindra Bank
To study the working capital position of the company.
To study the changes in the networking capital during the study period.
To study the short-term financial position of the Kotak Mahindra Bank by analyzing
different ratios.
To analyze the financial position of the company using working capital.
6

LIMITATIONS OF THE STUDY
1) The information provided in the company balance sheet is only the data source
available.
2) Some required secondary data which is not provided by company.
3) The information available in the balance sheet have taken from the published annual
reports, so it has only limitations.
4) Since financial matters are sensitive in nature the same could not be acquired easily.
5) There is only two months period two finish the project, due to lack of time in depth
so financial matters have not been touched.
6) More dependency on secondary.
SOURCES OF DATA
1) Primary data
2) Secondary data
PRIMARY DATA:
Primary data is collected through from the discussions from the personal contact
from the financial offices in the Kotak Mahindra Bank.
SECONDARY DATA:
Secondary data is collected from the annual reports of Kotak Mahindra Bank during
for the last five years. And various other reports like company’s magazines journals
published books and journals and web sites.
7

CHAPTER-II
REVIEW OF LITERATURE
8

REVIEW OF LITERATURE
WORKING CAPITAL MANAGEMENT
INTRODUCTION:
Capital required for a business can be classified under two main categories viz.
(i) Fixed capital, and
(ii) Working capital
Every business needs funds for two purposes- for its establishment and to carry out
its day-to-day operations. Long-term funds are required to create production facilities
through purchase of fixed assets such as plant and machinery, land, building, furniture, etc.
Investments in these assets represent that part of firm’s capital which is blocked on a
permanent or fixed basis and is called fixed capital. Funds are also needed foe short-term
purposes for the purchase of raw materials, payment of wages and other day-to-day
expenses, etc. These funds are known as working capital. In simple words, working capital
refers to tat part of the firm’s capital which is required for financing short term or current
assets keep revolving fast and being constantly converted into cash and this cash flows out
again in exchange for other current assets. Hence, it is also known as revolving or
circulating capital or short-term capital.
In the words of Shubin, “working capital is the amount of funds necessary to cover
the cost of operating the enterprise. “
According to Genestenberg, “ Circulating capital means current assets of a company
that are changed in the ordinary course of business from to another, as for example, from
cash to inventories, inventories to receivables, receivables into cash.
9

Concept Time
Gross Working Capital
NetWorking Capital
PermanentWorking Capital
Temporary Working Capital
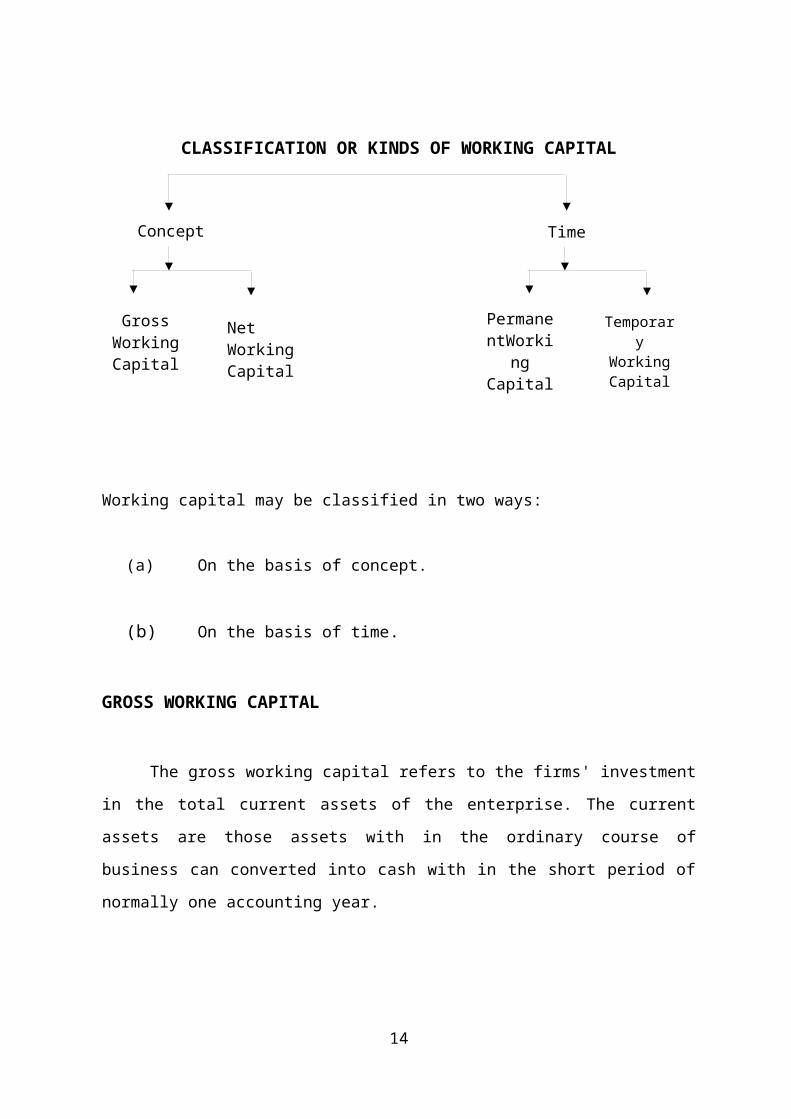
CLASSIFICATION OR KINDS OF WORKING CAPITAL
Working capital may be classified in two ways:
(a) On the basis of concept.
(b) On the basis of time.
GROSS WORKING CAPITAL
The gross working capital refers to the firms' investment in the total current assets of
the enterprise. The current assets are those assets with in the ordinary course of business can
converted into cash with in the short period of normally one accounting year.
10

NET WORKING CAPITAL
The net working capital can be defined into two ways the most common definition of
working capital is difference between current assets and current liabilities.
Net working capital can also be defined as that portion of firm's current assets.
Which are financed with long-term funds?
On the basis of concept, working capital is classified as gross working capital and net
working capital as discussed earlier. This classification is important from the point of view
of the financial manager. On the basis of time, working capital may be classified as:
1. Permanent or fixed working capital.
2. Temporary or variable working capital.
1. Permanent or fixed working capital.
Permanent or fixed working capital is the minimum amount which is required to
ensure effective utilization of fixed facilities and for maintaining the circulation of current
assets. There is always a minimum level of current assets which is continuously required by
the enterprise to carry out its normal business operations. For example, every firm has to
maintain a minimum level of raw materials, work-in-process, finished goods and cash
balance. This minimum level of current assets is called permanent or fixed working capital.
2. Temporary or variable working capital.
Temporary or variable working capital is the amount of working capital which is
required to meet the seasonal demands and some special exigencies. Most of the enterprises
have to provide additional working capital to meet the seasonal and special needs. The
capital required to meet the seasonal needs of the enterprise is called seasonal working
capital. Special working capital is that part of working capital which is required to meet
special exigencies such as launching of extensive marketing campaigns for conducting
research, etc.
11

IMPORTANCE OR ADVANTAGES OF ADEQUATE WORKING CAPITAL
Working capital is the life of blood and nerve canter of a business. Just as circulation
of blood is essential in the human body for maintaining life, working capital is very essential
to maintain the smooth running of a business. No business can run successfully without an
adequate amount of working capital. The main advantages of maintaining adequate amount
of working capital are as follows:
1. Solvency of the business. Adequate working capital helps in maintaining
solvency of the business by providing uninterrupted flow of production.
2. Good will. Sufficient working capital enables a business concern to make
prompt payments and hence helps in creating and maintaining goodwill.
3. Easy loans. A concern having adequate working capital, high solvency and
good credit standing can arrange loans from banks and others on easy and
favorable terms.
4. Cash discounts. Adequate working capital also enables a concern to avail cash
discounts on the purchase and hence it reduces costs.
5. Regular supply of raw materials. Sufficient working capital ensures regular
supply of raw materials and continuous production.
6. Regular payment of salaries, wages and other day-to-day
commitments. A company which has ample working capital can make regular
payment of salaries, wages and other day-to-day commitments which raises the
morale of its employees, increases their efficiency, reduces wastages and costs
and enhances production and profits.
7. Exploitation of favorable market conditions. Only concerns with adequate
working capital can exploit favorable market conditions such as purchasing its
requirement in bulk when the prices are lower and by holding its inventories for
higher prices.
8. Ability to face crisis. Adequate working capital enables a concern to face
business crisis in emergencies such as depression because during such periods,
generally, there is much pressure on working capital.
12

9. Quick and regular return on investments. Every Investor wants a quick
and regular return on his investments. Sufficiency of working capital enables a
concern to pay quick and regular dividends to its investors as there may not be
much pressure to plough back profits. This gains the confidence of its investors
and creates a favorable market to raise additional funds in the future.
10. High morale. Adequacy of working capital creates an environment of security,
confidence, high morale and creates overall efficiency in a business.
EXCESS OR INADEQUATE WORKING CAPTIAL
Every business concern should have adequate working capital to run its business
operations. It should have neither redundant or excess working capital nor inadequate nor
shortage of working capital. Both excess as well as short working capital positions are bad
for any business. However, out of the two, it is the inadequacy of working capital which is
more dangerous from the point of view of the firm.
Disadvantages of Redundant or Excessive Working Capital
1. Excessive Working Capital means idle funds which earn no profits for the
business and hence the business cannot earn a proper rate of return on its
investments.
2. When there is a redundant working capital, it may lead to unnecessary
purchasing and accumulation of inventories causing more chances of theft, waste
and losses.
3. Excessive working capital implies excessive debtors and defective credit policy
which may cause higher incidence of bad debts.
4. It may result into overall inefficiency in the organization.
5. When there is excessive working capital, relations with banks and other financial
institutions may not be maintained.
6. Due to low rate of return on investments, the value of shares may also fall.
7. The redundant working capital gives rise to speculative transactions.
13
Disadvantages of Inadequate Working Capital
1. A concern which has inadequate working capital cannot pay its short-term
liabilities in time. Thus, it will lose its reputation and shall not be able to get good
credit facilities.
2. It cannot buy its requirements in bulk and cannot avail of discounts, etc.
3. It becomes difficult for the firm to exploit favorable market conditions and
undertake profitable projects due to lack of working capital.
4. The firm cannot pay day-to-day expenses of its operations and it creates
inefficiencies, increases costs and reduces the profits of the business.
5. It becomes impossible to utilize efficiency the fixed assets due to non-availability
of liquid funds.
6. The rate of return on investments also falls with the shortage of working capital.
THE NEED OR OBJECTS OF WORKING CAPITAL
The needs for working capital cannot be over emphasized. Every business needs
some amount of working capital. The needs for working capital arises due to the time gap
between productions and realization of cash from sales. There is an operating cycle involved
in the sales and realization of cash. There are time gaps in purchase of raw materials and
production; production and sales; and sales and realization of cash. Thus working capital is
needed for the following purpose:
For the purchase of raw materials, components and spares.
1. To pay wages and salaries.
2. To incur day- to-day expenses and overhead costs such as fuel, power and
office expenses, etc.
3. To meet the selling costs as packing, advertising, etc.
4. To provide credit facilities to the customers.
5. To maintain the inventories of raw material, work-in-progress, stores and
spares and finished stock.
14

FACTORS DETERMINING THE WORKING CAPTIAL REQUIREMENTS
The working capital requirements of a concern depend upon a large number of
factors such as
1. Nature or Character of Business. The working capital requirements of a firm
basically depend upon the nature of its business. Public utility undertakings like
Electricity, Water Supply and Railways need very limited working capital because they
offer cash sales only and supply services, not products, and as such no funds are tied up
in inventories and receivables. On the other hand trading and financial firms require less
investments in fixed assets but have to invest large amounts in current assets like
inventories, receivables and cash; as such they need large amount of working capital.
2. Size of Business/Scale of Operations. The working capital requirements of a
concern are directly influenced by the size of its business which may be measured in
terms of scale of operations. Greater the size of a business unit, generally larger will be
the requirements of working capital. However, in some cases even a smaller concern
may need more working capital due to high overhead charges, inefficient use of
available resources and other economic disadvantages of small size.
3. Production Policy. In certain industries the demand is subject to wide fluctuations due
to seasonal variations. The requirements of working capital, in such cases, depend upon
the production policy. The production could be kept either steady by accumulating
inventories during slack periods with a view to meet high demand during the peak
season or the production could be curtailed during the slack season and increased during
the peak season. If the policy is to keep production steady by accumulating inventories it
will require higher working capital.
4. Manufacturing Process/Length of Production Cycle. In manufacturing business,
the requirements of working capital increase in direct proportion to length of
manufacturing process. Longer the process period of manufacture, larger is the amount
of working capital required. The longer the manufacturing time, the raw materials and
other supplies have to be carried for a longer period in the process with progressive
increment of labour and service costs before the finished product is finally obtained.
15

5. Seasonal Variations. In certain industries raw materials is not available throughout
the year. They have to buy raw materials in bulk during the season to ensure an
uninterrupted flow and process them during the entire year. A huge amount is, thus,
blocked in the form of material inventories during such season, which gives rise to more
working capital requirements. Generally, during the busy season, a firm requires larger
working capital than in the slack season.
6. Working Capital Cycle. In a manufacturing concern, the working capital cycle starts
with the purchase of raw material and ends with the realization of cash from the sale of
finished products. The cycle involves purchase of raw materials and stores, its
conversion into stocks of finished goods through work-in-progress with progressive
increment of labour and services costs, conversion of finished stock into sales, debtors
and receivables and ultimately realization of cash and this cycle continues again from
cash to purchase of raw material and so on
The speed with which the working capital completes one cycle determines the
requirements of working capital-longer the period of the cycle larger are the requirement of
working capital.
16

PRINCIPLES OF WORKING CAPITAL MANAGEMENT/POLICY
The following are the general principal of a sound working capital management
policy:
1. Principle of Risk Variation. Risk here refers to the inability of a firm to meet
its obligations as and when they become due for payment. Larger investment in
current assets with less dependence on short-term borrowings increases liquidity,
reduces dependence on short-term borrowing increases liquidity, reduces risk and
thereby decreases the opportunity for gain or loss. On the other hand less
investment in current assets with greater dependence on short-term borrowing
increases risk, reduces liquidity and increases profitability. In other words, there
is a definite inverse relationship between the degree of risk and profitability. A
conservative management prefers to minimize risk by maintaining a higher level
of current assets or working capital while a liberal management should be
establish a suitable trade off between profitability and risk. The various working
capital policies indicating the relationship between current assets and sales are
depicted below:
2. Principle of Cost of Capital. The various sources of raising working capital
finance have different cost of capital and the degree of risk involved. Generally,
higher the risk lower is the cost and lower the risk higher is the cost. A sound
working capital management should always try to achieve a proper balance
between these two.
3. Principle of Equity Position. This principle is concerned with planning the
total investment in current assets. According to this principle, the amount of
working capital invested in each component should be adequately justified by a
firm’s equity position. Every rupee invested in the current assets should
contribute to the net worth of the firm. The level of current assets may be
measured with the help of two ratios: (i) current assets as a percentage of total
assets and (ii )current assets as a percentage of total sales. While deciding about
the composition of current assets, the financial manager considers the relevant
industrial averages.
17

4. Principle of Maturity of payment. This principle is concerned with planning
the sources of finance for working capital. According to this principle, a firm
should make every effort to relate maturities of payment to its flow of internally
generated funds. Maturity pattern of various current obligations is an important
factor in risk assumptions and risk assessments. Generally,
shorter the maturity schedule of current liabilities in relation to expected cash
inflows, the greater the inability to meet its obligations in time.
ESTIMATED WORKING CAPITAL REQUIREMENT:
“Working capital is the life-blood and controlling nerve centre of business.” No
business can be successfully run without an adequate amount of working capital. To avoid
the shortage of working capital at once, an estimate of working capital requirements should
be made in advance so that arrangements can be made to procure adequate working capital.
But estimation of working capital requirements is not an easy task and a large number of
factors have to be considered before starting this exercise.
18

COMPONENTS OF CURRENT ASSETS:
(i) Cash (in hand, in bank, and in transit)
(ii) Investments (short-term only, and not long-term)
(iii) Inventories (raw materials and consumable stores and spares, work-
in-process, and finished goods)
(iv) Sundry Debtors (also known Bills Receivable and Accounts
Receivable)
(v) Loans and advances (granted by the Company)
COMPONENTS OF CURRENT LIABILITIES
(i) Sundry Creditors (also known as Bills Payable and Accounts Payable)
(ii) Trade Advances (given to the company for supply of goods)
(iii) Short-term Borrowings from Banks and Others
(iv) Provisions (for taxes, bad debts, exchange rate fluctuations, etc.)
Better business sense, however, calls for keeping the currents assets at the minimal
level, whereby minimum sources of funds, (both current and non-current Liabilities), may be
required to finance them, and thereby, the “inventory carrying Costs”, and the “interests
outgo” may as well be kept at the minimal level
19

WHY WORKING CAPITAL MANAGEMENT
Effective management and control of the various components of working capital has
been rated as one of the most important and vital functions of financial management in any
of the industrial and business units, based on varied parameters, discussed hereunder:
A. Flexibility
Working capital Management is highly flexible in nature, so much so that it can very
easily be adapted to suit even extreme conditions, like rising and falling demands in peak
and off seasons, buoyant and sluggish economic and market conditions, etc. Further, if some
inappropriate policy or procedure is detected at a later stage, remedial and right steps can be
adopted henceforth, any time. This, however, is not the position in the case of project
management.
B. Level of investments in various components of current assets
Investments in current assets constitute a very substantial percentage (Usually more than
50%) of the total investments in most of the Indian companies and firms.
C. Criticality
The under mentioned fact itself can bring home the extent of crucially and Criticality of
Working Capital Management.
One of the components of the Working Capital can make such a dramatic difference, the
importance of meticulous management of all the components of the Working Capital (viz.
Current Assets, Current Liabilities and even a portion of the deferred liabilities) can very
well be imagined and appreciated.
D. Quantum of efforts and time
Empirical study and observations have revealed that a major portion of the time of the
Finance Managers, in most of the companies, is devoted (and rightly so) towards the
management of the various components of the working capital, with a view to maximizing
their profitability, and the prospects and prosperity therewith.
20

CHAPTER-III
COMPANY PROFILE
21

COMPANY PROFILE
Kotak Mahindra Mutual Fund
Kotak Mahindra mutual fund is one of the
leading mutual funds in the country with assets of over
Rs.12, 530 crore under management as of Aug 2006. Kotak Mahindra Bank, one of India’s
leading financial institutions that offer financial solutions ranging from commercial banking,
stock broking, life insurance and investment banking, promotes the fund.
Kotak Mahindra Asset Management Company Limited, a wholly owned subsidiary of Kotak
Mahindra Bank, is the asset manager for Kotak Mahindra mutual fund. The company is
headed by Uday Kotak of Kotak Bank as chairman and Sandesh Kirkire,
chiefexecutiveofficer, heads the fund management function.
Kotak Mahindra mutual fund launched its schemes in December 1998 and today
manages assets of 4,34,504 investors in various schemes. Kotak Mahindra mutual fund was
the first fund house in the country to launch a dedicated gilt scheme investing only in
government securities.
22

Here is a list of mutual funds of Kotak Mahindra:
Debt Funds
KotakTwinAdvantageSeriesIII
KotakTwinAdvantageSeriesII
KotakBond
KotakFlexiDebt
KotakFloaterShortTerm
KotakFloaterLongTerm
KotakGilt
KotakIncomePlus
KotakLiquid
KotakCashPlus
Balance Funds
KotakBalance
Fund of Funds
KotakEquityFOF
KotakDynamicFOF
KotakFlexiFOF
KotakFlexiFOFSeriesI
KotakFlexiFOFSeriesII
EquityFunds
Kotak30
KotakContra
KotakGlobalIndia
KotakOpportunities
KotakTech
KotakMid-Cap
KotakMNC
KotakTaxSaver
Kotak Lifestyle
23

Kotak Mahindra is one of India's leading financial institutions, offering complete
financial solutions that encompass every sphere of life. From commercial banking, to stock
broking, to mutual funds, to life insurance, to investment banking, the group caters to the
financial needs of individuals and corporate.
The group has a net worth of around Rs.3,200 crore and employs around 10,800
employees across its various businesses servicing around 2.6 million customer accounts
through a distribution network of branches, franchisees, representative offices and satellite
offices across 300 cities and towns in India and offices in New York, London, Dubai,
Mauritius and Singapore.
Kotak Mahindra Asset Management Company Limited (KMAMC), a wholly owned
subsidiary of KMBL, is the Asset Manager for Kotak Mahindra Mutual Fund (KMMF).
KMAMC started operations in December 1998 and has over 4 Lac investors in various
schemes. KMMF offers schemes catering to investors with varying risk - return profiles and
was the first fund house in the country to launch a dedicated gilt scheme investing only in
government securities.
We are sponsored by Kotak Mahindra Bank Limited, one of India's fastest growing
banks, with a pedigree of over twenty years in the Indian Financial Markets. Kotak
Mahindra Asset Management Co. Ltd., a wholly owned subsidiary of the bank, is our
Investment Manager.
We made a humble beginning in the Mutual Fund space with the launch of our first
scheme in December 1998. Today we offer a complete bouquet of products and services
suiting the diverse and varying needs and risk-return profiles of our investors.
We are committed to offering innovative investment solutions and world-class services and
conveniences to facilitate wealth creation for our investors.
24

Welcome to the Services Section on Kotak Mutual.
A host of effective, hassle-free investment conveniences and facilities for you here.
All directed towards making investments with us a hassle free and pleasing experience. And
of course, to keep you updated on how your investments are faring. So that you can sit back
and relax while we serve you all you need on your desktop. Multi-channel Access to your
investments, Transactions across multiple channels, Systematic Transactions, Direct
Credit, ECS of Dividends, E-Mail Subscription Services & SMS Updates. And more in
the mill to make investing with us a delight for You may opt in for any of the facilities
schemes by filling a simple form provided in the common application form. The same
facilities can also be availed by filling the transaction slips. All the Kotak Facilities can be
availed at the time of making the investments or at any time during your investment tenure
with the fund.
Welcome to our Products Section.
25

In this section we would try updating you on the pulse of the markets, straight from
our Fund Managers through our weekly market review.
All recent happenings that have a bearing on the markets and on you for being connected
with it, be it the Union Budgets or the Credit Policy or any new regulations would feature in
this section.
Besides, you would find here our Fund Fact Sheet carrying the portfolio and
performance of our schemes, the half-yearly and annual financials of our schemes and more.
A large cap diversified scheme, which invests in companies with a medium to long-term view. The
scheme follows a bottom-up approach to stock selection. The fund has predominantly invested into
blue chip large market capitalization companies. Also small portion of the funds is invested in
medium capitalization companies, which have the potential to become blue chip companies of
tomorrow. Thus the investment strategy is to take balanced exposure across sectors while
maintaining less than 30% exposure to mid-cap stocks Indian Economy is expected to do well
over medium to long-term on back of favorable demographics fueling consumption demand,
growing exports and government's thrust on Infrastructure development. Corporate earnings
too have been on the rise as is evident from the robust tax collections. It is therefore
reasonable to expect India's growth momentum to sustain over a longer period. It is also
heartening to note that almost 67% of India's GDP is consumption led, rendering
sustainability to this growth engine. Equity as an asset class is typically recommended for
investors with a long-term horizon. Also to benefit from short-term volatility of markets,
SIP/STP is the preferred way of investing.
The key focus of the fund is to identify potential stocks that are likely and invest in
mid-cap companies that will become tomorrow's large-caps. The essence is to 'spot them
26

young and watch them grow'. It endeavors to take advantage of the successive waves of
opportunity provided by a transitioning economy. The portfolio would be diversified across
sectors, with adequate flexibility to move within sectors
Indian Economy is expected to do well over medium to long-term on back of
favorable demographics fueling consumption demand, growing exports and government's
thrust on Infrastructure development. Corporate earnings too have been on the rise as is
evident from the robust tax collections. It is therefore reasonable to expect India's growth
momentum to sustain over a longer period. It is also heartening to note that almost 67% of
India's GDP is consumption led, rendering sustainability to this growth engine. Equity as an
asset class is typically recommended for investors with a long-term horizon. Also to benefit
from short-term volatility of markets, SIP/STP is the preferred way of investing
Kotak Opportunities is a diversified equity scheme, with a flexible investing style. It
will invest in sectors, which the Fund Manager believes would outperform others in the
short to medium-term. By virtue of its flexible investment pattern , the fund is uniquely
positioned to increase concentration sectors which look promising. As markets evolve and
grow, new opportunities for growth keep emerging. Kotak Opportunities would endeavor to
capture these opportunities to generate wealth for its investors.
Indian Economy is expected to do well over medium to long-term on back of favorable
demographics fueling consumption demand, growing exports and government's thrust on
Infrastructure development. Corporate earnings too have been on the rise as is evident from the
robust tax collections. It is therefore reasonable to expect India's growth momentum to sustain over a
longer period. It is also heartening to note that almost 67% of India's GDP is consumption led,
rendering sustainability to this growth engine. Equity as an asset class is typically recommended for
investors with a long-term horizon. Also to benefit from short-term volatility of markets, SIP/STP is
the preferred way of investing
27

Kotak Lifestyle seeks to capitalize on the growing consumption boom in India. The
key drivers for the lifestyle theme are 4 A's viz Awareness, Availability, Aspiration and
Affordability. This together facilitates the consumption boom - the basic premise on which
the scheme evolves. The scheme would endeavor to invest across sectors and companies,
which would be the beneficiaries of this boom Indian Economy is expected to do well over
medium to long-term on back of favorable demographics fueling consumption demand,
growing exports and government's thrust on Infrastructure development. Corporate earnings
too have been on the rise as is evident from the robust tax collections. It is therefore
reasonable to expect India's growth momentum to sustain over a longer period. It is also
heartening to note that almost 67% of India's GDP is consumption led, rendering
sustainability to this growth engine. Equity as an asset class is typically recommended for
investors with a long-term horizon. Also to benefit from short-term volatility of markets,
SIP/STP is the preferred way of investing.
28

Directors :
Dr. Shankar Acharya, Non-Executive Part-time Chairman
Dr. Shankar Acharya, (66 years) B.A. (Hons.) from Oxford University and Ph.D.
(Economics) from Harvard University, has considerable experience in various fields of
economics and finance. He is a Honorary Professor at the Indian Council for Research on
International Economic Relations (ICRIER) and a Board Member of ICRIER and the
Administrative Staff College of India (ASCI). He was Chief Economic Adviser, Ministry of
Finance, Member, Securities and Exchange Board of India (SEBI) and Member, Twelfth
Finance Commission. He has held several senior positions in the World Bank, including
Director of World Development Report (1979) and Research Adviser. He was re-appointed
as the Non-Executive Chairman of the Bank at the Annual General Meeting held on 28th
July 2009 for a period of three years with effect from 20th July 2009. He is on the Board of
Eros International Media Ltd. and The South Asia Institute for Research and Policy (Private)
Limited, Sri Lanka. Dr. Acharya is the Chairman of the Audit Committee of the Bank,
Member of the Audit Committee of Eros International Media Limited and the Chairman of
the Shareholders’ Grievance/Investors’ Relations Committee of Eros International Media
Ltd.
29

Mr. Uday Kotak, Executive Vice-Chairman and Managing Director
Mr. Uday Kotak, (53 years) holds a Bachelor’s degree in Commerce and an MBA
from Jamnalal Bajaj Institute of Management Studies, Mumbai. He is the Executive Vice-
Chairman and Managing Director of the Bank and its principal founder and promoter. Under
Mr. Kotak’s leadership, over the past 26 years, Kotak Mahindra group established a
prominent presence in every area of financial services from stock broking, investment
banking, car finance, life insurance and mutual funds. Mr. Kotak is the recipient of several
prestigious awards. He is a member of the Government of India’s high level committee on
Financing Infrastructure, the Primary Market Advisory Committee of SEBI, Member of the
Board of Governors of Indian Council for Research on International Economic Relations,
National Institute of Securities Markets and National Council of CII and Chairman of the
CII Capital Markets Committee. He is also a Governing Member of the Mahindra United
World College of India.
Mr. C. Jayaram, Joint Managing Director
Mr. C. Jayaram, (56 years) B. A. (Economics), PGDM-IIM, Kolkata, is Joint
Managing Director of the Bank and is currently in charge of the Wealth Management
Business of the Kotak Group. He also oversees the international subsidiaries and the 30

alternate asset management business of the group. He has varied experience of over 34 years
in many areas of finance and business and was earlier the Managing Director of Kotak
Securities Limited. He has been with the Kotak Group for 22 years and has been
instrumental in building a number of new businesses at Kotak Group. Prior to joining the
Kotak Group, he was with Overseas Sanmar Financial Ltd.
Mr. Dipak Gupta, Joint Managing Director
Mr. Dipak Gupta, (51 years) B.E. (Electronics), PGDM-IIM, Ahmedabad, is the
Joint Managing Director of the Bank and has over 26 years of experience in the financial
services sector, 20 years of which have been with the Kotak Group. He is responsible for
Group HR, administration, infrastructure, operations and IT. He is also responsible for asset
reconstruction business of the Bank. Mr. Dipak Gupta was responsible for leading the Kotak
Group’s initiatives into the banking arena. He was the Executive Director of Kotak
Mahindra Prime Limited. Prior to joining the Kotak Group, he was with A. F. Ferguson &
Company for approximately six years.
31

Mr. Asim Ghosh
Mr. Asim Ghosh, (64 years) is a B.Tech, IIT Delhi and MBA from the Wharton
School, University of Pennsylvania. Mr. Ghosh commenced his career in consumer goods
marketing with Procter & Gamble in the U.S. and Canada and worked subsequently with
Rothmans International as a Senior Vice President of one of Canada’s major breweries. He
moved to Asia in 1989 as CEO of the Frito Lay (Pepsi Foods) start up in India. Thereafter,
he was in executive positions with Hutchison in Hong Kong and India for 16 years. He
continued as the CEO of Vodafone Essar Limited till 31st March 2009 and as a Non-
Executive Director till 9th February 2010. He is also on the Board of Husky Energy Inc.,
other Husky Group Companies and some Hutchison Whampoa Group Companies.
Mr. Prakash Apte
Mr. Prakash Apte, (58 years)B.E. (Mechanical), is presently the Chairman of
Syngenta India Limited, one of the leading agri business companies in India. Mr. Apte, in a
career spanning over 35 years has considerable experience in various areas of management
and business leadership. During more than 15 years of very successful leadership experience
in agri business, he has gained varied knowledge in various aspects of Indian Agri Sector
and has been involved with many initiatives for technology, knowledge and skills up
gradation in this sector, which is so vital for India’s food security. He was instrumental in 32

setting up the Syngenta Foundation India which focuses on providing knowledge and
support for adopting scientific growing systems to resource poor farmers and enabling their
access to market. He is a Director of Syngenta Foundation India and Kotak Mahindra Old
Mutual Life Insurance Limited. Mr. Apte is a member of Audit Committee of Syngenta
India Limited.
Mr. Amit Desai
Mr. Amit Desai, (53 years) B.Com, LLB, is an eminent professional with 31 years of
experience. He is also on the Board of Kotak Mahindra Trustee Company Limited and Terra
DeKM India Pvt. Ltd. Mr. Desai was a member of Audit Committee of Kotak Mahindra
Trustee Company Limited till 26th April 2014.
Mr. Narendra P. Sarda
Mr. N.P. Sarda, (66 years) B.Com, F.C.A., is a Chartered Accountant for more than
40 years. He is a former partner of M/s. DeloitteHaskin & Sells, Chartered Accountants, the
past President of the Institute of Chartered Accountants of India (in 1993) and was a public
representative Director of the Stock Exchange, Mumbai (BSE).
Prof. Mahendra Dev
Prof. S. Mahendra Dev is currently Director, Indira Gandhi Institute of Development
Research (IGIDR), Mumbai, India. He was Chairman of the Commission for Agricultural
Costs and Prices, Govt. of India, Delhi. He was Director, Centre for Economic and Social
33

Studies, Hyderabad for 9 years during 1999 to 2008. He received his PhD from the Delhi
School of Economics and his Post-doctoral research at the Economic Growth Centre, Yale
University and was faculty member at the Indira Gandhi Institute of Development Research,
Mumbai for 11 years. He was Senior Fellow at the Rajiv Gandhi Foundation during 1996-97
and Visiting Professor at the University of Bonn, Germany in 1999. He has written
extensively on agricultural development, poverty and public policy, food security,
employment guarantee schemes, social security, farm and non-farm employment.
Prof. Dev has more than 100 research publications in national and international
journals. He has been a consultant and adviser to many international organizations, such as
UNDP, World Bank, International Food Policy Research Institute, ILO, FAO, and ESCAP.
He also conducted collaborative projects with IFPRI on food security and poverty. He is the
Chairman of the Committee on Terms of Trade on agriculture constituted by the Ministry of
agriculture, Govt. of India. He is also member of the newly constituted Expert Panel on
poverty estimates chaired by Dr. C. Rangarajan.
He has been a member of several government committees including the Prime
Minister’s Task Force on Employment and Rangarajan Commission on Financial Inclusion.
He was member of several working groups for 9th, 10th and 11th Five Year Plans. He has
received honors for eminence in public service.
AWARDS AND ACHIEVEMENTS :34

Our commitment to excellence whether it’s in banking or insurance or stock broking or fund
management has earned us great recognition in India and internationally.
Recent awards:
Kotak Bond Regular Plan Growth won the Lipper Fund Award, 2014, for being the
Best Fund over 10 years Bond Indian Rupee
Received the Best Debt Fund House by Outlook Money Awards, 2014
Awarded Best Brokerage in India by FinanceAsia, 2014
Ranked 1st on a weighted formula basis in Institutional Investor's All- India
Research Team survey, 2014
KIE analysts ranked 1st in financial services and 3rd in the media sector in the Wall
Street Journal survey of Asia's best analysts, 2014
Emerged as the Best Local Brokerage in Asiamoney Brokers Poll, 2014 - Ranked
2nd for Best Overall Country Research among all domestic and foreign brokerages
Ranked 2nd for Best Overall Country Research among all domestic and foreign
brokerages
Ranked 2nd for Best Overall Country Research among all domestic and foreign
brokerages
Ranked 2nd for Best Execution among all domestic and foreign brokerages
Ranked 2nd for Most Independent Research Brokerage among all domestic and
foreign brokerages
Ranked 3rd for Best in Sales Trading among all domestic and foreign brokerages
Received the Best Investment Bank and Equity House in India award from Finance
Asia, 2014
Awarded Securities Advisory Firm of the Year in India in the Corporate INTL
Global Awards, 2014
35

Received the Investment Bank of the Year in India award at the ACQ Global
Awards, 2014
Awarded the Dealmaker of the Year for Qualified Institutional Placements by
Businessworld (India's Best Dealmakers, 2014)
Won the Deal of the Year for the M&M Financial Services Qualified Institutional
Placements – Businessworld (India's Best Dealmakers, 2014)
Awarded the Best Domestic Investment Bank by Asset Asian Awards, 2014
Our other awards include:
2011
Best Equity house in India – FinanceAsia Country Awards 2011
Best Domestic Equity House for 4 years in a row by Asiamoney in 2011
Best Private Banking Services Overall in India - Euromoney 2011
Best Investment Bank for 6 years in a row from 2006 to 2011, Finance Asia
2010
Kotak Bond Regular received the Lipper Fund Award 2010 for ‘Best Fund over 10
years Bond Indian Rupee’
Best Investment Bank for 6 years in a row from 2006 to 2010, Finance Asia
Best Range of Advisory Services Category - Euromoney 2010
Best Family Office Services Category - Euromoney 2010
Best Private Bank in India 2010 - Finance Asia Country Awards
2009
Kotak Mahindra Bank was adjudged the Best Private Bank in India at the Finance
Asia Country Awards 2009.
36

Kotak Mahindra Asset Management Company (KMAMC) adjudged Best Wealth
Creator (Best Debt Fund House category) - Outlook Money NDTV Profit Awards
2009.
Ranked amongst the ‘Top 25 Employers’ by Hewitt.
Kotak Mahindra (UK) Ltd. was awarded the ‘Asian Asset Manager of the Year’ at
the Global Investor Editorial Awards 2009 held in London.
Kotak Investment Banking was named ‘Best Investment Bank and “Best Equity
House in India” by FinanceAsia Best Bank Awards 2008 and was named “Best
Domestic Equity House” by Asia Money Best Bank Awards 2008.
Awarded the Best Domestic Investment Bank and the ‘Best Equity House’ in The
Asset Triple A Country Awards for the period October 1, 2007 to September 30,
2008.
2008
Kotak Investment Bank was awarded the “Best Investment Bank” in the domestic
category in India by Finance Asia for the second year in a row.
Kotak Mutual Fund-Kotak Bond Short Term won ICRA Mutual Fund Gold Award in
the short term Debt category for 1 year & 3 year – 2008
Kotak Mahindra Bank was awarded as Best Security Strategist by Microsoft India
and Best IT Implementation for Information security by PCQUEST
Kotak Bank emerged in top 3 in 23 categories, including No.1 in 11 categories in the
Euromoney Private Banking Poll 2008.
Kotak Mahindra Bank IT team got 4 awards (including Best IT Team of the year for
the 3rd consecutive year, at the annual BANKING Technology Awards 2008.
Kotak Securities was awarded Best Performing Equity Broker in India - CNBC TV
18" – Optimix Financial Advisory Awards, 2008
37

Kotak Mahindra Bank was in the Top 5 for Corporate Governance amongst
companies by technical criteria by IR Global Rankings 2008 for the Asia Pacific /
Africa region.
Kotak’s Investor Relation website was adjudged the most voted company in Asia
Pacific / Africa by IR Global Rankings 2008 in five categories; Corporate
Governance Practices, Financial Disclosure Procedures, IR Team, IR Program and
IR Website.
Housing Finance Division of the Bank won the award for “Best in Customer
Information and Responsiveness” among all HFI’s and Banks in the award hosted by
Maharashtra Chamber of Housing Industry (MCHI).
Kotak Investment Banking was ranked No. 1 for FY08 by Prime Database for two
league tables (a) India Domestic IPOs, (b) Qualified Institutional Placements
including Government Divestments.
Kotak Mutual Fund’s three equity schemes (Kotak 30, Kotak Opportunities and
Kotak Balance) have been ranked CPR 1 by CRISIL for Q4 FY08.
2007
Chosen the Best Local Private Bank – Overall in the Euromoney Awards 2007
Other categories that we topped at Euromoney Awards 2007 were User Friendly
Technology, Equity Portfolio Management, Managed Futures, Structured Products,
Corporate Advisory for Private Banking Clients, Tax and Guidance Services and
Specialized Services – Entrepreneurs.
Awarded the 10th Best Employer in the recently conducted Hewitt's Best Employers
in India 2007 Study
Best Investment Bank in India by Finance Asia
38

Most Popular Investor Relation Website for the Asia/Pacific Region conducted by IR
Global Rankings
Emerged winner in 16 categories in the Euromoney Private Banking Poll 2007,
including the Best local Private Bank
2006
"IT Team of the Year" award at the annual Banking Technology Awards 2006
Runner's up in the "Best Payments Initiative" category at the annual Banking
Technology Awards 2006
Kotak Securites was ranked The Most Customer Responsive Company for 2006
(Category - Financial Services) by Avaya Globalconnect
Awarded the Best Domestic Investment Bank and the Best Equity House in The
Asset Triple A Country Awards
Awarded Voice of Customers Award for the Best Passenger Vehicle Finance
Company in India in 2006 by Frost & Sullivan
Winner in 33 categories in the Asiamoney Private Banking Poll 2006 including the
Best Private Bank award in Southern Asia
Ranked no. 1 in six categories in the Annual Euromoney Private Banking Survey
Poll for 2006 for India
Best Investment Bank in India by Finance Asia
Ranked # 1 in the league table for Book runner/ Lead Manager in public equity
offerings in terms of the value of transactions completed during fiscal 2006
according to Prime Database
Best Broker in India by Finance Asia
Topped the Asiamoney 2006 Brokers Poll as the Best Local Broker
39

Adjudged the best Mutual Fund House in the NDTV Business Leadership Award
2006
Best Bond Fund Group over Three Years by Lipper Fund Awards India
Ranked the best debt fund over 5 years by Lipper for the Kotak Bond Regular Plan
Ranked ICRA-MFR1 and was the recipient of the Silver Award by ICRA for the
'Kotak Bond Regular Plan'
2005
Ranked as the top mergers & acquisitions advisor in India in terms of the value of
mergers & acquisitions deals announced from January to December 2005, according
to Bloomberg
Topped the India Advisory Partners Indata League table in terms of the value of
deals announced for the calendar year 2005
Ranked # 1 in the league table for Book runner/ Lead Manager in public equity
offerings in terms of the value of transactions completed during fiscal 2005
according to Prime Database
Best Broker in India by Finance Asia
Best Equity House in India by Euromoney
2004
Best Investment Bank in India by Finance Asia
Ranked # 1 in the league table for Book runner/ Lead Manager in public equity
offerings in terms of the value of transactions completed during fiscal 2004
according to Prime Database
Best Investment Bank in India by Global Finance
India's Best Equity House in India by Finance Asia
Best Equity House in India by Euromoney
40

Best Equity House in India by Asiamoney
Best India Equity House by IFR
2003
Best Investment Bank in India by Finance Asia
Ranked # 1 in the league table for Book runner/ Lead Manager in public equity
offerings in terms of the value of transactions completed during fiscal 2003,
according to Prime Database
Best Equity House in India by Euromoney
Best Equity House in India by Asiamoney
Products and services portfolio
• Retail and institutional broking
• Research for institutional and retail clients
• Distribution of financial products
• Corporate finance
• Net trading
• Depository services
• Commodities Broking
41
CHAPTER –IV
DATA ANALYSIS AND
INTERPRETATION
42

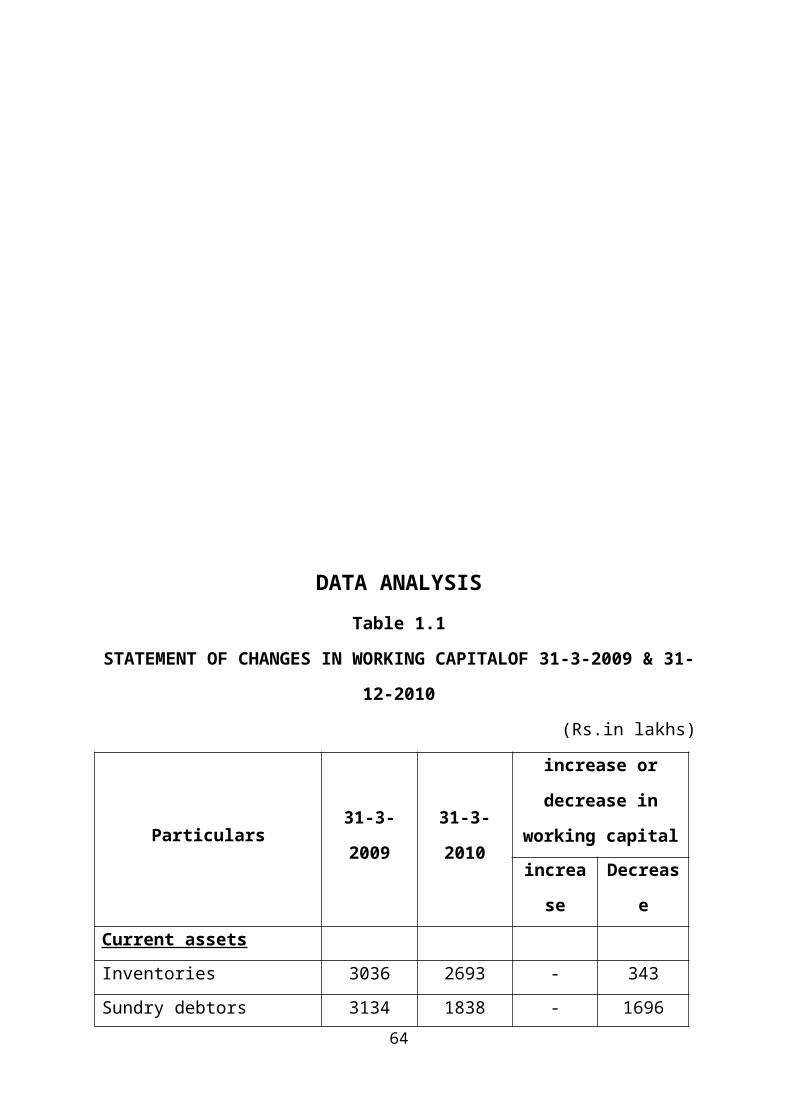
DATA ANALYSIS
Table 1.1
STATEMENT OF CHANGES IN WORKING CAPITALOF 31-3-2009 & 31-
12-2010
(Rs.in lakhs)
Particulars 31-3-2009 31-3-2010
increase or decrease
in working capital
increase Decrease
Current assets
Inventories 3036 2693 - 343
Sundry debtors 3134 1838 - 1696
Cash & bank 4164 1371 - 2793
Loans & advances 3744 1983 - 1763
Total current assets 14478 7885 - -
Current liabilities
Liabilities 3448 3557 - 109
Provisions 35 36 - 1
Total current liabilities 3483 3593 - -
NET Working capital 10996 4291 - -
INCREASE OR DECREASE
IN W.C 6705 6705
10996 10996 6705 6705
INTERPRETATION:
From the above table in the year 2009 the total assets are decreased by rs.9593 and
the total liabilities are increased by rs.110. Hence the working capital decreased by rs.6705
Table 1.2
43

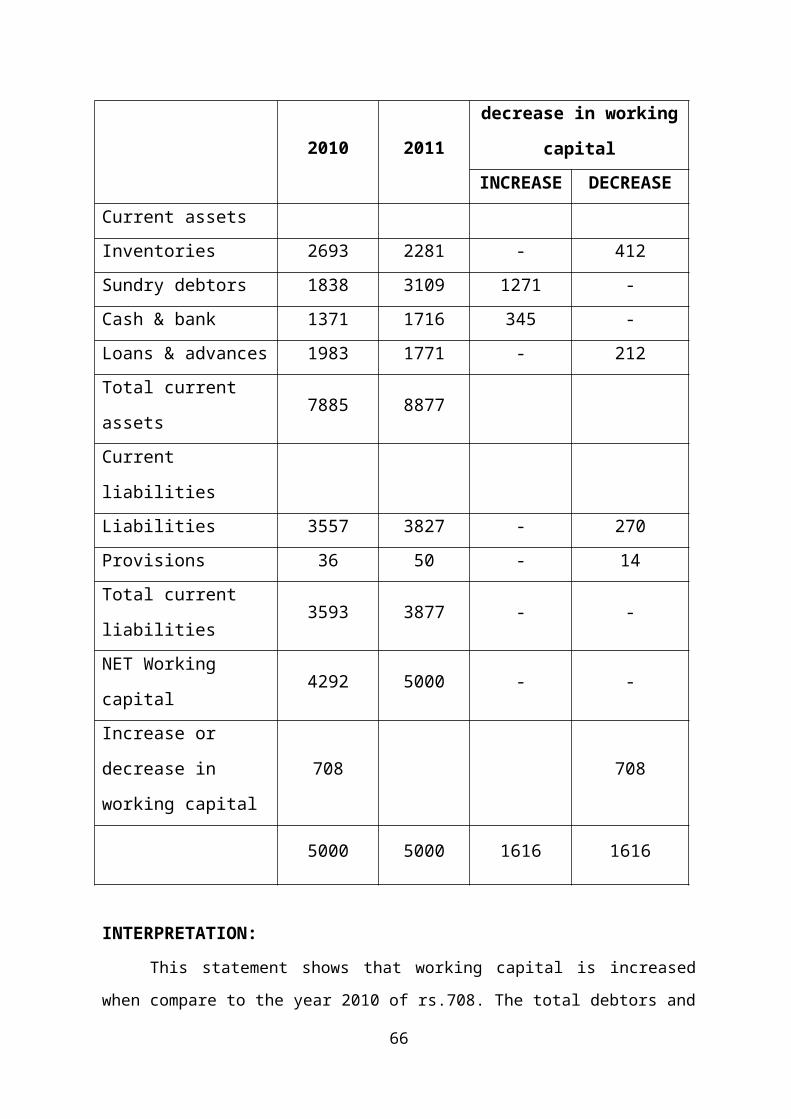
STATEMENT OF CHANGES IN WORKING CAPITALOF 31-3-2010 & 31-
12-2011
(Rs.in lakhs)
PARTICULORS 31-3-2010 31-3-2011
increase or decrease in
working capital
INCREAS
EDECREASE
Current assets
Inventories 2693 2281 - 412
Sundry debtors 1838 3109 1271 -
Cash & bank 1371 1716 345 -
Loans & advances 1983 1771 - 212
Total current assets 7885 8877
Current liabilities
Liabilities 3557 3827 - 270
Provisions 36 50 - 14
Total current liabilities3593 3877 - -
NET Working capital4292 5000 - -
Increase or decrease in
working capital708 708
5000 5000 1616 1616
INTERPRETATION:
This statement shows that working capital is increased when compare to the year
2010 of rs.708. The total debtors and cash and bank balances are increased respectively
rs.1271, rs.345
.
44

Table 1.3
STATEMENT OFCHANGES IN WORKING CAPITALOF 31-3-2011 & 31-12-
2011
(Rs.in lakhs)
PARTICULORS 31-3-2011 31-3-2011
CHANGES IN WC
INCREAS
EDECREASE
Current assets
Inventories 2281 2503 222 -
Sundry debtors 3109 2467 - 642
Cash & bank 1716 1290 - 426
Loans & advances 1771 1960 135 -
Total current assets 8877 8767 - -
Current liabilities
Liabilities 3827 3381 446 -
Provisions 50 127 - 77
Total current liabilities3877 3509 - -
NET Working capital 5000 4658 - -
INCREASE OR
DECREASE IN W.C- 342 342 -
5000 5000 1145 1145
INTERPRETATION:
This table shows that working capital is again decreased by Rs342 when compare to
the year 2011 the cash and bank balances and sundry debtors are decreased respectively by
rs.642.rs.426.
45

Table 1.4
STATEMENT OFCHANGES IN WORKING CAPITALOF 31-3-2011 & 31-3-
2013
(Rs.in lakhs)
PARTICULORS31-3-
201131-3-2013
INCREASE OR
DECREASE IN WORKING
CAPITAL
INCREASE DECREASE
Current assets
Inventories 2503 3114 611 -
Sundry debtors 2467 943 - 1524
Cash & bank 1290 1383 93 -
Loans & advances 1906 5284 3378 -
Total current assets 8166 10724 - -
Current liabilities
Liabilities 3381 3758 - 377
Provisions 127 163 - 36
Total current liabilities3508 3921 - -
NET Working capital 4658 6802 - -
INCREASE OR
DECREASE IN W.C2145 - - 2145
6803 6803 4082 4082
INTERPRETATION:
This table shows that the working capital is increased byrs.2145 when compare to
the year 2011 And the loans and advances are increased by rs.3378.
46

Table 1.5
STATEMENT OFCHANGES IN WORKING CAPITALOF 31-3-2013& 31-3-
2014
(Rs.in lakhs)
PARTICULORS 31-3-201331-3-
2014
INCREASE OR
DECREASE IN WORKING
CAPITAL
INCREASE DECREASE
Current assets
Inventories 3115 2889 - 226
Sundry debtors 943 886 - 57
Cash & bank 1383 1576 193 -
Loans & advances 5284 3095 - 2189
Total current assets 10724 8446 - -
Current liabilities
Liabilities 3758 5062 - 1304
Provisions 163 326 - 163
Total current liabilities3921 5388 - -
NET Working capital 6803 3058 - -
INCREASE OR
DECREASE IN W.C- 3745 3745 -
6803 6803 3938 3938
INTERPRETATION:
In this above statement the total assets are decreased by Rs.2278 and current
liabilities are increased by Rs.1467. Hence the working capital is decreased by Rs.3745.
47

WORKING CAPITAL CHANGES
(Rs.in lakhs)
Year Increase/Decrease in
working capital
2009-10 6705
2010-11 708
2011-12 -342
2012-13 2145
2013-14 -1298
2009-10 2010-11 2011-12 2012-13 2013-14-2000-1000
010002000300040005000600070008000
6705
708
-342
2145
-1298
years
Ch
ang
es i
n w
ork
ing
cap
ital
INTERPRETATION: -
The data in the above table shows that there is a mixed trend changes in working
capital. That is both positive and negative changes. However, there is an increase and
decrease in changes of working capital, but the working capital trend shows a positive trend.
48

RATIO ANALYSIS
TYPES OF RATIOS:
Several ratios calculated from the accounting data can be grouped in to various
classes according to financial activity or function to be evaluated. As stated earlier, the
parties interested in financial analysis are short-term and long-term creditors, owners and
management. Short-term creditors.
Main interest in the liquidity position or the short-term solvency of the firm long
term creditors on the other hand are more interested in the long term solvency and
profitability of the firm.
We may classifies them in to the following from important categories
1. Liquidity ratio
2. Leverage ratio
3. Activity ratio
4. Profitability ratio
1. LIQUIDITY RATIOS
Liquidity ratios measure the firm’s ability to meet current obligations.
2. LEVERAGE RATIOS
Leverage ratios show the proportion of debt and equity in financing the firm’s assets.
3. ACTIVITY RATIO
Activity ratios reflect the firm’s efficiency in utilizing its assets
4. PROFITABILITY RATIOS
Profitability ratios measure overall performance and Effectiveness of the firm.
49

WORKING CAPITAL TURN OVER RATIO
This ratio measures the relationship between working capital and sales. The ratio
shows the number of times the working capital results. In sales working capital as usual is
the excess of current assets over the current liabilities.
Working capital turnover ratio = sales/net working capital
Comment: Higher the ratio creates the greater the profit. A low working capital turn over
indicates that working capital is not efficiently utilize
Table 1.1
YEAR SALESNET WORKING
CAPITALRATIO
2009-10 31590 4292 7.4
2010-11 35851 5002 7.2
2011-12 39889 4658 8.6
2012-13 47306 6803 7.0
2013-14 50309 4058 12.3
50

2009-10 2010-11 2011-12 2012-13 2013-140
2
4
6
8
10
12
14
7.4 7.28.6
7
12.3
Working capital turnover ratio
Years
Ra
tio
INTERPRETATION:
From the above table we can analyze that in the year 2011-2013 it will be decreased
to 7.0 and in the year 2013-2014 it will be higher that 12.3 remaining all years it will be
increasing in position.
51

DEBTORS TURN OVER RATIO
It is also known as receivable turnover ratio it establishes relationship between credit
sales and average debtors.
Debtors turnover ratio = credit sales/average debtors
Average debtors = (opening debtors + closing debtors)/2
Collection period = 365/debtors turnover ratio
The ratio indicates the days with in which debtors are collected.
Higher the ratio more the chances of bad debts and lower the ratio less chance of bad
debts
Table 1.2
YEAR SALESAVERAGE
DEBTORSRATIO
2009-10 31590 1838 17.2
2010-11 35851 3109 11.4
2011-12 39889 2467 16.16
2012-13 47306 943 50.16
2013-14 50309 1866 26.9
52

2009-10 2010-11 2011-12 2012-13 2013-140
102030405060
17.211.4
16.16
50.16
26.9
Detors turn over ratio
Years
Ra
tio
INTERPRETATION:
From the table we can analysis that in the year 2011-2013 debtors turnover ratio is
highest ratio of rs.50.16 and in the year 2009-2011 it had lower ratio of Rs. 11.4. and in the
last year it again decreased to rs.26.9.
53

CREDITORS TURN OVER RATIO
It is also known as accounts payable turnover ratio this ratio gives the average credit
period enjoyed from the creditors and is calculated as under Creditors turnover ratio = credit
purchases / average creditors (accounts payable)
Average creditors = (opening creditors + closing creditors)/2
Average payable period = 365/creditors turnover ratio
A higher ratio indicates that creditors are not paid in time a low ratio gives an idea that
the business is not taking full advantages of credit period allowed by the creditors
Table 1.3
YEAR PURCHAGESAVERAGE
CREDITORSRATIO
2009-10 4106 3443 1.19
2010-11 3776 3201 1.17
2011-12 5858 3423 1.7
2012-13 7934 3470 2.3
2013-14 6233 4356 1.4
54

2009-10 2010-11 2011-12 2012-13 2013-140
0.5
1
1.5
2
2.5
1.19 1.17
1.7
2.3
1.4
Creditor turnover ratio
Years
Ra
tio
INTERPRETATION:
From the table we can find out that in the year 2011-2013 it has high ratio of rs.2.3
and in the year 2013-2014 it has less ratio of Rs. 1.4. In the year 2009, 2009 it is in Rs. 1.19,
1.17 after it is increased to rs.1.7.
55

FINISHED GOODS TURN OVER RATIO:
This ratio indicates the relationship between cost of goods sold and average finished
goods.
Finished goods turnover ratio = (opening finished goods + closing finished
goods)/2
Calculates days = 365/finished goods turnover ratio
Comment: ‘Higher the ratio better it is’.
Table 1.4
YEAR
COST OF
GOODS
SOLD
AVERAGE
FINISHED
GOODS
RATIO
2009-10 38483 736 52.2
2010-11 32005 456 70.2
2011-12 34922 258 135.4
2012-13 37690 329 114.4
2013-14 30909 577 53.5
56

2009-10 2010-11 2011-12 2012-13 2013-140
20406080
100120140160
52.270.2
135.4114.4
53.5
Finished goods turnover ratio
Years
Ra
tio
INTERPRETATION:
From the finished goods turnover ratio it shows the ratio is gradually increasing way
up to in the year 2009-2011(52.2, 70.2, 135) after it will become decreased in the year 2009-
2009,2013-2014(114.4, 53.5).
57

INVENTORY TURNOVER RATIO
This ratio also knows as stock turnover ratio establishes relationship between cost of
goods sold during a given period and the average amount of inventory held during that
period.
Inventory turnover ratio = (opening inventory + closing inventory)/2
Calculate of Inventory turnover in days = 365/inventory turnover ratio.
Higher the ratio the better it is because it shows that finished stock is rapidly turned
over on the other hand a low stock turnover ratio is not desirable because it reveals the
accumulation of obsolete stock, or the carrying of too much stock.
Table 1.5
YEAR SALES INVENTORY RATIO
2009-10 31590 2693 11.7
2010-11 35851 2282 15.7
2011-12 39889 2563 15.9
2012-13 47306 3114 15.19
2013-14 50310 2889 17.4
58

2009-10 2010-11 2011-12 2012-13 2013-140
5
10
15
20
11.715.7 15.9 15.19
17.4
inventory turnover ratio
years
rati
o
INTERPRETATION:
From the table we can analyze that in the year 2009-2009 it has low ratio of 11.7 and
it has high ratio of in the year 2013-2014 of 17.4. Remaining all years it is gradually
increased.
59

CURRENT RATIO
Current ratio may be defined as the relationship between current assets and current
liabilities. This ratio also known as working capital ratio current assets include cash and
these assets which can be converted in to cash with in a one year such as cash & bank,
marketable securities, debtors, inventories, prepaid expenses include the represent the
payments that will be made in future obligation like creditors, bills payable etc.
Generally current ratio is a measure of firms short-term solvency 2:1 is considered to
be ideal for the concern. It indicates the availability of current assets in rupees for every one
rupee of current liabilities worth of two rupee Current assets.
Curent assents
Curent ratio = -------------------------------
Curent labilités
Table 1.6
YEARCURRENT
ASSETS
CURRENT
LIABILITIESRATIO
2009-10 7885 3593 2.19
2010-11 8879 3877 2.29
2011-12 8167 3509 2.33
2012-13 10726 3823 2.81
2013-14 9427 5388 1.75
60

2009-10 2010-11 2011-12 2012-13 2013-140
0.51
1.52
2.53
2.19 2.29 2.332.81
1.75
current ratio
years
rati
o
INTERPRETATION:
From the above table the current ratio is satisfactory because as conversional rule
current ratio is 2:1.except 31-3-2013 in all year’s cash ratio is above 2:1
61

QUICK RATIO
This is the ratio of quick assets to current liabilities. It shows a firm’s ability to meet
current liabilities. The assets is liquid if it can be converted in to cash immediately like cash
or band & short investments & bills receivable. Generally 1:1 ratio is considered ideal ratio
for a concern because it is wise to keep the liquid assets at least equal to the liquid liabilities
at all times.
QUICK RATIO = QUICK ASSETS / CURRENT LIABILITIES
Table 1.7
Year Quick Assets Current liabilities Ratio
2009-10 5192 3593 1.45
2010-11 6597 3877 1.70
2011-12 5664 3509 1.61
2012-13 7611 3823 1.99
2013-14 6538 5388 1.21
.
62

2009-10 2010-11 2011-12 2012-13 2013-140
0.5
1
1.5
2
2.5
1.451.7 1.61
1.99
1.21
quick ratio
years
rati
o
INTERPRETATION:
From the above table the quick assets ratio position is satisfactory. Normally the
quick assets ratio is 1:1.in all above years it is more than 1:1 (1.45, 1. 7, 1.61, 1.99, 1.21
63
DEBT RATIO
This ratio is also known as funded debt to total capitalization. Total debt ratio is
obtained by dividing total debt by capital employed it is obtained by the following formula.
TOTAL DEBT RATIO = TOTAL DEBT / CAPITAL EMPLOYED
Here, total debt will include short and long-term borrowings from financial
institutions, debentures / bonds, deferred payment arrangements for buying capital
equipments, and bank borrowings, public deposits and any other interest-bearing loan.
Capital employed will include total debt and net worth. Capital employed equals net
assets, which consists of net fixed assets and net current assets. Net current assets include
current assets minus current liabilities excluding interest-bearing short-term debt.
Table 1.8
Year Total debt Net assets Debt ratio
2009-10 27130 74827 0.36
2010-11 28088 92785 0.30
2011-12 27198 91895 0.29
2012-13 25198 89895 0.28
2013-14 16555 81252 0.20
64

2009-10 2010-11 2011-12 2012-13 2013-140
0.1
0.2
0.3
0.4 0.360.3 0.29 0.28
0.2
debt ratio
years
rati
o
INTERPRETATION:
From the above table we analyses that the debt ratio is gradually decreases. In the
year 31-3-2009 it has highest ratio 0.36 and it has lowest value of 0.20 in the year 31-3-
2014.
65
DEBT EQUITY RATIO
The debt equity ratio is determined to ascertain the soundness of the long-term
financial policies of the company. It may be calculated as follows.
The terms debt refers to the total outside liabilities that consists of both short-term
and long-term liabilities and the term equity refers to share holder’s funds that consists of
the booth and preference capital and reserves and surplus.
Debt equity ratio = debt / Equity
This ratio provides margin of safety to creditors. The desirable norm for the ratio is
1:2 or 1:1
Table 1.9
Year Debt Net Worth Ratio
2009-10 27130 47697 0.57
2010-11 2800 64697 0.43
2011-12 27198 64697 0.42
2012-13 25198 64697 0.39
2013-14 16555 64697 0.25
66

2009-10 2010-11 2011-12 2012-13 2013-140
0.2
0.4
0.6 0.57
0.43 0.420.390000000000001
0.25
debt equity ratio
years
rati
o
INTERPRETATION:
From the above table we analyses that the debt equity ratio is gradually decreases. In
the year 31-3-2009 it has highest values 0.57ratio and it has lowest ratio of 0.25 in the year
31-12 2014
67

NET WORKING CAPITAL RATIO
The difference between current assets and current liabilities excluding short-term
borrowing is called net working capital (NWC) or net current assets (NCA). NWC is
sometimes used as a measure of a firm’s liquidity. It is considered that between two firms,
the one having the larger NWC has the greater ability to meet its current obligations. This is
not necessary so the measure of liquidity is a relationship, rather than the difference between
current assets and current liabilities. NEC however measures the firm’s potential reservoir
funds. It can be related to net assets.
Net working capital
Net working capital ratio = ---------------------------------------
Net assets
Net working capital means current assets minus current liabilities. Net assets refers
to the depreciation should be subtracted from the fixed assets.
Table 1.10
Year Net working capital Net assets Ratio
2009-10 4292 43380 0.09
2010-11 5002 41351 0.12
2011-12 4658 38430 0.12
2012-13 6803 38472 0.18
2013-14 4058 33826 0.12
68

2009-10 2010-11 2011-12 2012-13 2013-140
0.05
0.1
0.15
0.2
0.090.12 0.12
0.18
0.12
net working capital ratio
years
rati
o
INTERPRETATION:
From the table we can analysis that the net working capital is high in the year 2011-
2013 (0.18), and low in the year 2008-2009(0.09) and remaining all years it is constant i.e.,
0.12.
69

CASH RATIO
Cash is the most liquid asset; a financial analysis may examine cash ratio and its
equivalent to current liabilities. Trade investment or marketable securities are equivalent of
cash : their fore they may be included in the composition of cash ratio.
Cash ratio = cash + marketable securities/current liabilities.
Table 1.11
Year Cash Current liabilities Ratio
2009-10 1371 3593 0.38
2010-11 1716 3877 0.44
2011-12 1291 3509 0.36
2012-13 1383 3823 0.36
2013-14 1576 5388 0.29
70

2009-10 2010-11 2011-12 2012-13 2013-140
0.050.1
0.150.2
0.250.3
0.350.4
0.450.5
0.380000000000001
0.44
0.36 0.36
0.29
cash ratio
years
rati
o
S
INTERPRETATION:
From the table we can analysis that in the year 2010-2011 it has high ratio of 0.44
and it has low ratio in the year 2013-2014 i.e., 0.29in the year 2009-2010 it is in 0.38 and
remaining all years it is in constant ratio i.e., 0.36.
71

CHAPTER-VFINDINGS, SUGGESTIONS AND
CONCLUSION
72

SUMMARY OF FINDINGS
In the year 2010 the networking capital is decreasing by Rs6705 lakhs and in the
year 2011 it is increased by Rs708 lakhs and again in the year 2011 it is
decreased by rs.342 lakhs and in the year 2013 it is increased by rs.2145 lakhs.
So it is fluctuating more.
It is find out that the current ratio is more than 2:1 except in the years 31-3-
2014(i.e1.75)
It is find out that the quick ratio position is satisfactory because in all 5 years it is
more than the idle ratio ie.1:1.
From the leverage ratios we can find out that the lenders contribution is
decreased and the owners contribution is increased.
From the inventory ratio we can find out that converting finished goods to sales
period is increases.
In the year 2013-13 the debtors turnover increased more (ie.50.16)
In the year 2013-13 it has less collection period (i.e.7.5).
From the networking capital the working capital position is in very low (i.e. 0.09,
0.12, 0.12, 0.18, 0.12).
The working capital turnover ratio is also in low position (i.e. 7.4, 7.2, 8.6, 7.0,
12.3).
In the year 2013-13 Creditors turn over ratio is very high (i.e. 2.3).
73

SUGGESTIONS
Working capital is fluctuating so it is better to maintain sufficient level.
The company has high inventory turnover ratio is indicates high inventory cost. So, it
is better to maintain optimum level of inventory.
Debtors turnover ratio is in last two years increased it creates more bad debts so it is
suggested that to decrease the debtors turnover ratio.
Creditors turnover ratio is decreased it creates creditors are not utilizing credit
period. So it is better to increase.
The cash ratio is in low position it is better to maintain idle ratio 1:1 to meet liquid
position.
74

CONCLUSION
As Kotak Mahindra Bank was entered a joint venture with italicementi which is
the second largest cement producer in Europe. So it needs to improve its activities in
fewer fields/activities to get its quality increase and also to increase the customer base in
all the places where it is functioning. And it is the right time to increase its operations
because it is the period of overcoming the Recession the company has more scope.
75

BIBLIOGRAPHY
Financial Management, 9th edition, Pandey .I.M.,
Vikas Publishing (Pvt) Ltd., New Delhi.
Financial Management Text, M.Y.Khan & P.K. Jain
problems & cases, 4th edition TATA MC grawhill
Publishing comp. Ltd., New Delhi.
Financial Management and Policy, Srivastava. R.M.
3rd edition, Himala ya Publishing House.
Investment Analysis & Portfolio
Publishing comp. Ltd., New Delhi. Prassanna ChandraManagement
,
TATA MC Grawhill
76