wmata financial update - management report q1 fiscal year 2018 · 2018-05-14 · wmata financial...
TRANSCRIPT

WMATA Financial Update - Management Report Q1 Fiscal Year 2018
1
WMATA Financial Update - Management Report Q1 Fiscal Year 2018
2
Table of Contents I. Highlights .................................................................................................................................................................................... 3
II. Operating Results ...................................................................................................................................................................... 6
A. Summary ............................................................................................................................................................................... 6
B. Ridership and Revenue ........................................................................................................................................................ 7
C. Operating Expenses ........................................................................................................................................................... 10
III. Capital Programs .................................................................................................................................................................... 12
A. Railcar Investments ......................................................................................................................................................... 12
1. Railcar Acquisition ........................................................................................................................................................... 12
2. Railcar Maintenance & Overhaul .................................................................................................................................... 13
3. Railcar Maintenance Facilities......................................................................................................................................... 14
B. Rail Systems Investments .................................................................................................................................................. 15
1. Propulsion........................................................................................................................................................................ 15
2. Signals & Communications ............................................................................................................................................. 15
C. Track & Structures Rehabilitation ....................................................................................................................................... 17
1. Fixed Rail......................................................................................................................................................................... 17
2. Structures ........................................................................................................................................................................ 18
D. Stations & Passenger Facilities Investments ..................................................................................................................... 18
1. Platforms & Structures .................................................................................................................................................... 19
2. Vertical Transportation .................................................................................................................................................... 20
3. Station Systems .............................................................................................................................................................. 21
E. Bus & Paratransit Investments ........................................................................................................................................... 21
1. Bus & Paratransit Acquisition .......................................................................................................................................... 21
2. Bus Maintenance & Overhaul ......................................................................................................................................... 21
3. Bus Maintenance Facilities.............................................................................................................................................. 22
4. Bus Passenger Facilities & Systems ............................................................................................................................... 23
F. Business Support Investments ........................................................................................................................................... 23
1. Information Technology ................................................................................................................................................... 23
2. Metro Transit Police Department .................................................................................................................................... 24
3. Support Equipment & Services ....................................................................................................................................... 25
Appendices .................................................................................................................................................................................. 26
Appendix I: Operating Financials ............................................................................................................................................ 26
Appendix II: Capital Financials ................................................................................................................................................ 30
Appendix III: FTA Grant Status ............................................................................................................................................... 34
Appendix IV: Glossary of Acronyms ........................................................................................................................................ 36

WMATA Financial Update - Management Report Q1 Fiscal Year 2018
3
I. Highlights In the first quarter, Metro made progress toward accomplishing FY2018’s goals and objectives. Efforts to replace
and repair vehicles continued at the accelerated pace that was established in FY2017, and progress continued on
safety-critical capital improvement, rehabilitation, and maintenance initiatives that are underway to bring Metro
Back2Good.
Operations Results In Q1, Metro saw indications that management actions and
other cost savings are beginning to help offset revenue
losses from lower ridership. While total revenue was $8.7
million less than planned for in the budget, operating
expenses were $27.3 million less than budget, resulting in
an operating subsidy for the quarter that was $18.6 million
favorable to budget. Much of this favorability can be
attributed to the timing of expenses, but the full year subsidy
is still forecasted to be $6 million favorable to budget.
Metrorail passenger revenue was five percent higher than
Q1 of FY2017, an indication that ridership is stabilizing due
to the end of SafeTrack and to improved reliability.
Nevertheless, rail ridership was one percent less than
budget expectations in Q1.
As the charts to the right and below indicate, the introduction of the 7000 series railcars, along with the removal of
the 1000 and 4000 series toward the end of FY2017, has substantially extended the average distance between
delays, per rail car, and contributed to service reliability.

WMATA Financial Update - Management Report Q1 Fiscal Year 2018
4
MetroBus passenger revenue has been significantly below expectations – 12 percent below budget in Q1. Metro is
assessing potential causes and remedies related to this decline. Additionally, Metro is making efforts to protect bus
operators from crime and improve overall bus safety, including the execution of a contract, in Q1, to install security
cameras on 230 buses.
MetroAccess passenger revenue also came in below budget expectations.
Metro is working to provide more flexible options for MetroAccess rides
including the recent launch (on September 18) of The Abilities-Ride
program. This program offers subsidized rides in partnership with Regency
Taxi and Silver Cab. Currently, eligible MetroAccess customers can
request transportation through these providers for any trip that begins and
ends within the MetroAccess service area in Maryland. This program is
estimated to save Metro $4-$6 million per year, as each trip taken on
MetroAccess vehicles costs Metro approximately $50. There were 139
reported trips during the first 10 days of The Abilities-Ride program.
Capital Investment Fifty-six 7000 series railcars were accepted and put into revenue service
during the quarter. A total 420 new railcars have been accepted through
the end of Q1. Traction power upgrades and rehabilitation efforts also
continued along the Orange and Blue lines, and Metro’s initiative to elevate
traction power cables off the ground was completed – this will reduce the
exposure of power components to water and other elements and help to mitigate fires and associated safety
hazards.
Cellular service was initiated between Potomac Avenue and Metro Center, while the
segment between Benning Road and Largo Town Center is underway. Metro also
initiated a pilot project to implement and evaluate technology that will allow for real-
time monitoring of the location of and signaling between track inspectors and other
track workers. Additionally, construction began at 16 underground stations and the
underlying core network infrastructure for public WiFi installation, while functional
testing was completed for Metro’s new time-keeping system.
The pilot segments for the tunnel waterproofing initiative along the Red Line were
also completed during the quarter. In these test segments, a 2,000 foot section of
inbound track between Medical Center and Bethesda, and the entire Medical Center
interlocking, a proprietary, polymer-based material was injected through holes drilled
into the tunnel ceiling to form a waterproof membrane on the exterior of the tunnel
walls.
The tunnels have remained relatively dry, even amid excessive rains in late July and August, which brought up to
three inches of precipitation in one day. Metro and its contractor have agreed to continue on an additional 4,000 foot
section of inbound track between Medical Center and Grosvenor that will triple the area of deep tunnel segment
under the pilot from the initial scope.

WMATA Financial Update - Management Report Q1 Fiscal Year 2018
5
Continuing Quality Improvements In August The General Manager signed the Quality Management System
Plan (QMSP) developed by the Metro’s Office of Quality Assurance, Internal
Compliance and Oversight (QICO). This plan ensures consistency in
Metro’s practices regardless of who is performing the work, and guidance to
ensure those practices are maintained when employees retire and others
assume their responsibilities.
The QSMP provides a foundation that will guide the development of
department-specific procedural roadmaps, establishing practices and
procedures that apply within every department. Metro’s quality standards
will also increasingly be supported by the standardization and centralization
of data repositories, such as the Transit Asset Management System and the
Safety and Maintenance Measurement Systems – and by the predictive and
analytic capabilities that these tools will enable.
Status of Grant Applications and Reimbursement
FTA Grant applications and amendments totaling $406.6 million were
awarded during the first quarter. All FY2018 formula and PRIIA Grants are now in place.
WMATA drew $158.6 million from FTA funds. FTA’s ECHO system was closed for Federal year-end maintenance
from September 26 through October 5 and was unavailable for draws during this period.
FTA has closed the Financial Management Oversight Review and fully restored ECHO drawdown privileges on all
grants.

WMATA Financial Update - Management Report Q1 Fiscal Year 2018
6
II. Operating Results A. Summary The FY2018, Q1 operating subsidy was $223
million, or $19 million less than budget. This
favorability was the result of revenues of $206
million, or $9 million below budget, and operating
expenses totaling $429 million or $27 million
below budget.
The favorability in operating expenses was
primarily driven by lower costs for salaries and
wages, which were $9 million below budget, and
services which were $16 million below budget,
due mainly to timing.
The operating revenue un-favorability to budget is primarily attributable to a continued decline in bus ridership versus
prior year. While bus revenue was three percent lower than last year, it was 12 percent below budget for the quarter.
Ridership on bus and rail continue to face challenges stemming from the fare increases and service cuts, perceived
service levels, growth in alternative transportation options, low gasoline prices, and telecommuting.
15
1 14
6
16
0 1
51
14
7
15
3 14
7
14
7
16
1
14
6
15
4
16
3
14
4
12
8
15
7
$80M
$90M
$100M
$110M
$120M
$130M
$140M
$150M
$160M
$170M
Jul Aug Sept Oct Nov Dec Jan Feb Mar Apr May Jun
FY2018 Budget FY2018 ActualOperating Expenditures (in millions)

WMATA Financial Update - Management Report Q1 Fiscal Year 2018
7
B. Ridership and Revenue
Ridership and revenue performance compared to
budget through the end of the first quarter of
FY2018 are summarized in the table to the right.
Total WMATA revenue was $206 million in the first
quarter – below budget by $8.7 million, or four
percent. Metrorail passenger revenue of $138
million was $1.5 million (one percent) below
budget but five percent higher than prior year,
potentially signaling a degree of stability in rail
ridership and revenue to start FY2018.
MetroBus passenger revenue of $34 million was
$4 million below budget for the quarter (or 12
percent), representing a decline of $1 million
(three percent) from last year.
MetroAccess passenger revenue was three
percent below budget, ridership was four percent
below budget and three percent below prior year.
Parking revenue was three percent below budget but grew three percent over the prior first quarter. Non-Passenger
revenue was 11 percent below budget, but grew six percent over Q1 of FY2017.
Total transit ridership on all modes through the fourth quarter was 75 million trips, a decrease of 2.8 million trips or
four percent compared to prior year. While MetroBus ridership was projected to decline in FY2018, Metrorail and
MetroAccess ridership were projected to increase slightly in FY2018. Actual ridership was below budget for all
modes in the first quarter (marginally for MetroAccess) and total ridership for all modes was below budgeted trips
by 2.8 million or four percent.
71
73 71
74
65
65 63
63
74
75
74
77
69
70 68
$50M
$55M
$60M
$65M
$70M
$75M
$80M
Jul Aug Sept Oct Nov Dec Jan Feb Mar Apr May Jun
FY2017 Actual FY2018 Budget FY2018 Actual
Revenue by Month (In millions)

WMATA Financial Update - Management Report Q1 Fiscal Year 2018
8
Metrorail Rail ridership in the first
quarter of FY2018 was
44.9 million trips, flat
versus prior year and
under budget by 1.5
million trips or three
percent.
The ridership increase
over FY2017 is despite
having one fewer
weekday than prior year.
Weekday ridership was
up one percent versus
prior year and under
budget by one percent, while weekends (especially Saturdays) performed below budget, due in part to continued
major trackwork projects. The current rail forecast anticipates ridership essentially on budget and revenue
marginally above budget for FY2018 in total.
In May, Metro took steps to reduce fare evasion by launching the FairShare pilot program, which added signage
and secured the emergency swinging gates at two stations (Gallery Place and Ft. Totten). There was a noticeable
uptick in rail ridership at Ft. Totten during the pilot, as overall ridership was up seven percent at that station (500
entries per day), and revenue increased four percent at the station ($700 per day). Following the success of the
FairShare pilot, Engineering and Architecture teams are working to expand the program to other stations.
As expected, the fare increases and
service reductions that went into effect
in July negatively impacted ridership
on both rail and bus. Rail fares
increased 10-25 cents per trip and
peak headways widened. The Yellow
Line Rush-Plus service was
eliminated, while Blue Line service
was increased. July’s results were
also impacted by the timing of the July
4th holiday, which occurred on a
Tuesday, reducing the preceding
Monday’s ridership by 21 percent.
Rail ridership after 7pm continues to perform poorly, down 20-50 percent compared to July 2015 due to reduced
operating hours, track work, and increasing competition from transit alternatives.
In August, weekday and peak ridership continued to show signs of stability, while off-peak ridership continued to
decline. One trend noted by staff was the decline in average travel frequency, from an average of 20 trips per month
per SmarTrip card in June of 2013 to approximately 18 trips at present.
15.515.9
15.0
15.7
13.6 13.2 13.2 13.0
15.716.1 15.9 15.7
15.2 15.3
14.4
9.9 10.5
10.1 10.5
9.3 9.1 9.0 8.9
9.8 9.9 9.9 10.0
9.4
10.0 9.8
8M
10M
12M
14M
16M
18M
Jul Aug Sept Oct Nov Dec Jan Feb Mar Apr May Jun
Rail Budget Rail Actual
Bus
Rail
Ridership by Month
WMATA Financial Update - Management Report Q1 Fiscal Year 2018
9
Real estate development has re-emerged as a major factor driving ridership gains at certain stations. For example,
significant ridership gains are apparent at high-development stations such as Federal Center SW, Tysons-area
stations on the Silver Line, Mt. Vernon Square, Navy Yard and Waterfront. Residential growth at Navy Yard is
generating peak morning ridership gains of 35 percent.
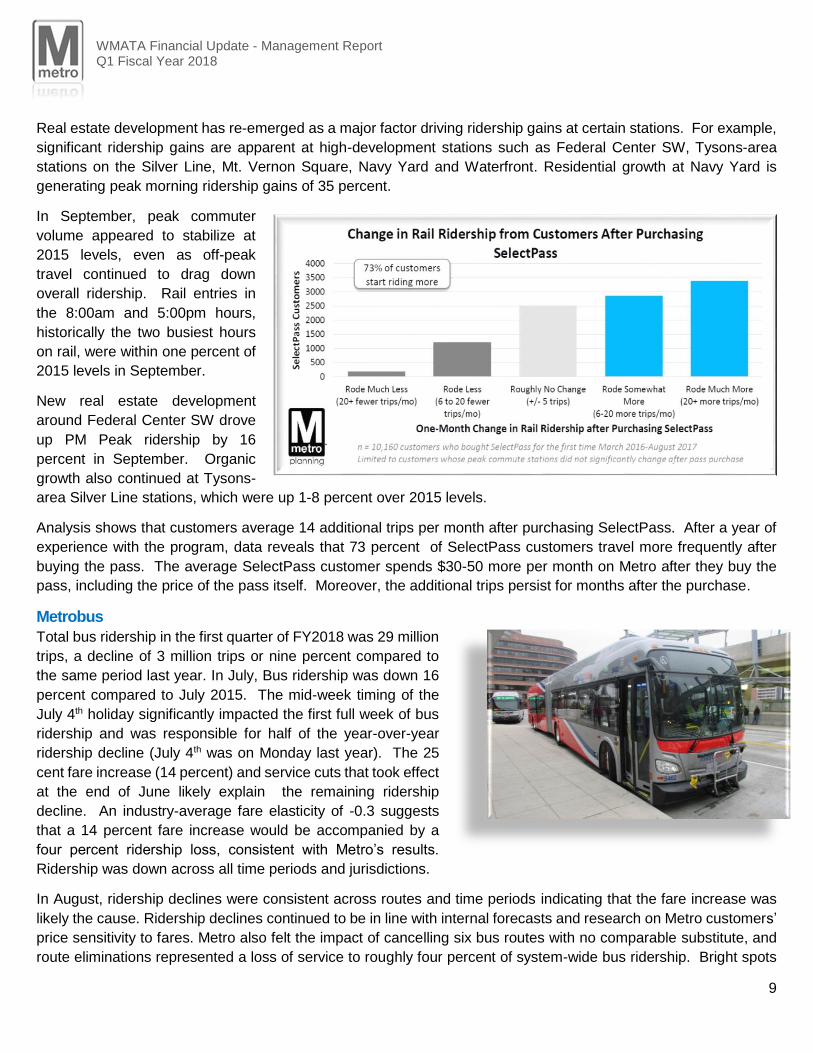
In September, peak commuter
volume appeared to stabilize at
2015 levels, even as off-peak
travel continued to drag down
overall ridership. Rail entries in
the 8:00am and 5:00pm hours,
historically the two busiest hours
on rail, were within one percent of
2015 levels in September.
New real estate development
around Federal Center SW drove
up PM Peak ridership by 16
percent in September. Organic
growth also continued at Tysons-
area Silver Line stations, which were up 1-8 percent over 2015 levels.
Analysis shows that customers average 14 additional trips per month after purchasing SelectPass. After a year of
experience with the program, data reveals that 73 percent of SelectPass customers travel more frequently after
buying the pass. The average SelectPass customer spends $30-50 more per month on Metro after they buy the
pass, including the price of the pass itself. Moreover, the additional trips persist for months after the purchase.
Metrobus
Total bus ridership in the first quarter of FY2018 was 29 million
trips, a decline of 3 million trips or nine percent compared to
the same period last year. In July, Bus ridership was down 16
percent compared to July 2015. The mid-week timing of the
July 4th holiday significantly impacted the first full week of bus
ridership and was responsible for half of the year-over-year
ridership decline (July 4th was on Monday last year). The 25
cent fare increase (14 percent) and service cuts that took effect
at the end of June likely explain the remaining ridership
decline. An industry-average fare elasticity of -0.3 suggests
that a 14 percent fare increase would be accompanied by a
four percent ridership loss, consistent with Metro’s results.
Ridership was down across all time periods and jurisdictions.
In August, ridership declines were consistent across routes and time periods indicating that the fare increase was
likely the cause. Ridership declines continued to be in line with internal forecasts and research on Metro customers’
price sensitivity to fares. Metro also felt the impact of cancelling six bus routes with no comparable substitute, and
route eliminations represented a loss of service to roughly four percent of system-wide bus ridership. Bright spots

WMATA Financial Update - Management Report Q1 Fiscal Year 2018
10
included the Springfield Circulator, G9 and NH2, the latter of which appears to be growing ridership without taking
riders from the NH1.
September ridership was consistent with the declines of July and August, with widespread declines across all
jurisdictions, times and days. Ridership in September declined versus last year on 156 of 172 Metrobus lines, on
all hours of the day except for late-night, and across all fare instruments except the Weekly Bus Pass, which was
shielded from the fare increase. Fare evasion button-presses are up and full fare boardings are down 17 percent ,
outpacing the system as a whole.
MetroAccess Total ridership on MetroAccess in the first quarter was approximately 584,000 trips, a decline of three percent
compared with Q1 of FY2017, and below projections by four percent. MetroAccess revenue was three percent below
budget.
Parking Parking revenue through the first quarter was three percent higher than prior year, but was three percent below
budget. Usage of Parking facilities in July was 12 percent below July 2015 levels, with the biggest losses occurring
in Northern Virginia and Montgomery County. In August, parking transactions were favorable to August 2016
(SafeTrack), but remained nine percent below July 2015 totals. In September, parking transactions inched below
2015 levels, with some gains in DC but losses in Maryland and Virginia.
C. Operating Expenses First quarter FY2018 operating expenses of $429 million were favorable to budget by $27 million or six percent. The
favorability is primarily a result of lower than budgeted services expenses and reduced personnel expenses.
Personnel Expenses First quarter personnel expenses (including salaries/wages, overtime, and fringe) of $318 million were favorable to
budget by $10 million or three percent.
Salaries and Wages
In the first quarter, salary and wage expenses of $193 million were under budget by $9 million or five percent. This
variance is mainly driven by position reductions and lower than planned staffing levels.
Overtime
Overtime expenses of $20
million in the first quarter of
FY2018 were below budget by
$0.6 million or three percent.
Fringe
Fringe benefit expenses were
$0.3 million below budget in
the first quarter of FY2018.
Overtime Budget vs Actual Expenditures
7.46.9
6.4
6.96.3 6.6
8.2
7.1
6.36.1
6.56.8
6.8 6.6
6.6
$3M
$4M
$5M
$6M
$7M
$8M
$9M
Jul Aug Sept Oct Nov Dec Jan Feb Mar Apr May Jun
FY2018 Budget FY2018 Actual
Overtime Budget vs Actual

WMATA Financial Update - Management Report Q1 Fiscal Year 2018
11
Non-Personnel Non-personnel expenses of $111 million in the first quarter were below budget by $17 million or 13 percent. The
main areas of expense savings were Services, Fuel (Gas, Diesel & CNG) and Insurance & Other, with relatively
smaller negative variances in Supplies.
Services
Services were $16.2 million below budget in the first quarter of FY2018. Overall favorability in Services was partially
offset by MetroAccess service expenses, which were unfavorable to budget by $1.4 million.
Materials & Supplies
Materials & Supplies expenses exceeded budget by $1.4 million in the first quarter due to a writeoff of obsolete
inventory totaling $6.0 million.
Energy (Fuel, Propulsion, Electricity & Utilities)
Fuel, Propulsion, Electricity and Utilities in the first quarter were lower than budget by $3.8 million or 12 percent.
Fuel expenses totaled $6.3 million, which was $2.7 million or 30 percent below budget. Propulsion expenses in the
quarter totaled $12.2 million, or 0.5 percent below budget. Electricity and utilities expenses of $8.7 million were $1.0
million or ten percent favorable to budget.
Capital Overhead Allocation
The capital overhead allocation represents the reimbursement of indirect costs applied to capital projects, which is
a credit to the operating budget. The allocation method was initiated in FY2017 with approval from the Federal
Transit Administration (FTA). In the first quarter of FY2018 the capital indirect allocation credit totaled $9.1 million,
or $3.2 million unfavorable to the operating budget. This unfavorability, due to timing, will be eliminated by year-end.

WMATA Financial Update - Management Report Q1 Fiscal Year 2018
12
III. Capital Programs
Metro invested $228.3 million in the Capital Program through Q1 of FY2018. The FY2018 capital budget is organized
into six investment categories, as follows:
Railcar Investments;
Rail Systems Investments;
Track & Structures Rehabilitation Investments;
Stations & Passenger Facilities Investments;
Bus & Paratransit Investments; and
Business Support Services Investments.
These six investment categories are sub-divided
into 17 capital improvement programs.
A detailed page for each Capital Improvement
Project (CIP) can be found in Appendix V to this
document. CIPs will be referenced throughout
where applicable.
The amounts referenced in the investment
category narratives represent total cost and
include investments that are not funded by
federal sources.
A. Railcar Investments
Investment by Program FY18 Q1
Actual
FY18 Q1
Budget
FY2018
Forecast
FY2018
Budget
Acquisition $73.4 $53.7 $330.8 $348.2
Maintenance/ Overhaul $25.0 $35.3 $117.7 $121.6
Maintenance Facilities $8.1 $8.3 $38.0 $40.0
Total $106.5 $97.2 $486.5 $509.8
In the first quarter of FY2018, Metro invested $106.5 million in the Railcar category, which includes the Railcar
Acquisition, Railcar Maintenance & Overhaul, and Railcar Maintenance Facilities programs.
1. Railcar Acquisition In Q1 of FY2018, expenditures in the Railcar Acquisition program totaled $73.4 million. During the quarter, 56 new
7000 series cars were placed into revenue service; a total of 420 railcars have been accepted through Q1.

WMATA Financial Update - Management Report Q1 Fiscal Year 2018
13
Metro also began developing specifications,
scope, schedule and a project plan for the
procurement of railcars to replace the 2000 and
3000 series vehicles. These plans are
scheduled for submission to stakeholders for
review in November.
2. Railcar Maintenance & Overhaul Metro invested $25.0 million in the Railcar
Maintenance & Overhaul program toward on-
going maintenance and reliability initiatives
and activities in the first quarter of FY2018.
Metro's "mean distance between delays,"
(MDBD) metric improved an average of 34
percent year-over-year. In Q1 of FY2018 MDBD
was 87,090. That compares to 64,837 miles
between delays in Q1 of FY2017. Prior to Q3 of FY2017, Metro’s target was raised by 10,000 miles to an average
of 75,000 miles of revenue service between delays – and the actual average miles between delays surpassed this
goal every month in Q1, as shown in the chart below:
Jan Feb Mar Apr May Jun Jul Aug Sep Oct Nov Dec
2016 39,657 47,239 59,131 80,943 81,278 85,389 55,850 73,246 65,416 86,174 66,697 76,244
2017 79,105 85,489 80,348 118,958 101,585 104,461 92,927 83,133 85,212
Target 75,000 75,000 75,000 75,000 75,000 75,000 75,000 75,000 75,000 75,000 75,000 75,000
79,1
05
85,4
89
80,3
48
118,9
58
101,5
85
104,4
61
92,9
27
83,1
33
85,2
12
0
20,000
40,000
60,000
80,000
100,000
120,000
140,000
Rail Fleet Mean Distance Between Delay
INVESTMENT CATEGORY: RAILCAR
Total FY2018, Q1 Expenditures – $106.5 million Railcar Acquisition – $73.4 million
- Fifty-six new 7000 series railcars placed into revenue
service.
- Specification drafts and project planning underway for
8000 series procurement.
Railcar Maintenance & Overhaul – $25.0 million
- Mean Distance between Delays improved 34%, year-
over-year (averaging 87,090 miles).
- Completed door overhauls on 92 railcars and upgrades
to HVAC units on 18 railcars.
Railcar Maintenance Facilities – $8.1 million
- Alexandria Yard Track and Structures Maintenance
building construction to be completed in Q2.
- Phases 1&2 (of 3) complete on West Falls Church
Railcar lifts, along with new section of Shady Grove
lifts.
- Final Design complete at Brentwood

WMATA Financial Update - Management Report Q1 Fiscal Year 2018
14
For state of good repair maintenance of the railcar fleet, $13 million was invested in preventive maintenance
activities in Q1. This investment provides the labor required to upgrade, repair, and maintain capital assets that have
a useful life over one year.
In addition to preventive maintenance, Metro performs periodic railcar rehabilitation and overhaul. In Q1, $11.4
million was expended on these activities, with a focus on the 2000/3000 series air compressors, HVAC conversions,
truck assemblies, master controllers, sub-flooring and other components; as well as the 6000 series truck
assemblies.
HVAC systems were also upgraded on 18 railcars during the quarter, and door overhauls were completed on 92
Railcars. Updated Precision Stop software was received, user acceptance testing was performed, and functionality
testing was initiated. This software automates the stopping of rail cars at stations to consistently align the railcar and
doors with the platform, compensating for 8-car and 6-car trains. First quarter expenditures on railcar safety and
reliability enhancements totaled $0.5 million.
3. Railcar Maintenance Facilities Capital improvements and rehabilitation work at Railcar Maintenance Facilities totaled $8.1 million in Q1. Of this
total, expenses of $7.3 million went toward the continuing repairs at rail yard facilities. Construction is projected to
be complete at the Alexandria Track and Structures maintenance building in Q2, and switchgear replacement at the
Alexandria service and inspection shop is underway.
Rehabilitation of the railcar lifts at West Falls Church were completed for Phases 1 and 2, while Phase 3 is projected
to be completed in Q2. All design was completed in Q1 for Brentwood, along with sight lighting. The PA and fire
alarm systems at Brentwood will be carried out in phases until the project is complete.
Additionally, the Yard Control Building at New Carrollton has been reintroduced to the project scope. The building
was initially de-scoped, as it was planned for demolition to clear the way for a yard expansion, however the
expansion project was put on hold, and as a result, the life safety aspects of the Yard Control Building rehabilitation
will be necessary to complete in FY18.
An RFP was released for a construction contract to build out the new facility at Good Luck Road, as various
maintenance departments are relocated there. By the end of Q2, Metro plans to have issued the contract and
initiated construction and relocation of these departments.
WMATA Financial Update - Management Report Q1 Fiscal Year 2018
15
B. Rail Systems Investments Investment by Program FY18 Q1
Actual FY18 Q1
Budget FY2018
Forecast FY2018 Budget
Propulsion $7.3 $9.4 $46.5 $39.5
Signals & Communications $10.3 $10.0 $86.2 $90.0
Total $17.6 $19.4 $132.7 $129.4
Metro invested $17.6 million in Rail Systems during the
first quarter of FY2018. The Propulsion and the
Signals & Communications programs are included in
this category.
1. Propulsion Investments in the Propulsion program amounted to
$7.3 million in Q1 of FY2018. Of this expense, $3.9
million was expended on improvements to the
traction‐power system.
An upgraded traction power substation was
completed at Ft. Mahan. A contract for six upgraded
tie breaker stations is ahead of schedule, with three
locations complete and two more in progress at
Benning Road and Capitol Heights.
The bidding process is underway for system upgrades
along the Blue Line, and the installation of Automatic Train Control card bonds and cabling for eight-car trains has
been incorporated into traction power upgrade projects.
In Q1, $2.8 million was also invested to replace traction power related components that are beyond or nearing the
end of their useful life. The effort to elevate traction power cables off the ground near the third rail is nearing
completion, with all cables elevated on the main line. This effort is critical in improving safety and preventing track
fires.
2. Signals & Communications Metro invested $10.3 million in Q1 of FY2018 in the Signals & Communications program. This program implements
National Transportation Safety Board (NTSB) recommended safety improvements, supports the repair and
improvement of the Automatic Train Control system; and replaces the Radio Communications System with a new
Federal Communications Commission (FCC) mandated, 700 MHz band continued as well.
INVESTMENT CATEGORY: RAIL SYSTEMS
Total FY20178 Q1 Expenditures – $17.6 million
Propulsion – $7.3 million
- Three Tie Breaker Station locations completed
- Two Traction Power Substation completed
- “Boots off the ground” initiative complete on the
main line.
Signals & Communications – $10.3 million
- Initiated pilot project for Track Inspector Location
Awareness
- Cellular service live between Metro Center &
Potomac Ave.
WMATA Financial Update - Management Report Q1 Fiscal Year 2018
16
Automatic Train Control State of Good Repair continued in Q1 with 7,500 linear feet of cable installed, 5 switch
machines rehabilitated, cable meggering on-going at 60 per quarter, and 48 high current bonds installed. An
inventory of non-vital processors is underway and an NTP for phase 2 of the ATC portion of Metro’s asset
management database is planned for Q2. (Phase 2 involves the surveying, conditional assessment, and entry into
Maximo of all ATC assets, along with monitoring to ensure that these processes follow the standardized rules and
practices established for Metro’s enterprise wide
Asset Management structure) In Q1, $3.2 million
was expended toward these efforts.
Progress continued as well on the replacement of
the radio communications system and wiring for
cellular service.
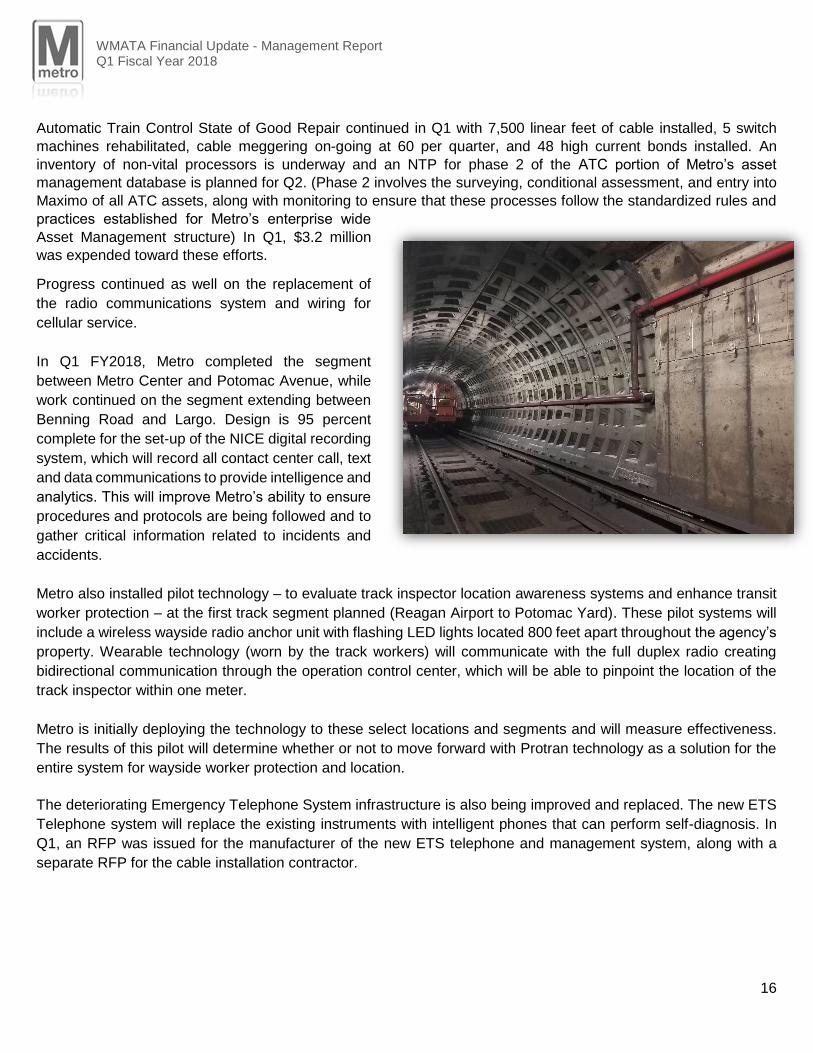
In Q1 FY2018, Metro completed the segment
between Metro Center and Potomac Avenue, while
work continued on the segment extending between
Benning Road and Largo. Design is 95 percent
complete for the set-up of the NICE digital recording
system, which will record all contact center call, text
and data communications to provide intelligence and
analytics. This will improve Metro’s ability to ensure
procedures and protocols are being followed and to
gather critical information related to incidents and
accidents.
Metro also installed pilot technology – to evaluate track inspector location awareness systems and enhance transit
worker protection – at the first track segment planned (Reagan Airport to Potomac Yard). These pilot systems will
include a wireless wayside radio anchor unit with flashing LED lights located 800 feet apart throughout the agency’s
property. Wearable technology (worn by the track workers) will communicate with the full duplex radio creating
bidirectional communication through the operation control center, which will be able to pinpoint the location of the
track inspector within one meter.
Metro is initially deploying the technology to these select locations and segments and will measure effectiveness.
The results of this pilot will determine whether or not to move forward with Protran technology as a solution for the
entire system for wayside worker protection and location.
The deteriorating Emergency Telephone System infrastructure is also being improved and replaced. The new ETS
Telephone system will replace the existing instruments with intelligent phones that can perform self-diagnosis. In
Q1, an RFP was issued for the manufacturer of the new ETS telephone and management system, along with a
separate RFP for the cable installation contractor.

WMATA Financial Update - Management Report Q1 Fiscal Year 2018
17
C. Track & Structures Rehabilitation
Investment by Program FY18 Q1 Actual
FY18 Q1 Budget
FY2018 Forecast
FY2018 Budget
Fixed Rail $17.3 $23.0 $87.8 $99.0
Structures $10.0 $7.3 $38.0 $28.1
Total $27.3 $30.3 $125.8 $127.1
In FY2018, Track & Structures Investments will continue to be focused on reinforcing and rehabilitating infrastructure
to maintain a state of good repair. The Track & Structures Investment Category includes two programs – Fixed Rail
and Structures. In Q1, $27.4 million was invested in this category.
1. Fixed Rail Metro expended $17.3 million on the rehabilitation, repair or replacement of track components during Q1 of FY2018. Scheduled efforts have continued to rehabilitate or replace infrastructure, such as crossties, direct fixation fasteners, insulators, switches, running rail, open joints, rail track signage and grout pads in priority areas throughout the system. By the end of Q1, three weekend shutdowns were completed, along with one extended shutdown on the Green Line. Two more extended shutdowns are currently planned (October and April).
INVESTMENT CATEGORY: TRACK &
STRUCTURES Total FY2018 Q1 Expenditures – $27.3 million
Fixed Rail – $17.3 million
- Three weekend shutdowns complete – one
extended shutdown on Green Line Complete
- 5,500 fasteners, 3,400 crossties, and 3,300
insulators replaced.
Structures – $10 million - Test grouting solution was applied between
Medical Center and Bethesda stations for Red Line Leak mitigation.
- 15,000 linear feet of drains rehabilitated.

WMATA Financial Update - Management Report Q1 Fiscal Year 2018
18
2. Structures The Structures program accounted for $10 million of Q1
expenditures. Of this expense, $3.6 went toward the
rehabilitation of structural components and elevated
platforms, grout pads that support the track structure, and
the replacement of old illegible roadway track signs. On-
going station tunnel leak litigation is also included in these
expenditures.
Water infiltration into the tunnel system along the Red Line
is being addressed separately with a pilot program, which
involves injecting a polymer-based solution into the
surrounding rock surface to form a waterproof barrier
around the tunnel.
In Q1, $6.4 million was invested toward this effort, and the product was applied between Medical Center and
Bethesda stations. In Q2 Metro will evaluate the effectiveness of the pilot tunnel solution, and potentially exercise
the option to complete tunnel segment.
D. Stations & Passenger Facilities Investments Investment by Program FY18 Q1
Actual FY18 Q1
Budget FY2018
Forecast FY2018 Budget
Platforms & Structures $16.7 $20.6 $75.9 $85.9
Vertical Transportation $10.5 $13.6 $56.7 $60.5
Station Systems $3.7 $2.9 $40.7 $36.0
Total $30.9 $37.1 $173.3 $182.4
Track Components
Rehabilitated in Q1
o 3.2 miles running rail
o 4 Switches
o 4,299 DF fasteners
o 6,285 crossties
o 1,748 insulators,
o 7.6 miles of track tamped
o 255 open rail joints welded
o 0.6 miles of third rail replaced.
Structural Track Components
Rehabilitated in Q1
o 361 square feet of concrete poured
o 207 signs replaced
o 3,711 linear feet of grout pads
o 116 leaks repaired
o 13,428 linear feet of drains
rehabilitated.

WMATA Financial Update - Management Report Q1 Fiscal Year 2018
19
In the Stations & Passenger Facilities category,
$30.9 million was invested in Q1 of FY2018. This
category consists of three capital programs:
Platforms & Structures, Vertical Transportation,
and Station Systems.
1. Platforms & Structures In the Platforms & Structures category, $16.7
million was invested in FY2017. The largest share
– $10.2 million – was invested in stage one of the
Orange/Blue Line Rehabilitation.
A Traction Power Substation was completed at
Crystal City, and work is underway at Potomac
Ave. Ceiling lights were replaced at Pentagon,
McPherson Square and Farragut West.
In Q1, $2.8 million was invested in the Station Rehabilitation Program, which consists of thorough cleaning and
power washing of all concrete and architectural features and repair of worn interior fixtures. Full rehabilitations were
completed at Eastern Market, Archives and Court House Stations. Partial rehabs were completed at Brookland,
Franconia/Springfield and Capital Heights.
The Platforms & Structures program also includes construction support (engineering, safety assurance and design
review support) to the Metropolitan Washington Airports Authority (MWAA) for the Silver Line Extension. For Phase
I, Metro worked to resolve punch list items and review deliverables to prepare for the closeout of the project in Q3
or Q4.
For Phase II, an NTP was issued for the design of Silver Line signage, while design was also completed for
Automatic Fare Collection equipment. In addition, safety and security conformance testing began in August. In Q1,
$1.4 million was expended on these projects.
INVESTMENT CATEGORY: STATIONS &
PASSENGER FACILITIES
Total FY2018 Q1 Expenditures – $30.9 million Platforms & Structures – $16.7 million
- Ceiling lights replaced at Pentagon, McPherson Square and Farragut West
- NTP for Phase II Silver Line signage
Vertical Transportation – $10.5 million - 1 elevator returned to service - 4 escalators replaced.
Station Systems – $3.7 million - NTP issued for drainage and discharge piing at seven
locations - Integration of VMS operations alert software with Fire
alarm system underway

WMATA Financial Update - Management Report Q1 Fiscal Year 2018
20
2. Vertical Transportation Metro continues to invest in replacing the system’s escalator and elevator infrastructure and the various components
required for its safe and reliable operation. Metro invested $10.5 million in improvements and renovations to vertical
transportation in Q1 of FY2018. Below is an updated summary of the renovation and replacement activities for
escalators and elevators in the quarter.
Elevator Rehabilitation – In Q1 expenses of $2.5 million
was invested, and one elevator was returned to service at
Pentagon.
Escalator Replacement – In Q1, Metro expended $7.3
million, and four escalators were replaced – two at U
Street, one at Cleveland Park, and one at Smithsonian.
Elevator/Escalator Repairables – $0.6 million was
invested in Q1, and Metro has begun replacing brake
boards and refurbishing the 15,000 steps planned for
FY2018.
Jan Feb Mar Apr May Jun Jul Aug Sep Oct Nov Dec
2016 94% 93% 94% 94% 93% 93% 93% 92% 93% 94% 94% 94%
2017 95% 95% 96% 96% 96% 95% 95% 95% 95%
Target 93% 93% 93% 93% 93% 93% 93% 93% 93% 93% 93% 93%
95% 95% 96% 96% 96% 95% 95% 95% 95%90%
95%
100% Escalator Availability
Jan Feb Mar Apr May Jun Jul Aug Sep Oct Nov Dec
2016 97% 97% 97% 97% 97% 97% 96% 97% 97% 97% 97% 97%
2017 97% 97% 97% 97% 98% 97% 96% 97% 97%
Target 97% 97% 97% 97% 97% 97% 97% 97% 97% 97% 97% 97%
97% 97% 97% 97% 98% 97% 96% 97% 97%90%
95%
100% Elevator Availability
WMATA Financial Update - Management Report Q1 Fiscal Year 2018
21
3. Station Systems In Q1, $3.7 million was invested in the Station Systems program, of which $0.5 million was expended on upgrades
to fire alarm systems in auxiliary facilities. Metro completed upgrades to the fire systems at the revenue collection
facility in Q1, and worked to integrate VMS software into the fire alarm system so that operations control centers
can be alerted as soon as an alarm is triggered and can contact the area fire department.
Expenditures of $0.7 million were incurred in Q1 for drainage improvements throughout the system. Rehabilitation
of drainage systems was completed during the quarter at Queens Chapel and DuPont Circle. An NTP was also
issued for drainage and discharge piping rehabilitation at Drummond Ave, Pentagon, 7th & Mall, Forest Glen, Metro
Center, Van Ness and Mid River.
Q1 expenses in this program also went to the station cooling initiative, with $0.9 million supporting chiller overhauls at JGB and Congress Heights, and the installation of Freon detectors at seven locations (Anacostia, Ballston, Clarendon, Columbia Heights, Medical Center, Rosslyn and Union Station).
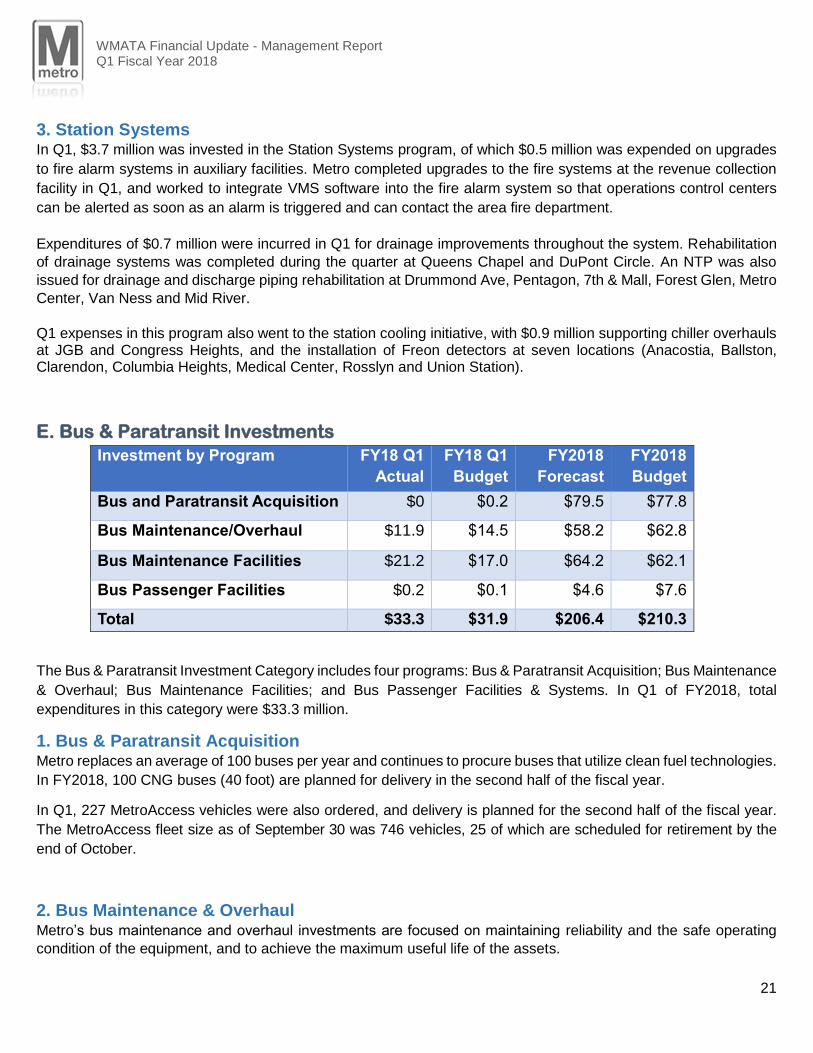
E. Bus & Paratransit Investments
Investment by Program FY18 Q1
Actual
FY18 Q1
Budget
FY2018
Forecast
FY2018
Budget
Bus and Paratransit Acquisition $0 $0.2 $79.5 $77.8
Bus Maintenance/Overhaul $11.9 $14.5 $58.2 $62.8
Bus Maintenance Facilities $21.2 $17.0 $64.2 $62.1
Bus Passenger Facilities $0.2 $0.1 $4.6 $7.6
Total $33.3 $31.9 $206.4 $210.3
The Bus & Paratransit Investment Category includes four programs: Bus & Paratransit Acquisition; Bus Maintenance
& Overhaul; Bus Maintenance Facilities; and Bus Passenger Facilities & Systems. In Q1 of FY2018, total
expenditures in this category were $33.3 million.
1. Bus & Paratransit Acquisition Metro replaces an average of 100 buses per year and continues to procure buses that utilize clean fuel technologies.
In FY2018, 100 CNG buses (40 foot) are planned for delivery in the second half of the fiscal year.
In Q1, 227 MetroAccess vehicles were also ordered, and delivery is planned for the second half of the fiscal year.
The MetroAccess fleet size as of September 30 was 746 vehicles, 25 of which are scheduled for retirement by the
end of October.
2. Bus Maintenance & Overhaul Metro’s bus maintenance and overhaul investments are focused on maintaining reliability and the safe operating
condition of the equipment, and to achieve the maximum useful life of the assets.

WMATA Financial Update - Management Report Q1 Fiscal Year 2018
22
Metro invested $11.9 million in the Bus Maintenance & Overhaul program in Q1 of FY2018. The majority of these
funds was invested in comprehensive mechanical, electrical, and structural rehabilitation that takes place at 7.5
years of life for each bus.
Mean-Distance-Between-Failure (MDBF), measured in miles of revenue service, did not meet the 8000 miles in any
month during the quarter. Rehabilitation activities included 25 bus rehabilitations, 24 energy storage systems
replaced, 25 engine assemblies rebuilt, and 30 transmission assemblies rebuilt.
3. Bus Maintenance Facilities During Q1 of FY2018, $21.2 million was
invested in Bus Maintenance Facilities. Of
this, $19.2 million was expended on the
replacement of the Southern Avenue Bus
Garage with a modern Leadership in
Energy and Environmental Design (LEED)
Silver facility, Andrews Bus Garage, which
will increase capacity from 103 to 175
buses.
The new bus garage is being constructed at
the Joint Base Andrews Federal Center,
and Environmental clearance and
permitting has already been issued. In Q1,
retaining walls, membrane roofing, and
precast concrete envelope were completed.
In Q2 the interior slab will be laid, and plans
for the remainder of FY2018 include the
completion of mechanical, electrical and
plumbing work, interior finishing, and
concrete paving.
INVESTMENT CATEGORY: BUS & PARATRANSIT
Total FY2018 Q1 Expenditures - $33.3 million Bus & Paratransit Acquisition – $0 million - 100 Buses planned for delivery in FY2018;
- RFP issued for 5-year Bus procurement
Bus Maintenance & Overhaul – $11.9 million - 25 buses rehabilitated; - Contract executed to install security cameras on 230
buses
Bus Maintenance Facilities – $21.2 million - At Cinder Bed Road Garage, Automatic Fare Collection
Systems, wireless systems and furniture were installed. - Andrews Federal Center Garage planned completion in
2019.
Bus Passenger Facilities/Systems – $0.2 million - Design work for ADA improvements completed for 206
locations - Electrical step-down work completed at five stations.
Jan Feb Mar Apr May Jun Jul Aug Sep Oct Nov Dec
2016 8,422 8,332 8,359 9,138 8,711 7,736 7,540 7,425 8,428 8,378 8,262 8,421
2017 7,962 9,881 9,254 8,499 7,784 8,350 7,555 7,764 7,571
Target 8,000 8,000 8,000 8,000 8,000 8,000 8,000 8,000 8,000 8,000 8,000 8,000
7,9
62
9,8
81
9,2
54
8,4
99
7,7
84
8,3
50
7,5
55
7,7
64
7,5
71
0
2,000
4,000
6,000
8,000
10,000
12,000Bus Fleet Mean Distance Between Failure

WMATA Financial Update - Management Report Q1 Fiscal Year 2018
23
At the new Cinder Bed road facility (replacing the
Royal Street Bus Garage) Automatic Fare Collection
Systems were installed, along with wireless systems
and furniture. In FY2017, $1.8 million was expended
on this project in Q1.
4. Bus Passenger Facilities & Systems $0.2 million was expended in the Bus Passenger &
Facilities program through Q1. Electrical step-down
work was completed at Fort Totten, Addison Road,
Rhode Island, Huntington and Tysons Corner, and is
underway at Brookland station.
Design work for ADA accessibility improvements was
completed for 206 locations in Prince George’s
County. RTPI display installation is planned for
completion at eight locations, and the ADA construction contract award is planned for Q2.
F. Business Support Investments
Investment by Program FY18 Q1 Actual
FY18 Q1 Budget
FY2018 Forecast
FY2018 Budget
IT $10.2 $11.1 $71.0 $66.4
MTPD $0.1 $0.4 $0.8 $1.0
Support Equipment & Services $2.4 $4.0 $20.4 $23.6
Total $12.6 $15.5 $92.3 $91.0
In Q1 Metro invested $12.6 million in the Business Support Investment category. This includes the Information
Technology, Metro Transit Police Department, and Support Equipment & Services programs.
1. Information Technology Information technology investments accounted for $10.2 million of all Business Support expenditures in Q1 of
FY2018.
In Q1, $2.2 million was spent on the further development of software interfaces that enable the transfer of data to
support financial controls and decision support, such as OneBadge, Kronos (the new time keeping system), Human
Capital Management, and Asset Management. In Q1 Metro developers worked to provide bi-directional data
integration between PeopleSoft (HCM and Financials) and Kronos Time Entry System.

WMATA Financial Update - Management Report Q1 Fiscal Year 2018
24
This effort will continue in Q2 with the solution moving into
production at the end of October. A complete needs assessment
will be compiled for future OneBadge requirements, and planning
will begin for Hyperion Financial Management software to be
integrated with Metro’s current financial systems environment.
To improve electronic communications and systems that support
the efficient delivery of services and customer outreach, Metro
expended $0.4 million in Q1.
This work includes systems that support scheduling, customer
alerts, commuting benefits, and fares as well as applications that assist WMATA departments in the efficient delivery
of core services.
In Q1, WMATA IT created a user interface
design and a style guide for an upgrade to the
General Orders Track Rights System (GOTRS),
and conducted debugging and requirements
gathering for a new version of the Contractors
Automated Timekeeping System (CATS).
IT program expenditures of $0.5 million went
toward the further development of the
automated and centralized Safety Management
System to capture incident and safety
information across the system and improve
operations where there are opportunities to do
so. The Safety Management tool captures
information from accidents and incidents that
occur at Metro stations, Metro facilities and all
Metro vehicles including all three modes.
In Q1, Metro IT had “Extract-Transform-Load” developers working on the predictive analysis elements of the tool
and on requirements gathering for "return to work" trends analysis. In Q2 Metro will begin Sharepoint migration,
which will be done in three waves – incidents and accidents, risk fatigue, and input and reporting updates.
Metro expended $1.5 million on the configuration and deployment of the new, standardized time management
solution. In Q1, parallel system testing with Metro’s current PeopleSoft environment was completed, including Time
and Labor, Project Costing, HRM, ELM and Payroll, and user acceptance testing was completed as well. In
Q2 Metro will begin the rollout to telestaff, and will start end-user training.
2. Metro Transit Police Department
In Q1, a total of $0.1 million was invested in the Metro Transit Police Department capital program. The bulk of this
investment went toward the procurement of non-lethal weapons and the lifecycle replacement of other police support
INVESTMENT CATEGORY: BUSINESS SUPPORT
Total FY2017 Q4 Expenditures – $12.7 million Information Technology – $10.2 million - Functional testing completed for Time-keeping system
- Sharepoint migration for Safety Measurement System
tool to begin in Q2.
Metro Transit Police Department – $0.1 million - On-going support equipment.
Support Equipment & Services – $2.4 million - Phase II field surveys continued along with data
collection and evaluation got Asset Management
- 7000 Series energy consumption data to be entered
into audit in Q2.

WMATA Financial Update - Management Report Q1 Fiscal Year 2018
25
and security equipment. By the end of the fiscal year, Metro will begin design for a police substation at Morgan
Boulevard.
3. Support Equipment & Services In the Support Equipment & Services capital program, Q1 expenditures totaled $2.4 million. Of this total, $0.4 million
was spent for jurisdictionally funded planning studies for future Metro activities or initiatives in Washington, D.C.,
Maryland and Virginia.
Metro invested $0.1 million in Q1 in the
Energy Monitoring and Analysis tool and
Energy Audit. In Q2, the 7000 series rail
car energy consumption findings will
inform the Energy Audit report baseline
conditions and advance progress on the
final report. Metro staff will also receive
log-ins and training for the Energy
Monitoring and Analysis tool.
Additionally, a task order had been
issued for specifications based on
recommendations from the study of
regenerative braking equipment – which
could allow for the “recycling” of energy
from brake friction to help power trains.
Metro will also receive portable solar
lighting towers.
Progress continued as well on the development of asset surveys, inventories, conditional assessment, and
management. Having established the decision support tools and investment prioritization, Metro plans to establish
a beta system of business rules, software and ancillary supporting infrastructure over the next year.
In Q1, Phase II field surveys continued along with data collection and evaluation, and Tier C survey work was
completed. The Phase III data integration and asset management plan for Map-21 compliance will also begin before
the end of the fiscal year. By July of 2019, Metro plans to deploy a fully built out, data enabled asset management
regime. Metro invested $0.7 million toward this effort during the quarter.

WMATA Financial Update - Management Report Q1 Fiscal Year 2018
26
Appendices
Appendix I: Operating Financials
OPERATING FINANCIALS 1st Quarter FY2018
FISCAL YEAR 2018
Prior Year Dollars in Millions Prior Year
Actual Actual Budget Actual Actual Budget
Passenger Revenue$132.2 $138.4 $139.9 ($1.5) -1.1% Metrorail $132.2 $138.4 $139.9 ($1.5) -1.1%
34.9 33.7 38.1 (4.4) -11.6% Metrobus 34.9 33.7 38.1 (4.4) -11.6%
2.4 2.4 2.5 (0.1) -3.2% MetroAccess 2.4 2.4 2.5 (0.1) -3.2%
10.3 10.6 11.0 (0.4) -3.4% Parking 10.3 10.6 11.0 (0.4) -3.4%
$2.7 $2.8 $2.8 0.0 0.0% D.C. Schools $2.7 $2.8 $2.8 0.0 0.0%
$182.5 $187.8 $194.2 ($6.4) -3.3% subtotal $182.5 $187.8 $194.2 ($6.4) -3.3%
Non-Passenger Revenue
5.5 5.6 5.6 0.0 0.2% Advertising 5.5 5.6 5.6 0.0 0.2%
1.8 2.2 1.6 0.6 39.3% Joint Development 1.8 2.2 1.6 0.6 39.3%
4.0 3.9 3.9 0.0 1.0% Fiber Optic 4.0 3.9 3.9 0.0 1.0%
1.4 1.9 2.8 (0.9) -33.3% Other 1.4 1.9 2.8 (0.9) -33.3%
4.8 4.9 7.0 (2.1) -29.5% Reimbursables 4.8 4.9 7.0 (2.1) -29.5%
$17.5 $18.6 $21.0 ($2.3) -11.1% subtotal $17.5 $18.6 $21.0 ($2.3) -11.1%
$200.0 $206.4 $215.1 ($8.7) -4.1% TOTAL REVENUE $200.0 $206.4 $215.1 ($8.7) -4.1%
$194.5 $193.1 $202.5 $9.5 4.7% Salary/Wages $194.5 $193.1 $202.5 $9 4.7%
23.3 20.0 20.6 0.6 3.1% Overtime 23.3 20.0 20.6 0.6 3.1%
102.2 105.2 105.4 0.3 0.3% Fringe Benefits 102.2 105.2 105.4 0.3 0.3%
59.4 58.0 74.3 16.2 21.9% Services 59.4 58.0 74.3 16.2 21.9%
29.2 25.8 24.4 (1.4) -5.6% Supplies 29.2 25.8 24.4 (1.4) -5.6%
6.2 6.3 9.1 2.7 30.2% Fuel (Gas, Diesel, CNG) 6.2 6.3 9.1 2.7 30.2%
11.8 12.2 12.3 0.1 0.5% Propulsion Power 11.8 12.2 12.3 0.1 0.5%
9.1 8.7 9.7 1.0 10.2% Utilities 9.1 8.7 9.7 1.0 10.2%
7.0 9.0 10.5 1.4 13.7% Insurance/Other 7.0 9.0 10.5 1.4 13.7%
(12.7) (9.1) (12.3) (3.2) 25.8% Capital Indirect Allocation (12.7) (9.1) (12.3) (3.2) 25.8%
$429.9 $429.2 $456.5 $27.3 6.0% TOTAL EXPENSE $429.9 $429.2 $456.5 $27.3 6.0%
$229.9 $222.8 $241.4 $18.6 7.7% SUBSIDY $229.9 $222.8 $241.4 $18.6 7.7%
Favorable/(Unfavorable) Favorable/(Unfavorable)
46.5% 48.1% 47.1% COST RECOVERY RATIO 46.5% 48.1% 47.1%
Variance Variance
FIRST QUARTER RESULTS YEAR-TO-DATE RESULTS
Current Year Current Year

WMATA Financial Update - Management Report Q1 Fiscal Year 2018
27

WMATA Financial Update - Management Report Q1 Fiscal Year 2018
28

WMATA Financial Update - Management Report Q1 Fiscal Year 2018
29

WMATA Financial Update - Management Report Q1 Fiscal Year 2018
30
Appendix II: Capital Financials
Capital Program Summary by Project
$ in millions $1.250B $1.250B
2000/3000 Series Rail Car Replacement - $1.2 $0.1 $1.1 11%
7000 Series Rail Car Procurement 247.3 247.3 -8.1 255.4 -3%
Dulles Railcars 0.4 0.4 - 0.4 0%
Dulles Phase2 Rail Vehicles 99.4 99.3 81.2 18.1 82%
Railcar Acquisition $347.1 $348.2 $73.4 $274.8 21%
Railcar Rehabilitation Program 72.3 55.9 11.4 44.5 20%
Rail Car Safety & Reliability Enhancements 4.7 4.7 0.5 4.2 10%
Railcar Preventive Maintenance 60.1 60.1 13.0 47.1 22%
Repair of Damaged Railcars 0.8 0.8 0.0 0.8 5%
D&E Railcar Maintenance/Overhaul 0.1 0.1 - 0.1 0%
Railcar Maintenance/Overhaul $138.0 $121.6 $25.0 $96.7 21%
Rail Yard Facility Repairs 26.5 26.5 7.3 19.2 28%
Rail Yard Hardening and Bus Security 5.1 5.1 0.4 4.7 7%
7000 Series Rail Car HVAC Maintenance Facility 2.5 2.5 0.4 2.1 16%
Relocation of Maintenance Departments from Rail Yards 4.6 4.6 0.1 4.5 1%
D&E Rail Yard Improvements 4.0 1.3 - 1.3 0%
Railcar Maintenance Facilities $42.7 $40.0 $8.1 $31.9 20%
Railcar Investments 527.8$ 509.8$ 106.5$ 403.3$ 21%
Expend %Investment by Program
Washington Metropolitan Area Transit Authority
Capital Program Financials by Project
Fiscal Year 2018 - September 2017
FY2018 Q1
Actuals
FY2018 Current
Budget
FY2018 Board
Approved
Remaining
Budget
YTD Actuals
$228.3M
Forecast Range
$1.19-$1.26B
WMATA Financial Update - Management Report Q1 Fiscal Year 2018
31
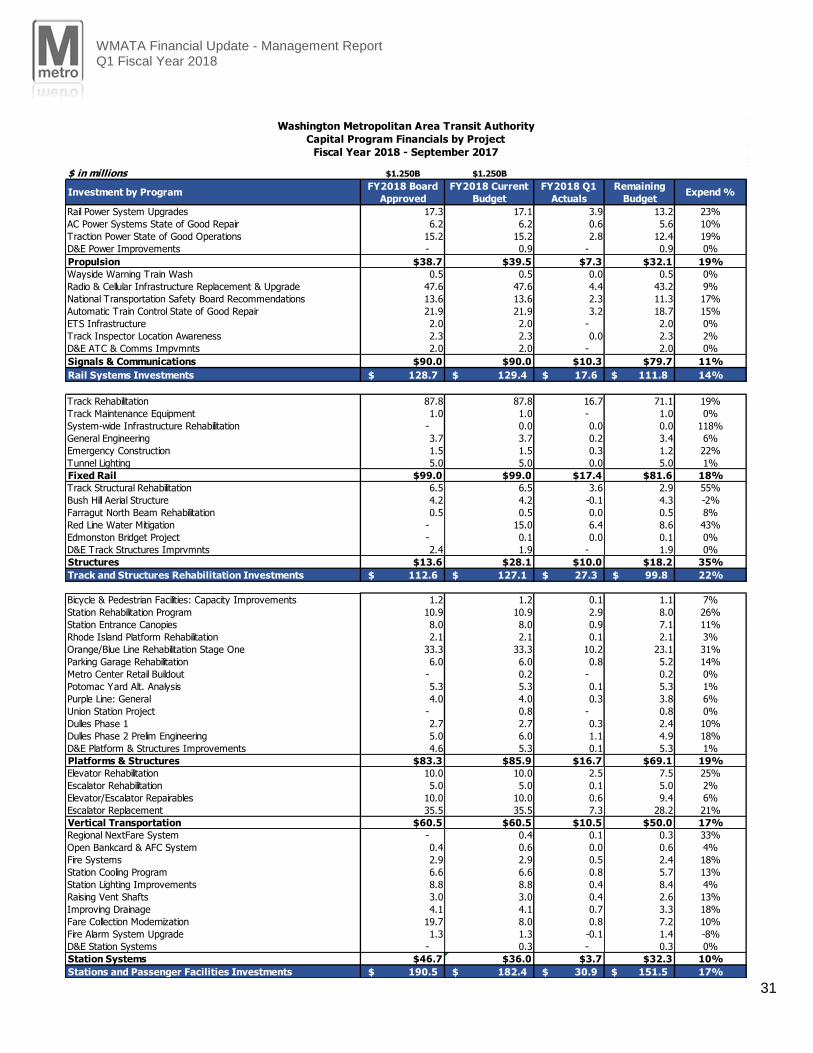
$ in millions $1.250B $1.250B
Rail Power System Upgrades 17.3 17.1 3.9 13.2 23%
AC Power Systems State of Good Repair 6.2 6.2 0.6 5.6 10%
Traction Power State of Good Operations 15.2 15.2 2.8 12.4 19%
D&E Power Improvements - 0.9 - 0.9 0%
Propulsion $38.7 $39.5 $7.3 $32.1 19%
Wayside Warning Train Wash 0.5 0.5 0.0 0.5 0%
Radio & Cellular Infrastructure Replacement & Upgrade 47.6 47.6 4.4 43.2 9%
National Transportation Safety Board Recommendations 13.6 13.6 2.3 11.3 17%
Automatic Train Control State of Good Repair 21.9 21.9 3.2 18.7 15%
ETS Infrastructure 2.0 2.0 - 2.0 0%
Track Inspector Location Awareness 2.3 2.3 0.0 2.3 2%
D&E ATC & Comms Impvmnts 2.0 2.0 - 2.0 0%
Signals & Communications $90.0 $90.0 $10.3 $79.7 11%
Rail Systems Investments 128.7$ 129.4$ 17.6$ 111.8$ 14%
Track Rehabilitation 87.8 87.8 16.7 71.1 19%
Track Maintenance Equipment 1.0 1.0 - 1.0 0%
System-wide Infrastructure Rehabilitation - 0.0 0.0 0.0 118%
General Engineering 3.7 3.7 0.2 3.4 6%
Emergency Construction 1.5 1.5 0.3 1.2 22%
Tunnel Lighting 5.0 5.0 0.0 5.0 1%
Fixed Rail $99.0 $99.0 $17.4 $81.6 18%
Track Structural Rehabilitation 6.5 6.5 3.6 2.9 55%
Bush Hill Aerial Structure 4.2 4.2 -0.1 4.3 -2%
Farragut North Beam Rehabilitation 0.5 0.5 0.0 0.5 8%
Red Line Water Mitigation - 15.0 6.4 8.6 43%
Edmonston Bridget Project - 0.1 0.0 0.1 0%
D&E Track Structures Imprvmnts 2.4 1.9 - 1.9 0%
Structures $13.6 $28.1 $10.0 $18.2 35%
Track and Structures Rehabilitation Investments 112.6$ 127.1$ 27.3$ 99.8$ 22%
Bicycle & Pedestrian Facilities: Capacity Improvements 1.2 1.2 0.1 1.1 7%
Station Rehabilitation Program 10.9 10.9 2.9 8.0 26%
Station Entrance Canopies 8.0 8.0 0.9 7.1 11%
Rhode Island Platform Rehabilitation 2.1 2.1 0.1 2.1 3%
Orange/Blue Line Rehabilitation Stage One 33.3 33.3 10.2 23.1 31%
Parking Garage Rehabilitation 6.0 6.0 0.8 5.2 14%
Metro Center Retail Buildout - 0.2 - 0.2 0%
Potomac Yard Alt. Analysis 5.3 5.3 0.1 5.3 1%
Purple Line: General 4.0 4.0 0.3 3.8 6%
Union Station Project - 0.8 - 0.8 0%
Dulles Phase 1 2.7 2.7 0.3 2.4 10%
Dulles Phase 2 Prelim Engineering 5.0 6.0 1.1 4.9 18%
D&E Platform & Structures Improvements 4.6 5.3 0.1 5.3 1%
Platforms & Structures $83.3 $85.9 $16.7 $69.1 19%
Elevator Rehabilitation 10.0 10.0 2.5 7.5 25%
Escalator Rehabilitation 5.0 5.0 0.1 5.0 2%
Elevator/Escalator Repairables 10.0 10.0 0.6 9.4 6%
Escalator Replacement 35.5 35.5 7.3 28.2 21%
Vertical Transportation $60.5 $60.5 $10.5 $50.0 17%
Regional NextFare System - 0.4 0.1 0.3 33%
Open Bankcard & AFC System 0.4 0.6 0.0 0.6 4%
Fire Systems 2.9 2.9 0.5 2.4 18%
Station Cooling Program 6.6 6.6 0.8 5.7 13%
Station Lighting Improvements 8.8 8.8 0.4 8.4 4%
Raising Vent Shafts 3.0 3.0 0.4 2.6 13%
Improving Drainage 4.1 4.1 0.7 3.3 18%
Fare Collection Modernization 19.7 8.0 0.8 7.2 10%
Fire Alarm System Upgrade 1.3 1.3 -0.1 1.4 -8%
D&E Station Systems - 0.3 - 0.3 0%
Station Systems $46.7 $36.0 $3.7 $32.3 10%
Stations and Passenger Facilities Investments 190.5$ 182.4$ 30.9$ 151.5$ 17%
Expend %Investment by Program
Washington Metropolitan Area Transit Authority
Capital Program Financials by Project
Fiscal Year 2018 - September 2017
FY2018 Q1
Actuals
FY2018 Current
Budget
FY2018 Board
Approved
Remaining
Budget

WMATA Financial Update - Management Report Q1 Fiscal Year 2018
32
$ in millions $1.250B $1.250B
Bus Replacement 63.0 63.0 -0.2 63.2 0%
MetroAccess Fleet Replacement 14.8 14.8 0.1 14.7 1%
Bus and Paratransit Acquisition $77.8 $77.8 $0.0 $77.9 0%
Automatic Vehicle Location Equipment 0.3 0.3 0.0 0.3 7%
Bus Repair Equipment 3.9 3.9 0.6 3.3 16%
Bus Rehabilitation Program 60.3 55.8 11.3 44.6 20%
Bus Camera Installation & Replacement 2.8 2.8 - 2.8 0%
Bus Maintenance/Overhaul $67.3 $62.8 $11.9 $50.9 19%
Bladensburg Shop CNG Equipment 2.0 2.0 0.0 2.0 1%
Andrews Federal Center Bus Garage 44.5 44.5 19.2 25.3 43%
Cinder Bed Road Bus Garage 4.5 8.4 1.8 6.6 22%
Shepherd Parkway Bus Facility 5.3 5.3 - 5.3 0%
D&E Bus Maint. Facilities 2.1 1.9 - 1.9 0%
Bus Maintenance Facilities $58.4 $62.1 $21.2 $40.9 34%
Bus Priority Corridor Network 1.3 1.3 0.2 1.1 16%
Bus Planning 0.6 0.6 0.1 0.6 8%
Bus Customer Facility Improvements 1.6 1.6 0.0 1.5 3%
Traffic Signal Prioritization 2.9 2.0 - 2.0 0%
Chevy Chase Bus Loop - 0.8 - 0%
King Street Station Bus Loop 1.3 1.3 -0.1 1.3 -5%
Bus Passenger Facilities/Systems $7.6 $7.6 $0.2 $6.5 3%
Bus and Paratransit Investments 211.1$ 210.3$ 33.3$ 176.2$ 16%
Bus & Rail Asset Management Software 6.6 6.6 0.8 5.8 13%
Bus Operations Support Software 2.0 1.6 0.0 1.6 3%
IT Capital Prog Business Process Reengineering & Prog Support 4.3 2.5 0.4 2.1 15%
Data Centers and Infrastructures 4.8 6.3 0.2 6.1 3%
Document Management System 0.2 0.2 0.1 0.1 44%
Enterprise Geographic Information System 0.6 0.6 0.2 0.4 27%
Sensitive Data Protection Technology 0.3 0.3 - 0.3 0%
Management Support Software 6.8 6.8 2.3 4.4 35%
Police Dispatch and Records Management 4.7 3.0 0.4 2.6 14%
Network and Communications 8.7 15.8 2.4 13.4 15%
Customer Electronic Communications & Outreach 1.9 2.3 0.4 1.9 17%
Rail Operations Support Software 3.0 3.5 0.4 3.1 11%
Data Governance and Business Intelligence 1.3 1.3 0.2 1.0 18%
Safety Measurement System 2.2 2.2 0.5 1.7 21%
Rail Scheduling System Upgrade 1.3 2.3 0.0 2.3 1%
Time Keeping 6.5 6.5 1.5 5.0 23%
D&E IT - 4.6 0.2 4.4 4%
IT $55.1 $66.4 $10.2 $56.2 15%
Support Equipment - MTPD 1.0 1.0 0.0 1.0 5%
MTPD $1.0 $1.0 $0.0 $1.0 5%
Service Vehicle Replacement & Leasing 1.5 2.0 - 2.0 0%
Environmental Compliance Project 1.1 1.1 0.1 1.0 7%
Underground Storage Tank Replacement 2.8 2.0 0.2 1.8 10%
Materials Handling Equipment 0.5 0.5 0.0 0.5 5%
Core & System Capacity Project Development 0.8 1.0 0.1 0.9 7%
Building Infrastructure & Systems Renewal 2.0 2.0 0.0 2.0 -1%
Financial Plan/Systemwide Upgrade 1.2 1.2 0.0 1.1 3%
Credit Facility 1.0 1.0 0.4 0.6 36%
Transit Asset Inventory 3.3 3.3 0.7 2.5 23%
Roof Rehabilitation and Replacement 4.0 4.0 0.6 3.4 15%
Pollution Prevention - Track 0.7 0.7 0.0 0.7 -6%
Stormwater Facility Assessment 0.8 1.2 0.0 1.1 0%
Sustainability Investments - Pilot Program 0.7 0.7 0.1 0.6 13%
Planning Support DC 1.0 1.0 0.1 0.9 7%
Planning Support for MD 1.0 1.0 0.1 0.9 7%
Planning Support for VA 1.0 1.0 0.2 0.8 18%
Support Equipment/Services $23.3 $23.6 $2.4 $21.2 10%
Business Support Investments 79.4$ 91.0$ 12.6$ 78.3$ 14%
Total Capital Programs 1,250.0$ 1,250.0$ 228.3$ 1,020.9$ 18%
Expend %Investment by Program
Washington Metropolitan Area Transit Authority
Capital Program Financials by Project
Fiscal Year 2018 - September 2017
FY2018 Q1
Actuals
FY2018 Current
Budget
FY2018 Board
Approved
Remaining
Budget
WMATA Financial Update - Management Report Q1 Fiscal Year 2018
33
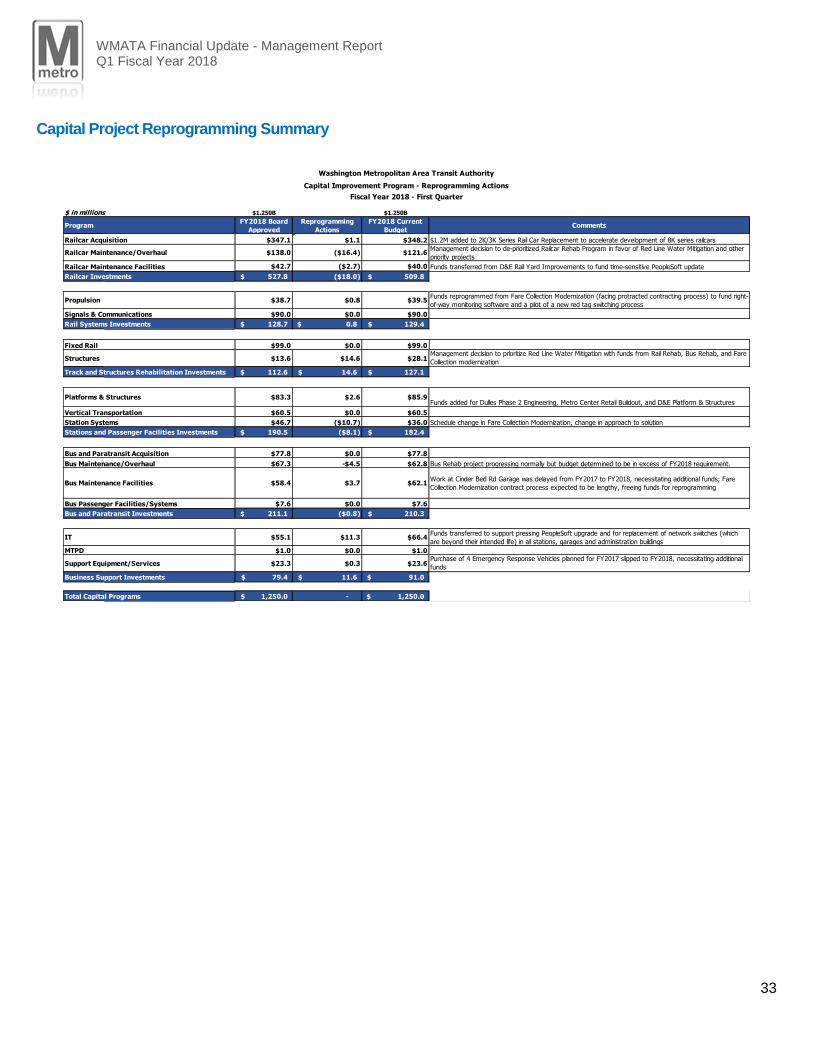
Capital Project Reprogramming Summary
$ in millions $1.250B $1.250B
Railcar Acquisition $347.1 $1.1 $348.2 $1.2M added to 2K/3K Series Rail Car Replacement to accelerate development of 8K series railcars
Railcar Maintenance/Overhaul $138.0 ($16.4) $121.6Management decision to de-prioritized Railcar Rehab Program in favor of Red Line Water Mitigation and other
priority projects
Railcar Maintenance Facilities $42.7 ($2.7) $40.0 Funds transferred from D&E Rail Yard Improvements to fund time-sensitive PeopleSoft update
Railcar Investments 527.8$ ($18.0) 509.8$
Propulsion $38.7 $0.8 $39.5Funds reprogrammed from Fare Collection Modernization (facing protracted contracting process) to fund right-
of-way monitoring software and a pilot of a new red tag switching process
Signals & Communications $90.0 $0.0 $90.0
Rail Systems Investments 128.7$ 0.8$ 129.4$
Fixed Rail $99.0 $0.0 $99.0
Structures $13.6 $14.6 $28.1Management decision to prioritize Red Line Water Mitigation with funds from Rail Rehab, Bus Rehab, and Fare
Collection modernization
Track and Structures Rehabilitation Investments 112.6$ 14.6$ 127.1$
Platforms & Structures $83.3 $2.6 $85.9Funds added for Dulles Phase 2 Engineering, Metro Center Retail Buildout, and D&E Platform & Structures
Vertical Transportation $60.5 $0.0 $60.5
Station Systems $46.7 ($10.7) $36.0 Schedule change in Fare Collection Modernization, change in approach to solution
Stations and Passenger Facilities Investments 190.5$ ($8.1) 182.4$
Bus and Paratransit Acquisition $77.8 $0.0 $77.8
Bus Maintenance/Overhaul $67.3 -$4.5 $62.8 Bus Rehab project progressing normally but budget determined to be in excess of FY2018 requirement.
Bus Maintenance Facilities $58.4 $3.7 $62.1Work at Cinder Bed Rd Garage was delayed from FY2017 to FY2018, necessitating additional funds; Fare
Collection Modernization contract process expected to be lengthy, freeing funds for reprogramming
Bus Passenger Facilities/Systems $7.6 $0.0 $7.6
Bus and Paratransit Investments 211.1$ ($0.8) 210.3$
IT $55.1 $11.3 $66.4Funds transferred to support pressing PeopleSoft upgrade and for replacement of network switches (which
are beyond their intended life) in all stations, garages and administration buildings
MTPD $1.0 $0.0 $1.0
Support Equipment/Services $23.3 $0.3 $23.6Purchase of 4 Emergency Response Vehicles planned for FY2017 slipped to FY2018, necessitating additional
funds
Business Support Investments 79.4$ 11.6$ 91.0$
Total Capital Programs 1,250.0$ - 1,250.0$
CommentsReprogramming
Actions
Washington Metropolitan Area Transit Authority
Capital Improvement Program - Reprogramming Actions
Fiscal Year 2018 - First Quarter
FY2018 Current
Budget
FY2018 Board
Approved Program

WMATA Financial Update - Management Report Q1 Fiscal Year 2018
34
Appendix III: FTA Grant Status
A. Active Grants Active Federal Transit Administration Grants as of 9/30/2017
Grant No. Grant Description Award Date
Federal Award
Drawn Balance
DC-95-X004 VA CMAQ Bus Purchase/ VA Projects 9/3/2008 $4.1 $4.0 $0.1
DC-04-0007 FY10 SGR Asset Management 7/11/2011 $3.9 $2.1 $1.8
DC-57-X007 New Freedom Bus Stop Improvements 2/13/2012 $1.0 $0.1 $0.9
DC-26-7363 Transit Works: 2012 Workforce Grant 4/30/2014 $0.8 $0.3 $0.5
DC-75-0004 FFY2013 PRIIA Appropriation 6/5/2014 $142.2 $142.2 $0.0
DC-04-0008 Bus Livability - Bus Stop Improvements 9/11/2014 $1.5 $0.0 $1.5
DC-90-X088 FFY 13 and 14 5307/5340 Formula Grant 1/16/2015 $240.9 $240.9 $0.0
DC-75-0005 FFY 14 PRIIA Appropriation 4/8/2015 $148.5 $145.2 $3.3
DC-44-X001 FFY 13 Hurricane Sandy Resilience 4/10/2015 $21.0 $0.5 $20.5
DC-90-X089 FFY 15 5307/5340 Formula Grant 9/17/2015 $146.7 $133.8 $12.9
DC-54-0002 FFY 15 SOGR 9/17/2015 $131.5 $118.2 $13.3
DC-75-0006 FFY 15 PRIIA Appropriation 9/23/2015 $148.5 $137.5 $11.0
DC-2016-008 FY2016 5307/5340 Formula Funding 7/29/2016 $147.0 $116.7 $30.3
DC-2016-009 FFY2016 5337 State of Good Repair 8/11/2016 $147.2 $123.6 $23.6
DC-2016-010 FFY2016 PRIIA Appropriation 8/19/2016 $148.5 $110.0 $38.5
DC-2017-004 FFY2017 5339 Bus Program 4/25/2017 $8.4 $0 $8.4
DC-2017-005 WMATA Safety Preventative Maintenance 5/12/2017 $163.3 $124.5 $38.8
DC-2017-006 FFY2017 PRIIA Appropriation 5/23/2017 $148.5 $2.3 $146.2
DC-2017-007 FFY2017 5337 State of Good Repair 5/23/2017 $145.5 $16.3 $129.2
DC-2017-009 VA RSTP Replacement Buses 6/05/2017 $0.6 $0 $0.6
DC-2017-010 Section 5310 Metro Access Fleet Replacement
6/09/2017 $0.5 $0 $0.5
DC-2017-011 Track Inspector Location Awareness With Enhanced Transit Worker Protection
8/15/2017 $1.9 $0 $1.9
DC-2017-014 FFY2017 5307/5340 Formula Funding 9/21/2017 $151.0 $2.1 $148.9
Total $2,053.0 $1,420.3 $632.7

WMATA Financial Update - Management Report Q1 Fiscal Year 2018
35
B. Closed Grants Federal Transit Administration Grants Closed During FY2015/FY2016/FY2017 as of 09/30/2017
Grant No. Grant Description Award Date
Federal Award
Closed Date
DC-95-X012 VA FFY09 CMAQ Bus Purchase 9/11/2012 $3.9 4/30/2015
DC-26-7209 Energy Storage Demonstration Grant 6/22/2009 $0.3 1/05/2017
DC-05-0009 FFY 2007 5309 Fixed Guideway 9/24/2007 $81.2 6/07/2017
DC-05-0011 FFY 2009 5309 Fixed Guideway 5/04/2010 $100.5 6/14/2017
DC-05-0012 FFY 2010 5309 Fixed Guideway 6/01/2011 $101.3 6/05/2017
DC-05-0013 FFY 2011 5309 Fixed Guideway 3/5/2012 $101.2 6/01/2017
DC-05-0014 FFY 2012 5309 Fixed Guideway 3/28/2013 $97.3 5/18/2017
DC-2016-007 FFY2016 5339 Bus Program 7/29/2016 $8.4 6/14/2017
DC-34-0001 FFY 2013/FY2014 5339 Bus 1/16/2015 $19.5 6/08/2017
DC-34-0002 FFY 2015 5339 Bus 9/17/2015 $9.7 6/14/2017
DC-54-0001 FFY 2013/FFY2014 5337 SOGR 2/13/2015 $161.2 6/07/2017
DC-75-0001 FFY 2010 PRIIA Appropriation 12/31/2010 $150.0 6/05/2017
DC-75-0002 FFY 2011 PRIIA Appropriation 6/27/2012 $149.7 6/07/2017
DC-75-0003 FFY 2012 PRIIA Appropriation 3/26/2013 $150.0 6/07/2017
DC-90-X083 FFY 2009 5307/4340 Formula Funds 5/04/2010 $138.4 6/06/2017
DC-90-X085 FFY 2010 5307/4340 Formula Funds 2/24/2011 $139.4 6/05/2017
DC-90-X086 FFY 2011 5307/4340 Formula Funds 9/23/2011 $141.8 6/05/2017
DC-90-X087 FFY 2012 5307/4340 Formula Funds 4/1/2013 $140.7 6/05/2017
DC-03-0039 Largo Extension FFGA – FY10 Appropriation
12/15/2000 $358.2 7/07/2017
DC-95-X015 VA CMAQ/RSTP Replacement Buses 11/25/2015 $27.9 7/07/2017
Total $2,080.6
C. Current & Planned Grant Applications Pending Federal Transit Administration Grant Applications as of 9/30/2017
Grant Description September 30, 2017 Status Federal Award
FFY2017 VA CMAQ/RSPT
Under FTA review $5.5
Total $5.5

WMATA Financial Update - Management Report Q1 Fiscal Year 2018
36
Appendix IV: Glossary of Acronyms
A
A&E – Architecture and engineering
AA – Alternatives analysis
AAI-CAF – (Spanish acronym) manufacturer of the
5000 Series rail cars
AC – Air conditioning or alternating current
ACI – Automatic car transponder identification
system
ADA – Americans with Disabilities Act
AFC – Automatic fare collection
AGT – Automated guide-way transit
AIM – Advanced information management
AIT – Arts in Transit
AP – Accounts Payable
APS – Auxiliary power supply
APTA – American Public Transportation Association
AQAP – Office of Quality Assurance Quality &
Performance
ARS – Adopted regional system
AST – Above-ground storage tank
ATC – Automatic train control
ATO – Automated train operation
ATD – Advanced technology diesel
ATS – Automatic transfer switch
AVL – Automatic vehicle locator
AVR – Automatic voltage regulator
AWP – Annual work plan
B
BAFO – Best and final offer
BDA – Bi-directional amplifiers
BEAC – Budget estimate at completion
BPR – Business process re-engineering
BRT – Bus rapid transit
C
CAD – Computer-aided dispatch
CADD – Computer-aided design and drafting
CAFE – Computer authorization for expenditure
workflow system
CAFR – Comprehensive annual financial report
CAP – Corrective Action Plan
CCP – Communications control panel
CCTV – Closed-circuit television
CDR – Conceptual design review
CFA – Capital Funding Agreement
CIP – Capital improvement project
CIWS – Customer information web services
CM – Construction manager
CMAA – Construction Management Association of
America
CMAQ – Congestion mitigation and air quality
CMC – Construction management consultant
CMU – Concrete masonry unit
CNG – Compressed natural gas
COG – (Metropolitan Washington) Council of
Governments
COLA – Cost of living adjustment
COTS – Commercial off the shelf
CPOS – Compact point of sale
CRCS – Comprehensive radio communications
system
CSP – Construction safety program
CTB – (Virginia) Commonwealth Transportation
Board
CTF – Carmen Turner Facility
WMATA Financial Update - Management Report Q1 Fiscal Year 2018
37
D
D/B – Design/build
D/B/B – Design/bid/build
DBE – Disadvantaged business enterprise
DBFM – Dynamic brake feedback module
DCI – Data center & infrastructure
DCU – Door control unit
DEIS – Draft environmental impact statement
DPS – Drainage pumping station
DRB – Dispute Review Board
DRPT – (Virginia) Department of Rail and Public
Transportation
DTP – Dulles Transit Partners, LLC
E
E&O – Errors and omissions
EA – Environmental assessment
EDADS – Enhanced data acquisition and display
system
EIS – Environmental impact statement
EMI – Engineering modification instructions or
electro-magnetic interference
EMIH – Environmental management & industrial
health
EPA – Environmental Protection Agency
EPM – Enterprise performance management
ERRP – Emergency rail rehabilitation program
ETEC – Emergency tunnel evacuation carts
ETC – Estimate to complete
EV – Earned value
F
FAI – First article inspection
FAST – Fixing America’s Surface Transportation Act
FCCI – First car configuration inspection
FDR – Final design review
FEIS – Final environmental impact statement
FFGA – Full funding grant agreement
FFP – Firm-fixed price
FHWA – Federal Highway Administration
FIA – Fire and intrusion alarm
FMO – Financial management oversight
F/O – Fiber optic
FRA – Federal Railroad Administration
FTE – Full time equivalent
FTA – Federal Transit Administration
FUA – First unit accepted
G
GAAP – Generally accepted accounting principles
GEC – General engineering consultant
GFOA – Government Finance Officers Association
GIS – Geographic information system
GMP – Guaranteed maximum price
GOTRS – General order track rights system
GPS – Global positioning system
H
HCM – Human capital management
HEDS – Hybrid enterprise document management
system
HEOP – Heavy equipment overhaul program
HVAC – Heating, ventilation, and air conditioning
I
IAM – Identity and access management
IAWP – Integrated annual work plan
ICCA – Interim Capital Contributions Agreement
ICE – Independent cost estimate
IFC – Issued for construction
IFO – Integrated finance organization - finance
project
IFP – Integrated financial plan
IGF – Internally generated funds
IRP – Infrastructure renewal program
ITS – Intelligent transportation systems

WMATA Financial Update - Management Report Q1 Fiscal Year 2018
38
J
JARC – Job access/reverse commute
JCC – Jurisdictional Coordinating Committee
JGB – Jackson Graham Building
JOC – Job order contracting program (See Also:
MATOC)
L
LBT – Large bore tunnel
LD – Liquidated damages
LNTP – Limited notice to proceed
LPA – Locally preferred alternative
LRT – Light rail transit
LRV – Light rail vehicle
LUA – Last unit accepted
M
MAP-21 – Moving Ahead for Progress in the 21st
Century Act
MARC – Maryland Area Regional Commuter Train
MATOC – Multiple award task order contract
MCC – Motor control center
MDBD – Mean distance between delays
MDBF – Mean distance between failures
MDBS – Mean distance between service
interruptions
ME – Month-end
MEAD – Metro electronic action document
MIS – Major investment study
MMFA – Metro Matters Funding Agreement
MMMS – Material maintenance and management
system
MMP – Metro matters program
MMU – Mobile maintenance unit
MOD – (Contract) Modification
MOS – Minimum operable segment
MPS – Master program schedule
MTA – Maryland Transit Administration
MTPD – Metro Transit Police Department
MTTR – Mean time to repair
MWAA – Metropolitan Washington Airports Authority
MWCOG – Metropolitan Washington Council of
Governments
N
NCPC – National Capital Planning Commission
NEPA – National Environmental Policy Act
NSP – New Starts Project
NTSB – National Transportation Safety Board
NTD – National transit database
NTE – Not to exceed
NTI – National Transit Institute
NTP – Notice to proceed
O
O&M – Operating and maintenance (such as O&M
costs)
OCC – Operations Control Center
ODC – Other direct costs
OFS – Order for services
OIG – Office of Inspector General
OTP – On-time performance
OWS – Oil water system
P
PCI – Payment card industry
PCO – Pending (or proposed) change order
PDR – Preliminary design review
PE – Preliminary engineering
P/I – Policy instruction
PIDS – Passenger Information Display System
PLE – Parking lot equipment
PM – Project manager
PMI – Project Management Institute
PMO – Project management oversight

WMATA Financial Update - Management Report Q1 Fiscal Year 2018
39
PMOC – Project management oversight contractor
PMP – Project management plan
PPE – Personal protective equipment
PSS – Program Station Stop /Public Safety System
Q
QA – Quality assurance
QC – Quality control
R
RAC – Riders’ Advisory Council
RCSC – Regional Customer Service Center
RE – Resident engineer
RFP – Request for proposal
RFQ – Request for qualifications
RMS – Records Management System
ROCS – Rail Operations Computer System
ROD – Record of decision /Revenue operations date
ROW – Right of way
RTU – Remote terminal unit
S
S&I – Storage/service and inspection
SAP – System access program /Safety awareness
program
SCI – Substantial completion inspections
SCP – Safety Certification Program
SCWG – Safety certification working group
SEIP – System Expansion and Improvement
Program
SM – Switch machine
SMADS – Station monitor and display system (fare
collection equipment)
SMS – Safety measurement system
SOC – Station operator’s console
SOS – Scope of service
SOW – Scope of work
STOV – Station over-run
SOA – Safety oversight agency
SSPP – System safety program plan
SSPS – System safety program standards
SSWP – Site specific work plan
T
TBS – Tie breaker station
TC – Train control
TCR – Train control room
TIFIA – Transportation Infrastructure Finance &
Innovation Act
TIIF – Transportation Infrastructure Investment Fund
TIP – Transportation Improvement Program
TOC – Tristate Oversight Committee
TOD – Transit oriented development
TPSG – Traction power switch gear
TPSS – Traction power substation
TSI – Transportation Safety Institute
TSP – Transit signal priority
TUN – Temporary user notice
U
UPS – Uninterrupted power supply
UST – Under-ground storage tank
V
VE – Value engineering
VMS – Vehicle Management/Monitoring System
VRE – Virginia Railway Express
W
WBS – Work breakdown structure
WMATA – Washington Metropolitan Area Transit
Authority
WMS – Warehouse Management System
Y
YE – Year end
YOE – Year of expenditure
YTD – Year to date

40
WMATA Offices & Departments
A
ACCS Access Services, Department of
ACCT Accounting, Office of
ADAP ADA Policy and Planning, Office of
AMA Asset Mission Assurance, Office of
APPS Application Development &
Operations
AQAP Assurance, Quality and
Performance, Office of
ATCM ATC Maintenance, Office of
B
BMNT Bus Maintenance, Office of
BOCC Bus Operations Communications
Center
BPLN Bus Planning, Office of
BPR Business Process Re-Engineering
BTRA Bus Transportation, Office of
BUSV Bus Services, Department of
C
CENI Chief Engineer Infrastructure Services
CENV Vehicle Program Services
CFO Chief Financial Officer
CHOS Office of the Chief of Staff
CMNT Rail Car Maintenance
CMO Chief Mechanical Officer, Office of
COO Chief Operating Officer, Office of
COUN General Counsel
CPDO Capital Program Delivery, Office of
CPMO Capital Program Management Office
CPO Performance, Office of
CRSV Creative Services
CSCM Customer Service, Communications
and Marketing, Department of
CSVC Customer Service, Office of
D
DCI Data Center & Infrastructure
DGMO – Deputy General Manager,
Operations
E
EAGOV Enterprise Architecture
Governance, Office of
ELES Elevators and Escalators, Office of
ELIG Eligibility Certification and Outreach,
Office of
EMIH Environmental Management and
Industrial Hygiene
ENG Chief Engineer, Office of
EREL External Relations, Office of
EXRL Chief External Relations, Office of
G
GMGR General Manager
GOVR Government Relations, Office of
H
HR Human Resources, Department of
HRCB HR Compensation and Benefits
HRIM HR Information Management
HRTA HR Talent Acquisition
I
IACO Internal Assurance and Compliance,
Office of
IPLN Intermodal Strategic Planning
IT Information Technology, Department of

41
L
LABR Labor Relations
LAND Real Estate and Station Planning,
Office of
M
MACS MetroAccess Service, Office of
MCAP Major Capital Projects, Office of
MIPN Material & Inventory Planning, Office
of
MITS IT Security
MKTG Marketing and Advertising, Office of
MOWE Chief Maintenance of Way
Engineering, Office of
MREL Media Relations, Office of
MTPD Metro Transit Police Department
N
NCS Network & Communications
O
OEEO Equal Employment Opportunity,
Office of
OEM Emergency Management, Office of
OIG Inspector General, Office of
OMBS Management and Budget Services,
Office of
OPMS Operations Management Services
P
PARK Parking, Office of
PLAN Planning, Office of
PLNT Plant Maintenance, Office of
PMO Project Management Operations
PRMT Procurement and Materials, Office of
Q
QICO Quality and Internal Compliance
Operations, Office of
QMA Quality Mission Assurance (QMA)
R
RADS Replication and Digitizing Services
RAIL Rail Services, Department of
RCMP Reliability Centered Maintenance
Planning, Office of
RISK Risk Management, Office of
ROCC Rail Operations Central Control,
Office of
ROQT Rail Operations Quality Training
RTRA Rail Transportation, Office of
RTW Return To Work
S
SAFE System Safety and Environmental
Management, Department of
SBRS SmartBenefits and Retail Sales
SCES Supply Chain Enterprise Services
SECT Board Secretary, Office of
SMNT Systems Maintenance
SRML Storerooms & Material Logistics,
Office of
SVMT Service Vehicle Maintenance
T
TIMS Transit Infrastructure Maintenance
Systems
TRES Treasurer, Office of
TRST Track and Structures, Office of
TSMT Technical Skills and Maintenance
Training