wizards for tsm - debriefingsoftware.com · wsp contains a plug-in for ibm tivoli storage manager...
TRANSCRIPT
Debriefing Software
August 2013
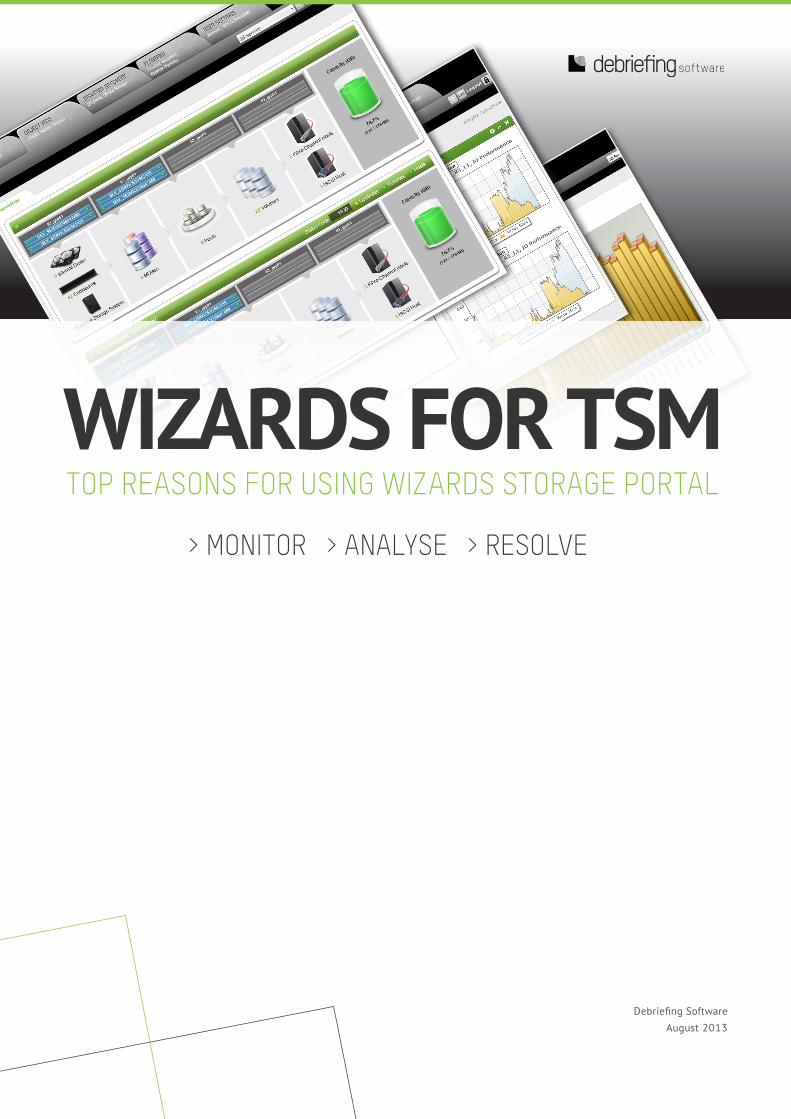
TOP REASONS FOR USING WIZARDS STORAGE PORTAL
WIZARDS FOR TSM> MONITOR > ANALYSE > RESOLVE
Table of Contents
Introduction . . . . . . . . . . . . . . . . . . . . . . . . . . . . . . . . . . . . . . . . . . . . . . . . . . . . . . . . . . . . . . . . . . . . . . . 3
User configurable dash-board . . . . . . . . . . . . . . . . . . . . . . . . . . . . . . . . . . . . . . . . . . . . . . . . . . . . . . . . . 4
Drill-down and Drill-up . . . . . . . . . . . . . . . . . . . . . . . . . . . . . . . . . . . . . . . . . . . . . . . . . . . . . . . . . . . . . . 5
Two-week event history . . . . . . . . . . . . . . . . . . . . . . . . . . . . . . . . . . . . . . . . . . . . . . . . . . . . . . . . . . . . . . .7
Occupancy History . . . . . . . . . . . . . . . . . . . . . . . . . . . . . . . . . . . . . . . . . . . . . . . . . . . . . . . . . . . . . . . . . . .7
Delta Reports . . . . . . . . . . . . . . . . . . . . . . . . . . . . . . . . . . . . . . . . . . . . . . . . . . . . . . . . . . . . . . . . . . . . . . . 9
Heat Maps . . . . . . . . . . . . . . . . . . . . . . . . . . . . . . . . . . . . . . . . . . . . . . . . . . . . . . . . . . . . . . . . . . . . . . . . . 9
Configuration Overview . . . . . . . . . . . . . . . . . . . . . . . . . . . . . . . . . . . . . . . . . . . . . . . . . . . . . . . . . . . . . . . 9
Client and Server Activity Graphs . . . . . . . . . . . . . . . . . . . . . . . . . . . . . . . . . . . . . . . . . . . . . . . . . . . . . 10
Activity Log Browser . . . . . . . . . . . . . . . . . . . . . . . . . . . . . . . . . . . . . . . . . . . . . . . . . . . . . . . . . . . . . . . . 11
Drive & Library Utilization . . . . . . . . . . . . . . . . . . . . . . . . . . . . . . . . . . . . . . . . . . . . . . . . . . . . . . . . . . 12
24x7 Monitoring . . . . . . . . . . . . . . . . . . . . . . . . . . . . . . . . . . . . . . . . . . . . . . . . . . . . . . . . . . . . . . . . . . . 13
WSP Mobile . . . . . . . . . . . . . . . . . . . . . . . . . . . . . . . . . . . . . . . . . . . . . . . . . . . . . . . . . . . . . . . . . . . . . . . 13
Gantt Charts . . . . . . . . . . . . . . . . . . . . . . . . . . . . . . . . . . . . . . . . . . . . . . . . . . . . . . . . . . . . . . . . . . . . . . 14
Dynamic API . . . . . . . . . . . . . . . . . . . . . . . . . . . . . . . . . . . . . . . . . . . . . . . . . . . . . . . . . . . . . . . . . . . . . . 16
How to get started . . . . . . . . . . . . . . . . . . . . . . . . . . . . . . . . . . . . . . . . . . . . . . . . . . . . . . . . . . . . . . . . . . 17
About Debriefing Software . . . . . . . . . . . . . . . . . . . . . . . . . . . . . . . . . . . . . . . . . . . . . . . . . . . . . . . . . . . 17
3
Introduction
Wizards Storage Portal (WSP) is a cloud-based backup reporting and storage resource management solution .
WSP contains a plug-in for IBM Tivoli Storage Manager (TSM), which allows rapid deployment of a rich repor-
ting and monitoring solution without any need for additional hardware or databases . All meta-data is stored in
the cloud and reports are available from any web browser or mobile device .
Traditionally, backup reporting has been a daily email with a list of transferred GB’s, backup failures and error
logs . But over the past decade, the activity pattern of backup systems has changed dramatically and the central
backup system has grown to become a mission critical part of any company’s IT infrastructure . This raises new
demands for the reporting solutions also .
The daily email is a thing of the past . Today’s backup reporting is online and up-to-date and it includes easy
access to historical reports, drill-down of problem areas and factual data for documenting fulfillment of SLA’s .
This paper presents a small selection of the reports found in Wizards Storage Portal .
Jesper Matthiesen
CTO, Debriefing Software
4
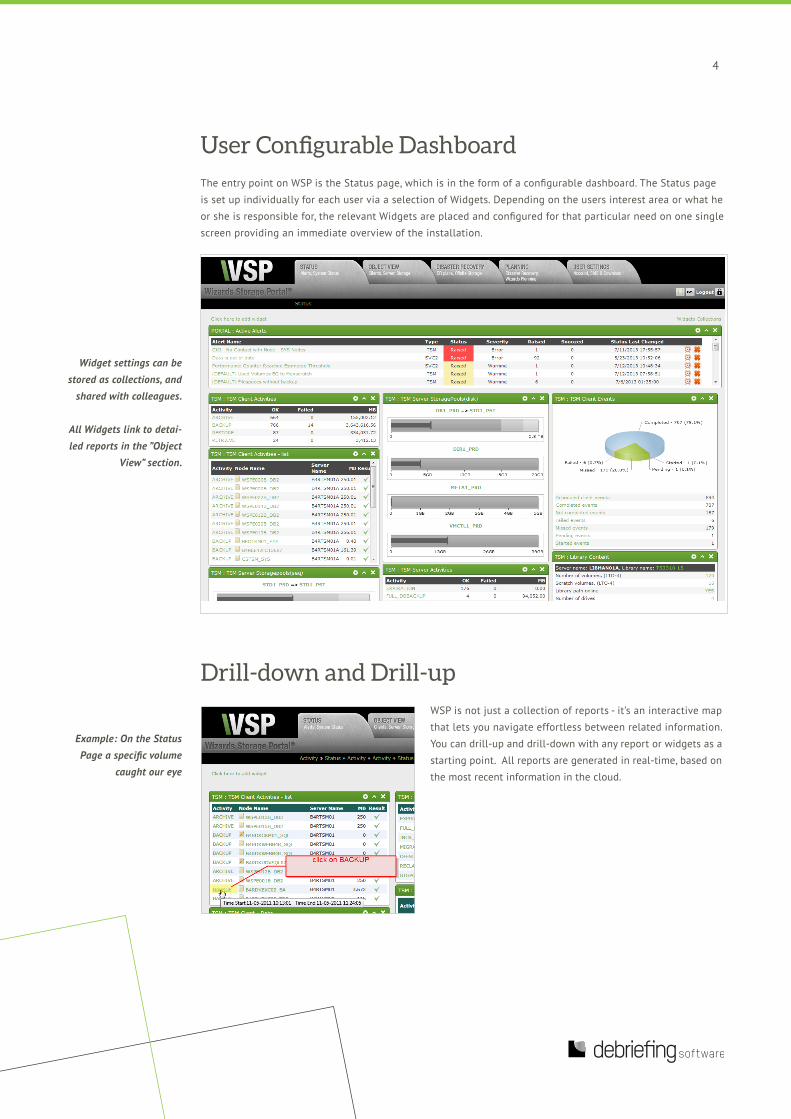
User Configurable Dashboard
The entry point on WSP is the Status page, which is in the form of a configurable dashboard . The Status page
is set up individually for each user via a selection of Widgets . Depending on the users interest area or what he
or she is responsible for, the relevant Widgets are placed and configured for that particular need on one single
screen providing an immediate overview of the installation .
’
Drill-down and Drill-up
WSP is not just a collection of reports - it’s an interactive map
that lets you navigate effortless between related information .
You can drill-up and drill-down with any report or widgets as a
starting point . All reports are generated in real-time, based on
the most recent information in the cloud .
Widget settings can be stored as collections, and
shared with colleagues.
All Widgets link to detai-led reports in the ”Object
View” section.
Example: On the Status Page a specific volume
caught our eye
5
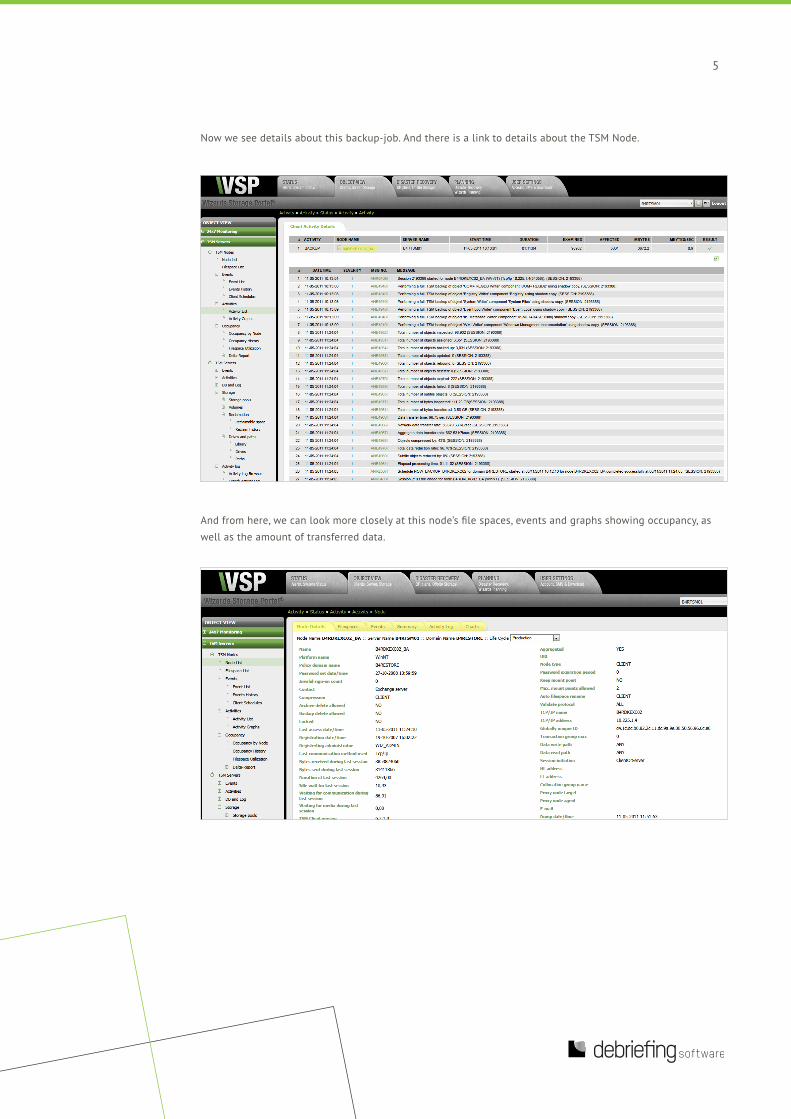
Now we see details about this backup-job . And there is a link to details about the TSM Node .
And from here, we can look more closely at this node’s file spaces, events and graphs showing occupancy, as
well as the amount of transferred data .
6
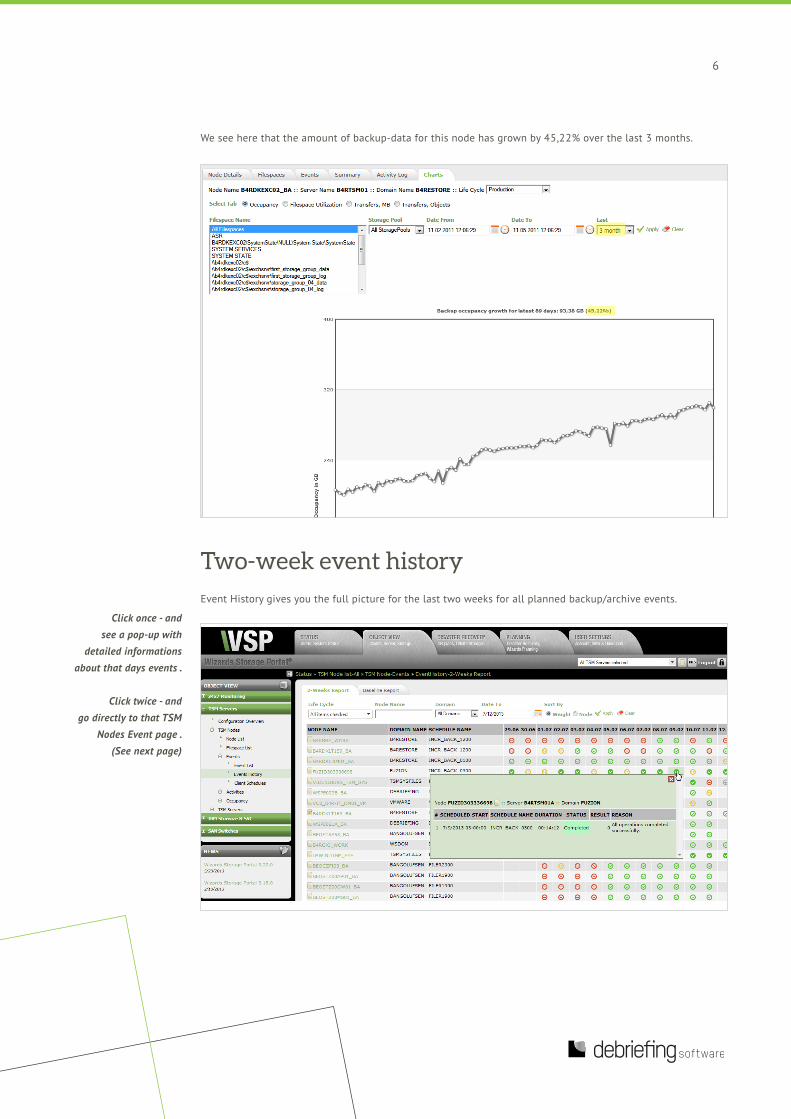
We see here that the amount of backup-data for this node has grown by 45,22% over the last 3 months .
Two-week event history
Event History gives you the full picture for the last two weeks for all planned backup/archive events .
Click once - and see a pop-up with
detailed informations about that days events .
Click twice - and
go directly to that TSM Nodes Event page .
(See next page)
7
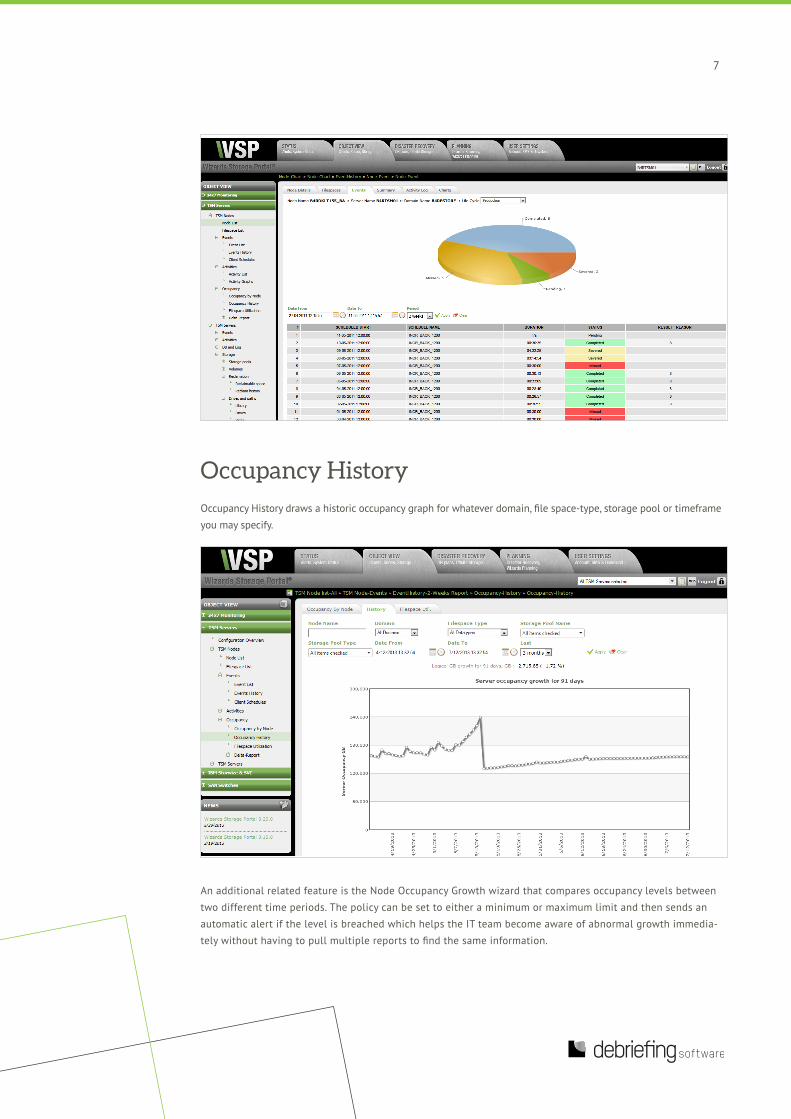
Occupancy History
Occupancy History draws a historic occupancy graph for whatever domain, file space-type, storage pool or timeframe
you may specify .
An additional related feature is the Node Occupancy Growth wizard that compares occupancy levels between
two different time periods . The policy can be set to either a minimum or maximum limit and then sends an
automatic alert if the level is breached which helps the IT team become aware of abnormal growth immedia-
tely without having to pull multiple reports to find the same information .
8
Delta Reports
Delta-Reports lists differences in your TSM system between two given dates . WSP stores historical data about
TSM’s performance, which enables you to document trends and changes in the system .
Use delta-reports to track › New or discontinued nodes - practical when carrying out license audits .
› New file spaces - New drives might have been added or existing file spaces may have been renamed .
› File spaces with highest growth - reveal fast growing storage consumers .
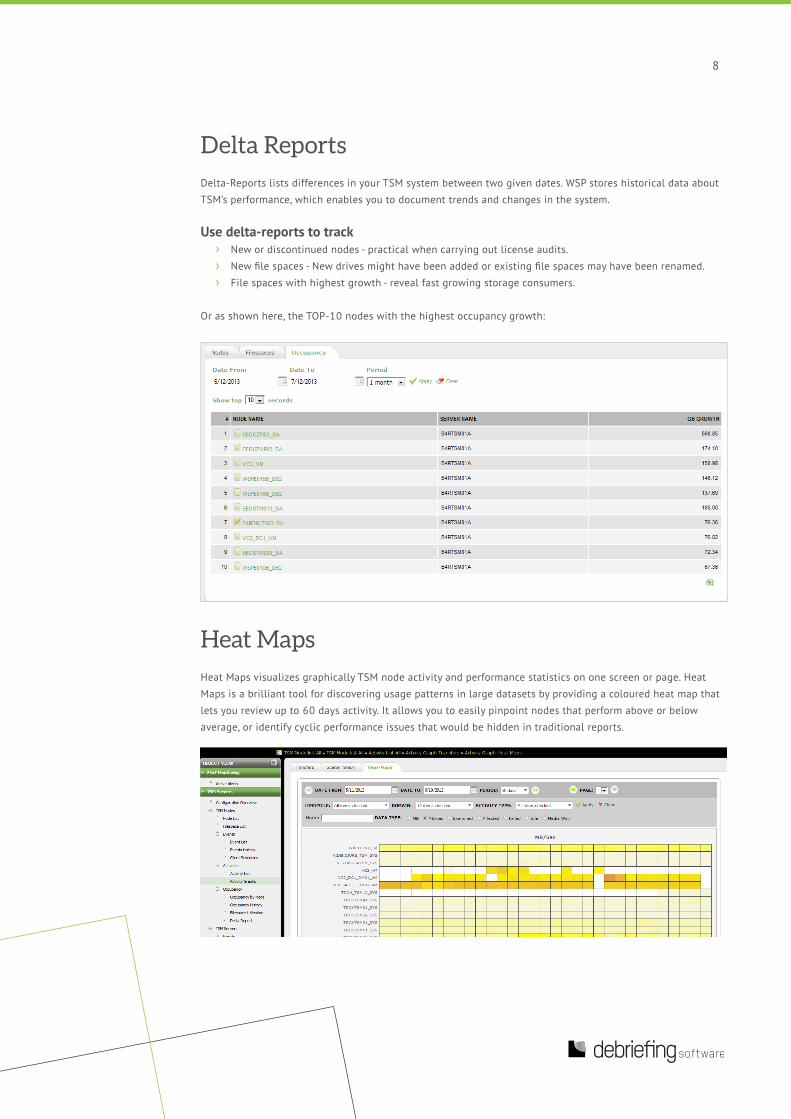
Or as shown here, the TOP-10 nodes with the highest occupancy growth:
Heat Maps
Heat Maps visualizes graphically TSM node activity and performance statistics on one screen or page . Heat
Maps is a brilliant tool for discovering usage patterns in large datasets by providing a coloured heat map that
lets you review up to 60 days activity . It allows you to easily pinpoint nodes that perform above or below
average, or identify cyclic performance issues that would be hidden in traditional reports .
9
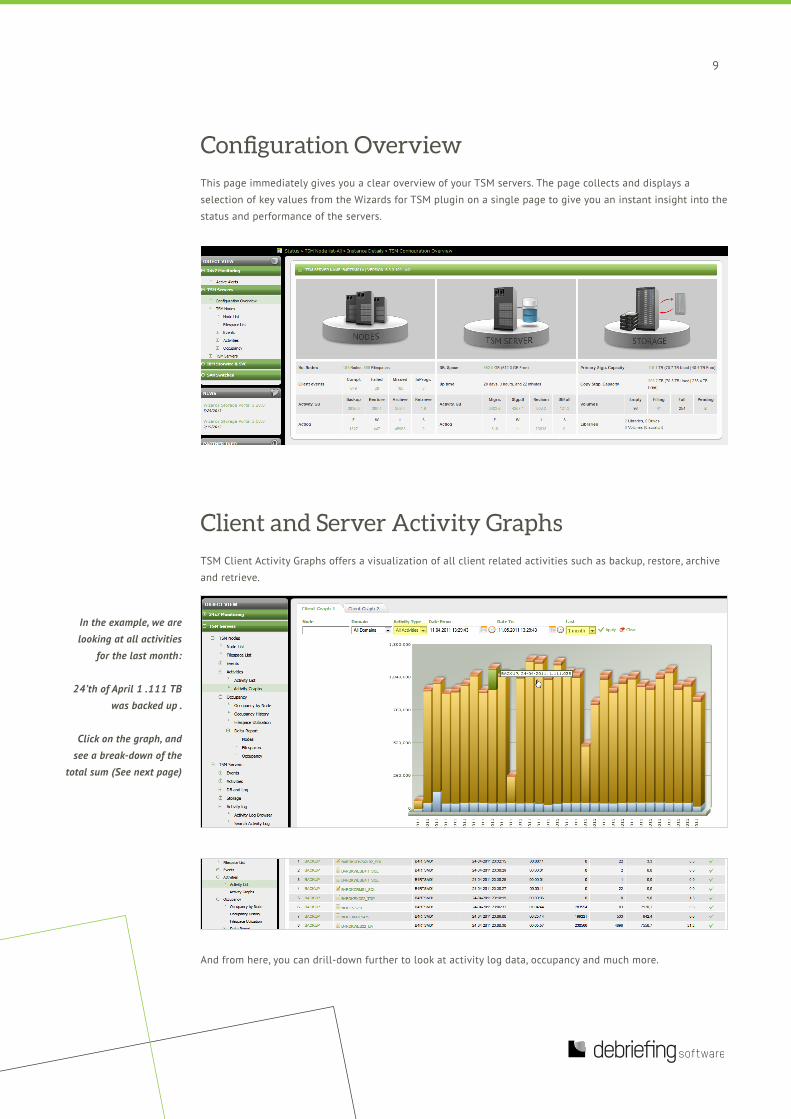
Configuration Overview
This page immediately gives you a clear overview of your TSM servers . The page collects and displays a
selection of key values from the Wizards for TSM plugin on a single page to give you an instant insight into the
status and performance of the servers .
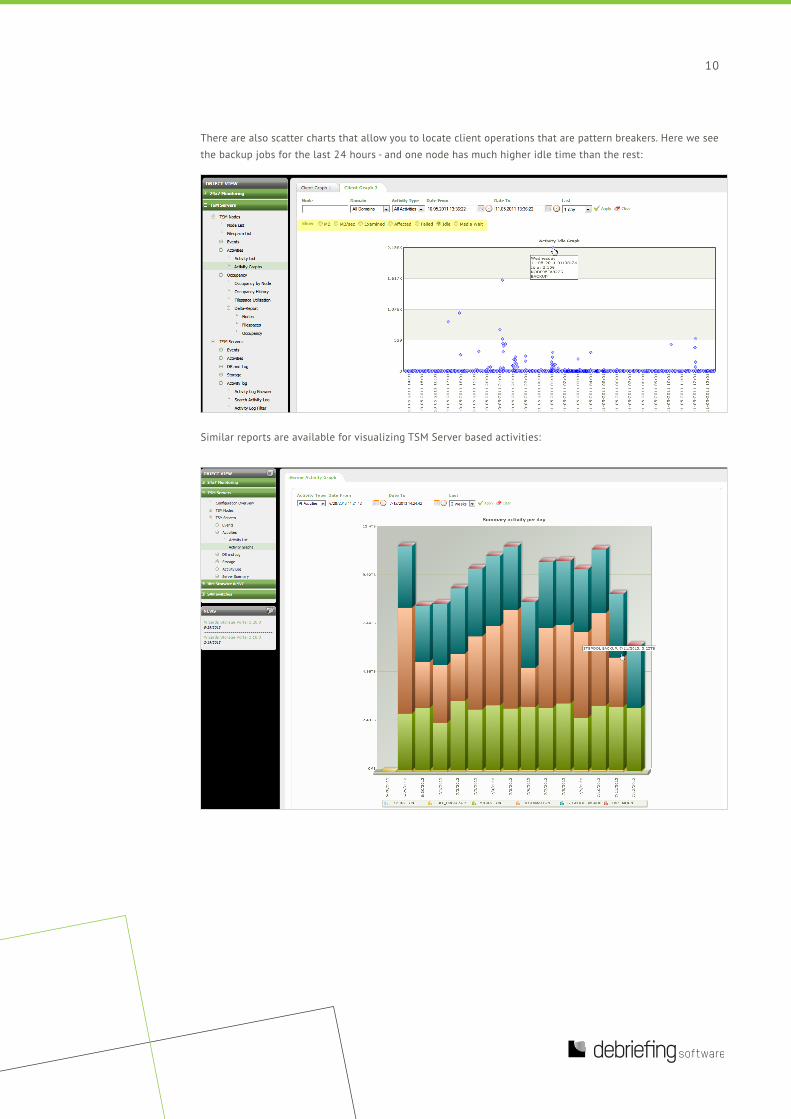
Client and Server Activity Graphs
TSM Client Activity Graphs offers a visualization of all client related activities such as backup, restore, archive
and retrieve .
And from here, you can drill-down further to look at activity log data, occupancy and much more .
In the example, we are looking at all activities
for the last month:
24’th of April 1 .111 TB was backed up .
Click on the graph, and see a break-down of the
total sum (See next page)
10
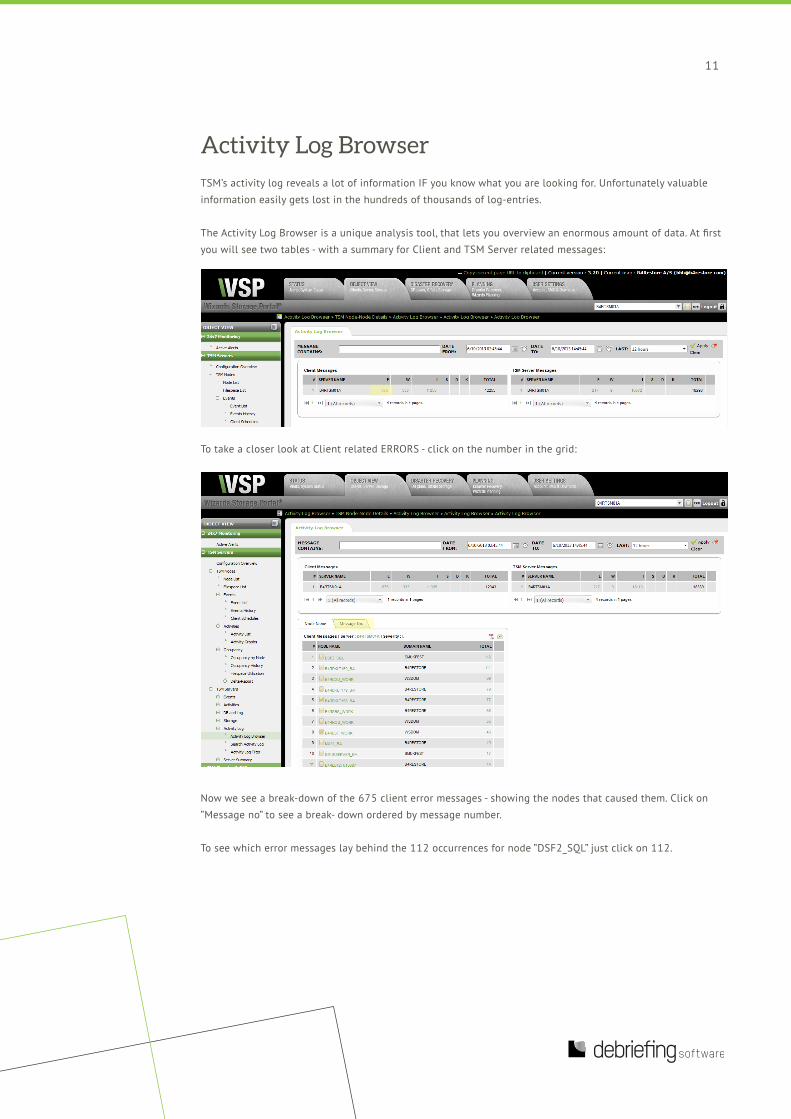
There are also scatter charts that allow you to locate client operations that are pattern breakers . Here we see
the backup jobs for the last 24 hours - and one node has much higher idle time than the rest:
Similar reports are available for visualizing TSM Server based activities:
11
Activity Log Browser
TSM’s activity log reveals a lot of information IF you know what you are looking for . Unfortunately valuable
information easily gets lost in the hundreds of thousands of log-entries .
The Activity Log Browser is a unique analysis tool, that lets you overview an enormous amount of data . At first
you will see two tables - with a summary for Client and TSM Server related messages:
To take a closer look at Client related ERRORS - click on the number in the grid:
Now we see a break-down of the 675 client error messages - showing the nodes that caused them . Click on
”Message no” to see a break- down ordered by message number .
To see which error messages lay behind the 112 occurrences for node ”DSF2_SQL” just click on 112 .
12
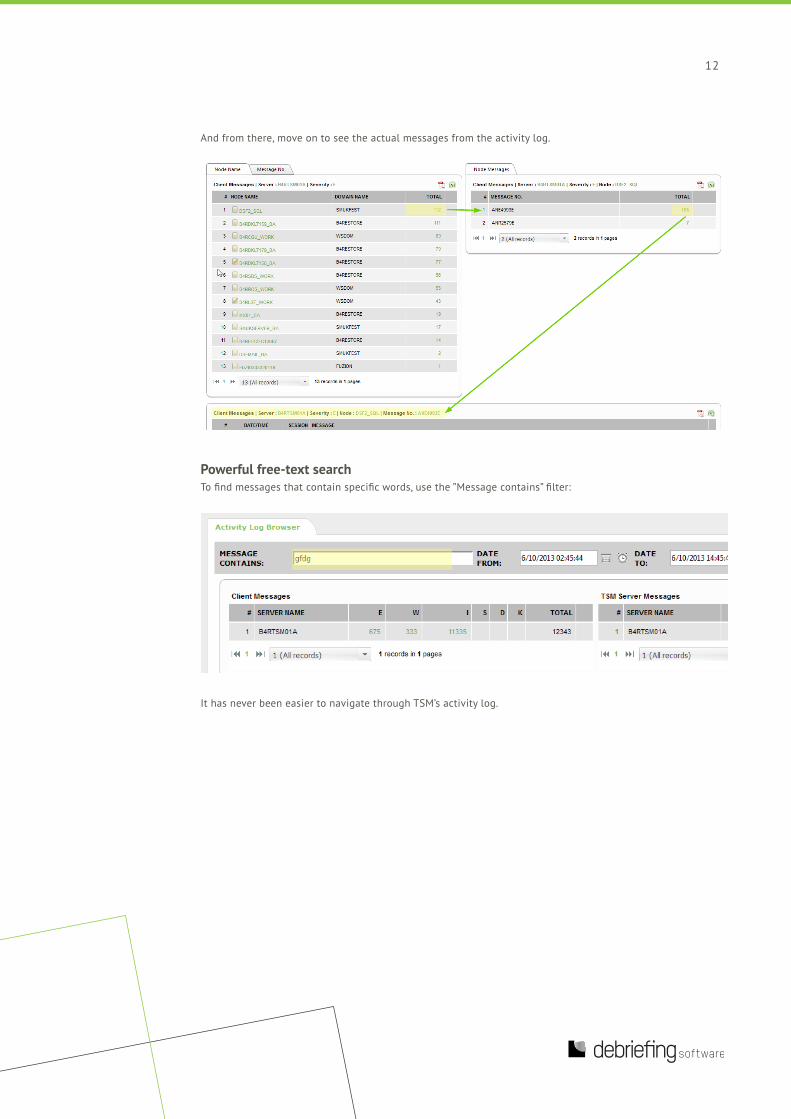
And from there, move on to see the actual messages from the activity log .
Powerful free-text searchTo find messages that contain specific words, use the ”Message contains” filter:
It has never been easier to navigate through TSM’s activity log .
13
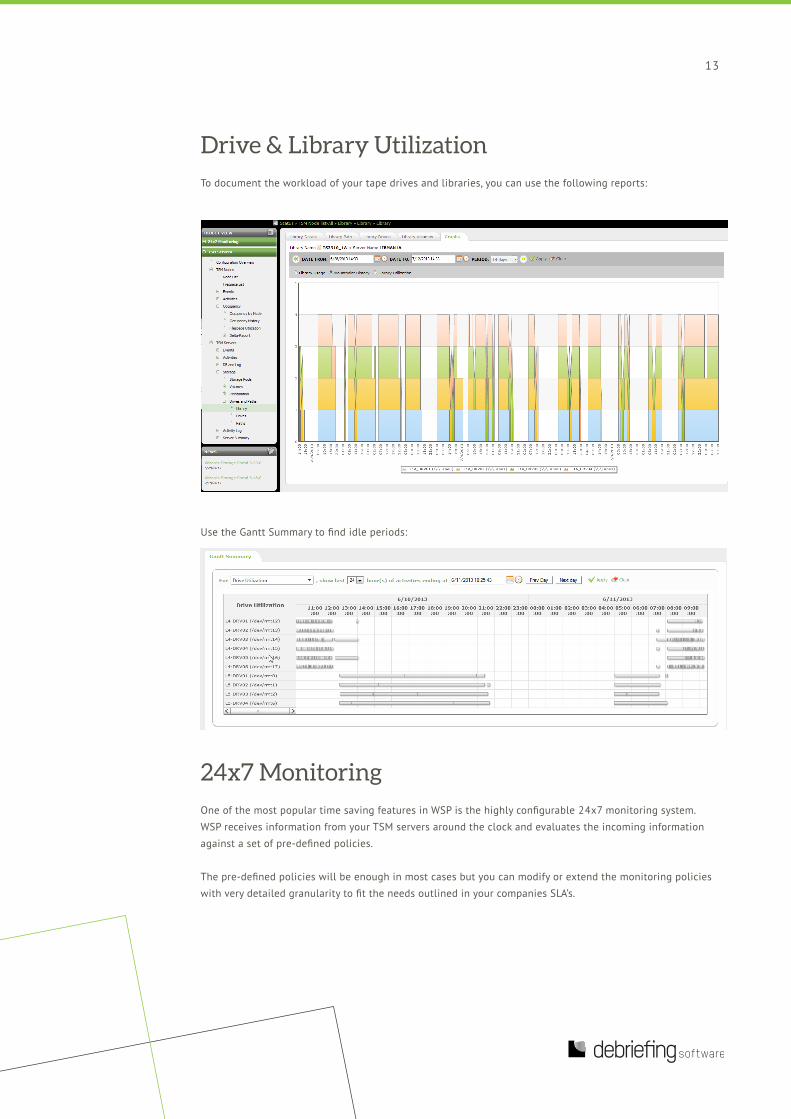
Drive & Library Utilization
To document the workload of your tape drives and libraries, you can use the following reports:
Use the Gantt Summary to find idle periods:
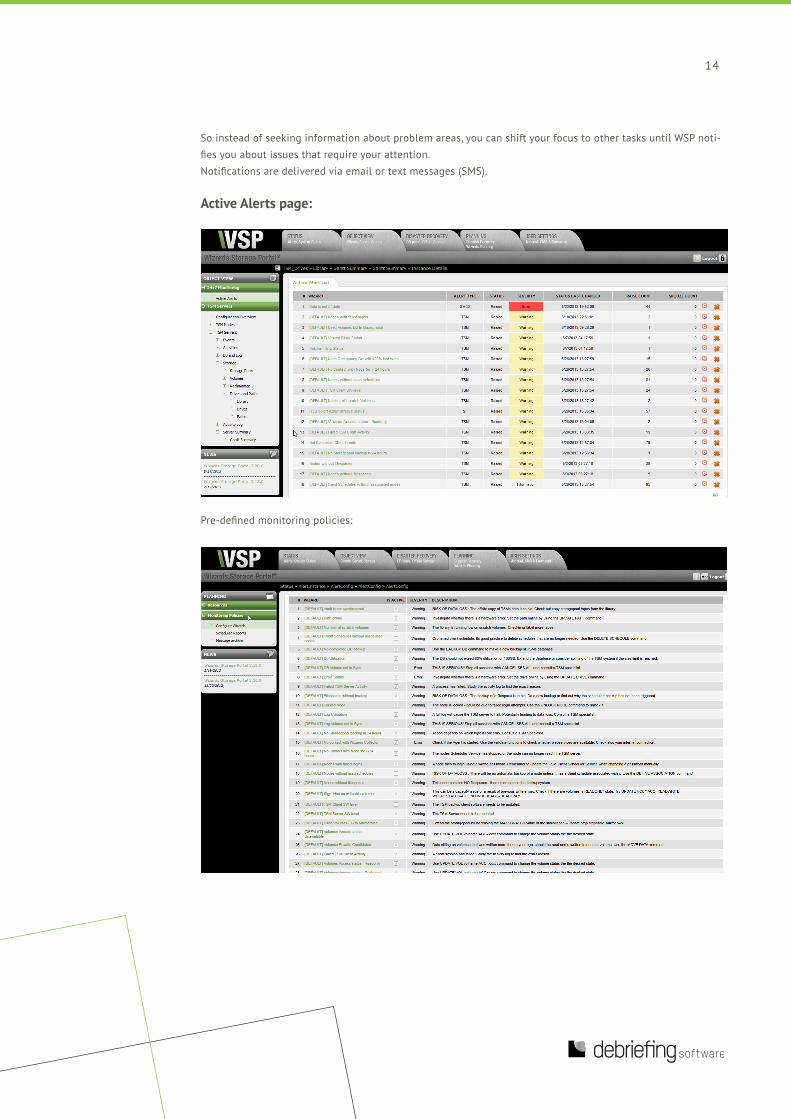
24x7 Monitoring
One of the most popular time saving features in WSP is the highly configurable 24x7 monitoring system .
WSP receives information from your TSM servers around the clock and evaluates the incoming information
against a set of pre-defined policies .
The pre-defined policies will be enough in most cases but you can modify or extend the monitoring policies
with very detailed granularity to fit the needs outlined in your companies SLA’s .
14
So instead of seeking information about problem areas, you can shift your focus to other tasks until WSP noti-
fies you about issues that require your attention .
Notifications are delivered via email or text messages (SMS) .
Active Alerts page:
Pre-defined monitoring policies:
15
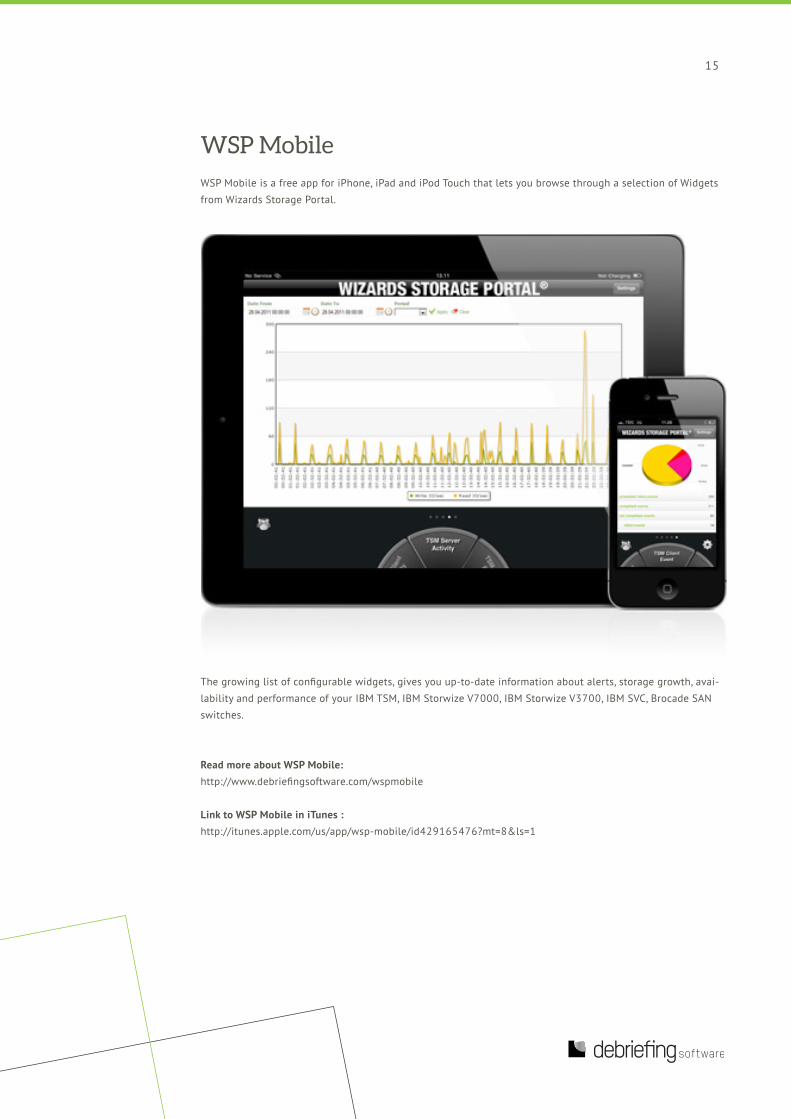
WSP Mobile
WSP Mobile is a free app for iPhone, iPad and iPod Touch that lets you browse through a selection of Widgets
from Wizards Storage Portal .
The growing list of configurable widgets, gives you up-to-date information about alerts, storage growth, avai-
lability and performance of your IBM TSM, IBM Storwize V7000, IBM Storwize V3700, IBM SVC, Brocade SAN
switches .
Read more about WSP Mobile:http://www .debriefingsoftware .com/wspmobile
Link to WSP Mobile in iTunes :http://itunes .apple .com/us/app/wsp-mobile/id429165476?mt=8&ls=1
16
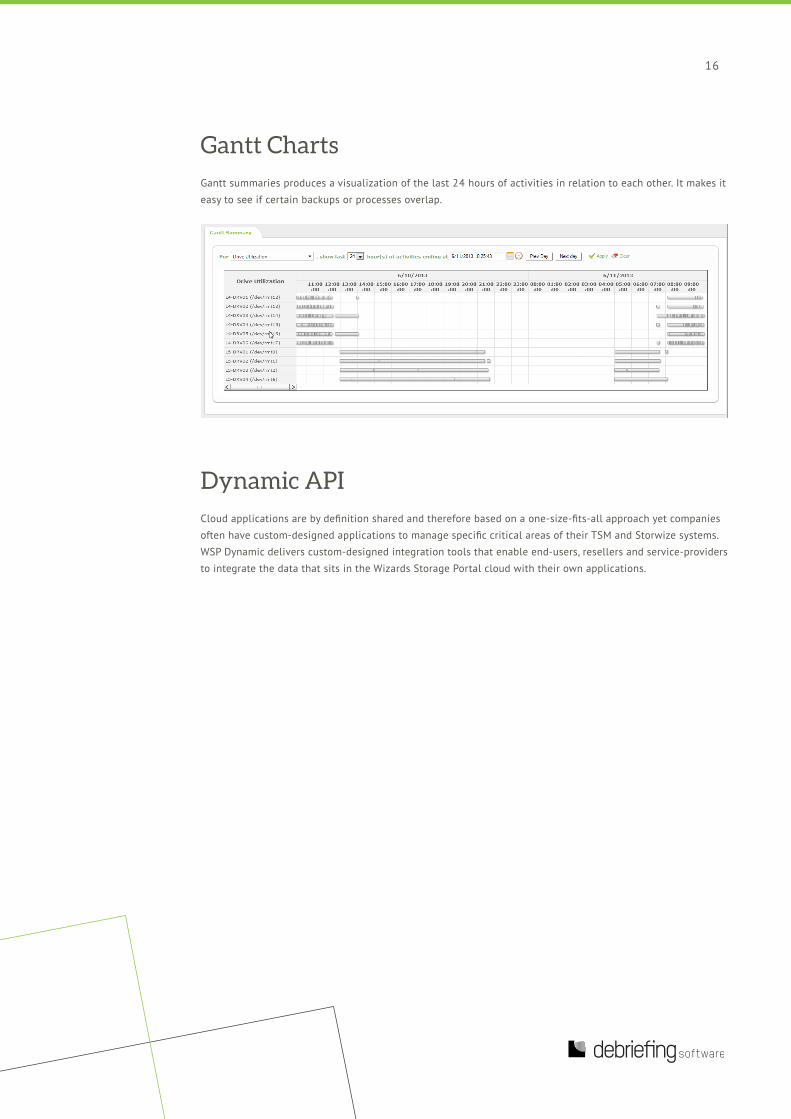
Gantt Charts
Gantt summaries produces a visualization of the last 24 hours of activities in relation to each other . It makes it
easy to see if certain backups or processes overlap .
Dynamic API
Cloud applications are by definition shared and therefore based on a one-size-fits-all approach yet companies
often have custom-designed applications to manage specific critical areas of their TSM and Storwize systems .
WSP Dynamic delivers custom-designed integration tools that enable end-users, resellers and service-providers
to integrate the data that sits in the Wizards Storage Portal cloud with their own applications .
17
How to get started
4 steps in 20 minutes:1 . Register for a free trial license of Wizards Storage Portal at http://www .debriefingsoftware .com
2 . Log on to the web portal, and download the binaries .
3 . Install Wizards Control Center and the Wizards for TSM Agent on a Windows machine .
4 . Set up your personal dashboard(Status page) and load the pre-defined monitoring policies .
About Debriefing Software
Debriefing Software provides cloud-based Storage Resource Management solutions . An active member of the
Storage Networking Industry Association (SNIA), Debriefing Software is a worldwide leader in cloud-based
Software as a Service (SaaS) solutions for IBM TSM, Storwize and SVC with its innovative Wizards Storage
Portal .
The Debriefing Software Wizards Storage Portal currently analyses and monitors more than 60 thousand servers worldwide and has been delivering results for ten years to an extensive customer base, including brands such as Bang & Olufsen and LEGO .
Follow Debriefing Software on Twitter: @debriefingsoftVisit Debriefing Software’s LinkedIn page: linkedin .com/company/debriefing-softwareOr visit our website at: www .debriefingsoftware .com