wisdom: a gis-based supply demand mapping tool …biomass and bioenergy 30 (2006) 618–637 wisdom:...
TRANSCRIPT

ARTICLE IN PRESS
0961-9534/$ - se
doi:10.1016/j.bi
Abbreviations
Rural Commun
DEM, digital e
psu.edu/dcw/ (L
of the United N
Greenhouse Ga
IUCN, Internat
to acquire remo
AFRICOVER
Domestique (Se
System; TREES
Convention on
Development (U
Priority Index;�Correspond
antigua carrete
E-mail addr
Biomass and Bioenergy 30 (2006) 618–637
www.elsevier.com/locate/biombioe
WISDOM: A GIS-based supply demand mapping toolfor woodfuel management
Omar Maseraa,�, Adrian Ghilardia, Rudi Drigob, Miguel Angel Trosserob
aCIECO, Center for Ecosystem Research, National Autonomous University of Mexico, antigua carretera a Patzcuaro 8701, 58190 Morelia, MexicobWood Energy Programme, Food and Agriculture Organization of the United Nations (FAO), Viale delle Terme di Caracalla, 0100 Rome, Italy
Received 17 February 2005; received in revised form 13 January 2006; accepted 16 January 2006
Available online 27 March 2006
Abstract
In this paper, it is argued that adequately assessing the implications of the current patterns of woodfuel production and use, and the
sustainable potentials of woodfuel resources, requires a holistic view and a better knowledge of the spatial patterns of woodfuel supply
and demand. There is a need to conduct multi-scale spatially explicit analyses of woodfuel supply and demand that are able to articulate
local heterogeneity at the regional and national levels. Studies that provide full-country coverage and are based on consistent integration
of data at lower geographical scales are woefully lacking. This paper describes the Woodfuel Integrated Supply/Demand Overview
Mapping model (WISDOM). This is a GIS-based tool, aimed at analyzing woodfuel demand and supply spatial patterns from a new
perspective that includes: (a) the assembling of existing but dispersed information into single data sets, (b) a modular integration of these
data sets, based on the analysis of key variables associated with woodfuel demand and supply patterns, and (c) a multiple-scale and
spatially explicit representation of the results, in order to rank or highlight areas in which several criteria of interest coincide. The final
objective of WISDOM is to assess the sustainability of woodfuel as a renewable and widespread energy source, while supporting strategic
planning and policy formulation. Three case studies for Mexico, Slovenia, and Senegal illustrate the practical implementation and
innovative results of using WISDOM.
r 2006 Elsevier Ltd. All rights reserved.
Keywords: Fuelwood priority areas; Fuelwood planning; Sustainability assessment; Data analysis; Mexico; Slovenia; Senegal
e front matter r 2006 Elsevier Ltd. All rights reserved.
ombioe.2006.01.006
: ABF, Association Bois de Feu, Senegal; CDM, Clean Development Mechanism (UNFCCC); CHP, combined heat and power; CR,
ities (counties of Senegal); CSE, Centre de Suivie Ecologique of Dakar, Senegal; CSE, EROS Center for Ecological Monitoring (USGS);
levation model; Digital Chart of the World, Environmental Systems Research Institute, Inc. (ESRI) product: http://www.maproom.
ast visited on 19th December 2005); EROS, Earth Resources Observation & Science (USGS); FAO, Food and Agriculture Organization
ations (UN); FPI, Fuelwood Priority Index; FRA RSS, Remote Sensing Survey of the Forest Resources Assessment (FAO); GHG,
ses; GIS, Geographic Information System; GTOPO 30, Global digital elevation model (DEM) with a horizontal grid spacing of 30 arc;
ional Union for the Conservation of Nature; KO, Cadastral Communities (counties in Slovenia); LANDSAT, United States satellite used
tely sensed images of the Earth’s land surface and surrounding coastal regions; LCCS, Land Cover Classification System of the
Project (FAO); LPG, Liquefied Petroleum Gas; LU/LC, Land use/Land cover; PSACD, Programme Sectoriel d’Appui au Combustible
negal); SEMIS, Bureau d’etude Senegalais, Dakar, Senegal; SFS, Slovenia Forest Service; SWEIS, Slovenia Wood Energy Information
II, Tropical Ecosystem Environment Observations by Satellite (II stands for second phase); UNFCCC, United Nations Framework
Climate Change; USAID/DAT, Direction de l’Amenagement du Territoire, Dakar, Senegal. United States Agency for International
SAID); USGS, United States Geological Service; WISDOM, Woodfuel Integrated Supply/Demand Overview Mapping; WPI, Woodfuel
WSC, woodfuel supply capacity
ing author. Bioenergy Laboratory, Center for Ecosystem Research (CIEco), National Autonomous University of Mexico (UNAM),
ra a Patzcuaro 8701, 58190 Morelia, Mexico. Tel.: +52 443 3222709; fax: +52443 3222719.
ess: [email protected] (O. Masera).
ARTICLE IN PRESSO. Masera et al. / Biomass and Bioenergy 30 (2006) 618–637 619
1. Introduction
When used in a sustainable way, biomass represents arenewable energy source which is widely available.Bioenergy can play a major role in the expected worldwidetransition to renewables, both in developed and developingcountries [1,2]; and have significant positive impacts onclimate change, by offsetting fossil fuel emissions. Esti-mates of the bioenergy production potential in 2050,reaches a maximum of 1.135 ZJ yr�1 [1,2]. For comparison,the global primary energy consumption in 2001 was 420EJ[3]. One step that is needed in order to design nationalstrategies for sustainable biomass energy use and exploita-tion is to understand in detail, the current spatial patternsof biomass demand and supply over a country.
Currently, about 60% of the wood removed fromaround the world is used for energy purposes. For thegroup of developing countries this amount rises to 80% [4].Woodfuel is one of the main forest products, in manysituations, the major product [5]. For a comprehensivedefinition of the term ‘‘woodfuel’’, please refer to FAO’sUnified Wood Energy Terminology [6]. Woodfuels satisfy7% of the world primary energy consumption, and 15%when considering the group of developing countries [4].The International Energy Agency estimated that approxi-mately 2.4 billion people living in developing countriesdepend on woodfuels for cooking, heating, and boilingwater [7]. FAO projections to 2030 predict a slow decline inthe global annual fuelwood consumption from 1.611 km3
(2000) to 1.501 km3, whereas charcoal consumption isexpected to grow from 46Mt (2000) to 76Mt in 2030 [8].For comparison, 1 hm3 of wood (or 150 dam3 of charcoalobtained with poor techniques) corresponds to an areabetween 100 km2 and 200 km2 of a mid-density matureplantation. One hm3 of wood is equivalent to approxi-mately 10 PJ. As seen by these numbers, woodfuel plays anindubitable role as an energy source; however, its patternsof demand and supply, and its associated social, economicand environmental impacts are still poorly understood.
Historically, reliance on very general and aggregatedinformation on woodfuels has led to misleading concep-tions about the effect of woodfuel use on the environmentand its sustainability: from pointing to woodfuels as majordirect causes of deforestation and forest degradation (e.g.‘‘woodfuel crisis’’ approach [9–11]) [12–14], to the denial ofany significant influence of woodfuel collection in theseprocesses [15,16]. These types of assessments have alsoresulted in poor planning and ineffective implementation ofprojects. The research conducted in the last decade,including comprehensive field studies and projects haveshown that woodfuels demand and supply patterns arerather complex and very site specific [17–25]. Thischaracteristic has shifted the early thinking of a generalfuelwood crisis to the understanding that critical areas varyfrom place to place [22,23,25]. Even in regions with anoverall negative woodfuel demand/supply balance, not allthe places face woodfuel scarcity, and similarly, regions
with an overall positive balance may include deficit areas[22,23,25]. In this article, the terms woodfuel ‘‘supply’’ andwoodfuel ‘‘production’’ are used synonymously, as arewoodfuel ‘‘demand’’ and woodfuel ‘‘consumption’’, sincethey are used in a technical—as opposed to an economic—sense.To cope with these problems, thorough local studies
have been implemented (e.g. area-based woodfuel flowsanalysis: see [26] for the case of Mexico). The results ofthese local investigations are then expanded at nationallevel to guide energy actions and interventions [23].Although these approaches have proven the heterogeneityof local situations, and provide the information needed tounderstand wood energy situations at the local level, theyare expensive and time consuming. They also tend to belimited to small areas, and to be sporadic, thus failing toconvey the national perspective needed for the design ofeffective national policies, for completing national inven-tories for greenhouse gases, or for estimating the nationalpotential of woodfuels as a renewable energy source.Moreover, obtaining exact measures of woodfuel deficits(as in studies conducted using the traditional fuelwood gapmodel [27,28]) presents severe methodological and financialchallenges, particularly considering the scarce resourcesnormally allocated to this specific sector [15]. Still little isknown, for example, about the amounts, extent, geogra-phical location and dynamics of wood supplies: fromplantation strategies, to traditional wood collection andharvesting methods [29].In this paper, it is argued that adequately assessing the
implications of the current patterns of woodfuel produc-tion and use, and the sustainable potential of woodfuelresources, requires a holistic view and a better knowledgeof the spatial patterns of woodfuel supply and demand.There is a critical need of planning tools that allow users tointegrate data from various sectors and to conduct multiscale spatially explicit analyses of woodfuel supply anddemand that are able to articulate the local heterogeneityinto the regional and national levels. Studies that providefull-country coverage and are based on a consistentintegration of data at lower geographical scales arewoefully lacking. Such studies should be oriented toidentify priority areas and hot spots within a country or abroad region. In a second step, more in-depth analyses canbe conducted within priority areas, allowing a moreefficient use of scarce available resources.This paper introduces the Woodfuel Integrated Supply/
Demand Overview Mapping (WISDOM), a spatiallyexplicit method for determining woodfuel priority areas.WISDOM has been developed by FAO, in cooperationwith the Center for Ecosystem Research of the NationalAutonomous University of Mexico (UNAM). WISDOMhas been formulated as a planning tool and a methodologyto provide country-wide synoptic views of local woodenergy supply and demand patterns based on the consistentintegration of forestry, energy and socio-economic dataand information. We also summarize the results of the
ARTICLE IN PRESSO. Masera et al. / Biomass and Bioenergy 30 (2006) 618–637620
application of WISDOM in three case studies in Mexico[30], Slovenia [31], and Senegal [32].
2. The WISDOM approach
Due to space limitations we show here the main elementsof the WISDOM approach. Refer to Masera et al. 2003[33] for a complete description of the methodology and formore details about its practical implementation, existingdatabases, and other relevant information. WISDOM isbased on the integration of geographic information system(GIS) and database technologies (i.e. geodatabase), whichoffers new possibilities for combining, or integrating,statistical and spatial information about the production(supply side) and the consumption (demand side) ofwoodfuels. This accessible, user-friendly technology makesit possible to display the results of spatial analysis in easilyunderstandable ways to public officials and private citizensas well as to the scientific community [34].
WISDOM is intended as a strategic planning tool, ratherthan an operational one. Therefore, rather than absoluteand quantitative data, WISDOM is meant to providerelative/qualitative values such as risk zoning , criticalityranking or ranking by energy supply potentials, high-lighting, at the highest possible spatial detail, the areasdeserving urgent attention and, if needed, additional datacollection.
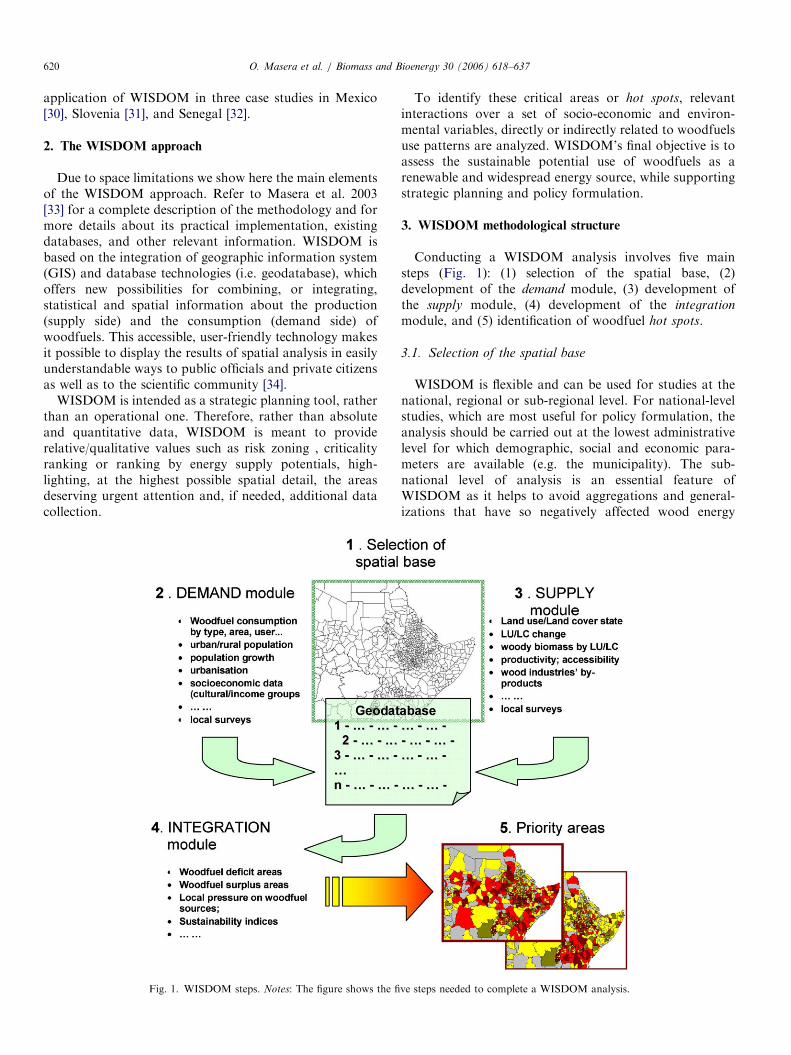
Fig. 1. WISDOM steps. Notes: The figure shows the fi
To identify these critical areas or hot spots, relevantinteractions over a set of socio-economic and environ-mental variables, directly or indirectly related to woodfuelsuse patterns are analyzed. WISDOM’s final objective is toassess the sustainable potential use of woodfuels as arenewable and widespread energy source, while supportingstrategic planning and policy formulation.
3. WISDOM methodological structure
Conducting a WISDOM analysis involves five mainsteps (Fig. 1): (1) selection of the spatial base, (2)development of the demand module, (3) development ofthe supply module, (4) development of the integration
module, and (5) identification of woodfuel hot spots.
3.1. Selection of the spatial base
WISDOM is flexible and can be used for studies at thenational, regional or sub-regional level. For national-levelstudies, which are most useful for policy formulation, theanalysis should be carried out at the lowest administrativelevel for which demographic, social and economic para-meters are available (e.g. the municipality). The sub-national level of analysis is an essential feature ofWISDOM as it helps to avoid aggregations and general-izations that have so negatively affected wood energy
ve steps needed to complete a WISDOM analysis.

ARTICLE IN PRESSO. Masera et al. / Biomass and Bioenergy 30 (2006) 618–637 621
studies in the past. Many countries have digital data setsfor their administrative units, which facilitate the analysis.Census and other socio-economic information are increas-ingly provided in digital form. For regional (i.e. supra-national) or sub-regional studies, demographic informationmay be derived from the LandScan Global PopulationDatabase of Oak Ridge National Laboratory in the UnitedStates [35], which provides worldwide population densitymaps at 3000 � 3000 (arc-second) resolution.
In this step, spatial and statistical data are linkedthrough a ‘‘map attribute table’’. The table can beexpanded as needed by the addition of thematic attributesreferring to the same set of map elements or units ofanalysis, in order to include all available informationdirectly or indirectly related to woodfuel demand andsupply.
3.2. Demand module
The demand module portrays the spatial distribution ofwoodfuel consumption, disaggregated, if possible, by fueltype (e.g. fuelwood, charcoal), by sector of users (e.g.
Table 1
Potential variables to be used in the demand module
Variable Desired breakdown
Woodfuel consumption by households
� Woodfuel use per capita
� Number of users at time t
� Fuel type (fuelwood, charc
� End use (cooking, boiling w
heating)
� Urban/rural population
� Combination of fuels
� Minimum administrative u
analysis
Woodfuel consumption by industrial users
� Woodfuel use per unit of product
� Number of users at time t
� Type (and size) of industrie
� Minimum administrative u
analysis
Density of users
� Saturation (% of users)
� Users by km2
� Urban/rural
� Household/industrial
� Woodfuel exclusive/multipl
Average annual growth rate of consumption/
users
� Urban/rural
� Household/industrial
� Woofuel exclusive/multiple
Resilience of consumption
� Relevant social/cultural groups
� Income levels
� Ethnic groups
� Income groups within urba
population
Source: Adapted from Masera et al. [33].aGlobal Population Database produced by the LandScan Global Popula
population database at 3000 � 3000 (arc-second) resolution.
household, industrial), by type of demand (self-consump-tion, local market), and by area (e.g. rural, urban), sinceeach has a different impact on sources and sustainability ofsupply, calling for separate lines of analysis. It is also usedto identify those areas showing distinctive consumptiondynamics (e.g. increasing woodfuel needs). Determiningthe actual and expected consumption of woodfuels is acomplex task, as it is a function of socio-demographic,technical, environmental, cultural, and economic variables[21]. Table 1 shows potential variables that can be used inthe analysis.The development of the demand module usually implies
the integration of consumption data from surveys—normally covering only part of the country, and usingdifferent methodologies/assumptions—with socio-demo-graphic variables obtained from census information. Themain challenge in this module is to find either direct orproxy variables, available at the national level, that can beused to estimate consumption levels and their spatialdistribution. As WISDOM uses statistical informationdisaggregated by sub-national units, it is necessary to havecomplete data sets associated to these units in order to
Possible sources of information
oal)
ater,
nit of
� Household energy surveys
� Estimates are available at national level, rarely at sub-
national level; often based on project level data.
Estimates may differ from source to source
� National census and/or LandScana population density
map 1998/2000
s
nit of
� Estimates usually based on project or survey level
data
� National census/surveys for industries (rarely
comprehensive for industries belonging to the
informal sector)
e fuel users
� National census and/or indirectly through surveys
� National census could be assessed through GIS
analysis
fuel users
� National Census and country population projections
� UN population projections are available at national
level only. Sub-national time series from national
statistical services. Population growth maps (from
LandScan) are expected to be developed shortly
n/rural
� National census
� Income–expense national household surveys
tion Project of Oak Ridge National Laboratory, which is a worldwide
ARTICLE IN PRESSO. Masera et al. / Biomass and Bioenergy 30 (2006) 618–637622
‘‘spatialize’’ the information over the maps. Gaps in thedata may be filled in three ways: (1) by the use of proxyvariables to ‘‘spatialize’’ discontinuous values (e.g. usingrural population as a proxy for woodfuel users); (2) byextrapolating information available at the project level, tothe entire study region (i.e. to extrapolate fuelwoodconsumption per capita). This procedure may be valid incases where data does not need to be highly accurate orwhere woodfuel consumption estimates cover at leastrepresentative regions or situations within the study area;and (3) by filling specific or critical data gaps with new datacoming from field surveys. This option could be veryexpensive, so the surveys need to be carefully designed, tominimize the cost and effort for a given precision level.Different woodfuel survey methodologies can be used forthese purposes [25,36].
Several criteria can be set to determine priority areas interms of woodfuel demand. For example, one might beinterested in areas that show: (a) high woodfuel consump-tion; (b) high density of woodfuel users; (c) high growthrates of woodfuel consumption or users, either by house-holds or industrial users; (d) high resilience of woodfueldemand (in terms of cultural attachment to fuelwood use,represented for example by the percentage of ethnicpopulation).
The precise criteria, and the corresponding prioritizationof areas, will depend on the specific objective of the study.For example, the study may be intended to identify placeswith large potential market opportunities for new technol-ogies or places with major health impacts associated withthe use of open fires for cooking.
3.3. Supply module
Having access to reliable data on woodfuel supply hasbeen historically one of the main challenges in wood energyanalysis. For this reason we will be more explicit in thissection. To the extent allowed by the existing information,the supply module should provide a spatial representationof all natural and planted woodfuel sources, their currentstock (volume of biomass), their change over time and theirproductive capacities. Thus the analysis is not restricted tonatural forests, but also encompasses, plantations, treesoutside forest, woodlands, shrubs, live hedges and anyother main source of woodfuels. The main, and often theonly, sources of information for developing this module arenational forest inventories, since detailed surveys ofbiomass stocking and productivity covering non-forestland-use classes are still rare events. In most cases, stockingand productivity for non-forest woodfuel sources (shrubs,agricultural plantations, agro-forestry practices, etc.) willbe inferred or guesstimated. Given the paucity of data onnon-forest classes, the development of this module willusually rely on local studies, even if of limited coverage,and experts’ opinions.
As with the demand module, it is essential to usedisaggregated statistics referring to small spatial units of
analysis rather than aggregated averages. Table 2 showsthe potential variables to be used for the development ofthe supply module. In general terms, it may be assumedthat the woodfuel supply capacity (WSC) of an area is afunction of several factors which include, among others: (a)land use/land cover and relative changes; (b) biomassstocking and productivity of trees, shrub and herbaceousspecies; and (c) accessibility.Detailed land use/land cover inventories are still scarce
but increasingly available at the national and internationallevel. An interesting example is the FAO AFRICOVERProject over East and Central Africa countries. Promisingfeatures of AFRICOVER products are the wall-to-wallcoverage of all countries at a good level of detail (scale1:100,000–1:200,000) and the associated Land CoverClassification System (LCCS), which represents well thewide variety of low-density vegetation types characteristicsof African landscapes, and offers a good basis for theestimation of woody biomass stocking [37].Concerning land cover change, national deforestation
rates are available in countries that regularly conductmonitoring studies. However, only few tropical countriesundertake regular monitoring studies from which sub-national change patterns can be derived (India, Brazillimited to Legal Amazon have some, but there are none forAfrica for example). Richer information on land coverchanges was produced for the tropical belt, by region andmain ecological zones. Other sources of informationinclude the Remote Sensing Survey of the Forest ResourcesAssessment (FRA RSS) carried out during the 1990Assessment, and continued in the 2000 Assessment[38–40,42]. This study produced highly consistent informa-tion on the land cover change processes and trends for theperiods 1980–1990 and 1990–2000 through the analysis ofsatellite time series over a 10% statistical sample of tropicalland. Important information from this study is the biomassflux diagram, which provides a useful indication on the lossor gain of woody biomass associated with each change inland cover. The FRA RSS analyzed 117 sampling units,each of them covering an entire Landsat scene(185� 185 km). Additional evidence on the change in landcover occurring in the humid tropical regions over theperiod 1990–1997 has recently been produced by theTREES II Project of the European Joint Research Centeron the basis of a statistical sample of high-resolutionsatellite images covering the dense forest formations of thehumid tropics [37,41]. The TREES High Resolution Studyanalyzed 93 sampling units, 39 of which covering fullLandsat scenes and 54 covering quarter scenes (approxi-mately 100� 100 km). Neither of the two studies producedcountry-level results, but each of the sampling unitsanalyzed in these surveys, which vary in size between10,000 and 34,225 km2, may contribute some interestinginsights into the local patterns of change.Information on biomass stockings and productivity of
natural forests and plantations may be derived through theintegration of land cover information with conventional

ARTICLE IN PRESS
Table 2
Potential variables to be used in the supply module
Variable Desired breakdown Possible sources of information
Land use/land cover class All land use/land cover classes must be
considered (including both forest and non-
forest classes)
National Forest Inventories, e.g. AFRICOVER mapping in Africa
using FAO’s Land Cover Classification System [37]
Land use/land cover change Crude deforestation rates should be
avoided; land cover transitions (i.e. using
land use transition matrices) are well suited
for this type of analysis
National monitoring studies; large-scale studies such as FAO’s
Global Forest Resources Assessment remote-sensing survey
[38–40]; TREES II high-resolution survey [41]
Woody biomass stocking by land
use/land cover
Biomass stocking for all land use/land
cover classes including croplands,
shrublands, etc.
Forest inventory data (volume expanded to total biomass);
inference and extrapolation from detailed studies to include non-
commercial species used as woodfuels
Average biomass production by
land use/land cover class
Productivity indices for all land use/land
cover classes
Forest inventory data (yield expanded to total biomass); non-forest
biomass surveys (still rare); inference and extrapolation from
detailed studies; agro-ecological zoning
By-products of primary and
secondary wood processing
industries
Type and quantity of by-products
(residues) produced by main industrial
processes (by unit of processed main
product)
National statistics on industrial production. Chamber of commerce
data on size and distribution of wood processing industries
Spatial distribution of industrial units
Accessibility Adjust total area by legal reasons (e.g.
protected areas), for physical reasons (e.g.
slope, distance, natural barriers) and for
economic reasons (e.g. tenure
fragmentation making the extraction
uneconomic)
Legal access: national or international maps of protected areas,
such as those of the World Conservation Union (IUCN)
Physical access: digital elevation models (DEMs) and route maps
(e.g. products derived from the Digital Chart of the World)
Economic access: cadastral data on forest ownership; average
property size and fragmentation
Source: Adapted from Masera et al. [33].
O. Masera et al. / Biomass and Bioenergy 30 (2006) 618–637 623
forest inventory data (volume and yield) [43]. For instance,the LCCS applied in several African countries, which isbased on classifiers independently describing three vegeta-tion layers (trees, shrubs, and herbaceous), may becombined with local volume and yield estimates to producebiomass density maps. Rarer are stocking and productivityestimates for non-forest formations such as scrublands,homestead gardens, windbreaks, roadside trees, farmlandtrees, etc., which may represent important woodfuelsources for the rural population [24,43–45]. Usually thisaspect will need to be covered by inference and extrapola-tion of detailed studies conducted at the project or micro-regional level.
Access to woodfuels must be considered when calculat-ing the WSC of an area [30,40]. As with other variables,accessibility results should be disaggregated by minimumunits of analysis, following each scale of analysis (Table 2).Physical accessibility may be defined in a GeographicInformation System (GIS) through the use of slopeinformation from terrain models (e.g. GTOPO 30; DigitalChart of the World-derived products), using a bufferanalysis based on road networks and settlements distribu-tion, and other parameters. Different assumptions or
access thresholds should be taken into account by type ofextraction practice (e.g. considering fuelwood: gatherersusing vehicles, draught animals, or none of these) and byfinal use (e.g. selling and trade in local markets, self-consumption). For example, from a national perspective,access to areas with woody vegetation could be calculatedfrom broad buffer zones around clusters of localities withhigh woodfuel consumption. When dealing with local ormicro-regional accessibility patterns, more detail studiesusing high-resolution digital elevation models (DEMs) andlocal route maps are recommended. General assumptionsfor accessibility studies should be based on local surveydata. Legal accessibility will identify the areas where woodextraction is forbidden, such as national parks or justprivate lands. These areas may be derived from national orinternational maps, such as the IUCN map of protectedareas, and from cadastral databases.The quantitative WSC value is extremely difficult to
determine with precision since it depends on the capacity(potential) of an area to produce biomass which may varywidely [15]. Moreover, the majority of research on this areaas noted above has concentrated on establishing theamounts of usable timber produced by commercial tree
ARTICLE IN PRESSO. Masera et al. / Biomass and Bioenergy 30 (2006) 618–637624
species (i.e. annual increment of stems), which is not ofinterest for the rural woodfuel supply [44]. On the otherhand, estimating the woodfuel supply of non-forest areas isparticularly complicated because of the high degree ofvariability in the woody cover and productivity of theseareas. In many instances, the capacity of agriculturalfarming systems to produce woodfuels depends on the levelof demand (e.g. population density [46]) and accessibility ofalternative sources, which might bring their production toa higher or lower priority level, with respect to otherproducts [22]. However, as mentioned earlier, the scope ofWISDOM is not operational planning, for which quanti-tative precision is essential and definitely more demanding.
In this context and within the scope of identifyingpriority areas where the demand/supply balance indicates apossible deficit, the supply module may concentrate mainlyon land use and land use change, and may use indicativebiomass productivity indices based on ecological charac-teristics. For example, if the aim is to identify areas withpotential woodfuel shortages, then the study could look forareas that show: (a) rapid depletion rates of forests andwoodlands as a result of land-use changes or high pressure;(b) change in land use patterns such as increased field sizeand associated loss of hedges; (c) low biomass productivity;(d) poor accessibility. Alternatively, areas with largerpotential for sustainable woodfuel production will be thoseshowing accessible woody vegetation with good stockingand productivity.
3.4. Integration module
The main scope of the integration module is to analyzerelevant interactions between the demand and supplymodules in order to derive new variables that canpotentially be used to prioritize areas of concern. One ofthe main challenges for this module is achieving aconsistent integration of databases, given that demandand supply estimates come from very different sources (e.g.demand estimates are usually done by the Energy Ministry,whereas supply estimates come usually from the Forestryor Agriculture Ministries).
The integration is done through the combination of thevariables related to woodfuel consumption and supply thathave been systematized for each minimum administrativeunit of analysis. Several variables or indicators can bedesigned to analyze the combined impact of woodfuelsupply and demand. A necessary first step is to deriveestimates of the woodfuel demand coming from differentLU/LC classes. The woodfuel sources to be considered willinclude natural sources such as forests, other wooded lands(shrubs, shifting cultivations, etc.) and man-made sourcessuch as forestry and agricultural plantations, agro-forestry,windbreaks, etc. Detailed information on these aspectscome from local surveys, which are usually conducted overspecific ecological regions, and need to be adapted to thenational context using for example, wood extractioncoefficients by LU/LC class.
The selection of indicators is decided case by case,depending on the availability and accuracy of the data.Potential indicators include:
�
woodfuel deficit ¼ [woodfuel supply�woodfuel de-mand]o0; � potential pressure on woodfuel sources (natural andnon) ¼ [woodfuel demand/total accessible woodfuelsources];
� CO2 net emissions ¼ f [woodfuel deficit].Strictly speaking, woodfuel deficit areas are those withnegative values, and should include of course, demand andsupply from non-forest areas. However, since it is difficultto obtain precise information on both supply and demand,different thresholds could be defined so that woodfueldeficit areas could include those with a range of valuesaround zero.Potential pressure on woodfuel sources is given in metric
tons (t) (or cubic meters (m3)) per hectare per year and thusgives an idea of the average local wood productivity neededto cope with the existing woodfuel demand. If the demandis higher than the wood productivity in the area, then adeficit, or unsustainable situation, may be assumed.Net CO2 emissions will be registered in those areas where
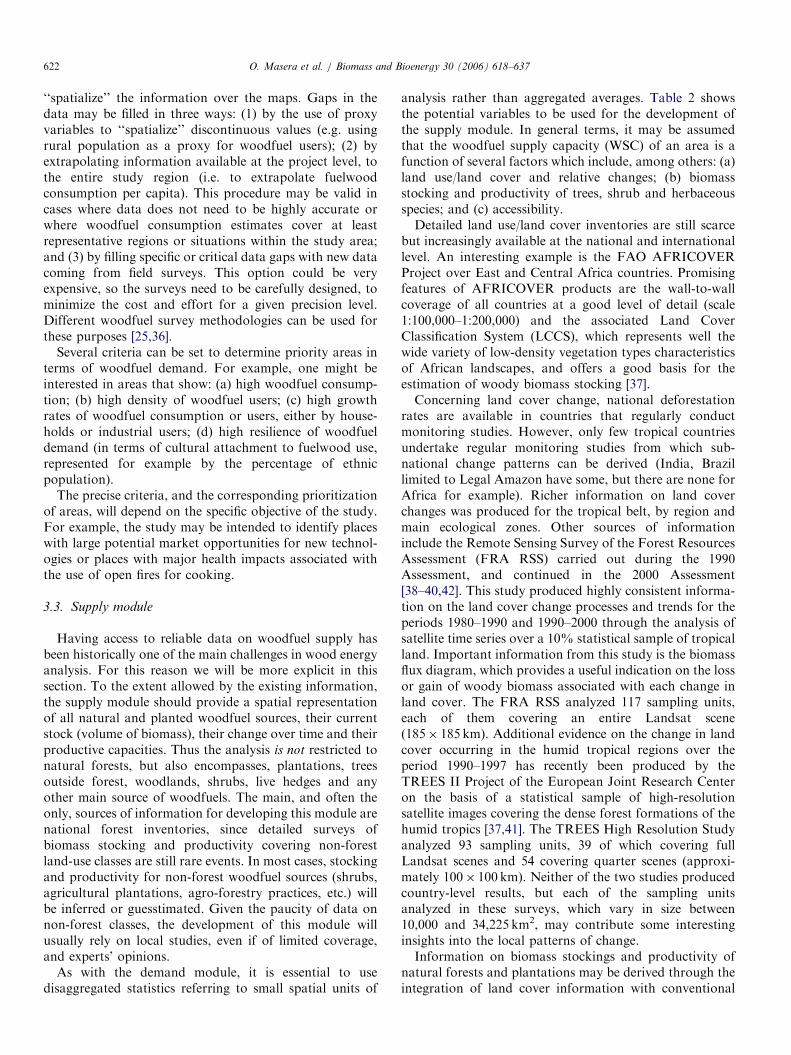
woodfuel extraction remains unsustainable. Estimates oftotal Greenhouse Gases (GHG) emissions coming fromwoodfuels can also be derived using emission factors forthe most common end-use technologies, such as open fires[47,48]. As the estimates come from a detailed spatializa-tion of data (Fig. 2), they are much more precise than thecurrent figures available at the National GreenhouseInventories submitted to the United Nations FrameworkConvention on Climate Change (UNFCCC). The spatialanalysis of woodfuel GHG emissions can also be useful forderiving regional baselines on Clean Development Me-chanisms (CDM) projects.
3.5. Identification of woodfuel hot spots
The final step in the WISDOM approach is theidentification of those areas where action is urgentlyneeded in terms of demand, supply or both (i.e. high-lighting woodfuel hot spots). Departing from old ap-proaches, like the fuelwood gap model, where theidentification of hot spots was based entirely on aquantitative estimates of woodfuel deficits, WISDOM aimsat identifying areas showing a distinctive woodfuel situa-tion and dynamics. To do so, common multivariatestatistical procedures—data grouping techniques, factoranalysis, cluster analysis, indexing and others—could beused. Alternatively, the final grouping of sub-nationalareas, in terms of their priority, could be done using anoverall woodfuel priority index that reflects the key aspectsof the areas of analysis in terms of woodfuel demand,supply and integration variables [30].

ARTICLE IN PRESS
Fig. 2. CO2 net emissions from fuelwood use in Mexico, 2000. Notes: The map shows the net CO2 emissions (in metric tons (t) of CO2 per year) by county
aggregated into three categories. CO2 net emissions are estimated as the difference fuelwood consumption and accessible woodfuel productivity of forests.
This analysis shows that only in very specific regions of Mexico fuelwood harvesting is actually contributing to net CO2 emissions to the atmosphere.
O. Masera et al. / Biomass and Bioenergy 30 (2006) 618–637 625
One proposed procedure for constructing the woodfuelpriority index involves four sub-steps (next sectionprovides examples of priority indexing using the WISDOMapproach): (a) Selection of a robust set of variablesassociated with woodfuel consumption and supply, ex-tracted from the demand, supply and/or integrationmodules. The selection of final set of variables needs toconsider the integration of different concerns regardingwoodfuel consumption and availability of resources. (b)Allocating each spatial unit of analysis to a category interms of each of the individual variables selected in theprevious step (a). (c) Construction of an integratedwoodfuel priority index by unit of analysis: based on theranking of each spatial unit of analysis for each of thevariables selected. The construction of an integrated indexmay need multi-criteria analysis, particularly when tryingto integrate variables from different fields (e.g. social/economic/environmental, qualitative/quantitative). (d) Al-locating each spatial unit of analysis to a particular groupaccording to the integrated woodfuel priority indexcalculated in the sub-step (c). This final step involves are-grouping of administrative units into categories (fromlow priority to high priority), along the integratedwoodfuel priority index.
According to a pre-defined set of criteria, WISDOMhelps in rating the units of analysis, at any one scale, intopriority categories. Further ratings can be conductedthrough successive scales of analysis (i.e. over different
sets of units of analysis—state, county, community, etc.).For example, if the identification of areas with potentiallylarge social impacts is important at the national level (e.g.health problems associated to indoor air pollution), zoningcan be done according to the number and density ofwoodfuel users, the availability of alternative fuel sources,and the socio-economic situation of woodfuel users.Studies looking at potential forest or land degradationcaused by woodfuels, will try to identify regions wherewoodfuel consumption is high, resilient, and increasing.They will also look at cases where woodfuel supply is atrisk, due to loss or degradation of natural vegetation andwhere the demand/supply balances indicates a deficit orwhere a deficit is likely to develop in the near future.
4. WISDOM case studies
So far, three case studies have been conducted using theWISDOM approach. These case studies are all at thecountry level and involve Mexico, Slovenia, and Senegal.They represent contrasting situations in terms of overallwoodfuel dynamics, ecological and socio-economic con-texts and policy implications. In this section, we present ashort discussion of the most relevant features and findingsfor each case study; more detailed information regardingthe methods used and the results obtained is available onthe respective publications (Mexico [30]; Slovenia [31];Senegal [32]).

ARTICLE IN PRESSO. Masera et al. / Biomass and Bioenergy 30 (2006) 618–637626
4.1. Mexico case study
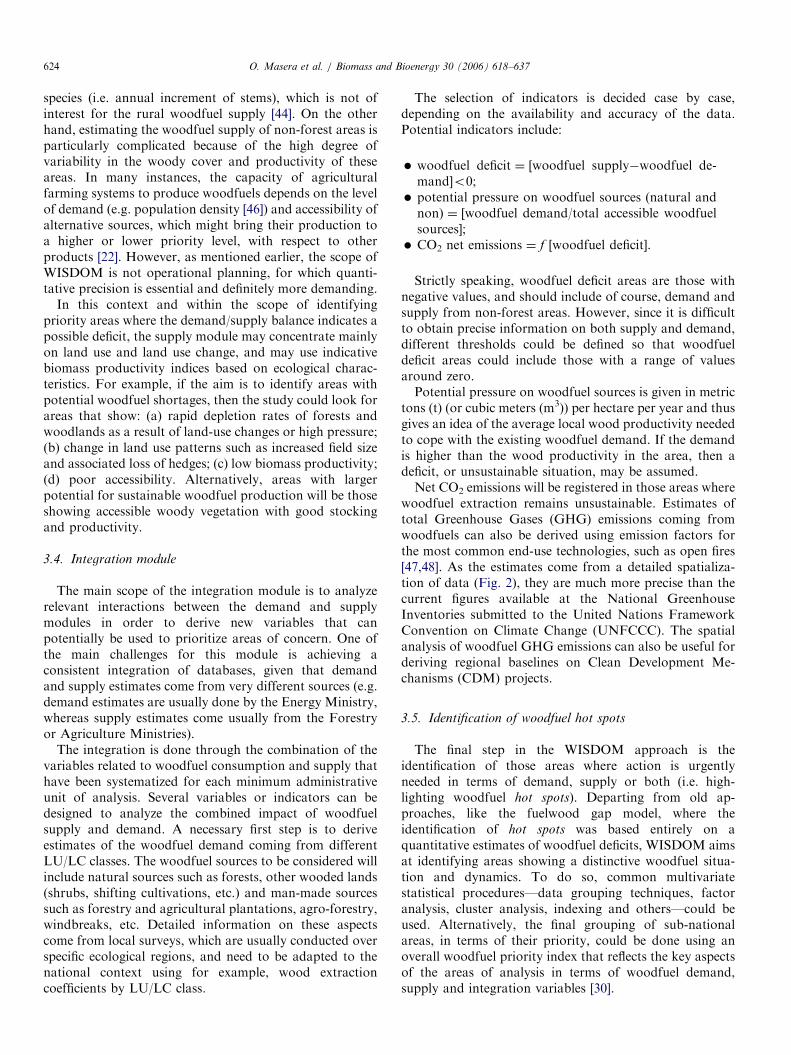
In Mexico, approximately one fourth of the populationcooks with fuelwood, either alone or in combination withLPG [49,50]. The residential fuelwood demand for the year2000 was 320 PJ [51], equivalent to 32 hm3 of wood, avolume three times higher to the total commercial timberlegally harvested in the country per year [52] (Fig. 3).Fuelwood consumption accounts for half of total residen-tial energy demand in Mexico. Therefore, assessing thecountry’s sustainable wood energy potential and viableoptions for the use of woodfuels deserve urgent attention.Fuelwood use in Mexico responds to the so-called‘‘traditional pattern’’, characterized by: (a) its spatialheterogeneity, (b) being focused on the rural and house-hold sector, (c) the widespread use of traditional technol-ogies, and (d) a very diverse array of extraction practices(oak re-growth management, abandoned crop-plots man-agement, selective extraction, random extraction, etc.).Fuelwood in Mexico is mostly collected or bought fromlocal markets. Although diverse sources of fuelwood exist,it is estimated that most of it comes from forest commercialand non-commercial areas, abandoned farming plots underre-growth, and arid regions with shrub cover [26,53].Preferred species for fuelwood are not necessary the sameas those of commercial value [51,53,54]. This represents akey problem when trying to assess the potential productionof biomass as the majority of research on this area has
Fig. 3. Household fuelwood consumption in Mexico, 2000. Notes: The map sho
according to number of fuelwood users and per capita consumption by major e
attention given their high fuelwood consumption.
concentrated on establishing the amounts of usable timberproduced by commercial tree species (i.e. annual incrementof stems) [44].The WISDOM case study conducted in Mexico [30] was
directed to determine fuelwood hot spots for the year 2000(Table 3). The analysis was based in the integration ofnational geo-referenced multi-temporal databases thatcover comprehensive information on fuelwood associatedvariables, for 2401 municipalities or counties (out of acountry total of 2436). The main data sources were (a) thelast National Forest Inventory [55], with 69 land-use land-cover classes (1:250,000); (b) an extensive review of theliterature and case studies in order to estimate fuelwoodproductivities by LU/LC class, and per capita fuelwood useby macro-ecological zone; and (c) the National PopulationCensuses for the years 1990 and 2000, in which data aboutnumber and distribution of fuelwood users is available. Atthe national level, municipalities were ranked based on (a)the number of fuelwood users; (b) the percentage ofhouseholds that use fuelwood; (c) the density and (d)growth of fuelwood users; (e) the cultural resilience offuelwood consumption (i.e. percentage of ethnic popula-tion), and (f) the magnitude of woodfuel forest resources.The WISDOM analysis confirmed the high heterogeneity
of fuelwood situations within Mexico, allowing theidentification of 267 high-priority municipalities, distrib-uted over 16 hot spots, where action to assure thesustainability of fuelwood use is urgently needed (Fig. 4).
ws the estimated average fuelwood consumption by municipality (county),
cological zone. Counties with 412 kt yr�1 are those that deserve particular

ARTICLE IN PRESS
Table 3
Summarized features of the WISDOM analysis in Mexico
Main features of woodfuel use in
Mexico
� Woodfuel use constitutes three times commercial timber harvesting and represents 50% of total residential
energy demand in the country
� Woodfuels demand is concentrated on fuelwood and on rural areas. Most fuelwood is either collected or
bought from local markets and is directed to households
� Most fuelwood comes from forest areas, relatively little from agricultural areas
� The use of agricultural residues and dung is not widespread
Objective and scope of the analysis � To determine fuelwood hot spots at a national level for the year 2000
� To identify priority areas for action at a sub-municipal level, over a previously identified hot spot
� The analysis focused on households and fuelwood exclusive users
Hot spots or high priority areas
definition
� Areas showing high fuelwood demand, high density and growth of fuelwood users, high resilience of
fuelwood consumption (in terms of social and cultural aspects) and few or insufficient woodfuel resources
Scales of analysis � National level: data disaggregated by municipalities (counties)
� Hot spot level: data disaggregated by localities
Demand module data sources � The National Population Census 1990 and 2000
� A comprehensive collection of local/regional/national surveys on energy use in the household sector
Supply module data sources � The National Forest Inventory 2000 (1:250,000). The original 69 Land-use land-cover (LU/LC)classes were
aggregated into seven major classes. Average biomass productivities were assumed for each LU/LC class
Integration module � A new variable called ‘‘fuelwood balance’’ was created integrating supply and demand variables
� Woodfuel consumption coming for each LU/LC was also estimated
GIS system � The GIS database includes multi-temporal information on fuelwood demand and supply for each of the 2436
municipalities in the country
Priority zoning � A set of six uncorrelated variables was selected. Municipalities were grouped into five main categories for
each variable. A simple indexing of all the six variables and a further grouping was conducted to rank
municipalities into five categories or classes of priority. Hot spots correspond to high priority areas
Accessibility analysis (access to
forest areas from localities)
Data sources at the national level:
� Starting points map (localities with more than 100 fuelwood users each, for the whole country in the year
2000)
� The National Forest Inventory 2000 (1:250,000)
Data sources at the hot spot level:
� Detailed analysis using Digital Elevation Model, reclassification of forest map, and population by locality
� Local surveys on fuelwood gathering patterns for household use
Main results � National level: identification of 267 high priority municipalities grouped over 16 clusters (Fig. 4)
� Hot spot level: 37% (1481 km2) of the total forest area of the selected hot spot is accessible to fuelwood
walking gatherers at 1 h round trip (Fig. 5)
Source: Adapted from Masera et al. [30].
O. Masera et al. / Biomass and Bioenergy 30 (2006) 618–637 627
The area covered by high priority municipalities accountsfor approximately 10% of the country. WISDOM alsoallowed producing thematic maps of policy and scientificrelevance, such as net CO2 emissions derived fromfuelwood use (Fig. 2). Following a multi-scale approach,a first exercise was conducted over one hot spot in CentralMexico, in order to identify specific potential areas forestablishing bioenergy plantations and improved wood-burning cookstoves. The results showed that 37%
(1481 km2) of the total forest area within the hot spot isaccessible to walking fuelwood gatherers (Fig. 5).The main policy impacts of the WISDOM Mexico case
study include so far: (a) a consistent and comprehensivegeodatabase with detailed multi-temporal information onfuelwood supply and demand patterns for each of the2401 municipalities within Mexico, which will be soonavailable on the Internet; (b) the identification of prioritymunicipalities where to conduct improved woodburning

ARTICLE IN PRESS
Fig. 4. Fuelwood hot spots in Mexico, 2000. Notes: (A) Hot spots correspond to clusters of high priority municipalities (counties in red). Priorization of
counties was made using a Fuelwood Priority Index (FPI). The FPI was constructed using six variables: (a) number of fuelwood users; (b) percentage of
households that use fuelwood; (c) density of fuelwood users; (d) growth of fuelwood users; (e) cultural resilience of fuelwood consumption (i.e. percentage
of population belonging to indigenous groups), and (f) balance between demand and supply of fuelwood. (B) Detail for central Mexico showing the States
of Estado de Mexico, Veracruz, Morelos, Hidalgo and Puebla. It can readily be seen that most hot spots are located in central and southern Mexico, and
that they follow specific patterns, rather than being uniformly distributed over the country area.
O. Masera et al. / Biomass and Bioenergy 30 (2006) 618–637628
cookstove programs and multi-purpose energy plantations,to be undertaken by the National Forestry Commission;and (c) a revision of previous GHG emission estimatescoming from woodfuel burning, that has served to updateand improve the Mexican National GHG EmissionInventory.
Before the WISDOM analysis was conducted, Mexicandata about fuelwood consumption and supply belonged tothe forestry, energy and census agencies separately. Theinformation was neither integrated together nor shown in aspatially explicit way. WISDOM results allowed a newperspective about fuelwood use patterns in Mexico, notonly because of the integration and processing of all relatedfuelwood data into single data sets, but because of thepossibility to select specific areas of interest, according tocertain criteria (i.e. fuelwood consumption, CO2 emissions,and fuelwood priority areas).
4.2. Slovenia case study
Slovenia is a biomass rich country. Forests coverapproximately 60% of the country and are accompaniedby other land uses which are often rich of woody biomassand by consistent areas of abandoned farmland whichrevert to forest. The demand for woodfuels is concentrated
on fuelwood (the production and use of charcoal beingmarginal) and on rural areas. A large part of the fuelwoodtrade is informal as wood is either collected by farmersfrom their own lands and forests or bought locally. There isa consistent wood processing industry composed ofnumerous small and medium units. The proportion offuelwood coming from non-forest areas is larger than 20%.Most demand comes from households for heating pur-poses. Other uses such as district heating and combinedheat and power plants (CHP) are still marginal but maygrow as viable energy policy alternatives.In spite of an increased interest on biomass resources
and on their role as renewable energy sources, biomassgoes largely unrecorded in both forestry and energy sectorsand official statistics provide only generic and contra-dictory information. In addition, the geopolitical transfor-mations of the last decade opened up new forestmanagement issues related primarily to the markedfragmentation of forest ownership.In this context, the Slovenia Forest Service (SFS)
requested FAO assistance to conduct a WISDOM analysisin the country. The project’s overall objective wasincreasing Slovenia’s capacity to formulate adequate woodenergy policies and plans compatible with the sustainablemanagement of forests (Table 4). Specifically, WISDOM

ARTICLE IN PRESS
Fig. 5. Fuelwood priority areas at a sub-municipal level in central Mexico, 2000. Notes: (A) Location of the Purhepecha Region within Mexico. This
Region is a hot spot in the country priorization by the Fuelwood Priority Index (FPI). (B) Accessible forests are those located within buffer areas around
localities. These buffer areas are a function of slope and walking velocities of fuelwood gatherers. Total Region forest area is 4002km2; while the accessible
forest area is 1481 km2. (C) Patzcuaro county, within the Purhepecha Region. Total county forest area is 243 km2; accessible forest area is 93 km2; and
accessible Oak forests are 7 km2. Oak forests are highlighted as these species are preferred as fuelwood in the Region. Actions to assure sustainable
fuelwood use should then be concentrated on accessible Oak forests. Note that scale bars differ in one order of magnitude.
O. Masera et al. / Biomass and Bioenergy 30 (2006) 618–637 629
was directed to integrate the information relevant to woodenergy planning in a comprehensive spatially explicit dataset and to identify the priority areas for the implementationof wood energy projects.
The WISDOM analysis allowed constructing a SloveniaGeodatabase that presents a first holistic vision of fuel-wood demand and supply parameters and their spatialrelation. The database provides, for each of the 2696Cadastral Communities (KO) in the country, all variablesrelevant to the household wood energy sector that could beso far assembled and/or estimated. Those aspects relatedwith wood industries are still under analysis. A total of 120parameters are associated with each KO, therefore a widevariety of thematic maps can be produced.
As meaningful examples of the WISDOM case study,Fig. 6 shows the spatial pattern of today’s fuelwoodproduction/consumption situation, which has a balanceclose to zero, and Fig. 7 shows the distribution of availablesurplus resources according to current allowable cut, whichis estimated at some 1.1 hm3. A priority zoning was alsoconducted, combining three aspects that are of particularrelevance in future forestry planning of woodfuel produc-tion: (i) high surplus of non-timber assortments suitable forenergy use, (ii) high fragmentation of forest properties,and (iii) high proportion of forest stands at thinning stage(Fig. 8). The areas identified are critical from a sustainable
forest management viewpoint: in these areas forest ownerassociations could be promoted that would achieve anacceptable profit level and at the same time undertake theneeded silvicultural treatments that are otherwise ne-glected. In these contexts, energy offers good opportu-nities, with benefit for the society and for the forestecosystem.
4.3. Senegal case study
Senegal was selected as the first African WISDOMcase study in view of the importance of its woodenergy sector and the extensive use of charcoal. Untilrecent years, woodfuel consumption in Senegal wascharacterized by a strong demand for charcoal in Dakarand other main urban areas and by fuelwood dominatingin villages and rural areas. However, the use of LPG israpidly replacing charcoal in urban areas (apparentlylowering the pressure on the resources) but at the sametime charcoal is becoming a preferred fuel by villagedwellers due to the increasing distance of stocked wood-lands that limit self-gathering and other socio-economicfactors. Production areas are often over 500 km far fromconsumption sites.The WISDOM study for Senegal was undertaken on the
initiative of the FAO Wood Energy Programme with the

ARTICLE IN PRESS
Table 4
Summarized features of the WISDOM analysis in Slovenia
Main features of woodfuel use in Slovenia � Approximately 60% of Slovenia is forested; other land uses are often rich of woody biomass
� The demand for woodfuels is concentrated on fuelwood for household consumption in rural areas
� Large part of fuelwood trade is informal. Over 20% of total household consumption comes from non-
forest-areas
� Industrial consumption, such as district heating systems, combined heat and power plants (CHP) and
other industrial use depend mainly on byproducts (residue) from wood processing industries
� Non-household uses are rather marginal but may grow as viable energy policy alternatives
Objectives of Slovenia WISDOM � To integrate relevant information for wood energy planning available in Slovenia in a spatially explicit
data set and to fill critical information gaps
� To understand the actual potential of wood energy as an economically and environmentally sound
alternative or complement to fossil fuels
� To identify priority zones suitable to the development and implementation of wood energy projects
Minimum administrative spatial unit of
analysis
� The spatial base was developed on cadastral communities (KO), which represent the basis of Slovenia
territorial structure. The 2,696 KO units may be aggregated at municipality level and at any other
reporting level. Additional layers are settlements (5997 points)
Demand module data sources � National census data on dwellings that use fuelwood for 2002
� Estimated energy requirements for heating and other domestic uses
� Industrial consumption (partial data on 65 biomass systems)
Supply module data sources � A comprehensive Slovenia Forest Service database on forest compartments (over 65,000) and its new
digital map, with information on stocking, annual increment, assortments production including
fuelwood, actually cut quantities, management phases, ownership data, etc., all at KO level
� A specific survey was carried out for non-forest fuelwood sources
� Forest area changes 1975–2000 by KO
� Distribution of wood processing industries
Integration module � A GIS and a geodatabase were created including all available consumption and supply parameters for
each of the 2696 KOs and other point data
� Additional set of variables were created such as various balances of production/consumption values to
indicate the pressure on fuelwood resources and potential surplus of fuelwood for advanced wood
energy initiatives
Priority zoning � Included fuelwood production potential, property fragmentation and overstocked young forests at
thinning stages
� Further grouping can be conducted to rank KOs into various categories and priority levels according
to planners’ need
Other results � Slovenia Wood Energy Information System (SWEIS), which provides the first coherent wood energy
balance of the country
� The current data set will serve to support, the preparation of a new National Programme and Action
Plan for use of wood biomass, which should be prepared by the end of 2005
Source: Adapted from Drigo [31].
O. Masera et al. / Biomass and Bioenergy 30 (2006) 618–637630
scope of testing the methodology and the benefits of theintegrated approach in an African country. The Centre deSuivie Ecologique (CSE) of Dakar provided the maininformation for its realization. The analysis was basedexclusively on existing data.
The main scope of WISDOM analysis was to carry out afirst-level evaluation of Senegal’s woodfuels consumptionand production patterns based on the information pro-vided by the CSE, integrated with other information fromavailable documentation and web sources (Table 5). Theanalysis allowed constructing a database that integratedinformation from a Senegal vegetation map—with biomass
stocking and productivity estimates for the 30 LU/LCclasses—with woodfuel demand parameters for each of the321 Rural Communities (CR) in the country.Two additional objectives were developing future
scenarios on the likely supply/demand ratios for each CRin the year 2010 and providing a priority zoning of theseCRs based on current woodfuel use patterns and thescenarios to 2010. The scenarios were based on two recentenergy surveys, which were carried out in 1992 and 1996that estimated consumption and substitution rates amongdifferent fuels. One scenario considered only the consump-tion pattern reported in the last survey (A: static scenario),

ARTICLE IN PRESS
Fig. 7. Potential fuelwood balance in Slovenia, 2002. Notes: The map shows the spatial pattern of potential fuelwood production/consumption balance
between current non-timber allowable cut plus the estimated non-forest productivity and household consumption. Overall balance is estimated to be over
1.1 hm3. The darker green areas indicate the locations with highest woody biomass surplus. In these areas, for instance, new wood energy systems could be
located.
Fig. 6. Current fuelwood balance in Slovenia, 2002. Notes: The map shows the spatial pattern of current fuelwood balance between production and
consumption. The balance is defined as the difference between the estimated fuelwood actually extracted from Slovenia forests and non-forest areas and
fuelwood consumption for domestic heating and cooking.
O. Masera et al. / Biomass and Bioenergy 30 (2006) 618–637 631

ARTICLE IN PRESS
Fig. 8. Fuelwood priority areas in Slovenia, 2002. Notes: The map shows an example of priority zoning derived from the combination of three thematic
elements: property fragmentation; wood surplus considering current local consumption and potential sustainable productivity; and fraction of forests at
thinning stage. Red areas are those with higher values in the three thematic elements.
O. Masera et al. / Biomass and Bioenergy 30 (2006) 618–637632
projected using population growth in rural and urbanareas. The second scenario considered also the 1992–1996fuel substitution rates (B: dynamic scenario). In this casethere is a reduction of fuelwood and charcoal consumptionin urban areas in favor of LPG and a significant shift fromfuelwood to charcoal in rural areas, which appeared as thepotentially most critical factor, setting an unprecedentedstrain on the country’s limited wood resources. If thetrends assumed in scenario B become real, one of theimportant effects of the changing consumption patterns isthe likely spreading of charcoal production to respond to amore diffuse local demand. This may cause a suddenincrease of charcoal-making in areas previously undis-turbed (at least for this specific use), making the pressureon local wood resources more ubiquitous and moredifficult to control and manage. Figs. 9 and 10 show,respectively, the supply/demand balance at year 2010according to the static scenario (A) and to the ‘‘dynamic’’scenario (B).
A preliminary Woodfuel Priority Index (WPI) wasdeveloped using several indices based on the possible levelsof consumption at year 2010, on the consequent localsupply/demand balance and on socio-economic parametersthat represent the poverty level (CSE poverty index). Fig.11 shows the result of this process, highlighting the RuralCommunities that deserve particular attention in view oftheir combined levels of consumption and balance (accord-ing to the ‘‘dynamic’’ scenario) and of access to basic social
services and infrastructures, defined by the CSE’s povertyindex.
5. Conclusions and future research directions
The WISDOM approach allows constructing an inte-grated and comprehensive perspective of wood energysystems that catalyzes the dialogue between forestry andenergy agencies and that facilitates the definition of soundpolicies and strategies.The main benefits of using WISDOM include:
�
It allows a holistic vision of the wood energy sector overan entire country or region; while identifying circum-scribed priority target areas, where action should beconcentrated in order to optimize the use of availablehuman, institutional, and financial resources. � It can be used to promote the development of woodenergy as a locally available and environmentallyfriendly source of energy.
� It helps to clarify the true role of forestry andagricultural sectors in supplying woodfuels, and it ishoped that, in doing this, it will favor a clearerallocation of responsibilities and promote synergies.
� Within the context of climate change, WISDOM is auseful tool for helping in developing National GHGInventories.

ARTICLE IN PRESS
Table 5
Summarized features of the WISDOM analysis in Senegal
Main features of woodfuel use in
Senegal
� Intensive use of woodfuels, including charcoal
� In recent years LPG is rapidly replacing charcoal in urban areas but at the same time charcoal is becoming a
preferred fuel by village dwellers due to the increasing distance of stocked woodlands that limit self-gathering
and other socio-economic factors
� Production areas often over 500 km far from consumption sites
Objectives of Senegal WISDOM � To review, harmonize and integrate, the available information related to production and consumption of
fuelwood and charcoal at the level of Rural Communities (CR) in a spatial explicit format
� To review possible scenarios to the year 2010
Minimum administrative spatial
unit of analysis
� The base layer consists of 321 Rural Communities (CR)
� Additional map layers included the distribution of rural villages (13,211 villages), the road network (8
categories) and protected areas
Demand module data sources � Urban and rural population data by CR and 1990–2010 time series
� Saturation of fuelwood, charcoal and LPG by urban and rural users and by Region and estimated per-capita
consumption rates
� Socio-economic parameters (access to drinking water, health services, market, roads and school) for 13,000
villages and summarized by CR
� Time series of household urban and rural consumption 1990–2010 by CR were developed, according to two
different scenarios:J Scenario A. 1996 consumption pattern (Semis survey) projected using urban/rural population growth ratesJ Scenario B. Scenario ‘‘A’’ plus 1992–1996 consumption trends (comparison of ABF/DE 1992 and Semis
1996)
Supply module data sources � Senegal vegetation map (based on USAID/DAT 1982) with stocking and productivity for each of the 30 classes
of the map (derived from PSACD 1998)
� Map of Senegal Protected areas with 5 categories
� Estimated exploitable fraction of wood resources according to protection categories and distance from roads
and villages
� Time series of wood stocking and productivity (total and accessible fraction) by CR according to two change
scenarios:J EROS ¼ stocking and productivity reduced in time according to the land use change estimated by EROS/
USGS–CSE over the period 1965–2000 [56]J FRA ¼ stocking and productivity reduced in time according to the forest area change estimated by FAO
FRA 2000 [40].
Integration module � Time series (1990–2010) of balance between household fuelwood and charcoal consumptions and total/
accessible wood resources (scenarios EROS and FRA). The balance analysis represents the first level of
integration of supply and demand variables
Priority zoning � A simple Woodfuel Priority Index (WPI) was developed using several indices, for each Rural Community,
based on three main elements:J the possible levels of charcoal consumption at year 2010 according to scenario BJ the local balance between total demand of wood for energy (fuelwood and wood for charcoal) and the
estimated accessible and exploitable wood growthJ socioeconomic parameters that represent the poverty level (CSE poverty index)
Source: Adapted from Drigo [32]. Please refer to the list of abbreviations for a better understanding of the special terms used in this table.
O. Masera et al. / Biomass and Bioenergy 30 (2006) 618–637 633
A detailed spatial representation of the woodfuelsituation is clearly one of the prerequisites for promoting
the sustainable use of these fuels within developingcountries. A spatial analysis constitutes also a powerfultool for strategic planning: it helps both achieve a betterunderstanding of the current wood energy situation and itsfuture trends as well as helping to direct scarce financialand human resources to those areas needing mostattention. Combined with other energy planning tools,the WISDOM approach can help in the design of robustpolicies and more effective actions. It should be empha-sized that WISDOM does not reduce the need to collectlocal data but rather it stresses this need since its reliabilityis influenced by the quantity and quality of the dataavailable and it helps to define the critical information gapsthat really disrupt the analysis. WISDOM can also beimproved over the years to progressively enhance theconsistency of wood energy analysis.A long road is still ahead in terms of further
methodological development and potential applicationsof WISDOM. First of all, the approach needs to be testedagainst more case studies characterizing a diverse and

ARTICLE IN PRESS
Fig. 9. Fuelwood balance scenario in Senegal for the year 2010-A. Notes: The map shows the balance between household woodfuel consumption
(fuelwood and wood for charcoal) and estimated sustainable productivity according to the ‘‘static’’ scenario (A) (see text), which used the 1996
consumption survey data projected according to population growth rates in urban and rural areas.
Fig. 10. Fuelwood balance scenario in Senegal for the year 2010-B. Notes: The map shows the balance between household woodfuel consumption
(fuelwood and wood for charcoal) and estimated sustainable productivity according to the ‘‘dynamic’’ scenario (B) which used the 1996 consumption
survey data but projected the consumption according to the 1992–1996 trends and to population growth rates. Also shown are the ‘‘traditional’’ charcoal
production areas.
O. Masera et al. / Biomass and Bioenergy 30 (2006) 618–637634

ARTICLE IN PRESS
Fig. 11. Overall woodfuel priority areas in Senegal, 2010. Notes: The map shows the estimated woodfuel priority areas within Senegal for the year 2010.
The figure highlights the Rural Communities that deserve particular attention in view of their combined levels of consumption and balance (according to
scenario B in Fig. 10) and of their limited access to basic social services and infrastructures, defined by the poverty index developed by the Dakar’s Centre
de Suivi Ecologique (CSE), Senegal 2002.
O. Masera et al. / Biomass and Bioenergy 30 (2006) 618–637 635
contrasting set of circumstances. Case studies that deserveattention include situations were a large fraction ofwoodfuels come from agricultural areas or from non-woody biomass. The new challenges coming from thesecase-studies will serve to make the methodology morerobust and adaptable to the variety of circumstances thatmay be found in different countries.
Moreover, clear linkages between the WISDOM analysisat the national/regional level and interventions at the locallevel must be developed. Having identified the woodfuelhot spots at a national/sub-national level, a more detailedspatial analysis needs to be conducted within each of thepriority areas or hot spots [30]. For this purpose, a betterunderstanding of the local woodfuel system (i.e. thedifferent ways in which wood resources are produced,harvested, transformed and converted finally to energy,taking into account the larger context of forest resources)is needed. Masera et al. [30] shows an example of thistype of analysis for a region in Central Mexico. Theanalysis of the local woodfuel system will allow theidentification of concrete topics and issues for actualinterventions. Thus, a logical chain of actions—fromnational planning to local intervention—can be estab-lished. It should be noted that this last step will needadditional planning and implementation tools as well as aparticipatory approach that effectively incorporates thelocal population.
Acknowledgements
The authors are grateful to Margaret Skutsch, for herinvaluable comments and suggestions on the first draft ofthe paper.
References
[1] Hoogwijk M, Faaij A, Van den Broek R, Berndes G, Gielen D,
Turkenburg W. Exploration of the ranges of the global potential of
biomass for energy. Biomass & Bioenergy 2002;25(2):119–33.
[2] Berndes G, Hoogwijk M, Van den Broek R. The contribution of
biomass in the future global energy supply: a review of 17 studies.
Biomass & Bioenergy 2003;25(1):1–28.
[3] IEA. Key world energy statistics 2003. Paris, France: International
Energy Agency, Energy Statistics Division; 2003.
[4] Trossero MA. Wood energy: the way ahead. Unasylva 2002;53(211):
3–12.
[5] RWEDP. Wood energy development: planning, policies and strate-
gies, vol. 2. Field Document No 37b. Regional Wood Energy
Development Programme in Asia GCP/RAS/154/NET. Bangkok,
Thailand: FAO; 1993.
[6] FAO. Unified Wood Energy Terminology UWET. Working docu-
ment FOPW/01/05. Rome: FAO; 2001. Available on the internet:
http://www.fao.org/documents/show_cdr.asp?url_file=/docrep/008/
j0926e/j0926e00.htm (last visited on 19 December 2005).
[7] IEA. Energy and poverty. In: World energy outlook. Paris:
International Energy Agency; 2002.
[8] Broadhead J, Bahdon J, Whiteman A. Woodfuel consumption
modelling and results. Annex 2. In: Past trends and future

ARTICLE IN PRESSO. Masera et al. / Biomass and Bioenergy 30 (2006) 618–637636
prospects for the utilization of wood for energy. Working Paper
GFPOS/WP/05, Global Forest Products Outlook Study. Rome:
FAO; 2001.
[9] Eckholm E. The other energy crisis: firewood. Worldwatch Paper 1.
Washington DC: Worldwatch Institute; 1975.
[10] FAO. Forestry for local community development. Forestry Paper 7.
Rome: FAO; 1978.
[11] FAO. Map of the fuelwood situation in the developing countries.
Unasylva Supplement. Rome: FAO; 1981.
[12] Geist HJ, Lambin EF. Proximate causes and underlying driving
forces of tropical deforestation. Bioscience 2002;52(2):143–50.
[13] Detrinidad ME. Algunas consideraciones para normar, regular y
controlar el manejo de bosques tropicales secos utilizados en la
produccion de lena en Nicaragua. Managua: Instituto Nicaraguense
de Recursos Naturales y del Ambiente (IRENA) and Servicio
Forestal Nacional de Nicaragua (SFN); 1993.
[14] Goldemberg J. Madera para Energıa y Perspectivas Energeticas. In:
Proceedings of the IX world forest congress, Mexico city; 1985.
[15] ESMAP. Sustainable woodfuel supplies from the dry tropical
woodlands. Energy Sector Management Assistance Programme and
United Nations Development Programme. Washington DC: The
World Bank; 2001.
[16] Arias Chalico T. Forest resources for energy: environmental and
social dimensions in four countries of Latin America. In: Proceedings
of the first international seminar on bioenergy and sustainable rural
development. Morelia, Mexico: UNAM-ANES; 2003.
[17] Foley G. Exaggerating the Sahelian woodfuel problem? Ambio
1987;16(6):367–71.
[18] Leach M, Mearns R. Beyond the woodfuel crisis: people, land and
trees in Africa. London: Earthscan Publications; 1988.
[19] Dewees PA. The woodfuel crisis reconsidered: observations on the
dynamics of abundance and scarcity. World Development
1989;17(8):1159–72.
[20] Lele S. Degradation, sustainability, or transformation? A case study
of villager’s use of forest land in the Malnaad Region of Uttara
Kannada District, India. Ph.D. Thesis. Berkeley: University of
California; 1993.
[21] Masera O. Socioeconomic and environmental implications of fuel-
wood use dynamics and fuel switching in rural Mexico. Ph.D. Thesis.
Berkeley: University of California; 1994.
[22] Mahapatra AK, Mitchell CP. Biofuel consumption, deforestation,
and farm level tree growing in rural India. Biomass & Bioenergy
1999;17:291–303.
[23] Arnold M, Kohlin G, Persson R, Shepherd G. Fuelwood revisited :
what has changed in the last decade? Occasional Paper No. 39. Bogor
Barat, Indonesia: Center for International Forestry Research
(CIFOR); 2003.
[24] RWEDP. Regional study on wood energy: today and tomorrow in
Asia. Field Document No. 50. Regional Wood Energy Development
Programme in Asia GCP/RAS/154/NET. Bangkok, Thailand: FAO;
1997.
[25] RWEDP. Basics of wood energy planing: a manual. Regional Wood
Energy Development Programme in Asia GCP/RAS/154/NET.
Bangkok, Thailand: FAO; 2000.
[26] Masera O, Navia J, Arias T, Riegelhaupt E. Patrones de Consumo de
Lena en Tres Micro-regiones de Mexico: Sıntesis de Resultados.
Proyecto FAO/MEX/TCP/4553(A). Patzcuaro, Mexico: GIRA AC;
1997.
[27] De Montalembert MR, Clement J. Fuelwood supplies in the
developing Countries. Forestry Paper No. 42. Rome: FAO; 1983.
[28] Newcombe K. An economic justification for rural afforestation: the
case of Ethiopia. Energy Department Paper No. 16. Washington,
DC: The World Bank; 1984.
[29] Kartha S, Leach G. Using modern bioenergy to reduce rural
poverty. Report to the Shell Foundation. London: Shell Foundation;
2001.
[30] Masera O, Guerrero G, Ghilardi A, Velasquez A, Mas JF, Drigo R,
et al. Multiscale analysis of fuelwood hot spots using the WISDOM
approach: a case study for Mexico. Rome: FAO; 2005 in press.
Available on the Internet: http://www.oikos.unam.mx/FAOreport
(last visited on 28 February 2006).
[31] Drigo R. WISDOM Slovenia: analysis of spatial woodfuel produc-
tion–consumption patterns in Slovenia. Consultancy Report FAO/
Government of Slovenia Project ‘‘Supply and Utilization of
Bioenergy to Promote Sustainable Forest Management’’ TCP/SVN/
2901. Rome: FAO; 2004.
[32] Drigo R. WISDOM Senegal: analysis of woodfuel production–con-
sumption patterns in Senegal. Consultancy Report, FAO Wood
Energy Programme. Rome: FAO; 2004.
[33] Masera O, Drigo R, Trossero MA. Woodfuels Integrated Supply/
Demand Overview Mapping (WISDOM): a methodological
approach for assessing woodfuel sustainability and support
wood energy planning. FAO–EC Partneship Programme; Wood
Energy Programme—FAO Forestry Department. Rome: FAO;
2003.
[34] Marble DF. Geographic information system technology and deci-
sion support systems. In: Proceedings of the XXXII annual ha
waii international conference on system sciences. Hawaii: Insti-
tute of Electrical and Electronics Engineers, Inc. (www.ieee.org);
1998.
[35] ORNL. LandScan Global Population Project. Available on the
internet: http://www.ornl.gov/sci/gist/projects/LandScan/landscan_
doc.htm (last visited on 19 December 2005).
[36] Arias T, Riegelhaupt E. Guıa para estudios de demanda, oferta y
abastecimiento de combustibles de madera. Programa de Asociacion
Comunidad Europea GCP/RAF/354/EC; Programa de Manejo
Forestal Sostenible GCP/RLA/133/EC. Rome: FAO; 2002.
[37] Drigo R. Wood energy information in Africa. Working Docu-
ment FOPW/01/4, FAO Project GCP/RAF/354/EC. Rome: FAO;
2001.
[38] FAO. Survey of tropical forest cover and study of change processes.
Forestry Paper No. 130. Rome: FAO; 1996.
[39] Drigo R. Survey of pan-tropical forest resources based on multi-date
high resolution satellite data. Proceedings of the EUROSTAT
Esquilino seminar; November 1995, p. 111–41.
[40] FAO. Global Forest Resources Assessment 2000. Main report. FAO
Forestry Paper No. 140. Rome: FAO; 2001.
[41] Achard F, Eva H, Stibig HJ, Mayaoux P, Gallego J, Richards T,
et al. Determination of deforestation rates of the world’s humid
tropical forests. Science 2002;297:999–1002.
[42] FAO. Monitoring of forest resources at district level using multi-date
satellite data. Assistance to the Andhra Pradesh WB/GOI Forestry
Project. Rome: FAO; 1995.
[43] Millington AC, Ryan P, Douglas TD, Critchley RW. Estimating
woody biomass in sub-Saharan Africa. Washington, DC: World
Bank; 1994.
[44] Kaale BK. Traditional fuels. In: Pastzor J, Kristoferson LA, editors.
Bioenergy and the enviroment. Environment Institute of the United
Nations Environment Programme UNEP. Oxford: Westview Press;
1990.
[45] Ryan P, Openshaw K. Assessment of biomass energy resources: a
discussion on its need and methodology. Washington, DC: World
Bank; 1991.
[46] Ngugi A. Cultural aspects of fuelwood shortage in the Kenyan
Highlands: examples from Kakamega and Mur’anga districts.
Journal of Biogeography 1988;15:165–70.
[47] Zhang J, Smith KR, Ma Y, Ye S, Jiang F, Qi W, et al. Greenhouse
gases and other airborne pollutants from household stoves in China:
a database for emission factors. Atmospheric Environment
2000;34(26):4537–49.
[48] Bailis R, Ezzati M, Kammen DM. Greenhouse gas implications of
household energy technology in Kenya. Environmental Science and
Technology 2003;37(10):2051–9.
[49] Masera O. Uso y Conservacion de Energıa en el Sector Rural: El caso
de la lena. Documentos de Trabajo No. 21. Patzcuaro, Mexico:
GIRA AC; 1996.

ARTICLE IN PRESSO. Masera et al. / Biomass and Bioenergy 30 (2006) 618–637 637
[50] INEGI. XII Censo General de Poblacion y Vivienda, 2000. Mexico,
DF: INEGI; 2000.
[51] Dıaz R. Consumo de lena en el sector residencial de Mexico:
evolucion historica y emisiones de CO2. Tesis de Maestrıa. Mexico,
DF: Facultad de Ingenierıa, UNAM; 2000.
[52] Masera O. Deforestacion y degradacion forestal en Mexico.’’
Documentos de trabajo No. 19. Patzcuaro, Mexico: GIRA AC; 1996.
[53] Amo Rodrıguez S (coord.). La lena: el energetico rural en tres micro-
regiones del sureste de Mexico. PROAFT AC. Mexico DF: Plaza y
Valdez Editores; 2002.
[54] Puentes V. Impacto del consumo de lena en el bosque de Santa Fe de
la Laguna, Michoacan. Tesis de Licenciatura. Mexico, DF: Facultad
de Ciencias, UNAM; 2002.
[55] Palacio JL, Bocco G, Velasquez A, Mas JF, Takaki F, Victoria A,
et al. La condicion actual de los recursos forestales en Mexico:
resultados del Inventario Forestal Nacional 2000. Boletın del
Instituto de Geografıa. UNAM 2000;43:183–203.
[56] Word EC, Tappan GG, Hadj A. Understanding the drivers of
agricultural land use change in south-central Senegal. Journal of Arid
Environments 2004;59(3):565–82.