wireless sensor network corrosion …lin/cpet581-internetofthings/1... · · 2016-02-28the...
TRANSCRIPT
2/27/2016
1
WIRELESS SENSOR NETWORK
– CORROSION MONITORING
SYSTEM
College of Engineering Technology and Computer Science
By Luis D. Morales
Advisor Prof. Paul I. Lin1
CPET 598 M.S. Directed Project
ABSTRACT/EXECUTIVE SUMMARY
Over the last three (3) years Indiana-University Purdue-University Fort Wayne (IPFW) has been engaged in the development of a corrosion monitoring system using state-of-the-art sol-gel sensors and cylindrical sensors. This activity is a joint venture with the Army Construction Engineering Research Laboratory (CERL) and is focused at establishing a system that is capable of monitoring the level/degree of corrosion of steel and steel structures. The project in itself has seen many design stages, each of which has improved the sensing capabilities, ranges and overall robustness of the system.
The author was involved in implementing design techniques which would significantly reduce the physical size, and improve the capabilities of the system. The design scope also required an analysis into various sensors and wireless communication techniques available for consumer and industrial applications.
Research was conducted in order to properly incorporate a new generation of an Arduino product, which would enable a modular and versatile wireless sensor node. Additional sensing capacity such as; temperature, humidity and barometric pressure were incorporated. The additional data captured is critical in order to properly analyze and predict the main factors attributed to the corrosion of steel and a steel structure.
2

2/27/2016
2
3
INTRODUCTION
Consumer and Industrial products are expanded through
wireless connectivity
Features include:
Remote Control, Monitoring, Diagnostics, & Troubleshooting
Basic Sensors measure
Temperature, Humidity, Pressure, & Motion
Fundamental Connectivity include
Product w/ Host Microcontroller, Sensors, Connectivity Module,
Cloud Service and User Interface
Product
4
STATEMENT OF THE PROBLEM
A Sensor Network has been developed by IPFW and the Army as a joint project with the objective to provide an integrated system that is capable monitoring and predict corrosion on a steel surface or infrastructure.
The initial design required extensive wiring and various power levels, which affected the overall reliability and robustness of the system.
The second phase of the project investigated the feasibility of a potential open-source wireless solution. Reliable communication was established and long range testing surpassed expectations. The system was not optimized for packaging, as an off-the-shelf solution was implemented with the existing ASP (Analog Signal Processing Unit).

2/27/2016
3
5
SIGNIFICANCE OF THE PROBLEM
The development and integration of a wireless sensor network is the ideal solution for a system that requires multiple sense locations and data being transmitted (wired or wirelessly) to a central control hub.
Phase 0 and Phase 1 of the Corrosion Monitoring System (CMS) provided the building blocks and fundamental understanding of the main problem and potential solutions.
This exercise will expand on the knowledge that was obtained, and will expand system packaging and functionality.
The fundamental design remained in-tact, as its basic functionality has been proven.
6
STATEMENT OF THE PURPOSE
The Wireless Sensor Network - Corrosion Monitoring System will need to be redesigned with the goal of providing a smaller profile, more reliable solution.
Components will be cross referenced, newer, more precise and lower cost components are implemented into the design.
The ASP (Analog Processing Unit) must be an integrated solution with the Host MCU and Wireless Transceiver modules.
Additional sensors will be integrated to further understand a larger scope of the environment to which the system and infrastructure is exposed to.

2/27/2016
4
7
REVIEW OF LITERATURE/BACKGROUND
Wireless communication has been implemented in:
Healthcare, Military, Consumer Electronics, Home Automation,
Security and Sensor Networks
Sensor Lead Time and Costs have decreased
Commercialized communication protocols include:
Bluetooth, Zigbee, Wi-Fi
8
REVIEW OF LITERATURE/BACKGROUND CONT.
Bluetooth
Operates in the 2.4GHz - 2.4835GHz, Up to 1Mbps data rate
Mostly used in the Cell Phones, Keyboards, Mice, Printers
Challenges include:
Application Topology Flexibility, Auto Configurability, Power
Consumption
Network Topologies:
Piconet (adHoc) - Master w/ Seven (7) Slaves
Scatter (Two (2) or more Piconets
Bluetooth Class Definitions
Type Power Max Power Level Designed Operating Range Sample Devices
Class 1 High 100mW (20dBm) Up to 100 meters (328 Feet) USB Adapters, Access Points
Class 2 Medium 2.5mW (4dBm) Up to 10 meters (33 Feet)
Mobile Devices, Bluetooth
Adapters, Smart Card Readers
Class 3 Low 1.0mW (0 dBm) Up to 1 meter (3 Feet) Bluetooth Adapters

2/27/2016
5
9
REVIEW OF LITERATURE/BACKGROUND CONT.
Zigbee
Designed for Low Cost, Long Battery Life and Flexibility
IEEE 802.15.4 Standard
Frequencies include: 868MHz, 902-928MHz & 2.4GHz
Zigbee Alliance:
Focused on establishing standards across products and a support
network
200+ participants, across various levels of involvement
Topologies:
Star, Peer-to-Peer, and Mesh Networks
Frequency Bands Based on Location
Frequency Band (MHz) Data Rate (kb/s) Channel Numbers Geographical Area
868.3 20 1 Europe
902-928 40 1-10 America, Australia
2405-2480 250 11-26 Worldwide
10
REVIEW OF LITERATURE/BACKGROUND CONT.
Wi-Fi
Revolutionized LAN’s (Local Area Networks)
IEEE 802.11 Standard
802.11b – capability of data rates up to 11Mbps @ 2.4GHz
802.11a – capability of data rates up to 54Mbps @ 5.0GHz
802.11g – capability of data rates up to 22Mbps
802.11e - is being developed for higher operation standards
Topologies
STA’s – Wireless Client Radios (Stations)
AP’s – Bridge between Wired and Wireless LAN’s (Access Point)
2/27/2016
6
11
REVIEW OF LITERATURE/BACKGROUND CONT.
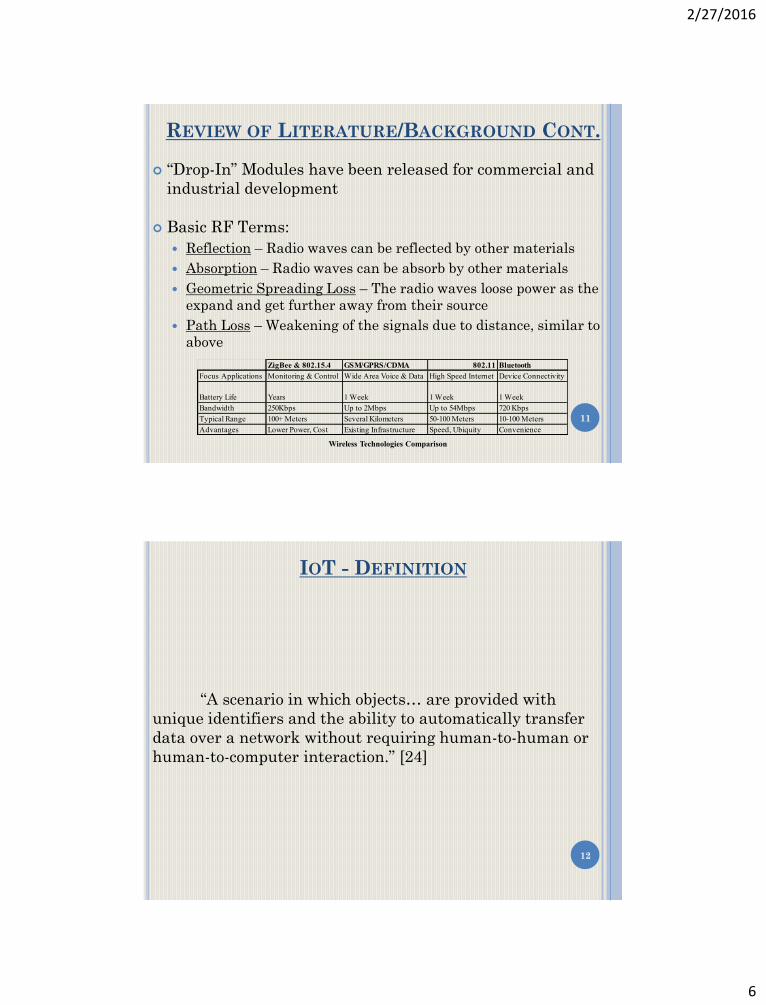
“Drop-In” Modules have been released for commercial and
industrial development
Basic RF Terms:
Reflection – Radio waves can be reflected by other materials
Absorption – Radio waves can be absorb by other materials
Geometric Spreading Loss – The radio waves loose power as the
expand and get further away from their source
Path Loss – Weakening of the signals due to distance, similar to
above
Wireless Technologies Comparison
ZigBee & 802.15.4 GSM/GPRS/CDMA 802.11 Bluetooth
Focus Applications Monitoring & Control Wide Area Voice & Data High Speed Internet Device Connectivity
Battery Life Years 1 Week 1 Week 1 Week
Bandwidth 250Kbps Up to 2Mbps Up to 54Mbps 720 Kbps
Typical Range 100+ Meters Several Kilometers 50-100 Meters 10-100 Meters
Advantages Lower Power, Cost Existing Infrastructure Speed, Ubiquity Convenience
12
IOT - DEFINITION
“A scenario in which objects… are provided with
unique identifiers and the ability to automatically transfer
data over a network without requiring human-to-human or
human-to-computer interaction.” [24]

2/27/2016
7
13
IOT - SERVICES
IoT Services improve:
Reliability, Facilitate Forecasting, Reduce Waste, Prevention
and Prediction of conditions
Services include:
Remote Access (Lighting & Security), Diagnostics, Warranty
Verification, Firmware/Software Update
Applications include:
Medical – Patient Monitoring,
Farming – Animal with a biochip transponder
Automotive – Tire Pressure Sensors, Proximity Sensors
Industrial – Equipment Fault Alert System
Commercial – Smart Appliances (Refrigerators, Washers,
Dryers, Television, Garage Door Openers, Outlets)
14
IOT – SERVICES CONT.
Information/Analysis Scenarios
Enhanced Tracking Behavior – Embedded sensors can provide
the location of products or services. In a rental car, location
awareness can assist with locating services such as; gas
stations, hotels and restaurants
Enhanced Situational Awareness – Infrastructure deployed
sensors can provide an outlook on road condition, traffic
patterns, environmental conditions, and crime reduction
through the use of video, audio and vibration detection.
Sensor-Driven Decision Analytics – Retail chains can deploy
sensors through the store and measure which displays or in
store advertisement catch an individual’s attention as well as
the duration of the attention. This would assist in improving
advertisement techniques to better attract customers [23]

2/27/2016
8
15
IOT – SERVICES CONT.
Automation/Control Services
Process Optimization – RFID sensor based design can improve a
manufacturing facility, by capturing key pieces of information, process
flow improvements can be made, and bottleneck processes can be
eliminated or reduced
Optimized Resource Consumption – the incorporation of a “smart home”
could improve power consumption by remotely reducing the power
consumed by larger appliances during peak demand times
Complex Autonomous Systems – this includes systems that are aware of
their surroundings and are able to make decisions based on a change in
the environment. One key example is an autonomous automobile. Sensors
would be responsible for maintaining safe drive speeds and distances, and
would be responsible for proper responses or corrections in the event of
an external trigger [23]
16
IOT – DEVELOPMENT TRENDS
Corporations are looking to expand WSN, in order to:
Improve Reliability of products or goods
Predict premature failure of products or good
Provide targeted information to consumers
Expand access to products or goods
Next Generation Integration include:
Home Automation
Smart Energy
WBAN (Wide Body Area Networks)

2/27/2016
9
17
IOT – DEVELOPMENT TRENDS CONT.
Wide Body Area Networks (WBAN)
Wearable Sensors strategically placed
Used for Patient and Athletes Monitoring
Rehabilitation, Workout Analysis
Improves Rehabilitation Time, Optimized Workout Routines
Limiting the Risk of additional injury
Wireless Body Area Network for Health Monitoring [27]
18
IOT - TECHNOLOGIES
Home Automation has been developed using a number of
protocols
X10 – “granddaddy” of home automation,
Initially PLC (power line communication) based
Operates in the 310MHz and 433MHz
Z-Wave – Proprietary owned by Sigma Designs, 900MHz
Insteon – Mesh Topology, Backwards compatible with X10
Zigbee –
Wi-Fi –

2/27/2016
10
19
IOT – REPORTED PROJECTS
Lowe’s Iris: Developed through AlertMe in the UK.
Comprised of a number of motion, proximity and activity sensors
Communicate to a central hub, through Z-Wave ad Zigbee.
The central hub communicates to home router using Wi-Fi.
Cost ranges from $129 for a wireless video camera, to $299 kits
Vivint: Packaged home automation, smart energy management, home security
and solar energy.
Centralized the Go!Control
Costs around $699
JDS Technologies: Complete home automation system.
Compatible with Insteon, X10, IR and RS232.
Costs around $499
20
IOT – REPORTED PROJECTS CONT.
SmartThings:
Home automation features key tracking & window open/door sensors.
Compatible with Zigbee and Z-Wave
Costs for 2 hubs and 6 sensors is about $323.
Additional outlets - $35 & additional motion/open-close sensors $25
HomeSeer:
Features climate control, security, lighting, audio/video control
Utilizes X10, Insteon and Z-Wave.
Costs around $499.95
mControl:
Features an integrated HD-DVR for security cameras, data logging,
energy management, media control, and professional system
connectivity.
Compatible with X-10, Insteon, Z-Wave, and Zigbee.
Costs around $370

2/27/2016
11
21
IOT – REPORTED PROJECTS CONT.
Additional Top Home Automation Systems ADT Pulse
Revolv Smart Home Automation Solution
AT& T Digital Life
TaHoma by Somfy
Savant SmartSystems
Commercialized Stand-Alone Products SmartHome Brand – (motion sensors, thermostats, IP Security Cameras),
Belkin WeMo – (home light switch, motion sensors, Wi-Fi Based Baby monitors)
Nest Learning Thermostat – Wi-Fi based self-learning thermostat
Nest Protect - Smoke and Carbon Monoxide Detector
Home Automation Systems Matrix
X10 Z-Wave Insteon Zigbee WiFi Cost
Lowe's Iris x x x $299.00
Vivint x $699.00
JDS Tech. x x x $499.00
SmartThings x x x $323.00
HomeSeer x x x x $499.95
mControl x x x x $370.00
ADT Pulse x x $99.00
Revolv x x x $299.00
AT&T Digital Life x $149.00
TaHoma x x $2,500.00
Savant x x x Customizable
22
BACKBONE OF IOT/HOME AUTOMATION
Corporations leverage on Cloud Service Providers
IaaS – Infrastructure (Servers, Storage, Networks)
PaaS – Platform (databases, web server)
SaaS – Application (communication, virtual desktops)
Research was conducted on three Cloud Service Providers
Provide end-to-end platform for IoT designs
Facilitate Connectivity to the Cloud Target OEM’s with easy,
secure, and cost effective internet connected devices
Provide a drop-in platform solution

2/27/2016
12
23
BACKBONE OF IOT/HOME AUTOMATION CONT.
Cloud Service Providers assist in:
Hardware: Wi-Fi Chip/Module Selection
Controllable Power Supply
Antennas
Certifications
I/O Signal Compatibility
Software: IP Stacks
SSL/Security/Certificates
Wi-Fi Network Connectivity
Firewall Management
Communications Protocols: Email, SMS, Twitter, Facebook, etc…
Micro Processor Drivers
Flexible API (Application Programming Interface)
Cloud Services: Security & Certificate Management
Redundant Scalable Server Architecture
Scalable and Robust Databases
API for iPhone, Android and HTML
Connectivity to other web services
Data Analytics
24
BACKBONE OF IOT/HOME AUTOMATION CONT.
Cost Analysis was conducted, with a quote being provided
for the requested services
Monthly Service Fee: $1.10 per 50k EAU
Cloud Connectivity Solution Development Costs
Description Lead Time Cost
Phase 0 Device Platform and Board Development 2 weeks 8,500.00$
- Protocol Setup
- Data Simulation Setup
- Basic Data Visualization
Phase 1 Mobile APP Development 6-8 weeks 5,500.00$
- IOS Application (ON/OFF/Rx/Tx/Log)
Phase 2 Production Development 16 weeks 135,300.00$
- Application Architecture
- Project Management
- UI Designer
- Software Leader
- Software Developer - Mobile
- Software Quality Assurance
Total: 149,300.00$
Cloud Connectivity Solutions

2/27/2016
13
25
BACKBONE OF IOT/HOME AUTOMATION CONT.
Examples: Craftsman AssureLink Garage Door Opener
Retrofit Unit Available for $129.99 (Sears)
Setup: Connect Gateway, Add Devices (Garage Door Opener)
Belkin WeMo Switch
Available for $49.99
AssureLink Retrofit KitBelkin Wi-Fi Enabled Switch
26
BACKBONE OF IOT/HOME AUTOMATION CONT.
Examples: Craftsman AssureLink Garage Door Opener – Home Installation
Wi-Fi Outlet – Power Management (Refrigerator)
AssureLink Wi-Fi Enabled Outlet

2/27/2016
14
27
IOT – SMART APPLIANCES
“A smart space environment is characterized by the
presence of intelligence in the presence of everyday
objects.” [5]
Smart Home Appliances Overview [6]
28
IOT – SMART GRID APP
Wireless Sensor Networks, Smart Appliances and Home
Automation would tie into a Smart Grid Infrastructure
HAN (Home Area Network) w/ centralized EMS (Energy
Management System)
Components will include: dishwasher, washer, dryer,
refrigerator, televisions, water heaters, HVAC systems, etc…
Pro’s: Demand Levelling, Green Incentives, Latest Tech.
Con’s: Privacy Concerns
Smart Home Integration [9]
2/27/2016
15
29
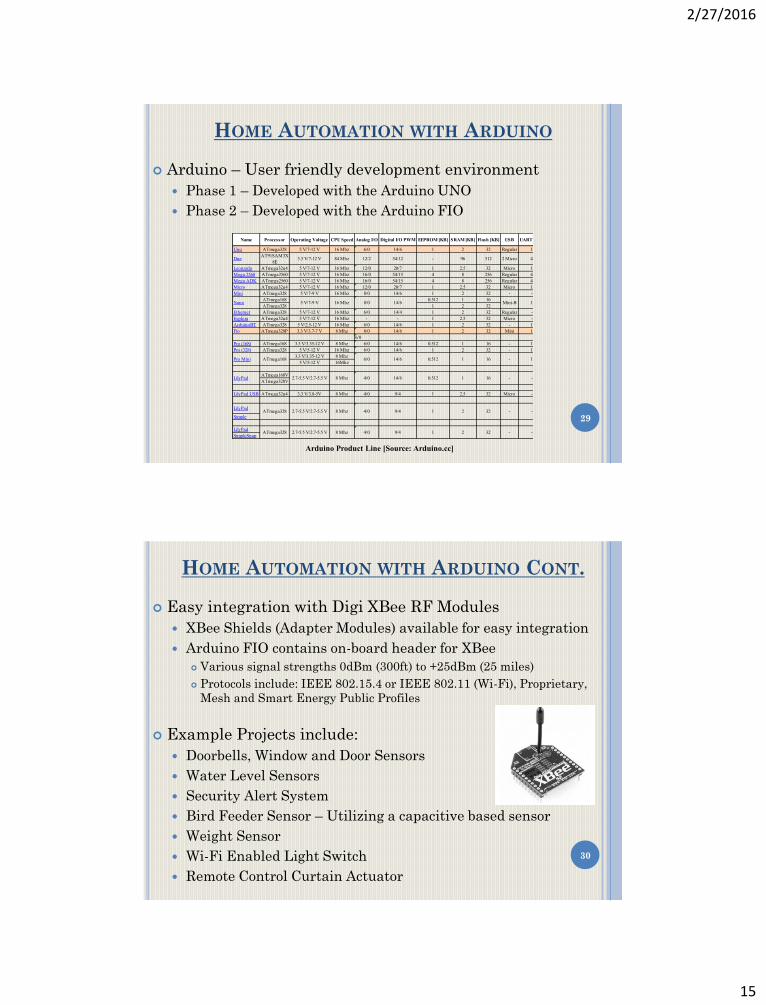
HOME AUTOMATION WITH ARDUINO
Arduino – User friendly development environment
Phase 1 – Developed with the Arduino UNO
Phase 2 – Developed with the Arduino FIO
Arduino Product Line [Source: Arduino.cc]
Name Processor Operating Voltage CPU Speed Analog I/O Digital I/O PWM EEPROM [KB] SRAM [KB] Flash [KB] USB UART
Uno ATmega328 5 V/7-12 V 16 Mhz 6/0 14/6 1 2 32 Regular 1
DueAT91SAM3X
8E3.3 V/7-12 V 84 Mhz 12/2 54/12 - 96 512 2 Micro 4
Leonardo ATmega32u4 5 V/7-12 V 16 Mhz 12/0 20/7 1 2.5 32 Micro 1
Mega 2560 ATmega2560 5 V/7-12 V 16 Mhz 16/0 54/15 4 8 256 Regular 4
Mega ADK ATmega2560 5 V/7-12 V 16 Mhz 16/0 54/15 4 8 256 Regular 4
Micro ATmega32u4 5 V/7-12 V 16 Mhz 12/0 20/7 1 2.5 32 Micro 1
Mini ATmega328 5 V/7-9 V 16 Mhz 8/0 14/6 1 2 32 - -
ATmega168 0.512 1 16
ATmega328 1 2 32
Ethernet ATmega328 5 V/7-12 V 16 Mhz 6/0 14/4 1 2 32 Regular -
Esplora ATmega32u4 5 V/7-12 V 16 Mhz - - 1 2.5 32 Micro -
ArduinoBT ATmega328 5 V/2.5-12 V 16 Mhz 6/0 14/6 1 2 32 - 1
Fio ATmega328P 3.3 V/3.7-7 V 8 Mhz 8/0 14/6 1 2 32 Mini 1
6/0
Pro (168) ATmega168 3.3 V/3.35-12 V 8 Mhz 6/0 14/6 0.512 1 16 - 1
Pro (328) ATmega328 5 V/5-12 V 16 Mhz 6/0 14/6 1 2 32 - 1
3.3 V/3.35-12 V 8 Mhz
5 V/5-12 V 16Mhz
ATmega168V
ATmega328V
LilyPad USB ATmega32u4 3.3 V/3.8-5V 8 Mhz 4/0 9/4 1 2.5 32 Micro -
LilyPad
Simple
LilyPad
SimpleSnap2 32 - -
2 32 - -
ATmega328 2.7-5.5 V/2.7-5.5 V 8 Mhz 4/0 9/4 1
1 16 - -
ATmega328 2.7-5.5 V/2.7-5.5 V 8 Mhz 4/0 9/4 1
LilyPad 2.7-5.5 V/2.7-5.5 V 8 Mhz 4/0 14/6 0.512
1
Pro Mini ATmega168 6/0 14/6 0.512 1 16 - 1
Nano 5 V/7-9 V 16 Mhz 8/0 14/6 Mini-B
30
HOME AUTOMATION WITH ARDUINO CONT.
Easy integration with Digi XBee RF Modules
XBee Shields (Adapter Modules) available for easy integration
Arduino FIO contains on-board header for XBee
Various signal strengths 0dBm (300ft) to +25dBm (25 miles)
Protocols include: IEEE 802.15.4 or IEEE 802.11 (Wi-Fi), Proprietary,
Mesh and Smart Energy Public Profiles
Example Projects include:
Doorbells, Window and Door Sensors
Water Level Sensors
Security Alert System
Bird Feeder Sensor – Utilizing a capacitive based sensor
Weight Sensor
Wi-Fi Enabled Light Switch
Remote Control Curtain Actuator

2/27/2016
16
31
PHASE 0
Corrosion Monitoring through Sol-Gel capacitive sensor
Two aluminum conductive plates, adhered to a glass plate
Coated with SnCl4 (Tin Tetra Chloride) and/or InCl3 (Indium
Tri Chloride)
5V/1.5V 1kHz signal placed across the plates
Created a capacitive sensor
Sol-Gel Sensor [10]
32
PHASE 0 CONT.
Capacitance measure and converted to voltage using an
ASP
ADAM-4016 A/D, RS485 serial based for data capturing
Required +/- 22Vdc
Deployed at the Arsenal Bridge - Rock Island, IL. 5/2013
Analog Signal Processing Unit (ASP)
Voltage Regulator
(+15 & -15V)
Sine Wave
Generator
(5V pk-pk)
Capacitance to
Voltage Conversion
Precision
Full-Wave Rectifier
Signal Amplifier &
Signal ConverterNoise Filter
Loading Effect
BufferEmbedded DAQ
Computer
Monitoring System

2/27/2016
17
33
PHASE 1 – ARDUINO UNO
An attempt to increase flexibility and reliability
Arduino UNO, XBee Shield, XBee Module + ASP selected
as the next step solution
Not an integrated solution
Phase 1 Solution
Phase 1 Solution Block Diagram
34
PHASE 2 – ARDUINO FIO
Arduino FIO V2.3:
ATmega328P, 14 Digital I/O, 8 Analog Inputs, UART
3.3Vdc Working Voltage
Lithium Ion Battery Connector
USB Charge Connector
XBee On-Board Header
ARDUINO FIO VS ARDUINO UNO

2/27/2016
18
35
NETWORK NODE & NETWORK ARCHITECTURE
Sensor Network comprised of:
3 Sensor Nodes
1 Network Coordinator
Capacitive, Temperature, Humidity & Pressure Sensors
9600 bps at 2.4GHz
Coordinator/Router Configured in AT Mode AT Mode: Transparent with Single Coordinator
Data is automatically received, packaged & transmitted
API Mode: Destination address can be dynamically changed
XBEE SENSOR NODE & COORDINATOR
Analog Processing Unit
Sensors Assemblies [0,4]
Cap Sensor
Arduino FIO MicroController
Xbee (Router)
Xbee Development Kit
Coordinator Assembly
Xbee (Coordinator)
Computer
USB
Temp./Hum.
Sensor
Bar. Press
Sensor
36
ARDUINO & DIGI XBEE IDE
Arduino: Arduino IDE 1.0.5-r2
Single Page Compiler, Downloader, Data Monitor, Fault
Indicator
Major Functions of the Arduino IDE
Basic Functions: Setup() loop()
Importing Libraries
Serial Monitor & Board Selection
2/27/2016
19
37
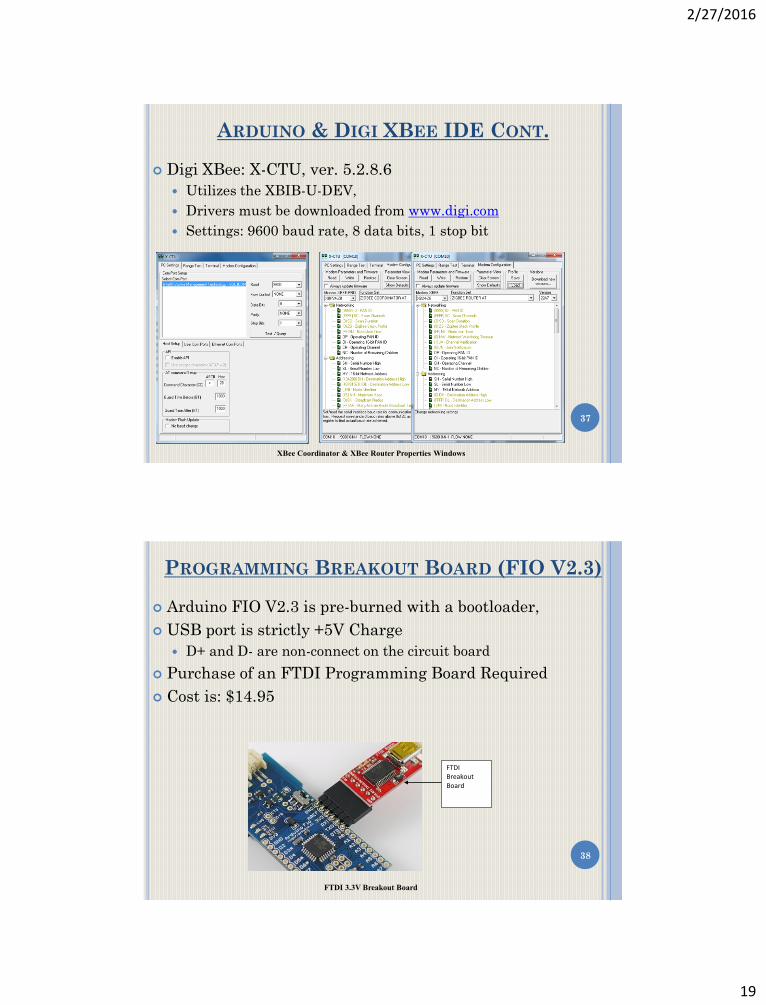
ARDUINO & DIGI XBEE IDE CONT.
Digi XBee: X-CTU, ver. 5.2.8.6
Utilizes the XBIB-U-DEV,
Drivers must be downloaded from www.digi.com
Settings: 9600 baud rate, 8 data bits, 1 stop bit
XBee Coordinator & XBee Router Properties Windows
38
PROGRAMMING BREAKOUT BOARD (FIO V2.3)
Arduino FIO V2.3 is pre-burned with a bootloader,
USB port is strictly +5V Charge
D+ and D- are non-connect on the circuit board
Purchase of an FTDI Programming Board Required
Cost is: $14.95
FTDI 3.3V Breakout Board
FTDI Breakout Board

2/27/2016
20
39
PROGRAMMING ADD-ON (FIO V3.0)
ADD-ON Files are required for Arduino FIO V3.0
Drivers and Arduino IDE Upgrade
Configures the IDE compatibility with FIO V3.0
Downloadable from sparkfun.com, must be placed within the
“Hardware” folder of the IDE sketchbook
ADDITIONAL BOARD CAPABILITIES
Arduino FIO V3
40
DESIGN CONSIDERATIONS AND REQ.
Development of Integrated Wireless Sensor Network with
expanded sensing capabilities
Explore Development with the recently released FIO V3.0
Plan: Step 1: Analyze the existing Arduino Uno conceptual design
Step 2: Analyze the software architecture
Step 3: Port the Software into the Arduino FIO V2.3/3.0
Initial Design Utilized port, A0 – Capacitive Sensor Input
Utilized functions (Arduino):
digitalWrite() – Turn On LED D13
delay() – LED ON/OFF Delay Time
analogread() - Read Analog Port (A0)

2/27/2016
21
41
SENSOR NODE W/ FIO V2.3
Utilized Function (FIO V2.3):
serial.print() – data out function
Utilizes Arduino FIO header and UART for communication to XBee Module
Initial Testing:
Connected Arduino A0,
Developed 3 total prototypes using solder-less breadboards
Initial Arduino FIO V2.3 Prototype Testing
Arduino FIO V2.3
ASP
Sol-Gel Sensor
42
SENSOR NODE W/ FIO V3.0
Arduino FIO V2.3 utilizes ATmega328P
Arduino FIO V3.0 utilizes ATmega32u4
Challenges:
Different Pin Locations
FIO V3.0 serial1.print() rather than serial.print() for UART
Output
Different pins_arduino.h required to run FIO V3.0
Different software files and programming process was required
for FIO V3.0
Benefits: On Board programmability (USB)
Breakout board not required
Figure 1: Arduino Fio V2.3 and V3.0
Arduino FIO V3.0 Arduino FIO V2.3

2/27/2016
22
43
SENSOR NODE ROUTER & COORDINATOR
Digi XBee modules were configured through these four
main parameters
PAN ID: (Personal Area Network) Set as ‘9999’All XBee
modules must have the identical PAN ID for proper
communication.
Node Addressing: (Destination Address Low) Set as ‘FFFF’ for
full broadcasting
Channel Verification: Set as ‘1’ on all Routers to ensure the
verification of the PAN ID
Serial Interface Data Rate: Set as ‘9600’ for all nodes on the
network
44
SENSOR FUNCTIONALITY – DHT22
Low Cost, Robust, Highly Accurate Component
Four Pins: Vcc, Data (PWM), Ground
Serial Data:
Data:
8bit integral RH data + 8 bit decimal RH data + 8 bit integral Temp.
data + 8 bit decimal Temp. data + 8 bit check-sum
Checksum:
8bit integral RH data + 8 bit decimal RH data + 8 bit integral Temp.
data + 8 bit decimal Temp. data
RH: (0000 0010 1000 1100)/10 = 65.2% RH
Temp.: (0000 0001 0101 1111)/10 = 35.1°C
Check Sum: (0000 0010 + 1000 1100 + 0000 0001 + 0101 1111) = 1110 1110
Humidity Sensor Comparison Matrix
Humidity Range Humidity Accuracy Temp. Range Temp. Accuracy Sampling Rate
DHT11 20-80% 5% 0-50C +/- 2C 1Hz
DHT22 0-100% 2-5% -40-125C +/- 0.5C 0.5Hz

2/27/2016
23
45
SENSOR FUNCTIONALITY – BMP180
BOSCH - Low Cost, I2C (Inter-Integrated Circuit) Serial Device
Pins Required: Vcc, Ground, SCL, SDA
Utilizes Arduino FIO SCL and SDA pins
FIO V2.3: SDA 27 (A4), SCL 28 (A5)
FIO V3.0: SDA 19 (D2), SCL 18 (D3)
Data:
At start condition, the SCL is in a High ‘1’ state and the SDA is
in a falling edge
7-Bit register address is sent along with the R/W direction bit
ACK is sent on the 9th SCL cycle, by pulling SDA low ‘0’
Stop state, SCL is High ‘1’ state, and SDA is on a rising edge
Barometric Pressure Sensor Range
Temperature Range Temperature Accuracy Press. Range Press. Accuracy
BMP180 0C-65C 0.1C 300-1100hPa 1Pa/0.01hPa/0.01mbar
46
PROTOTYPE ASSEMBLY
Arduino FIO contains 0.100” (2.54mm) pin spacing
Assembled in standard solder-less breadboard
1 prototype used for initial development/testing unit built
2 subsequent prototypes built
Arduino FIO
DHT22
BMP180
Initial Complete Prototype
Network Coordinator + 3 Prototype
Sensor Nodes

2/27/2016
24
47
PROTOTYPE SOFTWARE DEVELOPMENT
Software Development Steps:
a) Software Porting (A0 Read Functionality)
b) DHT22 and BMP180 libraries were imported and configured
c) DHT22 Sensor sample code was imported/modified/tested
d) BMP180 Sensor sample code was imported/modified/tested
Hardware purchase lead-time allowed for the development of
the software basic functionalities
A0 Input
DHT22 Input
BMP180 Input
Software Testing
48
PROTOTYPE TESTING
Prototypes were placed at various locations/distances
Indoor and Outdoor Environment
Data was successfully received
Network Coordinator
Sensor Node 50ft
Sensor Node 100ft
1st Floor 20ft
1st and 2nd Floor 13ft
2nd Floor 24ft
2nd Floor 20ft
Outdoor
Outdoor
Preliminary TestingSample Data Received
2/27/2016
25
49
WSN – DESIGN REQUIREMENTS
Design of the next generation Corrosion Monitoring Sensor Network.
Existing Design: +/- 22Vdc supply
Leaded/Through-Hole components
Non-Direct Mounting of Arduino Development Boards
Single Senor Unit (Capacitance Meter)
Next Generation: Single Input Voltage
Surface Mount (SMD) Technology devices
Direct Mounting of Arduino FIO development board
Addition of the following sensors
Temperature
Humidity
Pressure
50
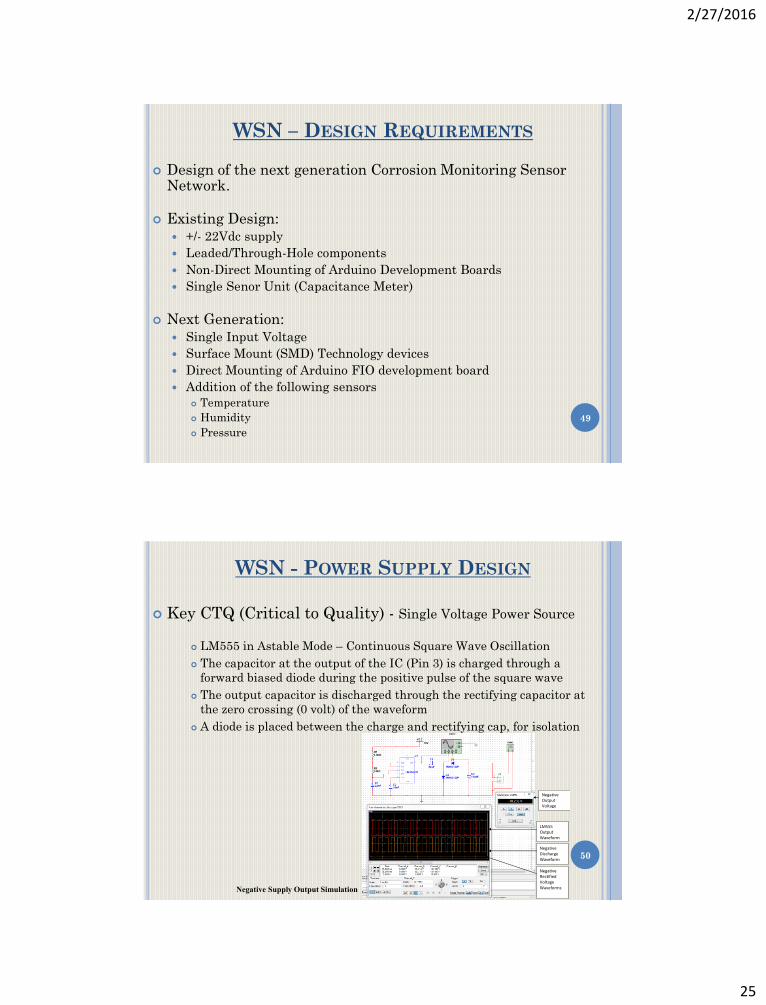
WSN - POWER SUPPLY DESIGN
Key CTQ (Critical to Quality) - Single Voltage Power Source
LM555 in Astable Mode – Continuous Square Wave Oscillation
The capacitor at the output of the IC (Pin 3) is charged through a
forward biased diode during the positive pulse of the square wave
The output capacitor is discharged through the rectifying capacitor at
the zero crossing (0 volt) of the waveform
A diode is placed between the charge and rectifying cap, for isolation
Negative Supply Output Simulation
Negative Output Voltage
LM555 Output Waveform
Negative Discharge Waveform
Negative Rectified Voltage Waveforms

2/27/2016
26
51
WSN – SCHEMATIC CAPTURE
Initial Design Captured in NI Multisim as
5 Separate Sheets
Recaptured in Altium Designer 14
Schematic Symbols
Parameters (QTY, Manufacturer, Part Number)
U1 Schematic Symbol
U1 Parameters U1 Footprint
52
WSN – SCHEMATIC CAPTURE CONT.
2/27/2016
27
53
WSN – PCB CIRCUIT DESIGN
Initial Design Captured in NI Ultiboard
Original Design – ASP Only 4” x 6”
Recaptured in Altium Designer 14
PCB Footprint Generated
New Condensed Version with Direct Arduino FIO interconnects
Additional Prototyping Pads/Area
Final ASP dimensions: 1.67” x 2.87”
Overall size: 2.79” x 3.50”
Gerber Files Generated
Boards Quoted and Built through Advanced Circuits
Altium Capabilities
3D modelling capabilities for form-and-fit analysis
Separate Layer View for Analysis
54
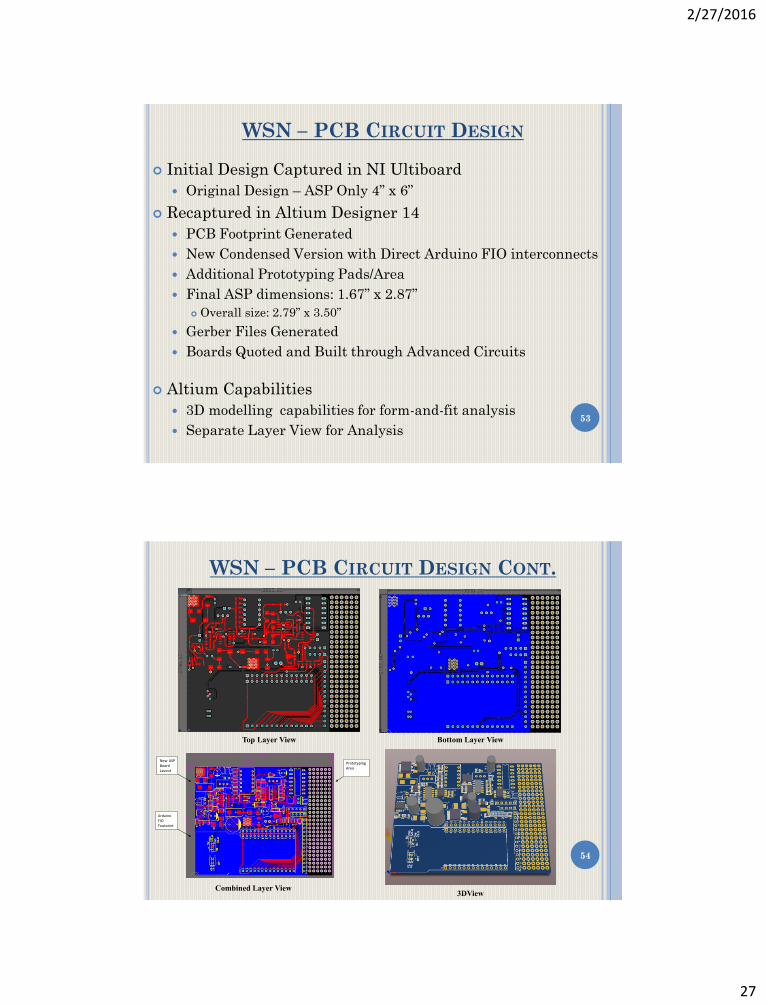
WSN – PCB CIRCUIT DESIGN CONT.
New ASP Board Layout
Arduino FIO Footprint
Prototyping Area
Top Layer View Bottom Layer View
Combined Layer View3DView
2/27/2016
28
55
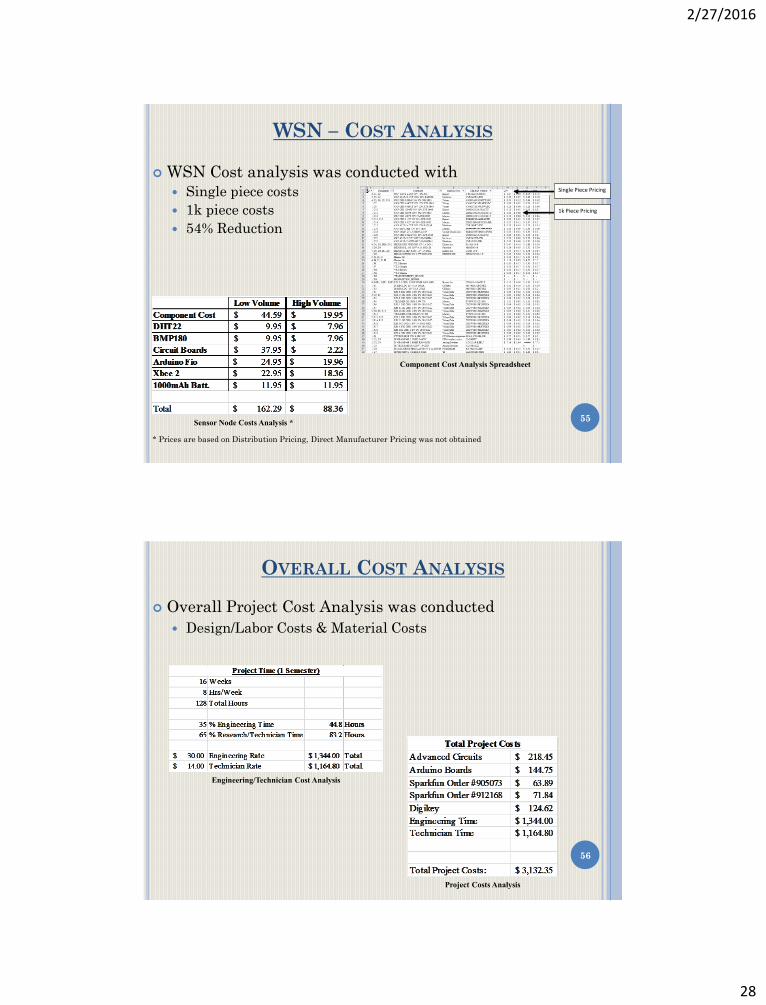
WSN – COST ANALYSIS
WSN Cost analysis was conducted with
Single piece costs
1k piece costs
54% Reduction
* Prices are based on Distribution Pricing, Direct Manufacturer Pricing was not obtained
Single Piece Pricing
1k Piece Pricing
Component Cost Analysis Spreadsheet
Sensor Node Costs Analysis *
56
OVERALL COST ANALYSIS
Overall Project Cost Analysis was conducted
Design/Labor Costs & Material Costs
Engineering/Technician Cost Analysis
Project Costs Analysis

2/27/2016
29
57
FORMAL PROTOTYPE BUILD
Components were purchased for 5 total prototypes
Three (3) prototypes were built
Component footprints were validated
Arduino FIO adapter/header footprint was validated
Wireless Sensor Node (Arduino FIO, XBee Transceiver & ASP)
Cap. Sensor Sinewave
BMP180 Power In
Arduino FIO
DHT-22
58
FORMAL PROTOTYPE BUILD CONT.
Key CTQ (Critical to Quality) – Decrease Sensor Size
Surface Mount Components
Embedded Arduino Control Board
Additional Sensor Functionality
Wireless Sensor Node (Arduino FIO, XBee Transceiver & ASP)
Original ASP
New ASP
Arduino FIO
Arduino UNO
BMP180 (Red) DHT22 (White)

2/27/2016
30
59
POWER SUPPLY VERIFICATION
Dual Voltage Power Supply using LM555 in Astable Mode
50% Duty Cycle
1kHz Square Wave
+/- 15Vdc & 5Vdc (Battery Charge) Generated
Voltage (V) Current (A) Power (W) Voltage (V) Current (A) Power (W)
ASP Only 19 0.038 0.722 19 0.119 2.261
ASP + Arduino 19 0.088 1.672 19 0.119 2.261
ASP + Arduino + Battery 19 0.15 2.85 19 0.18 3.42
Signal Power Measurement .683mW/m2
3.56mW/m2
1.127mW/m2
3.33mW/m2
Arduino FIO 2.3 Arduino FIO 3.0
Generated Square Wave - Positive Generated Square Wave - Negative
Power Consumption Matrix
60
TESTING AND IMPLEMENTATION
Sol-Gel Waveform Verification Original Schematic called out a 5V 1kHz waveform
Previous reports specified a 1.5V 1kHz waveform
Testing demonstrated that with a 2kOhm potentiometer:
1.7V & 2.2V were generated on existing boards
A 5kOhm potentiometer would generate the following voltages:
1.65kOhm – 1.75V, 2.00kOhm – 2.20V, 3.65kOhm – 5.00V
Original Waveform
5V Waveform
2.2V Waveform
2/27/2016
31
61
TESTING AND IMPLEMENTATION CONT.
Sol-Gel Sensor Data Verified
Temperature/Humidity Sensor Data Verified
Barometric Sensor Data Verified
WSN Performance Verification
System Data Analysis
62
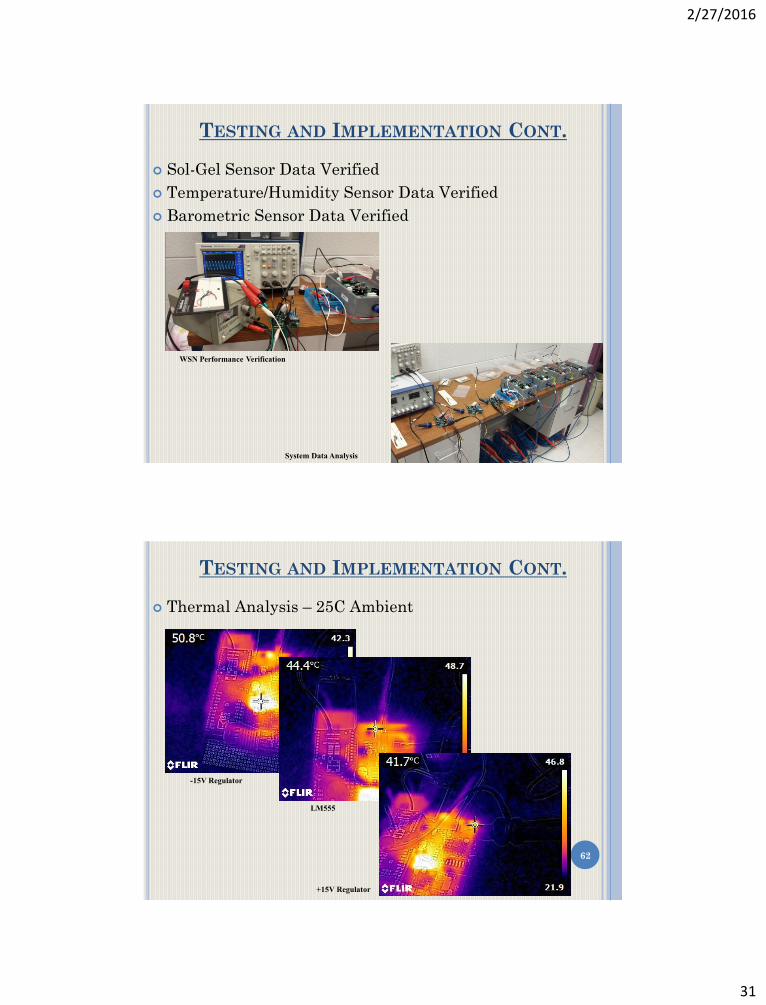
TESTING AND IMPLEMENTATION CONT.
Thermal Analysis – 25C Ambient
-15V Regulator
+15V Regulator
LM555

2/27/2016
32
63
TESTING AND IMPLEMENTATION
Range Testing:
Indoor:
Coordinator placed in ET305, Sensor Node was moved on 1st and 2nd
floor. Within a 25ft radius, data was captured in its entirety
Outdoor:
Coordinator was placed in 1st floor Lobby, Sensor was moved (line of
sight) through various outdoor locations.
Outdoor Range was greater
WSN Performance Verification System Data Analysis
64
NEXT GENERATION RECOMMENDATIONS
Solar Panel Charge System:
Tycon Power Systems TPSHP-12-120: 120W, 17.2V
30W Continuous Power: 10 Sensor Nodes/Panel
XBee Wi-Fi Module + Online Data Storage
XBee Wi-Fi (S6B)
Device Cloud $6/year service charge or
MS Dropbox Online Storage
Maximum Power (+/- 5%) 120W
Voltage at Pmax 17.2V
Current at Pmax 6.98A
Open Circuit Voltage 21.6V
Short Circuit Current 7.72A
Continuous Power 30W
Operating Temperature -40 to +85C
Size 59x26x1.4"
Weight 23 lbs
TPSHP-12-120 Specifications
2/27/2016
33
65
CONCLUSION
The joint venture between Indiana-University Purdue-University Fort Wayne (IPFW) and the Army Construction Engineering Research Laboratory (CERL) has presented the opportunity to develop a corrosion monitoring system using state-of-the-art sol-gel sensors and cylindrical sensors. The Corrosion Monitoring System is capable of monitoring the level/degree of corrosion of steel and steel structures. The project in itself had seen two previous design stages, each of which has improved the sensing capabilities, ranges and overall robustness of the system. The development that has occurred over the last three (3) months has yielded promising results. Key activities have included;
75% reduction of the physical size of each sensor ASP unit,
Single Voltage Power Supply
Modular design (ASP, Arduino FIO and XBee Wireless Transceiver)
Additional sensor capabilities such as; temperature, humidity and barometric pressure
On-Board Lithium-Ion Battery charging system
66
- Demonstration
- Q&A Session