wipro ltd (wipro) | 317content.icicidirect.com/mailimages/idirect_wipro_q2fy19.pdf · citing the...
TRANSCRIPT

October 25, 2018
ICICI Securities Ltd | Retail Equity Research
Result Update
Growth and margin visibility improving...
Wipro reported Q2FY19 results were above our expectations,
excluding one-offs. In constant currency, global IT services revenues
grew 2.8% sequentially (above our estimate of 1.3% QoQ). Adjusted
for one-off settlement of | 514.1 crore, IT services EBIT margin stood
at 18% in Q2FY19 (vs our expectation of 16.1%).
US$ revenues grew 0.7% QoQ to $2041.2 million. However, adjusting
for divestment of its hosted data centre business, dollar revenue
growth was 1.9% sequentially.
Reported EBIT margin stood at 14.4% (from adjusted margin of
15.6% in Q1FY19). Adjusted EBIT margin improved by 240 bps to
18.0% mainly led by rupee depreciation (+70 bps), automation &
productivity improvement (+90 bps) and cost optimisation of global
subsidiaries (+90 bps).
Improving growth across verticals gives better revenue visibility…
After many quarters of company specific headwinds led by client’s
insolvency and restructuring of business, Wipro reported a strong quarter
with 2.8% revenue growth in constant currency. Four verticals out of
seven grew at 4% and more QoQ in cc terms with BFSI reporting 16%
YoY growth. Healthy performance in BFSI for consecutive seventh quarter
and strong growth in digital business are the highlights for the quarter.
Further, incremental positive commentary for healthcare business and
consumer business segment besides BFSI and communications is a key
positive.
….Order bookings and higher digital contribution are key positive
Citing the outlook for Q3FY19E, Wipro guided that its IT services revenues
would be in the range of $2028-2068 million, translating to 1-3% QoQ
growth. This growth expectation is on the basis of excluding India PSU
and India Government business which contributed $34 million in the
quarter. In addition, two-month consolidation of Alight acquisition (~$25
million) would support the growth in Q3FY19E. Further, improving digital
revenues contribution (accounted for 31.4% of services revenue in
Q2FY19 vs 24.1% in Q2FY18) over the coming years will further drive
growth. Strong order bookings, healthy pipeline, and incremental
positives across verticals are expected to lead to accelerated growth in
the year ahead. This coupled with rupee depreciation, we expect IT
services rupee revenues to increase at a CAGR of 10% over FY18-20E.
Margin improvement to boost profitability…
We believe the company’s margins of 18.0% in current quarter are
sustainable in the coming years mainly led by higher automation (from
3% to 10%), healthy revenue growth and rupee depreciation. As a result,
we upgrade our margin estimates and expect IT services EBIT margin of
16.8%, 17.7% in FY19E, FY20E respectively.
On growth trajectory; maintain BUY…
Wipro reported a strong quarter on all fronts. Further, positive guidance in
the wake of seasonal Q3 along with optimistic commentary across most
verticals with continued strength in BFSI and digital prompt us to be
constructive on Wipro’s growth trajectory. This coupled with
sustainability of higher margins in coming quarters will further boost
profitability. Hence, we maintain our BUY recommendation on the stock
with a revised target price of | 360 per share (15x FY20E EPS).
Rating matrix
Rating : Buy
Target : | 360
Target Period : 12 months
Potential Upside : 14%
What’s Changed?
Target Changed from | 325 to | 360
EPS FY19E Changed from | 18.8 to | 20.1
EPS FY20E Changed from | 21.5 to | 23.8
Rating Unchanged
Quarterly Performance
Q2FY19 Q2FY18 YoY (%) Q1FY19 QoQ (%)
Revenue 14,541 13,424 8.3 13,978 4.0
EBIT 2,062 2,305 (10.5) 2,331 (11.6)
EBIT (%) 14.2 17.2 -299 bps 16.7 -250 bps
PAT 1,889 2,191 (13.8) 2,121 (10.9)
Key Financials
| Crore FY17 FY18 FY19E FY20E
Net Sales 55,040 54,636 60,171 65,306
EBITDA 11,458 10,542 11,763 13,361
Net Profit 8,490 8,008 9,088 10,721
EPS (|) 17.5 16.8 20.1 23.8
Valuation summary
FY17 FY18 FY19E FY20E
P/E 18.2 18.8 15.7 13.3
Target P/E 20.5 21.4 17.8 15.1
EV / EBITDA 10.6 12.1 9.9 8.2
P/BV 2.9 3.1 2.5 2.2
RoNW (%) 16.3 16.6 16.2 16.6
RoCE (%) 16.9 16.9 16.9 17.5
Stock data
Particular Amount
Market Capitalization (| Crore) 142,762.7
Total Debt (| Crore) 13,825.9
Cash and Investments (| Crore) 29,525.1
EV (| Crore) 127,063.5
52 week H/L 339 / 253
Equity capital 904.8
Face value | 2
Price performance (%)
1M 3M 6M 12M
TCS (15.4) (6.2) 9.3 43.7
Infosys (9.0) (0.8) 11.8 40.2
Wipro (8.3) 6.7 2.3 2.7
HCL Tech (10.9) (0.5) (8.0) 4.2
Research Analysts
Devang Bhatt
Deepti Tayal
Wipro Ltd (WIPRO) | 317
ICICI Securities Ltd | Retail Equity Research Page 2
Variance analysis
Q2FY19 Q2FY19E Q2FY18 YoY (%) Q1FY19 QoQ (%) Comments
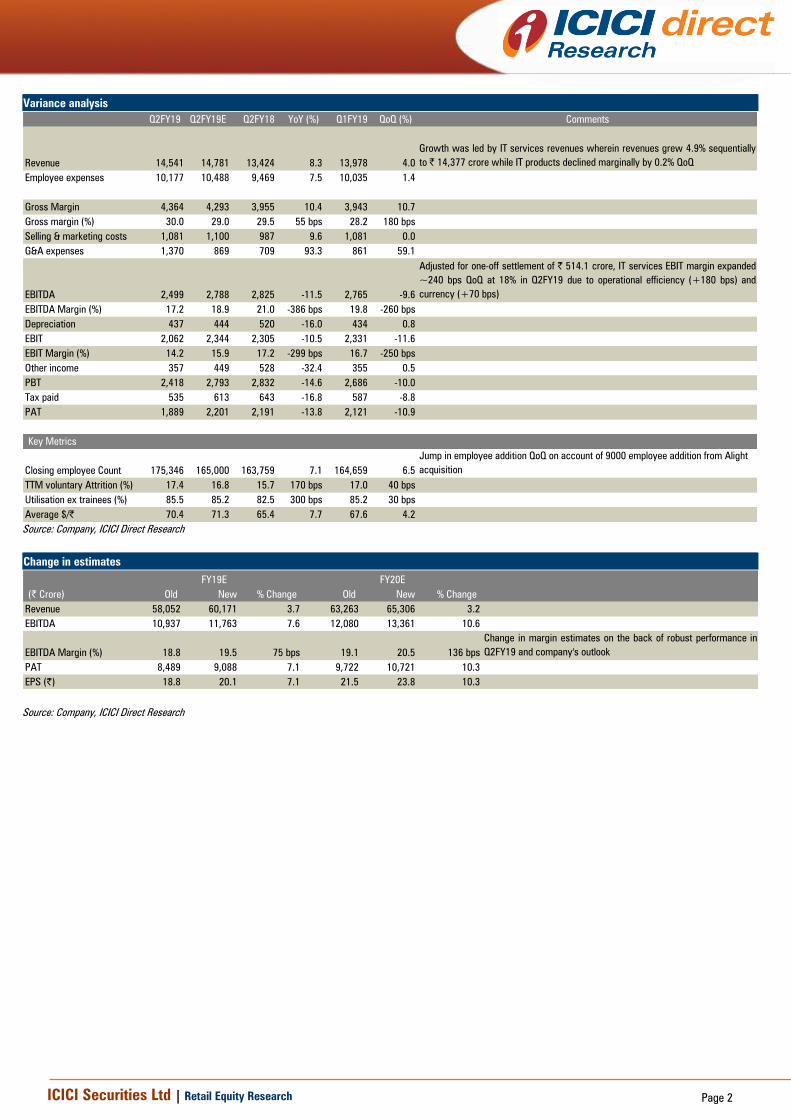
Revenue 14,541 14,781 13,424 8.3 13,978 4.0
Growth was led by IT services revenues wherein revenues grew 4.9% sequentially
to | 14,377 crore while IT products declined marginally by 0.2% QoQ
Employee expenses 10,177 10,488 9,469 7.5 10,035 1.4
Gross Margin 4,364 4,293 3,955 10.4 3,943 10.7
Gross margin (%) 30.0 29.0 29.5 55 bps 28.2 180 bps
Selling & marketing costs 1,081 1,100 987 9.6 1,081 0.0
G&A expenses 1,370 869 709 93.3 861 59.1
EBITDA 2,499 2,788 2,825 -11.5 2,765 -9.6
Adjusted for one-off settlement of | 514.1 crore, IT services EBIT margin expanded
~240 bps QoQ at 18% in Q2FY19 due to operational efficiency (+180 bps) and
currency (+70 bps)
EBITDA Margin (%) 17.2 18.9 21.0 -386 bps 19.8 -260 bps
Depreciation 437 444 520 -16.0 434 0.8
EBIT 2,062 2,344 2,305 -10.5 2,331 -11.6
EBIT Margin (%) 14.2 15.9 17.2 -299 bps 16.7 -250 bps
Other income 357 449 528 -32.4 355 0.5
PBT 2,418 2,793 2,832 -14.6 2,686 -10.0
Tax paid 535 613 643 -16.8 587 -8.8
PAT 1,889 2,201 2,191 -13.8 2,121 -10.9
Key Metrics
Closing employee Count 175,346 165,000 163,759 7.1 164,659 6.5
Jump in employee addition QoQ on account of 9000 employee addition from Alight
acquisition
TTM voluntary Attrition (%) 17.4 16.8 15.7 170 bps 17.0 40 bps
Utilisation ex trainees (%) 85.5 85.2 82.5 300 bps 85.2 30 bps
Average $/| 70.4 71.3 65.4 7.7 67.6 4.2
Source: Company, ICICI Direct Research
Change in estimates
(| Crore) Old New % Change Old New % Change
Revenue 58,052 60,171 3.7 63,263 65,306 3.2
EBITDA 10,937 11,763 7.6 12,080 13,361 10.6
EBITDA Margin (%) 18.8 19.5 75 bps 19.1 20.5 136 bps
Change in margin estimates on the back of robust performance in
Q2FY19 and company's outlook
PAT 8,489 9,088 7.1 9,722 10,721 10.3
EPS (|) 18.8 20.1 7.1 21.5 23.8 10.3
FY19E FY20E
Source: Company, ICICI Direct Research
ICICI Securities Ltd | Retail Equity Research Page 3
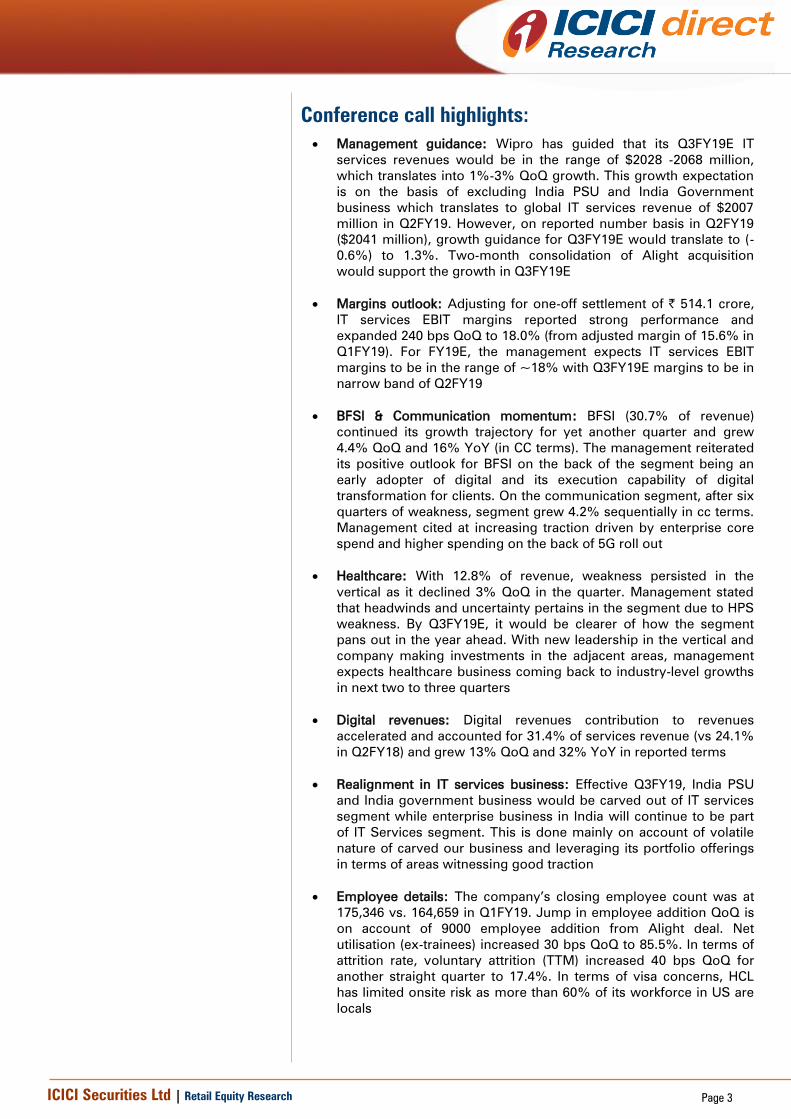
Conference call highlights:
Management guidance: Wipro has guided that its Q3FY19E IT
services revenues would be in the range of $2028 -2068 million,
which translates into 1%-3% QoQ growth. This growth expectation
is on the basis of excluding India PSU and India Government
business which translates to global IT services revenue of $2007
million in Q2FY19. However, on reported number basis in Q2FY19
($2041 million), growth guidance for Q3FY19E would translate to (-
0.6%) to 1.3%. Two-month consolidation of Alight acquisition
would support the growth in Q3FY19E
Margins outlook: Adjusting for one-off settlement of | 514.1 crore,
IT services EBIT margins reported strong performance and
expanded 240 bps QoQ to 18.0% (from adjusted margin of 15.6% in
Q1FY19). For FY19E, the management expects IT services EBIT
margins to be in the range of ~18% with Q3FY19E margins to be in
narrow band of Q2FY19
BFSI & Communication momentum: BFSI (30.7% of revenue)
continued its growth trajectory for yet another quarter and grew
4.4% QoQ and 16% YoY (in CC terms). The management reiterated
its positive outlook for BFSI on the back of the segment being an
early adopter of digital and its execution capability of digital
transformation for clients. On the communication segment, after six
quarters of weakness, segment grew 4.2% sequentially in cc terms.
Management cited at increasing traction driven by enterprise core
spend and higher spending on the back of 5G roll out
Healthcare: With 12.8% of revenue, weakness persisted in the
vertical as it declined 3% QoQ in the quarter. Management stated
that headwinds and uncertainty pertains in the segment due to HPS
weakness. By Q3FY19E, it would be clearer of how the segment
pans out in the year ahead. With new leadership in the vertical and
company making investments in the adjacent areas, management
expects healthcare business coming back to industry-level growths
in next two to three quarters
Digital revenues: Digital revenues contribution to revenues
accelerated and accounted for 31.4% of services revenue (vs 24.1%
in Q2FY18) and grew 13% QoQ and 32% YoY in reported terms
Realignment in IT services business: Effective Q3FY19, India PSU
and India government business would be carved out of IT services
segment while enterprise business in India will continue to be part
of IT Services segment. This is done mainly on account of volatile
nature of carved our business and leveraging its portfolio offerings
in terms of areas witnessing good traction
Employee details: The company’s closing employee count was at
175,346 vs. 164,659 in Q1FY19. Jump in employee addition QoQ is
on account of 9000 employee addition from Alight deal. Net
utilisation (ex-trainees) increased 30 bps QoQ to 85.5%. In terms of
attrition rate, voluntary attrition (TTM) increased 40 bps QoQ for
another straight quarter to 17.4%. In terms of visa concerns, HCL
has limited onsite risk as more than 60% of its workforce in US are
locals
ICICI Securities Ltd | Retail Equity Research Page 4
Company Analysis
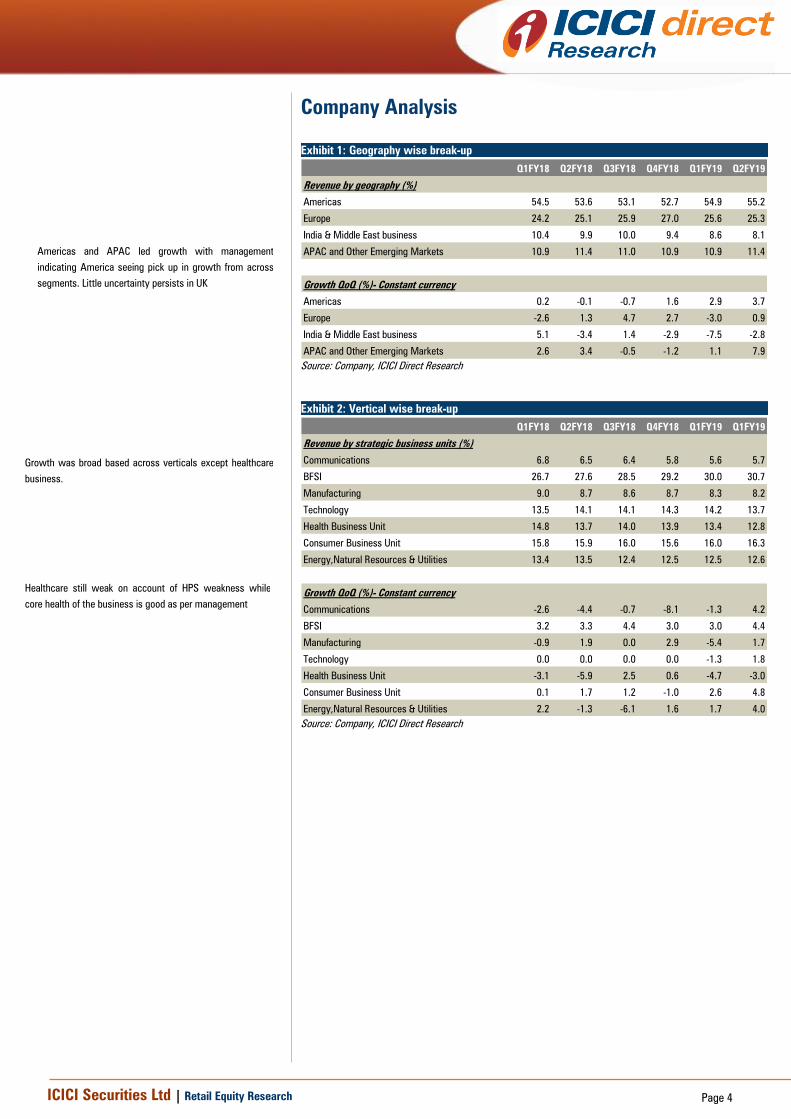
Exhibit 1: Geography wise break-up
Q1FY18 Q2FY18 Q3FY18 Q4FY18 Q1FY19 Q2FY19
Revenue by geography (%)
Americas 54.5 53.6 53.1 52.7 54.9 55.2
Europe 24.2 25.1 25.9 27.0 25.6 25.3
India & Middle East business 10.4 9.9 10.0 9.4 8.6 8.1
APAC and Other Emerging Markets 10.9 11.4 11.0 10.9 10.9 11.4
Growth QoQ (%)- Constant currency
Americas 0.2 -0.1 -0.7 1.6 2.9 3.7
Europe -2.6 1.3 4.7 2.7 -3.0 0.9
India & Middle East business 5.1 -3.4 1.4 -2.9 -7.5 -2.8
APAC and Other Emerging Markets 2.6 3.4 -0.5 -1.2 1.1 7.9
Source: Company, ICICI Direct Research
Exhibit 2: Vertical wise break-up
Q1FY18 Q2FY18 Q3FY18 Q4FY18 Q1FY19 Q1FY19
Revenue by strategic business units (%)
Communications 6.8 6.5 6.4 5.8 5.6 5.7
BFSI 26.7 27.6 28.5 29.2 30.0 30.7
Manufacturing 9.0 8.7 8.6 8.7 8.3 8.2
Technology 13.5 14.1 14.1 14.3 14.2 13.7
Health Business Unit 14.8 13.7 14.0 13.9 13.4 12.8
Consumer Business Unit 15.8 15.9 16.0 15.6 16.0 16.3
Energy,Natural Resources & Utilities 13.4 13.5 12.4 12.5 12.5 12.6
Growth QoQ (%)- Constant currency
Communications -2.6 -4.4 -0.7 -8.1 -1.3 4.2
BFSI 3.2 3.3 4.4 3.0 3.0 4.4
Manufacturing -0.9 1.9 0.0 2.9 -5.4 1.7
Technology 0.0 0.0 0.0 0.0 -1.3 1.8
Health Business Unit -3.1 -5.9 2.5 0.6 -4.7 -3.0
Consumer Business Unit 0.1 1.7 1.2 -1.0 2.6 4.8
Energy,Natural Resources & Utilities 2.2 -1.3 -6.1 1.6 1.7 4.0
Source: Company, ICICI Direct Research
Americas and APAC led growth with management
indicating America seeing pick up in growth from across
segments. Little uncertainty persists in UK
Growth was broad based across verticals except healthcare
business.
Healthcare still weak on account of HPS weakness while
core health of the business is good as per management

ICICI Securities Ltd | Retail Equity Research Page 5
Exhibit 3: Service line wise break-up
Q1FY18 Q2FY18 Q3FY18 Q4FY18 Q1FY19 Q1FY19
Revenue by service lines (%)
Cloud Infrastructure Services 28.1 28.4 28.2 28.8 27.4 26.5
Data, Analytics & AI 7.1 7.1 7.0 7.0 7.1 7.8
Digital operations and Platforms 12.0 12.1 12.6 12.1 12.1 12.7
Industrial & Engineering Services 7.0 6.9 6.9 7.3 7.3 7.3
Modern Application Services 45.8 45.5 45.3 44.8 46.1 45.7
Growth QoQ (%)- Constant currency
Cloud Infrastructure Services 0.2 1.5 0.4 3.4 -4.6 2.6
Data, Analytics & AI 3.6 -1.3 -0.4 1.7 1.5 11.1
Digital operations and Platforms -1.6 1.7 4.7 -2.5 -0.6 6.2
Industrial & Engineering Services -1.8 1.2 -0.3 7.4 -1.1 1.9
Modern Application Services 0.6 -0.8 0.6 -0.3 3.3 1.0
Source: Company, ICICI Direct Research
Exhibit 4: Client & human resource metrics
Q1FY18 Q2FY18 Q3FY18 Q4FY18 Q1FY19 Q1FY19
Client metrics
$1 mn Clients 624 627 635 631 624 612
$10 mn Clients 163 170 167 171 173 180
$50 mn Clients 36 39 41 39 40 39
$75 mn Clients 18 16 17 20 19 19
$100 mn Clients 9 9 9 8 8 9
Headcount, Utilization & Attrition
Closing employee count 166790 163759 162553 163827 164659 175346
Net Utilization (Excluding trainees) 82.1 82.5 81.9 83.4 85.2 85.5
Voluntary Attrition LTM 15.9 15.7 15.9 16.6 17.0 17.4
Source: Company, ICICI Direct Research
Growth was broad based among service lines.
Management indicated that pipeline looking strong for
cloud migration
Net utilisation (ex-trainees) expanded 30 bps QoQ to
85.5%, multi quarter high
In terms of client engagements, clients contributing
>$100 million category increased by one to 9

ICICI Securities Ltd | Retail Equity Research Page 6
Financial story in charts
Exhibit 5: Digital contribution trend
19.6
21.7 22.1 22.524.1
25.026.7
28.0
31.4
11.29.9
4.6
2.7
9.4
3.7
9.4
3.1
13.0
0.0
10.0
20.0
30.0
40.0
Q2FY17 Q3FY17 Q4FY17 Q1FY18 Q2FY18 Q3FY18 Q4FY18 Q1FY19 Q2FY19
%
Digital as a % of revenue Growth, QoQ
Source: Company, ICICI Direct Research
Exhibit 6: Dollar revenues may grow at 4.9% CAGR in FY18-20E
70
82
73
46
19
31
19
16
19
03
19
55
20
62
20
27
20
41
82
63
88
61
77
04
19
71
20
14
20
13
80
60
7.6
5.8
1.4
2.5
7.27.0
3.7
4.6
3.5
3.94.9
2.15.1
5.5
4.6
2.8
1000
4000
7000
10000
FY
15
FY
16
Q1
FY
17
Q2
FY
17
Q3
FY
17
Q4
FY
17
FY
17
Q1
FY
18
Q2
FY
18
Q3
FY
18
Q4
FY
18
FY
18
Q1
FY
19
Q2
FY
19
FY
19
E
FY
20
E
$ m
illion
0
10
20
%
Dollar revenue Growth, YoY
[
Source: Company, ICICI Direct Research
Digital revenues now account for 31.4% of services
revenue (vs 24.1% in Q2FY18) and grew strongly by
13% sequentially and 32% YoY

ICICI Securities Ltd | Retail Equity Research Page 7
Exhibit 7: Barring one-off, IT services margin expanded 240 bps to 18%
22.1
20.5
17.8 17.818.3
17.617.9
16.817.3
14.814.4
15.8
17.5
14.4
16.8
17.7
12
15
18
21
24
FY
15
FY
16
Q1
FY
17
Q2
FY
17
Q3
FY
17
Q4
FY
17
FY
17
Q1
FY
18
Q2
FY
18
Q3
FY
18
Q4
FY
18
FY
18
Q1
FY
19
Q2
FY
19
FY
19
E
FY
20
E
%EBIT margin (IT services)
Source: Company, ICICI Direct Research
Exhibit 8: PAT may grow at 15.7% CAGR in FY18-20E
86538886
2052 2067 2168 2261
8490
2076 21911937 1803
8008
21211889
9088
10721
1000
4000
7000
10000
FY
15
FY
16
Q1
FY
17
Q2
FY
17
Q3
FY
17
Q4
FY
17
FY
17
Q1
FY
18
Q2
FY
18
Q3
FY
18
Q4
FY
18
FY
18
Q1
FY
19
Q2
FY
19
FY
19
E
FY
20
E
| c
rore
PAT
Source: Company, ICICI Direct Research
ICICI Securities Ltd | Retail Equity Research Page 8
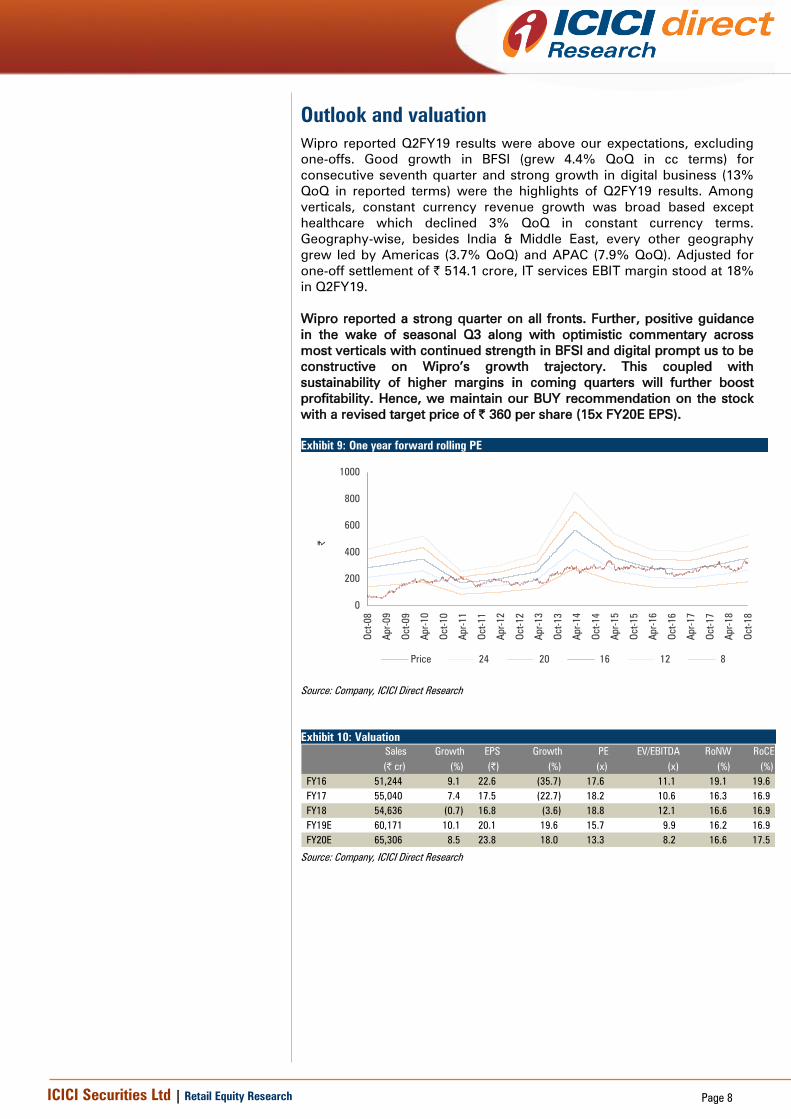
Outlook and valuation
Wipro reported Q2FY19 results were above our expectations, excluding
one-offs. Good growth in BFSI (grew 4.4% QoQ in cc terms) for
consecutive seventh quarter and strong growth in digital business (13%
QoQ in reported terms) were the highlights of Q2FY19 results. Among
verticals, constant currency revenue growth was broad based except
healthcare which declined 3% QoQ in constant currency terms.
Geography-wise, besides India & Middle East, every other geography
grew led by Americas (3.7% QoQ) and APAC (7.9% QoQ). Adjusted for
one-off settlement of | 514.1 crore, IT services EBIT margin stood at 18%
in Q2FY19.
Wipro reported a strong quarter on all fronts. Further, positive guidance
in the wake of seasonal Q3 along with optimistic commentary across
most verticals with continued strength in BFSI and digital prompt us to be
constructive on Wipro’s growth trajectory. This coupled with
sustainability of higher margins in coming quarters will further boost
profitability. Hence, we maintain our BUY recommendation on the stock
with a revised target price of | 360 per share (15x FY20E EPS).
Exhibit 9: One year forward rolling PE
0
200
400
600
800
1000
Oct-0
8
Ap
r-0
9
Oct-0
9
Ap
r-1
0
Oct-1
0
Ap
r-1
1
Oct-1
1
Ap
r-1
2
Oct-1
2
Ap
r-1
3
Oct-1
3
Ap
r-1
4
Oct-1
4
Ap
r-1
5
Oct-1
5
Ap
r-1
6
Oct-1
6
Ap
r-1
7
Oct-1
7
Ap
r-1
8
Oct-1
8
|
Price 24 20 16 12 8
Source: Company, ICICI Direct Research
Exhibit 10: Valuation
Sales Growth EPS Growth PE EV/EBITDA RoNW RoCE
(| cr) (%) (|) (%) (x) (x) (%) (%)
FY16 51,244 9.1 22.6 (35.7) 17.6 11.1 19.1 19.6
FY17 55,040 7.4 17.5 (22.7) 18.2 10.6 16.3 16.9
FY18 54,636 (0.7) 16.8 (3.6) 18.8 12.1 16.6 16.9
FY19E 60,171 10.1 20.1 19.6 15.7 9.9 16.2 16.9
FY20E 65,306 8.5 23.8 18.0 13.3 8.2 16.6 17.5
Source: Company, ICICI Direct Research

ICICI Securities Ltd | Retail Equity Research Page 9
Recommendation History vs. Consensus
0
200
400
600
800
1,000
Oct-
18
Sep-
18
Jul-
18
Jun-
18
Apr-
18
Feb-
18
Jan-
18
Nov-
17
Oct-
17
Aug-
17
Jul-
17
May-
17
Apr-
17
Feb-
17
Jan-
17
Nov-
16
Sep-
16
Aug-
16
Jun-
16
May-
16
Mar-
16
Feb-
16
Dec-
15
Nov-
15
Sep-
15
(|
)
0.0
20.0
40.0
60.0
80.0
100.0
(%
)
Price Idirect target Consensus Target Mean % Consensus with SELL
Source: Bloomberg, Company, ICICI Direct Research
Key events
Date Event
Sep-17
Wipro wins a five year IT applications management contract from Outokumpu, global leader in stainless steel. Wipro would provide applications management services
for Outokumpu SAP landscape along with legacy applications support
Sep-17 Wipro bags a seven year contract from European energy company, innogy SE to manage the data centre and cloud services
Sep-17
Wipro enters into a partnership with CloudGenix, a leading provider of Software defined Wide Area Networking (SD-WAN) products. Under the partnership, Wipro
would offer its customers end to end managed WAN services.
Oct-17
Wipro Digital signs a definitive agreement to acquire Cooper, design and business strategy consultancy. Wipro Digital is the digital business unit of Wipro. Acquisition
is expected to be closed in Q3FY18.
Mar-18 Wipro announces it would pay $8.8 million for a 33% stake in application security company Denim Group, to boost its cybersecurity offerings to clients
Apr-18
Wipro sells 63% of its stake in Wipro Airport IT to Antariksh Softtech for a consideration of ₹ 3.15 crore. Wipro Airport IT Services is a joint venture between Wipro
(74%) and Delhi International Airport Limited (DIAL) (26%).
Jun-18
Wipro selected by Nokia to accelerate its supply chain digital transformation. Wipro would help design, digitalise and run Nokia's sales order management operations
from multiple centres, globally. Financial details of the deal were undisclosed
Aug-18
Wipro has entered into a settlement of the lawsuit filed by National Grid US for $75 million (~| 500 crore). The lawsuit was filed by National Grid US in 2017 seeking
damages amounting to US$ 140 million plus additional costs related to an ERP implementation project.
Aug-18
Wipro has been awarded a multi-year business process services contract from Denmark based Falck, a leading international supplier of ambulance services, employee
health care and roadside assistance. Falck is active in 35 countries and has over 37,000 employees. As part of the contract, Wipro will help transform Falck’s finance
operations through its enterprise operations transformation model
Source: Company, ICICI Direct Research
Top 10 Shareholders Shareholding Pattern
Rank Name Latest Filing Date % O/S Position (m) Change (m)
1 Premji (Azim Hasham) 30-Jun-18 60.5% 2,722.8 0.0
2 Azim Premji Trust 30-Jun-18 13.7% 618.5 0.0
3 Life Insurance Corporation of India 30-Jun-18 3.1% 138.7 0.0
4 ICICI Prudential Asset Management Co. Ltd. 30-Jun-18 2.0% 90.0 7.6
5 Stewart Investors 20-Dec-17 1.3% 57.8 -4.0
6 BlackRock Institutional Trust Company, N.A. 30-Sep-18 0.9% 42.0 0.8
7 The Vanguard Group, Inc. 30-Sep-18 0.5% 24.1 -0.1
8 Norges Bank Investment Management (NBIM) 31-Dec-17 0.4% 19.5 4.2
9 Dimensional Fund Advisors, L.P. 30-Sep-18 0.4% 17.7 0.0
10 SBI Funds Management Pvt. Ltd. 30-Sep-18 0.4% 16.4 -0.9
(in %) Mar-18 Jun-18 Sep-18
Promoter 74.32 74.31 74.31
Public 25.17 25.19 25.21
Others 0.51 0.49 0.48
Total 100.00 100.00 100.00
Source: Reuters, ICICI Direct Research
Recent Activity
Investor name Value Shares Investor name Value Shares
ICICI Prudential Asset Management Co. Ltd. 28.9m 7.6m T. Rowe Price International (UK) Ltd. -41.1m -9.2m
Mirae Asset Global Investments (India) Pvt. Ltd. 7.4m 1.7m T. Rowe Price Hong Kong Limited -20.8m -4.7m
Reliance Nippon Life Asset Management Limited 5.9m 1.3m Kotak Mahindra Asset Management Company Ltd. -11.7m -2.8m
UTI Asset Management Co. Ltd. 4.7m 1.0m SBI Funds Management Pvt. Ltd. -4.2m -0.9m
BlackRock Institutional Trust Company, N.A. 3.6m 0.8m IDFC Asset Management Company Private Limited -3.9m -0.9m
Buys Sells
Source: Reuters, ICICI Direct Research

ICICI Securities Ltd | Retail Equity Research Page 10
.
Financial summary
Profit and loss statement | Crore
FY17 FY18 FY19E FY20E
Total Revenues 55,040 54,636 60,171 65,306
Growth (%) 7.4 (0.7) 10.1 8.5
COGS 39,154 38,558 41,738 45,305
Other Expenditure 5,214 5,537 6,703 6,672
EBITDA 11,458 10,542 11,763 13,361
Growth (%) 2.6 (8.0) 11.6 13.6
Depreciation 2,070 2,112 1,805 1,959
Other Income 2,242 2,400 2,294 2,941
Exchange difference 28 - - -
Net interest expense (594) (583) (636) (636)
Pft. from associates - 1 (3) (3)
PBT 11,036 10,247 11,613 13,704
Growth (%) (3.8) (7.1) 13.3 18.0
Tax 2,521 2,239 2,555 3,015
PAT before Minority int, 8,514 8,008 9,058 10,689
Minority int. 25 0 (30) (32)
PAT 8,490 8,008 9,088 10,721
EPS 17.5 16.8 20.1 23.8
EPS (Growth %) (22.7) (3.6) 19.6 18.0
Source: Company, ICICI Direct Research
Cash flow statement | Crore
FY17 FY18 FY19E FY20E
PAT before minority int. 8,514 8,008 9,058 10,689
Depreciation 2,311 2,112 1,805 1,959
(inc)/dec in Current Assets 1,269 (717) 688 (1,802)
(inc)/dec in current Liabilities (815) 623 1,500 1,900
Taxes paid (2,548) (2,811) (2,555) (3,015)
CF from operations 9,277 8,423 11,396 10,445
Other Investments (10,014) 5,628 2,294 5,234
(Purchase)/Sale of Fixed Assets (1,965) (2,070) 85 (2,482)
CF from investing Activities (11,628) 3,558 2,379 459
Inc / (Dec) in Equity Capital - 2 - -
Inc / (Dec) in sec.loan Funds 1,312 (1,098) - -
Dividend & Divendend tax (1,073) (854) (1,999) (4,779)
CF from Financial Activities (2,275) (12,998) (1,999) (2,780)
Exchange rate differences (141) 38 - -
Opening cash balance 9,905 5,271 4,493 16,268
Closing cash 5,271 4,493 16,268 24,392
Source: Company, ICICI Direct Research
Balance sheet | Crore
FY17 FY18 FY19E FY20E
Liabilities
Equity 486 905 905 905
Reserves & Surplus 51,544 47,389 55,114 63,690
Networth 52,030 48,294 56,019 64,595
Minority Interest 239 241 211 179
Debt - long term 1,961 4,527 4,527 4,527
Debt - short term 12,280 9,299 10,269 11,146
Deffered Tax Liability 661 306 306 306
Other liabilities & provisions 1,505 1,346 1,354 1,354
Source of funds 68,677 64,012 72,686 82,107
Assets
Goodwill 12,580 11,758 11,758 11,758
Intangible Assets 1,592 1,811 1,679 1,716
PPE 6,979 6,444 4,687 5,172
O.non current assets 3,201 4,102 4,102 4,102
Investments 710 887 884 881
Debtors 9,884 10,544 11,547 12,608
Cash & Cash equivalents 5,271 4,493 16,268 24,392
Investments - short term 30,178 25,033 25,033 25,033
O.current assets 8,957 10,992 9,300 10,041
Trade Payable 6,549 6,813 7,595 8,293
OCL & Provisions 4,126 5,239 4,978 5,303
Application of funds 68,677 64,012 72,686 82,107
Source: Company, ICICI Direct Research
Key ratios
FY17 FY18 FY19E FY20E
Per share data (|)
EPS 17.5 16.8 20.1 23.8
BV 107.0 101.5 124.1 143.1
DPS 2.0 2.0 2.0 2.0
Operating Ratios
EBIT Margin 17.1 15.4 16.5 17.5
PAT Margin 15.4 14.7 15.1 16.4
Debtor days 66 70 70 70
Creditor days 43 46 46 46
Return Ratios (%)
RoE 16.3 16.6 16.2 16.6
RoCE 16.9 16.9 16.9 17.5
RoIC 28.3 24.4 31.7 34.9
Valuation Ratios (x)
P/E 18.2 18.8 15.7 13.3
EV / EBITDA 10.6 12.1 9.9 8.2
EV / Net Sales 2.2 2.3 1.9 1.7
Market Cap / Sales 2.6 2.6 2.4 2.2
Price to Book Value 2.9 3.1 2.5 2.2
Solvency Ratios
Debt/EBITDA 1.2 1.3 1.3 1.2
Debt / Equity 0.3 0.3 0.3 0.2
Current Ratio 1.8 1.8 1.7 1.7
Quick Ratio 1.8 1.8 1.7 1.7
Source: Company, ICICI Direct Research
ICICI Securities Ltd | Retail Equity Research Page 11
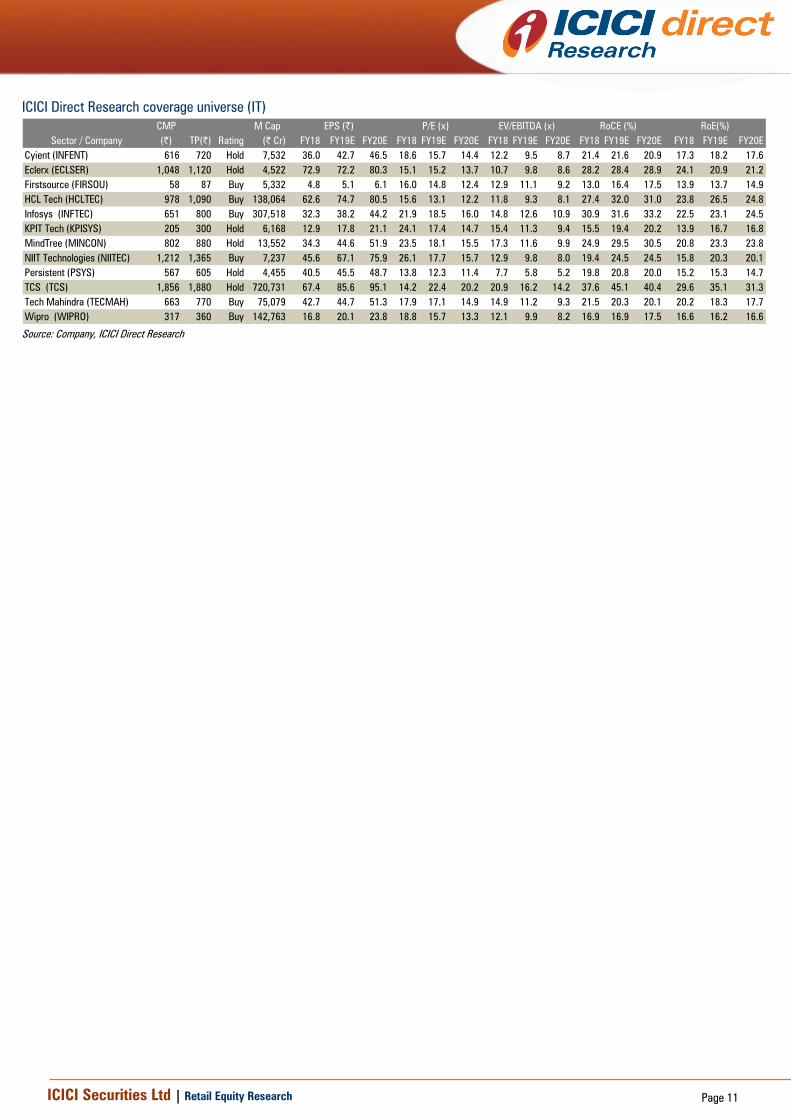
ICICI Direct Research coverage universe (IT)
CMP M Cap
(|) TP(|) Rating (| Cr) FY18 FY19E FY20E FY18 FY19E FY20E FY18 FY19E FY20E FY18 FY19E FY20E FY18 FY19E FY20E
Cyient (INFENT) 616 720 Hold 7,532 36.0 42.7 46.5 18.6 15.7 14.4 12.2 9.5 8.7 21.4 21.6 20.9 17.3 18.2 17.6
Eclerx (ECLSER) 1,048 1,120 Hold 4,522 72.9 72.2 80.3 15.1 15.2 13.7 10.7 9.8 8.6 28.2 28.4 28.9 24.1 20.9 21.2
Firstsource (FIRSOU) 58 87 Buy 5,332 4.8 5.1 6.1 16.0 14.8 12.4 12.9 11.1 9.2 13.0 16.4 17.5 13.9 13.7 14.9
HCL Tech (HCLTEC) 978 1,090 Buy 138,064 62.6 74.7 80.5 15.6 13.1 12.2 11.8 9.3 8.1 27.4 32.0 31.0 23.8 26.5 24.8
Infosys (INFTEC) 651 800 Buy 307,518 32.3 38.2 44.2 21.9 18.5 16.0 14.8 12.6 10.9 30.9 31.6 33.2 22.5 23.1 24.5
KPIT Tech (KPISYS) 205 300 Hold 6,168 12.9 17.8 21.1 24.1 17.4 14.7 15.4 11.3 9.4 15.5 19.4 20.2 13.9 16.7 16.8
MindTree (MINCON) 802 880 Hold 13,552 34.3 44.6 51.9 23.5 18.1 15.5 17.3 11.6 9.9 24.9 29.5 30.5 20.8 23.3 23.8
NIIT Technologies (NIITEC) 1,212 1,365 Buy 7,237 45.6 67.1 75.9 26.1 17.7 15.7 12.9 9.8 8.0 19.4 24.5 24.5 15.8 20.3 20.1
Persistent (PSYS) 567 605 Hold 4,455 40.5 45.5 48.7 13.8 12.3 11.4 7.7 5.8 5.2 19.8 20.8 20.0 15.2 15.3 14.7
TCS (TCS) 1,856 1,880 Hold 720,731 67.4 85.6 95.1 14.2 22.4 20.2 20.9 16.2 14.2 37.6 45.1 40.4 29.6 35.1 31.3
Tech Mahindra (TECMAH) 663 770 Buy 75,079 42.7 44.7 51.3 17.9 17.1 14.9 14.9 11.2 9.3 21.5 20.3 20.1 20.2 18.3 17.7
Wipro (WIPRO) 317 360 Buy 142,763 16.8 20.1 23.8 18.8 15.7 13.3 12.1 9.9 8.2 16.9 16.9 17.5 16.6 16.2 16.6
EV/EBITDA (x)P/E (x)
Sector / Company
RoE(%)RoCE (%)EPS (|)
Source: Company, ICICI Direct Research

ICICI Securities Ltd | Retail Equity Research Page 12
RATING RATIONALE
ICICI Direct Research endeavours to provide objective opinions and recommendations. ICICI Direct Research
assigns ratings to its stocks according to their notional target price vs. current market price and then
categorises them as Strong Buy, Buy, Hold and Sell. The performance horizon is two years unless specified and
the notional target price is defined as the analysts' valuation for a stock.
Strong Buy: >15%/20% for large caps/midcaps, respectively, with high conviction;
Buy: >10%/15% for large caps/midcaps, respectively;
Hold: Up to +/-10%;
Sell: -10% or more;
Pankaj Pandey Head – Research [email protected]
ICICI Direct Research Desk,
ICICI Securities Limited,
1st Floor, Akruti Trade Centre,
Road No 7, MIDC,
Andheri (East)
Mumbai – 400 093
ICICI Securities Ltd | Retail Equity Research Page 13
ANALYST CERTIFICATION
We /I, Devang Bhatt, PGDBM, Deepti Tayal, MBA, Research Analysts, authors and the names subscribed to this report, hereby certify that all of the views expressed in this research report accurately reflect
our views about the subject issuer(s) or securities. We also certify that no part of our compensation was, is, or will be directly or indirectly related to the specific recommendation(s) or view(s) in this report.
Terms & conditions and other disclosures:
ICICI Securities Limited (ICICI Securities) is a full-service, integrated investment banking and is, inter alia, engaged in the business of stock brokering and distribution of financial products. ICICI Securities
Limited is a Sebi registered Research Analyst with Sebi Registration Number – INH000000990. ICICI Securities Limited Sebi Registration is INZ000183631 for stock broker. ICICI Securities is a wholly-owned
subsidiary of ICICI Bank which is India’s largest private sector bank and has its various subsidiaries engaged in businesses of housing finance, asset management, life insurance, general insurance, venture
capital fund management, etc. (“associates”), the details in respect of which are available on www.icicibank.com.
ICICI Securities is one of the leading merchant bankers/ underwriters of securities and participate in virtually all securities trading markets in India. We and our associates might have investment banking
and other business relationship with a significant percentage of companies covered by our Investment Research Department. ICICI Securities generally prohibits its analysts, persons reporting to analysts
and their relatives from maintaining a financial interest in the securities or derivatives of any companies that the analysts cover.
The information and opinions in this report have been prepared by ICICI Securities and are subject to change without any notice. The report and information contained herein is strictly confidential and
meant solely for the selected recipient and may not be altered in any way, transmitted to, copied or distributed, in part or in whole, to any other person or to the media or reproduced in any form, without
prior written consent of ICICI Securities. While we would endeavour to update the information herein on a reasonable basis, ICICI Securities is under no obligation to update or keep the information current.
Also, there may be regulatory, compliance or other reasons that may prevent ICICI Securities from doing so. Non-rated securities indicate that rating on a particular security has been suspended
temporarily and such suspension is in compliance with applicable regulations and/or ICICI Securities policies, in circumstances where ICICI Securities might be acting in an advisory capacity to this
company, or in certain other circumstances.
This report is based on information obtained from public sources and sources believed to be reliable, but no independent verification has been made nor is its accuracy or completeness guaranteed. This
report and information herein is solely for informational purpose and shall not be used or considered as an offer document or solicitation of offer to buy or sell or subscribe for securities or other financial
instruments. Though disseminated to all the customers simultaneously, not all customers may receive this report at the same time. ICICI Securities will not treat recipients as customers by virtue of their
receiving this report. Nothing in this report constitutes investment, legal, accounting and tax advice or a representation that any investment or strategy is suitable or appropriate to your specific
circumstances. The securities discussed and opinions expressed in this report may not be suitable for all investors, who must make their own investment decisions, based on their own investment
objectives, financial positions and needs of specific recipient. This may not be taken in substitution for the exercise of independent judgment by any recipient. The recipient should independently evaluate
the investment risks. The value and return on investment may vary because of changes in interest rates, foreign exchange rates or any other reason. ICICI Securities accepts no liabilities whatsoever for any
loss or damage of any kind arising out of the use of this report. Past performance is not necessarily a guide to future performance. Investors are advised to see Risk Disclosure Document to understand the
risks associated before investing in the securities markets. Actual results may differ materially from those set forth in projections. Forward-looking statements are not predictions and may be subject to
change without notice.
ICICI Securities or its associates might have managed or co-managed public offering of securities for the subject company or might have been mandated by the subject company for any other assignment
in the past twelve months.
ICICI Securities or its associates might have received any compensation from the companies mentioned in the report during the period preceding twelve months from the date of this report for services in
respect of managing or co-managing public offerings, corporate finance, investment banking or merchant banking, brokerage services or other advisory service in a merger or specific transaction.
ICICI Securities or its associates might have received any compensation for products or services other than investment banking or merchant banking or brokerage services from the companies mentioned
in the report in the past twelve months.
ICICI Securities encourages independence in research report preparation and strives to minimize conflict in preparation of research report. ICICI Securities or its associates or its analysts did not receive any
compensation or other benefits from the companies mentioned in the report or third party in connection with preparation of the research report. Accordingly, neither ICICI Securities nor Research Analysts
and their relatives have any material conflict of interest at the time of publication of this report.
It is confirmed that Devang Bhatt, PGDBM, Deepti Tayal, MBA, Research Analysts of this report have not received any compensation from the companies mentioned in the report in the preceding twelve
months.
Compensation of our Research Analysts is not based on any specific merchant banking, investment banking or brokerage service transactions.
ICICI Securities or its subsidiaries collectively or Research Analysts or their relatives do not own 1% or more of the equity securities of the Company mentioned in the report as of the last day of the month
preceding the publication of the research report.
Since associates of ICICI Securities are engaged in various financial service businesses, they might have financial interests or beneficial ownership in various companies including the subject
company/companies mentioned in this report.
It is confirmed that Devang Bhatt, PGDBM, Deepti Tayal, MBA, Research Analysts do not serve as an officer, director or employee of the companies mentioned in the report.
ICICI Securities may have issued other reports that are inconsistent with and reach different conclusion from the information presented in this report.
Neither the Research Analysts nor ICICI Securities have been engaged in market making activity for the companies mentioned in the report.
We submit that no material disciplinary action has been taken on ICICI Securities by any Regulatory Authority impacting Equity Research Analysis activities.
This report is not directed or intended for distribution to, or use by, any person or entity who is a citizen or resident of or located in any locality, state, country or other jurisdiction, where such distribution,
publication, availability or use would be contrary to law, regulation or which would subject ICICI Securities and affiliates to any registration or licensing requirement within such jurisdiction. The securities
described herein may or may not be eligible for sale in all jurisdictions or to certain category of investors. Persons in whose possession this document may come are required to inform themselves of and
to observe such restriction.