wind powerwind energy itself is not new - water and wind mills powered the world’s first...
TRANSCRIPT

Wind Power Generation Technology - NTPC Distributed Generation Page 1 of 15
WWIINNDD PPOOWWEERR Wind energy itself is not new - water and wind mills powered the world’s first industries over 2000 years ago. Now, with new technology and new materials, modern wind turbines are being used to generate the clean electricity for all types of needs. Wind power generation is a proven technology and its use is increasing. Already over 61,000 turbines aggregating 32000MW are producing electricity world-wide. Most are operating in ‘wind-farms’, groups of wind turbines generating electricity on a significant scale. Single wind turbines are also being used for generating electricity, charging batteries and for driving pumps and producing heat. The generation costs are comparable with or lesser than conventional sources of power generation, which is the main thrust behind the increasing popularity of wind power. 1.0 Wind power Generation Technology
Power is available from the kinetic energy of the mass of air moving in wind. The amount of energy that wind carries increases by a factor of two as its speed increases and is proportional to the mass of air that passes through the plane of the area swept by the rotors. As power is the product of energy (work) within a given time frame, the power of wind increases by a factor of three as the speed of wind increases. Because of the low density of air (Pair=1.25 kg / m3), the power density of wind is much lower than that of water power (Pwater=1000 kg / m3), for instance. The power that can be harvested from wind is calculated in terms of the swept area -- for a horizontal axis wind turbine (HAWT), the area through which the rotor blades pass. As a result, if the diameter of the rotor blades is doubled, the power increases by a factor of four. If the wind speed then doubles, power increases by a factor of eight.
In 1920, Albert Betz demonstrated in his theory of the closed stream tube that a wind turbine can only convert a maximum of 16/27 or 59% of the energy in wind into electricity. This optimum performance cP is attained when a wind turbine's rotors slow the wind down by one third.
Current wind turbines convert up to 50% of energy in wind into electricity, thus coming very close to the theoretical limit.
Like some of these simple turbines with small output (up to 2 kW), historic windmills operate according to the principle of resistance. Here, a rotor with a vertical axis resists the wind, thus reducing wind speed. The maximum performance of such wind turbines is 12%. The performance of wind turbines based on the principle of lift is much greater at around 50% due to the relatively high lift-to-drag ratio.
The power coefficient (performance) of a wind turbine can be improved by optimizing the tip speed ratio (lambda), i.e. the ratio of wind velocity to the velocity of the tip of the rotor blade. If the tip speed ratio = 1, the rotor has many blades, generates great torque, and runs at slow speeds. If the tip speed ratio is higher, the rotor has few blades, generates less torque, and runs at higher velocity.
The performance of a rotor is not, however, relative to the number of rotor blades in principle Wind turbines normally have four sections:

1. The rotor - There are two or three blades on the rotor of most modern turbines. The shape of the turbine blade is designed so that when air passes over it, the rotor to which it is attached, turns. Typical wind turbines for generating electricity will have two or three blades each about 10 to 30m long and have tower heights of between 25 and 80m.
2. The turbine head (or “nacelle”) - The rotor is linked by a shaft directly to the nacelle which contains a gear-box and a generator. The turning blades drive the shaft which rotates the generator and produces electricity.
3. The tower - This supports the nacelle and rotor. The electricity produced by the generator comes down cables inside the tower and passes through a transformer into the electricity network.
4. The base - Large turbines are built on a concrete base foundation. When a wind turbine ceases production, it is a simple task to dig these out or cover them, leaving little trace behind.
Almost all wind turbines producing electricity consist of rotor blades which rotate around a horizontal hub. The hub is connected to a gearbox and generator, which are located inside the nacelle. The nacelle houses the electrical components and is mounted at the top of the tower. This type of turbine is referred to as a ‘horizontal axis’ machine. Wind turbine components
− Rotor diameters range up to 65 metres. Smaller machines (around 30 meters) are typical in developing countries.
− Wind turbines can have three, two or just one rotor blades. Most have three. − Blades are made of glassfibre reinforced polyester (GRP) or Wood-Epoxy. − Most machines operate at a constant speed between 15-50 revolutions per minute,
although some advanced designs operate at a variable speed. − Power is controlled automatically as wind speed changes. Turbines are stopped at very
high wind speeds to protect them from damage. − Most have gearboxes although there are increasing numbers with direct drive. − The yaw mechanism turns the turbine so that it faces the wind. Sensors are used to
monitor wind direction and the tower head is turned to line up with the wind. − Towers are mostly tubular and made of steel. Lattice towers are used in some
locations. Towers range from 25 to 80 meters in height. Wind Power Generation Technology - NTPC Distributed Generation Page 2 of 15

Wind Power Generation Technology - NTPC Distributed Generation Page 3 of 15
Turbines can range in capacity from several kilowatts to several Megawatts. The crucial parameter is the diameter of the turbine - the longer the blades, the larger the areas swept by the rotor and the greater the energy output. At present the average size of new machines being installed is 600 kilowatts, although there are 1.5 Megawatt machines on the market. The trend is towards larger machines. There are many wind turbine designs, suggesting that there is still plenty of scope for innovation and technological development. The most common configuration is a three bladed, “stall controlled”, constant speed machine. The next most common design is similar, but is “pitch controlled” (see below). Gearless and variable speed machines follow, again with three blades. A smaller number of turbines have two blades, or use other concepts, such as a vertical axis. Most turbines are “upwind” in design - they face into the wind with the nacelle and tower behind. There are also downwind designs, however, where the wind passes the tower before reaching the blades.
Power Regulation: Stall and pitch control There are two main methods of controlling the power output from the rotor blades. The angle of the rotor blades can be actively adjusted by the machine control system. This is known as pitch control. This system has built-in braking, as the blades become stationary when they are fully “feathered”. The other method is known as stall control. This is sometimes described as passive control, since it is the inherent aerodynamic properties of the blade which determine power output; there are no moving parts to adjust. The twist and thickness of the rotor blade vary along its length in such a way that turbulence occurs behind the blade whenever the wind speed becomes too high. This turbulence causes some of the wind’s energy to be shed, minimising power output at higher speeds. Stall control machines also have brakes on the blade tips to bring the rotor to a standstill, if the turbine needs to be stopped for any reason. All wind turbines start operating at a speed of 4-5 metres per second and reach maximum power at about 15m/s. 1.1 Factors affecting performance
The windiness of the site : The power available from the wind is a function of the cube of the wind speed. Therefore if the wind blows at twice the speed, its energy content will increase eight-fold. In practice, a turbine at a site where the wind speed averages 8 metres per second (m/s) will produce around 80% more electricity than those where the wind speed is 6m/s. Availability : This is the capability to operate when the wind is available - an indication of the turbine’s reliability. Availability is typically 98% or more for modern European machines. Turbine arrangement : Turbines in wind farms must be carefully arranged in an optimum array to gain the maximum energy from the prevailing wind. Wind energy production and electricity demand The wind is an intermittent energy resource, but this does not reduce its value as a source of power. The variable output from wind energy does not pose any special difficulty for power system operation. Electricity demand is constantly fluctuating anyway, and supply and demand have to be matched on a minute to minute basis, 24 hours of the day, every day of the year. Wind energy effectively “shaves off” some of the demand which has to be met by conventional generating plant. This is often described as having a “negative load” effect on the electricity network. Wind energy coincides well with periods of peak electricity demand. Demand often peaks on cold, windy, winter days - just when wind turbines are at their maximum production.

Benefits of wind power Apart from generating electricity without causing pollution, wind energy has numerous other advantages. Widely distributed, indigenous supplies: More countries have sizeable wind power potential than have large resources of hydro-power or fossil fuel reserves. Ideal for generating electricity at a local level: European wind schemes are typically in
clusters of around 10 - 40 turbines, providing enough electricity for 4,000 to 16,000 households. Some countries such as Denmark and Germany also have a high proportion of single turbines. The electricity produced by these can be fed directly into the local distribution network, reducing power transmission losses. By contrast, the electricity from larger power stations has to be transmitted in high voltage power lines and travel long distances before it gets to the point of use.
Variation of wind speed with WTG hub height
020406080
100
0 1 2 3 4 5 6 7 8 9 10
Wind Speed (m/sec)
Hub
Hei
ght (
m)
Good for island communities: Wind energy systems on islands can be linked to diesel or solar systems to provide back-up when the wind is not blowing. Low risk: The relatively small unit size of each individual wind turbine (or wind scheme) reduces the risk of technical failure or industrial action compared with larger generating units. Energy diversity: It is sensible for any nation to have a balanced range of energy technology, rather than relying on one or two technologies or imported fuel. The energy mix among different European countries varies widely, with some countries more dependent on energy imports than others. The UK and Germany have a relatively diverse mix of fuels, whereas others are more dependent on oil (Spain and Greece), coal (Denmark) and nuclear (France and Belgium). Expanding the use of wind energy will increase energy diversity and improve the security of electricity supply. Energy diversity lessens the international political risks associated with fossil fuel reserves, the volatility of oil and gas prices, and the hazards associated with nuclear power.
Wind Power Generation Technology - NTPC Distributed Generation Page 4 of 15

Variation of Generation costs with Wind Speed
0
0.02
0.04
0.06
0.08
0.1
0.12
0.14
4 5 6 7 8 9 10 11 12Wind Speed at Hub (m/sec)
Gen
erat
ion
cost
(US
$/kW
h)
2.0 Indian Scenario
Wind Power Generation Technology - NTPC Distributed Generation Page 5 of 15
Amongst all renewable energy sources so far identified in India for commercial exploitation, Wind Energy has been found to be one of the most promising for generation of grid quality power. India’s wind power potential has been assessed at around 45,000 MW assuming 3% land availability for wind farms requiring @12 ha/MW in sites having wind power density in excess of 250W/sq.m. at 50 m hub-height. The potential for grid-interactive wind power would be less (around 15,000 MW) if sites having wind power density in excess of 300 W/ sq.m. at 50 m hub-height are considered in keeping with international practice. India now ranks 4th in the world after Germany, USA and Spain with a wind power installed capacity of 5340 MW (as of 31.03.2006).
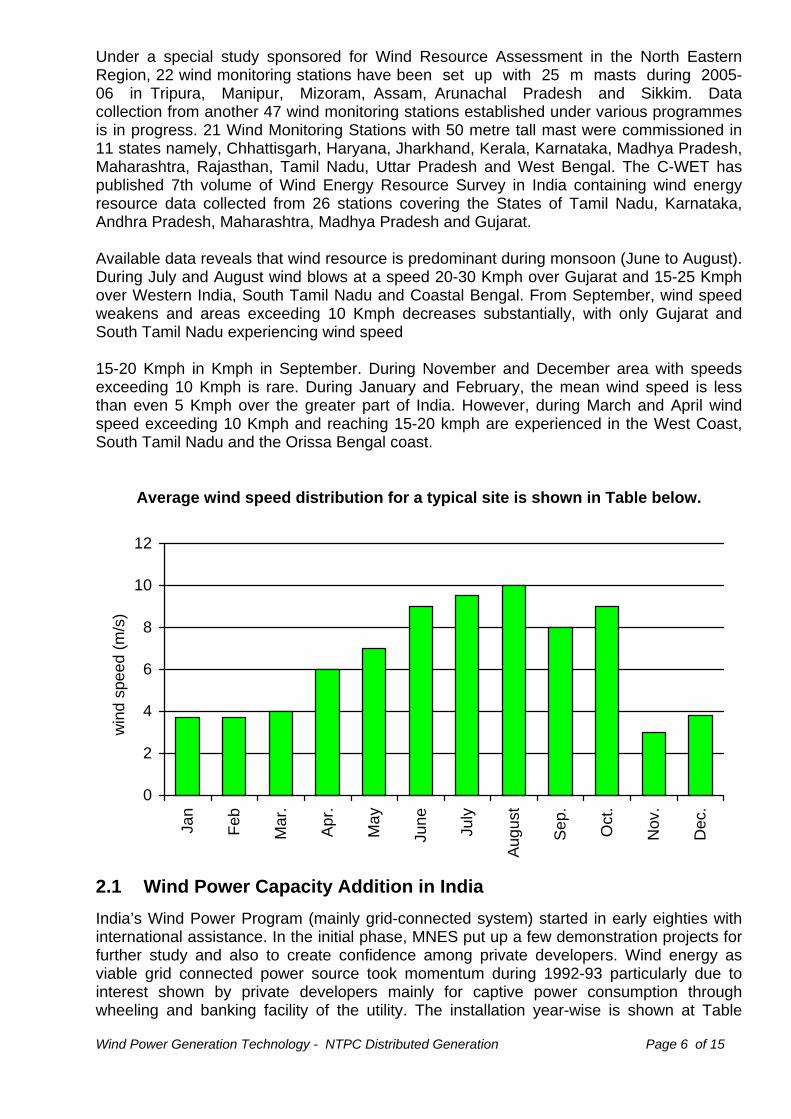
Under a special study sponsored for Wind Resource Assessment in the North Eastern Region, 22 wind monitoring stations have been set up with 25 m masts during 2005-06 in Tripura, Manipur, Mizoram, Assam, Arunachal Pradesh and Sikkim. Data collection from another 47 wind monitoring stations established under various programmes is in progress. 21 Wind Monitoring Stations with 50 metre tall mast were commissioned in 11 states namely, Chhattisgarh, Haryana, Jharkhand, Kerala, Karnataka, Madhya Pradesh, Maharashtra, Rajasthan, Tamil Nadu, Uttar Pradesh and West Bengal. The C-WET has published 7th volume of Wind Energy Resource Survey in India containing wind energy resource data collected from 26 stations covering the States of Tamil Nadu, Karnataka, Andhra Pradesh, Maharashtra, Madhya Pradesh and Gujarat. Available data reveals that wind resource is predominant during monsoon (June to August). During July and August wind blows at a speed 20-30 Kmph over Gujarat and 15-25 Kmph over Western India, South Tamil Nadu and Coastal Bengal. From September, wind speed weakens and areas exceeding 10 Kmph decreases substantially, with only Gujarat and South Tamil Nadu experiencing wind speed 15-20 Kmph in Kmph in September. During November and December area with speeds exceeding 10 Kmph is rare. During January and February, the mean wind speed is less than even 5 Kmph over the greater part of India. However, during March and April wind speed exceeding 10 Kmph and reaching 15-20 kmph are experienced in the West Coast, South Tamil Nadu and the Orissa Bengal coast.
Average wind speed distribution for a typical site is shown in Table below.
0
2
4
6
8
10
12
Jan
Feb
Mar
.
Apr
.
May
June
July
Aug
ust
Sep
.
Oct
.
Nov
.
Dec
.
win
d sp
eed
(m/s
)
2.1 Wind Power Capacity Addition in India
India’s Wind Power Program (mainly grid-connected system) started in early eighties with international assistance. In the initial phase, MNES put up a few demonstration projects for further study and also to create confidence among private developers. Wind energy as viable grid connected power source took momentum during 1992-93 particularly due to interest shown by private developers mainly for captive power consumption through wheeling and banking facility of the utility. The installation year-wise is shown at Table
Wind Power Generation Technology - NTPC Distributed Generation Page 6 of 15

Wind Power Generation Technology - NTPC Distributed Generation Page 7 of 15
below. During 1995 and 1996 (March ending), India was leading the market with around 30% world market. However, during 1996, the market growth slowed down both in the country and on international front.
CURRENT STATEWISE WINDPOWER INSTALLED CAPACITY IN INDIA (AS ON
31.12.2005)
State Installed Capacity MW Tamil Nadu 2526.7Maharashtra 654.6Gujarat 287.8Karnataka 487.0Andhra Pradesh 126.1 Madhya Pradesh 35.1Kerala 2.0West Bengal 1.1Rajasthan 312.6Others 1.6TOTAL 4434.5
2.2 MNES Guidelines MNES is the administrative ministry for the development of non-conventional energy sources in which renewable energy is the focus area. MNES frames different guidelines from time to time to regulate/strengthen the Renewable Energy Sector. These guidelines are to streamline the development and facilitate healthy and orderly growth of the wind power sector in the country. The guidelines include measures for the installation of duly tested and certified quality equipment which will optimize generation of energy from wind power projects. Wind power development in the country has been spurred by a mix of promotional measures. The Government has introduced a package of incentives, which includes fiscal concessions such as 80% accelerated depreciation, tax holiday for power generation projects, concessional customs and excise duty, liberalized foreign investment procedures, etc. SERCs of Andhra Pradesh, Madhya Pradesh, Karnataka and Maharashtra have so far announced preferential tariffs for wind power. Maharashtra Electricity Regulatory Commission (MERC), Andhra Pradesh Electricity Regulatory Commission (APERC), Karnataka Electricity Regulatory Commission (KERC), Madhya Pradesh Electricity Regulatory Commission (MPERC) and Orissa Electricity Regulatory Commission (OERC) have directed that each distribution licensee shall purchase a minimum quantum of electricity annually from renewable sources expressed as a percentage of its total consumption. Rajasthan Govt. has recently modified their policy for Non-conventional Energy projects including for wind energy. 2.3 Manufacturers available in India
MNES have drawn up the list of manufacturers having models of wind turbines of unit capacity 225 kW and above that have obtained type approval including power curve certification. State-of-the-art wind power technologies are now indigenously available in India. An annual production capacity of 500 MW has been established. Wind electric generators up to 1250 kW unit capacity are now being manufactured. Blades, a crucial component of wind turbines, are manufactured in India. Nearly 80 per cent indigenization has been achieved

Wind Power Generation Technology - NTPC Distributed Generation Page 8 of 15
2.4 Clearances Required
MNES has issued necessary guideline for wind power projects for issuance of necessary clearances. As per these, the State Electricity Board/ State Nodal Agencies responsible for clearance of Wind Power Projects issue No-Objection Certificate after carrying out appraisal of the wind power projects in accordance with the guidelines. The guidelines provide that No-objection certificate is issued only to those projects that meet the laid down requirements. Some of these are:
(a) DPR For projects upto 1 MW Capacity submission of application giving details of the projects as per the required format is required. For project the above 1MW capacity a detail project report prepared by an independent consultant is a pre-requisite.
(b) Type Approval and Quality System Certification The NOC is to be issued only to those projects which involve installation of duly tested and certified and quality equipment. Submission and quality system certification (ISO 9000) of manufacturing and installation is a pre-requisite for Indian Manufacturers.
(c) Grid Parameter
It should be ensured that the projects generate power for accordance with a duly laid down a grid parameter. The guidelines provide for penalty to be levied by SEBs if the projects fail to achieve minimum monthly average power factor 0.85 at the metering point. Suitable charge is also levied for a reactive power to discourage drawl reactive power from the grid and to avoid free wheeling of the machine.
(d) Installed cost
Based on published information, the installed capital cost of Wind Power Projects is around Rs. 3.0 to 4.0 crores per MW (US $ 1000-1200 / kW). O&M costs range from 1-1.5 US cents/kWh. Generation costs are 7-9 US cents. All the costs are experiencing a downward trend with advances in technology.
(e) Land requirement
The land requirement of the one machine is roughly around five acres. Thus the requirement of land comes to around 15-20 acres per MW.
2.5 Reactive Power Consumption
Due to excessive drawing of reactive power from the grid by WEGs installed in Tamil Nadu, TNEB has decided to enhance the penalty for reactive power imported from the grid to Rs. 1.00 per unit. WEGs draw substantial reactive power from the grid during start-ups & part-load operation which occur several times in a day. It has been observed that inspite of installing automatic capacitor banks to minimise this reactive power consumption, utilities are paying large amounts in penalties to TNEB for drawing reactive power from grid. The payment of such penalty throughout the lifetime of the project shall substantially influence the economics of the project.
3.0 World Scenario

Wind energy continued its dynamic growth worldwide in the year 2006. 14.900 MW were added in the past year summing up to a global installed capacity of 73.904 MW by the end of December 2006. The added capacity equals a growth rate of 25 %, after 24 % in 2005. The currently installed wind power capacity generates more than 1 % of the global electricity consumption. Based on the accelerated development, WWEA has increased its prediction for 2010 and expects now 160.000 MW to be installed by the end of 2010.
Wind Power Generation Technology - NTPC Distributed Generation Page 9 of 15
Eleven wind turbine manufacturers supply more than 95% of the world market. Of these, nine are European. Important European turbine manufacturers include Vestas, Nordtank,

Micon, Bonus, Tacke, Nordex, NedWind and Wind Energy Group. The majority of these are Danish companies which operate world-wide, typically exporting 60 - 90% of their total production. The wind turbine market is very new and the 1st commercial wind turbines were produced in the early 1970’s. The average power out put of wind turbines has increased from 31kW in 1983 to 534kW in 1996. In the last 15 years cost of electricity from wind turbines has reduced by one-fifths. The wind turbine market has been dominated by a small number of companies mostly from Denmark – about 75% of the market is supplied by only 5 companies. Due to established technologies and cost competitiveness of older companies newer companies are unable to make a significant impact. Wind Turbine technology is relatively complex and it requires a number of years before the company can design sophisticated machinery to compete in today’s market. The manufacturing process also requires a high initial capital investment, which is a deterrent to newer companies. The wind turbine market suffered dramatic recession in mid to late 1980’s because of stagnation of US market. This led to a large number of companies going bankrupt. The fluctuations in the wind turbine market have forced companies to have a large geographical base for survival. Currently some 50 countries have major wind power installations. Europe is presently the most important market but demand in Asia is growing strongly. Ease of rapid installation (six to nine months) and a free local source of power make wind an attractive technology in developing countries. Worldwide, buoyant sales with about a 20% growth rate, is currently forecast. At about 4 US cents per kW of installed power, electricity from Danish turbines now costs around the same as the average cost for electricity from coal-fired power plant. However, there is no such thing as a single price for wind energy: costs depend on both wind speeds and the accessibility of sites. Accessibility is in turn determined by road construction and grid access costs. MARKET SHARES OF WEG SUPPLIERS WORLDWIDE (based on 1999 sales)
Others5.0%
NEG-Micon13.9%
Nordex6.8%
Made3.3%
RE Power3.0% Ecotecnia
1.7%
Enron8.3%Bonus
8.6%
Gamesa11.5%
Enercon18.0%
Vestas21.6%
3.1 Technology Trends: Wind Power Generation Technology - NTPC Distributed Generation Page 10 of 15

Wind Power Generation Technology - NTPC Distributed Generation Page 11 of 15
The trend in the industry is towards higher hubs, because wind speed and therefore electrical output from the turbine increase considerably with hub height. This has led to reduction in installed cost/kW and cost of generation making it competitive with conventional forms of energy. However, the wind forces on the turbine become more severe and may increase the capital costs of the wind turbine. Machines are increasing in size, as well as getting higher. Larger (megawatt-sized) machines can exploit economies of scale, which have not yet been exhausted. Wind Turbines of 1.5 to 2.5MW capacity are already in market and studies are being carried out with prototypes of 3 to 6MW machines. The average capacity of wind turbines currently being installed worldwide is now over 1000kW, with typical rotor diameters of 60 metres, and tower heights of some 60 metres. A technological breakthrough in the development of off-shore wind-parks could have a major impact on the role of wind in the future. There is a vast wind resource in offshore sites. Pilot offshore wind power projects are underway in Sweden, Denmark and the Netherlands. AVERAGE SIZE OF WEG INSTALLED EACH YEAR WORLDWIDE Year Denmark Germany Spain UK USA 1992 215 185 125 361 223 1993 248 254 200 320 149 1994 364 371 320 469 336 1995 493 473 297 534 327 1996 531 530 420 562 511 1997 560 623 422 514 707 1998 687 783 504 615 723 1999 750 919 589 617 720 2000 900 900 900 900 900 2001 915 915 900 900 900 2002 1443 1397 900 900 900
Source: BTM Consult Fixed tariff system and tax credits are supposed to be the main reasons for rapid wind power development. 3.2 Offshore Windfarms Wind energy today is competitive and has already been widely installed at specific sites with favourable conditions. Areas potentially suitable for wind energy applications are dispersed throughout the European Union. At present, some have to bear additional costs due to their particular location which increases installation and/or operational costs (areas far from existing grids, in very cold, hot or dusty climates, offshore, islands, remote rural areas etc.). In particular, there is enormous potential for offshore wind farms. They have the advantage of higher wind speeds, although access is clearly more difficult. In order to achieve large- scale penetration of wind energy in the European Union these areas have also to be used. Offshore wind energy is an extremely promising application of wind power, particularly in countries with high population density, and thus difficulties in finding suitable sites on land. Construction costs are much higher at sea, but energy production is also much higher. 183MW of offshore capacity was added in 2002. Commercial sized offshore wind turbine parks will become a reality in around the year 2000. 750 MW will be built in the first five to seven years of the next century, with another 3300 megawatt planned to go on-line in the years up to 2030, thus achieving a 50 per cent wind penetration in the grid. The energy

policy interest in wind energy in Denmark is primarily based on its ability to deliver large volume CO2 reduction from power generation cheaply. Shortage of land sites in north-western Europe is one reason for this move offshore. Other reasons include significantly higher wind speeds than on land, and thus higher energy production at sea. In addition, new research results indicate that wind speeds at sea are higher than what was previously estimated. The marine environment gives more stable winds with less turbulence and less wind shear, facilitating the design of cheaper turbines with a longer lifetime. To be economic, offshore wind parks have to be large (120 to 150 MW), and use large turbines (1.5 MW and above). New foundation technologies, using steel rather than concrete has improved the economics of offshore wind power dramatically. Wind turbines at sea would have a longer design lifetime due to lower mechanical fatigue loads. If this is taken into account, energy costs per kWh may be as low as 4 US cents per kWh, although more conservative estimates point to 5 US cents/kWh using present day technologies. Other than decreasing installation costs even further, technical challenges are abundant in this frontier line of wind technology. Logistics and grid integration will pose interesting problems, and phasing up to 50 per cent wind into the Danish electricity grid, will mean a longer term redesign of grid technology in the direction of a more flexible, decentralised system with large amounts of CHP and heat storage, plus a more co-ordinated use of wind and the neighbouring countries' hydro resources. From an environmental point of view offshore wind parks have few drawbacks. A new scientific study has shown that wind parks at sea have no significant influence on bird life. A life-cycle calculation of energy use in manufacturing, deployment and maintenance of an offshore wind park by the author shows that the energy thus consumed is less than 2.5 per cent of the energy produced by the park, thus making wind energy one of the cleanest generating technologies available. The world’s first offshore wind farm is located North of the island of Lolland in the Southern part of Denmark. The world's second offshore wind farm is located between the Jutland peninsula and the small island of Tunø in Denmark. UK's first offshore 4MW windfarm at Blyth, Northumberland became operational in December, 2000 and cost about £ 4 million (~ Rs. 8 crores/MW). Two Vestas V66 wind turbines of 2MW each are installed at a hub height of 58m. The cost of generation is 5cents/kWh. Tuno Knob: The Tuno Knob offshore wind farm in the Kattegat Sea off the Coast of Denmark was built in 1995 by the utility company Midtkraft. The Wind farm consists of 10 Vestas 500 kW pitch controlled wind turbines. The turbines were modified for the marine environment, each turbine being equipped with an electrical crane to be able to replace major parts such as generators without the need for a floating crane. In addition, the gearboxes were modified to allow a 10 per cent higher rotational speed than on the onshore version of the turbine. This will give an additional electricity production of some 5 per cent. This modification could be carried out because noise emissions are not a concern with a wind park located 3 kilometres offshore from the island of Tuno, and 6 kilometres off the coast of the mainland Jutland peninsula. The park has been performing extremely well, and production results have been substantially higher than expected. Vindeby : The Vindeby wind farm in the Baltic Sea off the coast of Denmark was built in 1991 by the utility company SEAS. The wind farm consists of 11 Bonus 450 kW stall controlled wind turbines, and is located between 1.5 and 3 kilometres North of the coast of
Wind Power Generation Technology - NTPC Distributed Generation Page 12 of 15

the island of Lolland near the village of Vindeby. The turbines were modified to allow room for high voltage transformers inside the turbine towers, and entrance doors are located at a higher level than normally. These same modifications were carried over to the subsequent Tuno Knob project. Two anemometer masts were placed at the site to study wind conditions, and turbulence, in particular. A number of interesting results on offshore wind conditions have been obtained through these studies which were carried out by RISO National Laboratory. The park has been performing flawlessly. Electricity production is about 20 per cent higher than on comparable land sites, although production is somewhat diminished by the wind shade from the island of Lolland to the South. 3.3 Lightning Protection: The lightning flashes carry current upto 200kA and have specific energy of 15MJΩ4, and can cause severe damage to the wind turbine. Worldwide, lightning strikes account for 80% cases of damage to wind turbines. The control system, electrical system, blades and generator of the wind turbine are the most affected components of the wind turbine in case of a lightning strike. The blades of the wind turbine are made of GRP/epoxy which is highly resistive and prone to failure during lightning strike. A variety of methods are being adopted to protect the wind turbine blades in addition to the normal protection for the tower. A metallic wire running from a receptor located at the blade tip to the blade root connected to the earthed tower.
0200400600800
100012001400
Blades Generator Control System ElectricalSystem
No.
of d
ays
lost
due
to c
ompo
nent
fa
ilure
s
3.4 European Wind Power Development Program The European Union has called for an increase in the contribution of renewable energy sources form 4 percent to 8 percent of total energy demand by 2005. Wind energy will play a major part in achieving this target and is assisting in reducing CO2 emissions. The wind energy industry has set a goal for 40,000 MW of wind energy capacity to be installed by 2010, which would provide electricity for about 50 million people. The wind energy resource in Europe is sufficient in theory, to provide all of Europe’s electricity. Technical limitations mean this will not happen, but detailed studies suggest that most companies could accommodate between 20-20% of their total production from wind without any technical modification to the existing system. In addition to land based wind energy, there is enormous potential for offshore wind farms. These have the advantage of generally high wind speeds, although construction and access is clearly more difficult. Wind Power Generation Technology - NTPC Distributed Generation Page 13 of 15

Wind Power Generation Technology - NTPC Distributed Generation Page 14 of 15
Improvements in wind energy technology mean that the trends which have led to the dramatic fall in the cost of wind energy are set to continue. Countries all over the world are setting targets for wind power. It is estimated that 22,000 Megawatts of wind energy capacity will be installed over the next 10 years. This represents an annual market of around 2.4 billion ECU. Europe is at the hub of this global business, with six companies supplying over half of the world’s turbines. Europe stands to benefit enormously from this move towards sustainability.
Country Cumulative Megawatts installed end of 2002 Germany 11968 Spain 5043 Denmark 2880 Italy 806 Netherlands 727 UK 570 Greece 462 Sweden 372 Portugal 204 France 183 Ireland 167 Other countries 450 Total 23832
4.0 COSTS: Latest windfarm installation have costed around US$ 920/kW (20MW windfarm 30 X 650kW Vestas turbines in Costa Rica). The wind power is being priced at 3 cents/kWh in the wholesale electricity market (New Zealand 32MW windfarm Mean Annual Wind Speed 10m/s). BWEA has estimated the installation cost of offshore windfarms around US $ 1480/kW. The current generation costs of offshore windfarm at Blyth, UK is 5 cents/kWh and are estimated to drop to 3.5 cents/kWh at more windy sites. Project / Study
Site Farm Capacity [MW]
Turbine Capacity [kW]
Investment Cost [ECUct/kW]
Mean Wind Speed at Hub [m/s]
Energy Cost [ECU ct/kWh]
Vindeby Project (1991)
Baltic Sea DK 4.95 450 2150 7.5 8.6
Lely Project (1994)
Ijsselmeer NL 2 500 2450 7.7 11.1
Tuno Knob Project (1995)
Baltic Sea DK 5 500 2200 7.5 6.6
Danish Plan of Action (Study 1997)
Horns Rev, North Sea
DK 120 1500 1650 9.2 4.9
Nearshore Study (1997)
Ijmuiden, North Sea
NL 100 ~ 1000 1990 9 6.4
Typical Onshore
Typical European Sites
3 - 20 500 -750
700 - 1000 5 - 10 3 to 8

Wind Power Generation Technology - NTPC Distributed Generation Page 15 of 15
State of the art of offshore and onshore wind farms (energy cost for 20 years loan, 5 % discount rate) Source : 1. Renewable Energy World 2. REFOCUS 3. IREDA News Journal 4. Sustainable Energy Journal 5. Catalogues of Wind Turbine Manufacturers 6. Danish Wind Turbine Manufacturers Association (www.windpower.dk) 7. European Wind Energy Association 8. American Wind Energy Association