overview of wind power - umass amherst · wind overview • new england has seen significant growth...
TRANSCRIPT

M A R C H 5 , 2 0 1 4 | W A L T H A M , M A
Eric Wilkinson E X T E R N A L A F F A I R S
Massachusetts Wind Working Group
Overview of Wind Power

Who is ISO New England, and What is Our Role?
• ISO New England was created to oversee the region’s restructured electric power system – Private, not-for-profit corporation – Regulated by the Federal Energy Regulatory Commission (FERC)
• ISO-NE is the Regional Transmission Organization – Independent of companies doing business in the market – No financial interest in companies participating in the market
• Major Responsibilities – Reliable operation of the electric grid – Administer wholesale electricity markets – Plan for future system needs
2

Wind Overview
• New England has seen significant growth in wind development – Mostly on-shore – Proposed off-shore
• New England Wind Integration Study (NEWIS) concluded that large scale wind integration is possible for the region
• Depending on location, transmission is key factor for future wind development
• ISO process improvements aimed at easing the integration of wind power
3
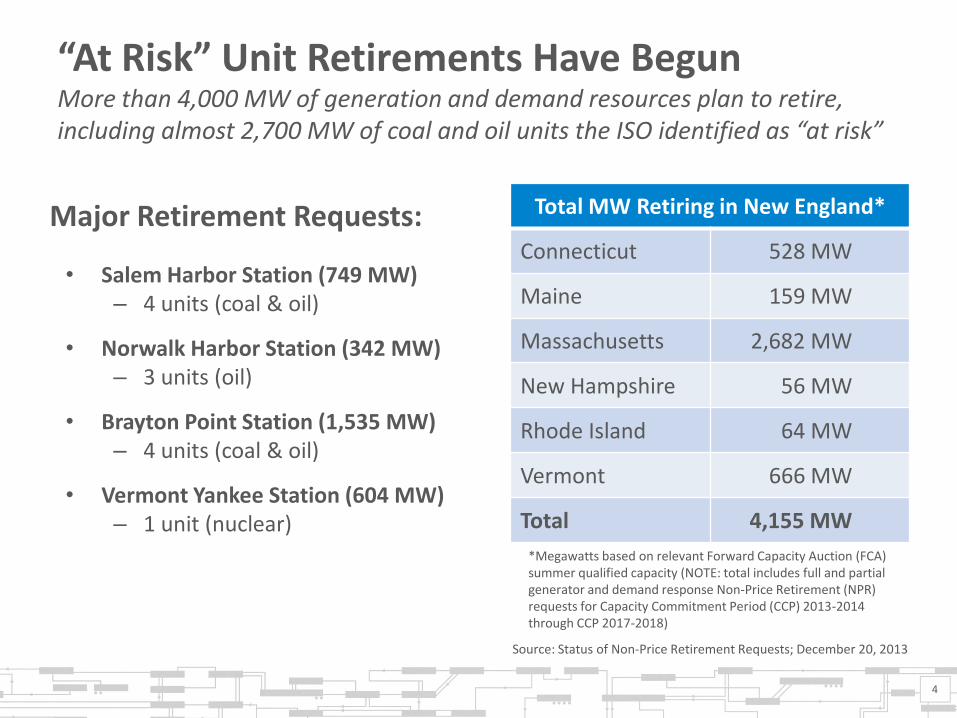
“At Risk” Unit Retirements Have Begun More than 4,000 MW of generation and demand resources plan to retire, including almost 2,700 MW of coal and oil units the ISO identified as “at risk”
• Salem Harbor Station (749 MW) – 4 units (coal & oil)
• Norwalk Harbor Station (342 MW) – 3 units (oil)
• Brayton Point Station (1,535 MW) – 4 units (coal & oil)
• Vermont Yankee Station (604 MW) – 1 unit (nuclear)
Total MW Retiring in New England*
Connecticut 528 MW
Maine 159 MW
Massachusetts 2,682 MW
New Hampshire 56 MW
Rhode Island 64 MW
Vermont 666 MW
Total 4,155 MW
4
Major Retirement Requests:
*Megawatts based on relevant Forward Capacity Auction (FCA) summer qualified capacity (NOTE: total includes full and partial generator and demand response Non-Price Retirement (NPR) requests for Capacity Commitment Period (CCP) 2013-2014 through CCP 2017-2018)
Source: Status of Non-Price Retirement Requests; December 20, 2013
WIND CAPACITY AND ENERGY PRODUCTION

Current Wind Capacity in New England As of January 15, 2014
• 710 MW of commercial wind power within the area administered by ISO
• 2,029 MW of wind power in the Interconnection Queue • Includes non-FERC-jurisdictional projects requesting interconnection
either to the lower voltage distribution system or areas external to ISO’s service territory
6

Electric Grid is Undergoing Rapid Transformation Generation shifting from oil, coal and nuclear to natural gas and renewables
7
* Resources in 2020 assume approx. 5,000 MW of new resources proposed in the ISO Queue as of April 2013 (primarily natural gas and wind); and approx. 3,200 MW of non-price retirement requests for coal, oil and nuclear resources as of October 2013.
18%
41%47%
34%
21%17%
18%
14% 12%12%
9%4%
7%5%
5%
11% 9%15%
0%
10%
20%
30%
40%
50%
60%
70%
80%
90%
100%
2000 2010 2020*
Capacity by Fuel Type
Hydro/renewables
Pumped storage
Coal
Nuclear
Oil
Natural gas

Proposed Generation
8
Natural gas 55%
Wind 40%
Other 5%
ISO Generator Interconnection Queue (January 2014)
Over 2 GW of wind proposed (includes non-FERC jurisdictional), majority of wind development proposals onshore in northern New England and offshore in southern
MA 20 MW
ME 1,300 MW
NH 135
MW
VT 110 MW
RI 30 MW (offshore)
Note: Cumulative numbers for
each state may include non-FERC jurisdictional proposals
as well both on- and off-shore proposals
Source: ISO Generator Interconnection Queue (January 2014)
Wind Proposals
Significant Amounts of Wind Proposed
MA 460 MW (offshore)

Annual Electricity Produced by Wind Resources
• In 2013, wind resources generated 1,766 GWh within ISO-NE service territory
• Total New England generation in 2013 was 112,040 GWh – Gas 41,542 – Nuclear 37,183 – All renewables 8,751
9
0
200
400
600
800
1000
1200
1400
1600
1800
2000
2005 2006 2007 2008 2009 2010 2011 2012 2013
New England Wind Energy Production (GWh)
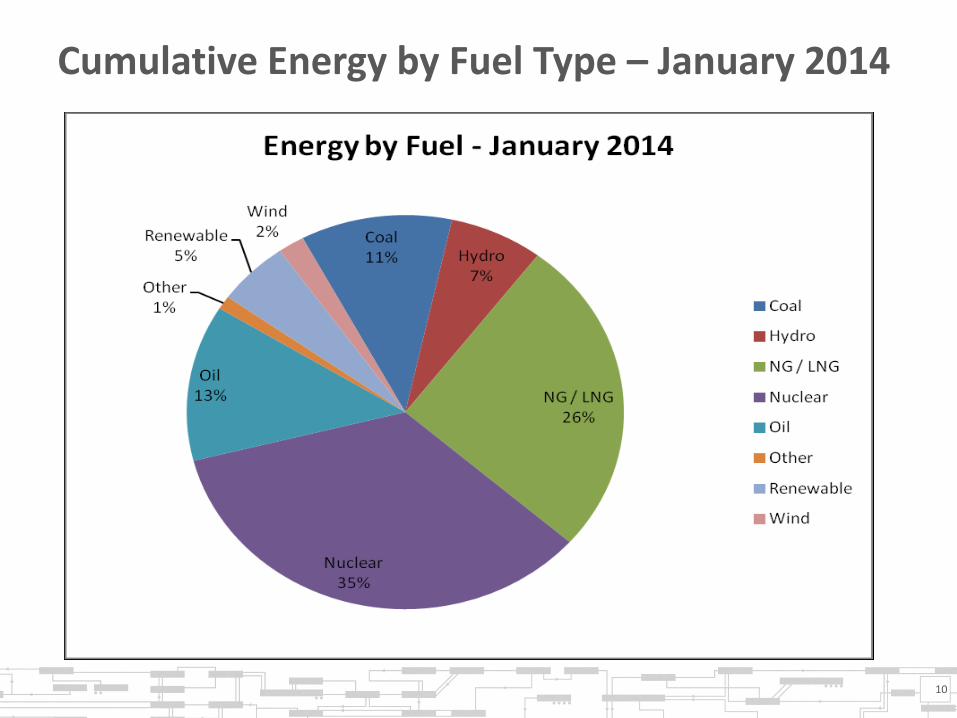
Cumulative Energy by Fuel Type – January 2014
10

TRANSMISSION

Existing Transmission Infrastructure
• 8,400 miles of high voltage transmission lines
• Wind generators connecting into electrically weak parts of region and Eastern Interconnection
• Heavily built out system in central and southern New England
12
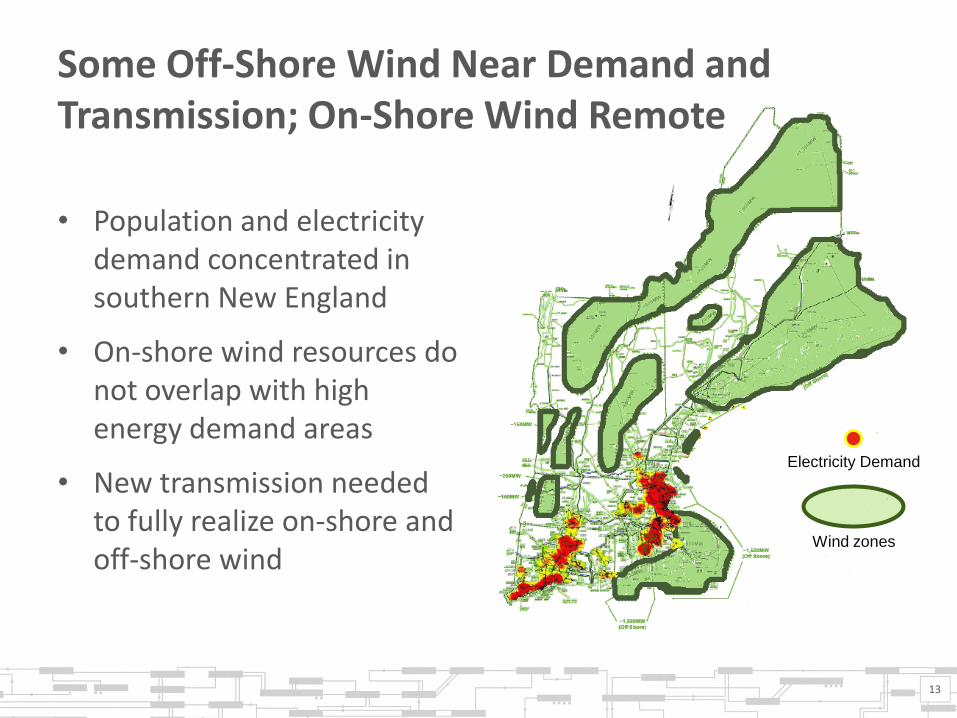
Some Off-Shore Wind Near Demand and Transmission; On-Shore Wind Remote
• Population and electricity demand concentrated in southern New England
• On-shore wind resources do not overlap with high energy demand areas
• New transmission needed to fully realize on-shore and off-shore wind
Wind zones
Electricity Demand
13

Challenges for On-Shore Wind in Northern Areas
• Technology provides limited transmission system support – Although technologies are improving, technology does not provide
significant system voltage or stability support
• Connecting using minimum interconnection standards to weak parts of the system, often where there are local and regional constraints
• First-in wind generators have exhausted limited existing system margins, resulting in more significant system upgrades for subsequent generators
• Wind interconnecting as an energy resource, competing for transmission use, based on bid price – Areas of the system where wind competes with wind and other
renewable resources, sometimes with the same owner
14

Local and Regional Constraints Currently Exist in Northern New England
15
• Regional transmission constraints
– Broader areas of the system which may constrain concurrent operation of larger groups of generation
– Transmission planned (Maine Power Reliability Program) not intended for power transfer enhancement, but some help
• Local transmission constraints
– Smaller areas of the system which may constrain concurrent operation of smaller groups of generation
Constraints in Maine
Constraints in VT & NH

Solutions/Improvements Under Consideration
• Develop a more thorough study regimen that considers a wider range of operating conditions, to address the rapid and unacceptable erosion in system operability
• Identify additional system upgrades for interconnection to minimize wind resource limitations
16

OPERATIONS

Wind Resources Can Help On Peak Days Wind has helped region with fuel mix diversity and has provided needed energy on peak demand days
Natural gas 48%
Nuclear 17%
Hydro 8%
Other 3%
Wind 1%
Coal 9% Oil
14%
2011 Peak Day July 22
18
+26,000 MW demand
Natural gas 47%
Nuclear 18%
Oil 11%
Coal 9%
Hydro 10% Other 3%
Wind 2%
2013 Peak Day July 19
+27,000 MW demand
Source: August 2013 COO Report Source: August 2011 COO Report
Wind Forecasting Tool
19
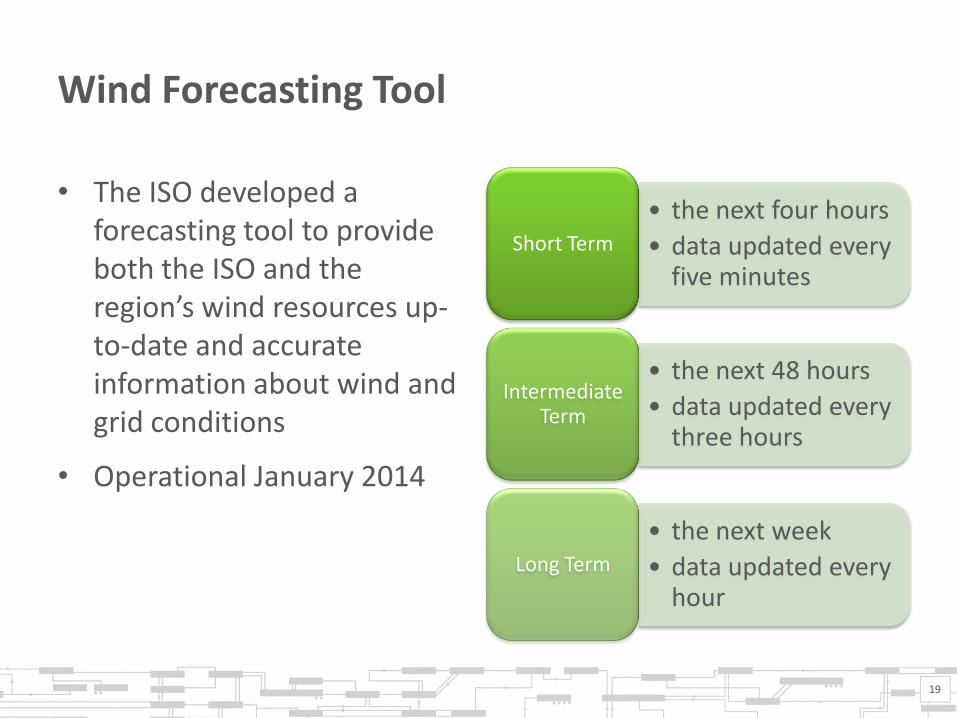
• the next four hours
• data updated every five minutes
Short Term
• the next 48 hours
• data updated every three hours
Intermediate Term
• the next week
• data updated every hour
Long Term
• The ISO developed a forecasting tool to provide both the ISO and the region’s wind resources up-to-date and accurate information about wind and grid conditions
• Operational January 2014

Wind Forecasting Tool Now Used to More Efficiently Commit Resources to Meet Demand
Use
• Wind forecasting data is continually being uploaded into ISO processes, scheduling, and dispatch services
• Operator situational awareness displays have been created
• Transmission outage coordination is also taking the new wind forecast into account for scheduling purposes
Benefits
• The forecast allows the partial integration of wind into the unit commitment processes
• Reduce the need to issue curtailment orders in certain circumstances
• Wind forecasting will become increasingly important as wind resources grow across the region
20

Conclusion
• Wind resources growing in New England – Both capacity and energy production
• ISO New England continues to work with stakeholders to reliably integrate wind resources – Studies indicate region can incorporate more wind resources – Transmission may be necessary, especially in constrained areas – Wind forecasting tool helps integrate resources into grid operations
21