wind measurements and data analysis - kthagenda •why do we need wind measurements? •why are...
TRANSCRIPT

Wind measurements and data analysis EG2340 Wind Power Systems

Agenda
• Why do we need wind measurements?• Why are accurate wind measurements so important?• Importance of long-term wind measurements• Wind measurements• Data analysis• Wind farms, wake effect and siting• Software and Example
KTH - EG2340 Wind Power Systems - Camille Hamon - 2014
Agenda
• Why do we need wind measurements?• Why are accurate wind measurements so important?• Importance of long-term wind measurements• Wind measurements• Data analysis• Wind farms, wake effect and siting• Software and Example
KTH - EG2340 Wind Power Systems - Camille Hamon - 2014

Why do we need wind measurements?
KTH - EG2340 Wind Power Systems - Camille Hamon - 2014

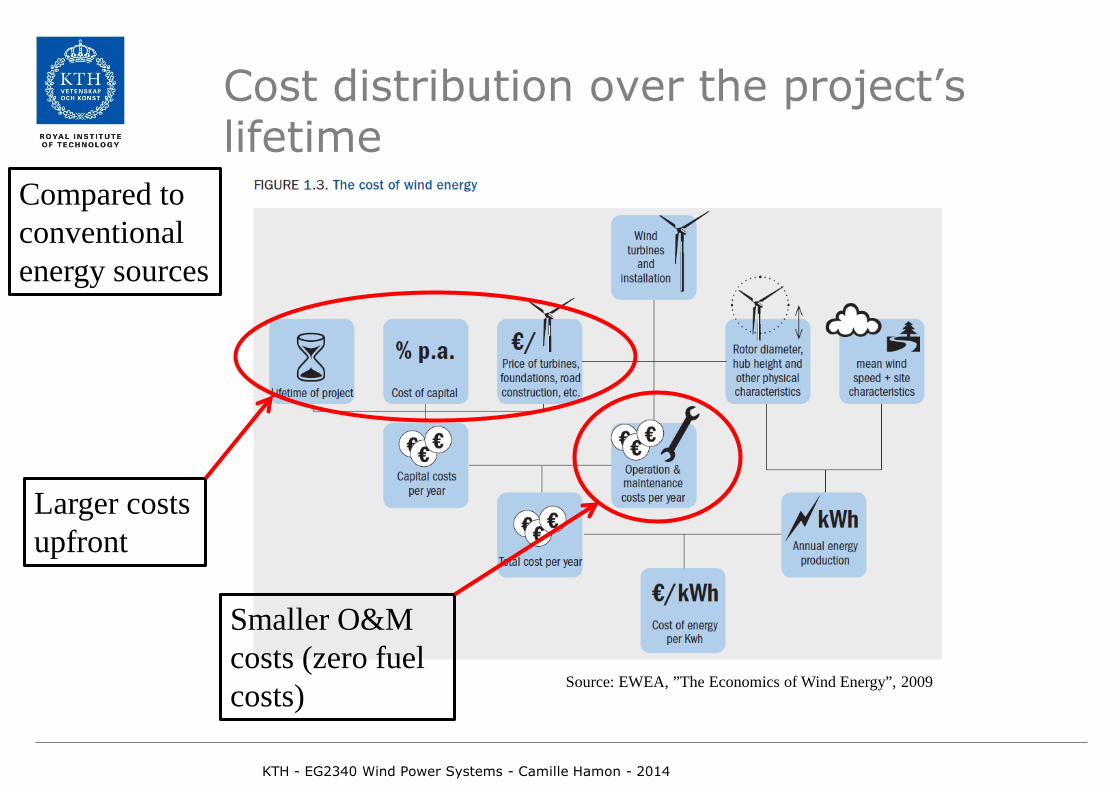
Cost distribution over the project’s lifetime
KTH - EG2340 Wind Power Systems - Camille Hamon - 2014
Source: EWEA, ”The Economics of Wind Energy”, 2009

Cost distribution over the project’s lifetime
KTH - EG2340 Wind Power Systems - Camille Hamon - 2014
Source: EWEA, ”The Economics of Wind Energy”, 2009
Larger costs upfront
Compared to conventional energy sources
Cost distribution over the project’s lifetime
KTH - EG2340 Wind Power Systems - Camille Hamon - 2014
Source: EWEA, ”The Economics of Wind Energy”, 2009
Larger costs upfront
Smaller O&M costs (zero fuel costs)
Compared to conventional energy sources

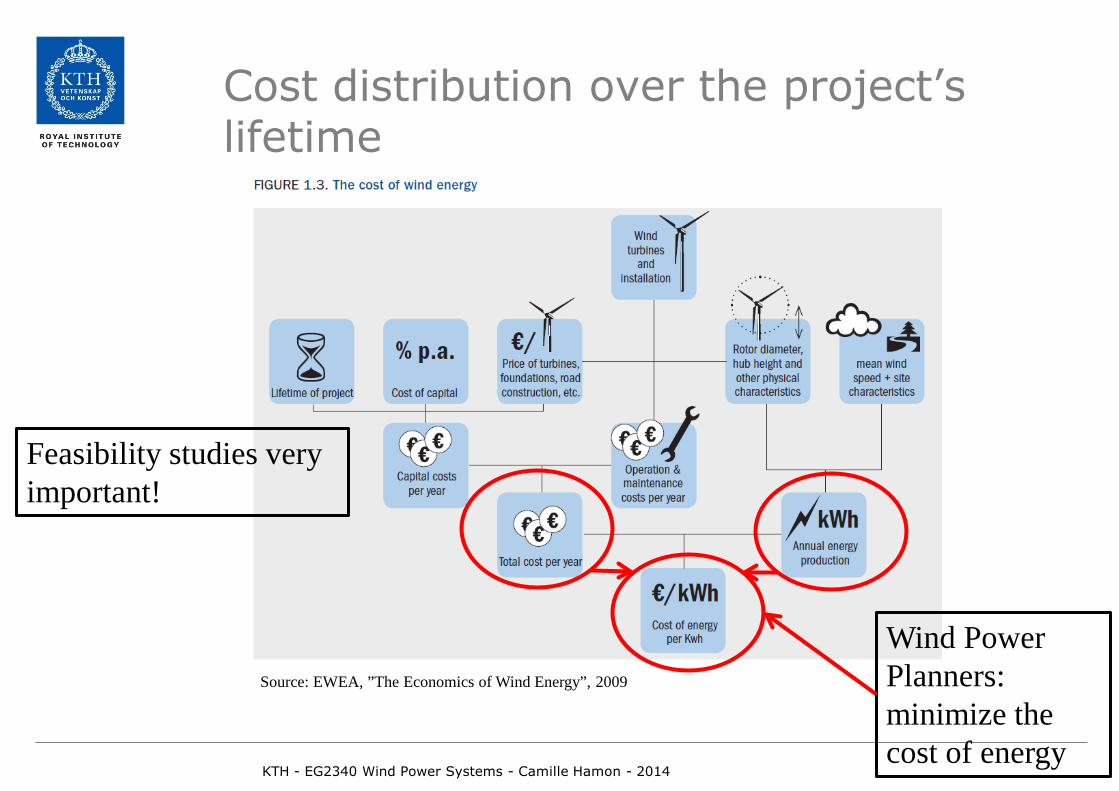
Cost distribution over the project’s lifetime
KTH - EG2340 Wind Power Systems - Camille Hamon - 2014
Source: EWEA, ”The Economics of Wind Energy”, 2009
Larger costs upfront
Compared to conventional energy sources
Wind Power Planners: minimize the cost of energy Smaller O&M
costs (zero fuel costs)
Cost distribution over the project’s lifetime
KTH - EG2340 Wind Power Systems - Camille Hamon - 2014
Source: EWEA, ”The Economics of Wind Energy”, 2009
Wind Power Planners: minimize the cost of energy
Feasibility studies very important!
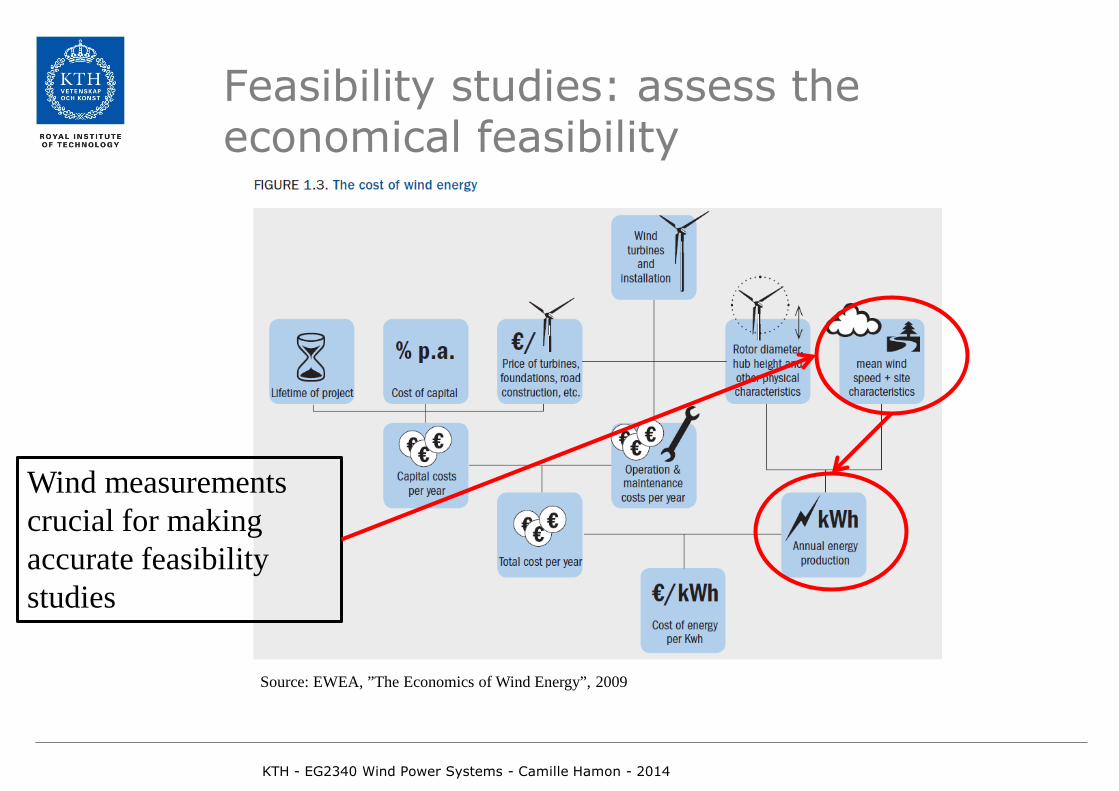
Feasibility studies: assess the economical feasibility
KTH - EG2340 Wind Power Systems - Camille Hamon - 2014
Source: EWEA, ”The Economics of Wind Energy”, 2009
Wind measurements crucial for making accurate feasibility studies

Agenda
• Why do we need wind measurements?• Why are accurate wind measurements so important?• Importance of long-term wind measurements• Wind measurements• Data analysis• Wind farms, wake effect and siting• Software and Example
KTH - EG2340 Wind Power Systems - Camille Hamon - 2014

Why are accurate wind measurements so important?
KTH - EG2340 Wind Power Systems - Camille Hamon - 2014
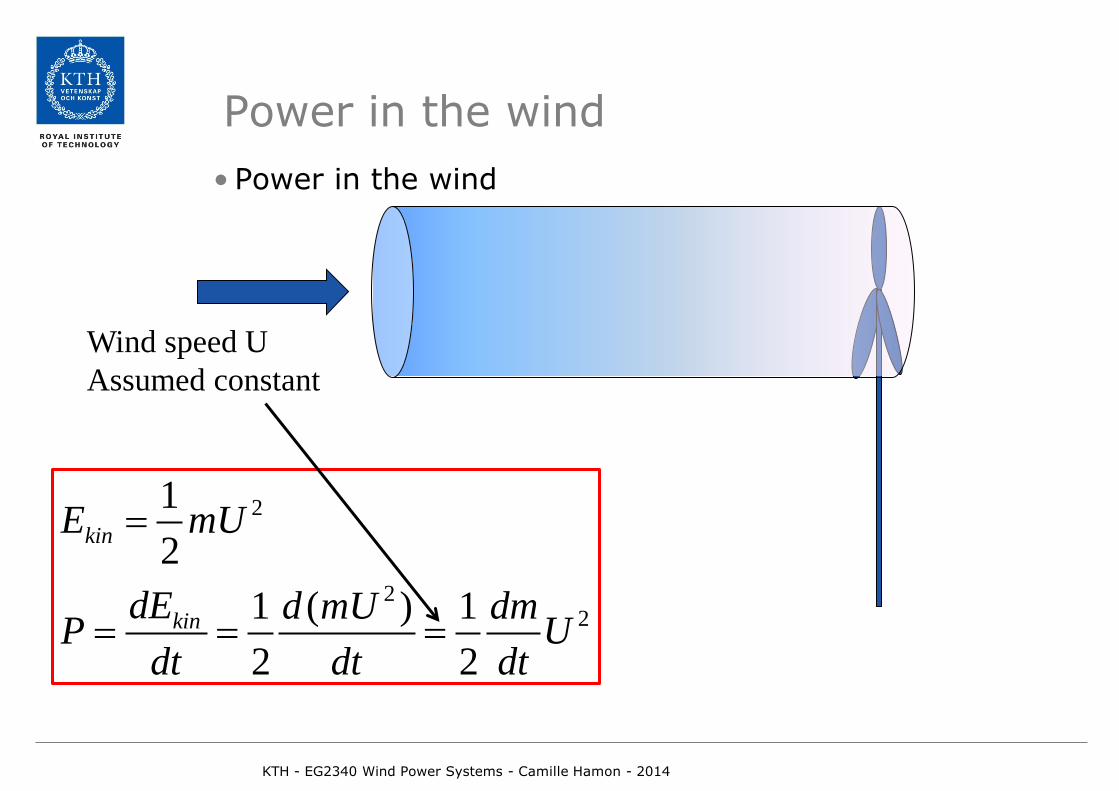
Power in the wind • Power in the wind
KTH - EG2340 Wind Power Systems - Camille Hamon - 2014
Wind speed U Assumed constant
2
22
12
1 ( ) 12 2
kin
kin
E mU
dE d mU dmP Udt dt dt
=
= = =

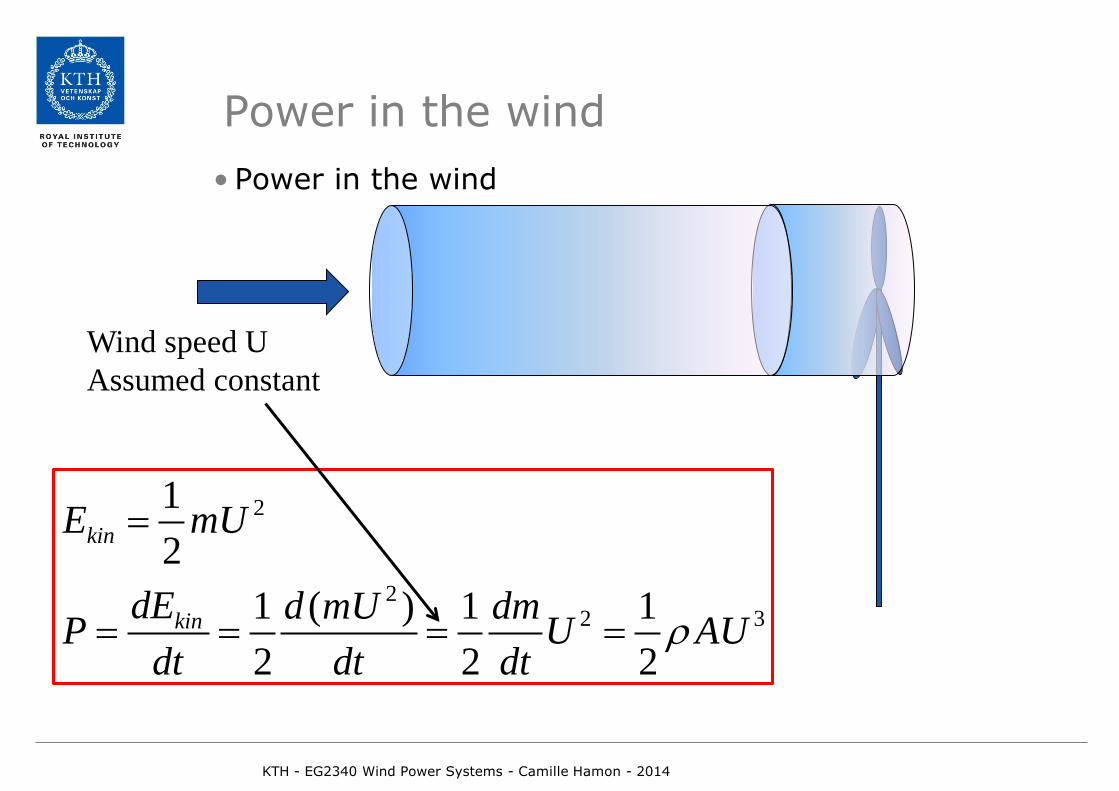
Power in the wind • Power in the wind
KTH - EG2340 Wind Power Systems - Camille Hamon - 2014
Udt
Wind speed U Assumed constant
Swept area
A
Mass of air going through the turbine per ”dt”:
dmm Volume A U dt AUdt
ρ ρ ρ= × = × × × ⇒ =
Power in the wind • Power in the wind
KTH - EG2340 Wind Power Systems - Camille Hamon - 2014
Wind speed U Assumed constant
2
22 3
12
1 ( ) 1 12 2 2
kin
kin
E mU
dE d mU dmP U AUdt dt dt
ρ
=
= = = =

Power in the wind
• Standard condition: density = 1.225 kg/m3
• A: Swept area = 𝜋𝑅2 , R: radius of the blades• U: Wind speed
KTH - EG2340 Wind Power Systems - Camille Hamon - 2014
312
P AUρ=
Power proportional to the cube of the wind speed: 10% error on the wind speed => 33% error on the power available in the wind

Generated power
• Betz limit: Max extracted power: 16/27 (=0.59) of the power inwind
• In general: less than that (additional aerodynamical losses,losses in the drive train)
- Cp(U): power coefficient = Protor/Pwind <16/27- η: Drive train efficiency= Pgen/Protor
- ηCp(U): overall efficiency = Pgen/Pwind • Cannot be higher than the rated power
KTH - EG2340 Wind Power Systems - Camille Hamon - 2014
31 162 27maxP AUρ=
31 ( )2gen pP C U AUη ρ=
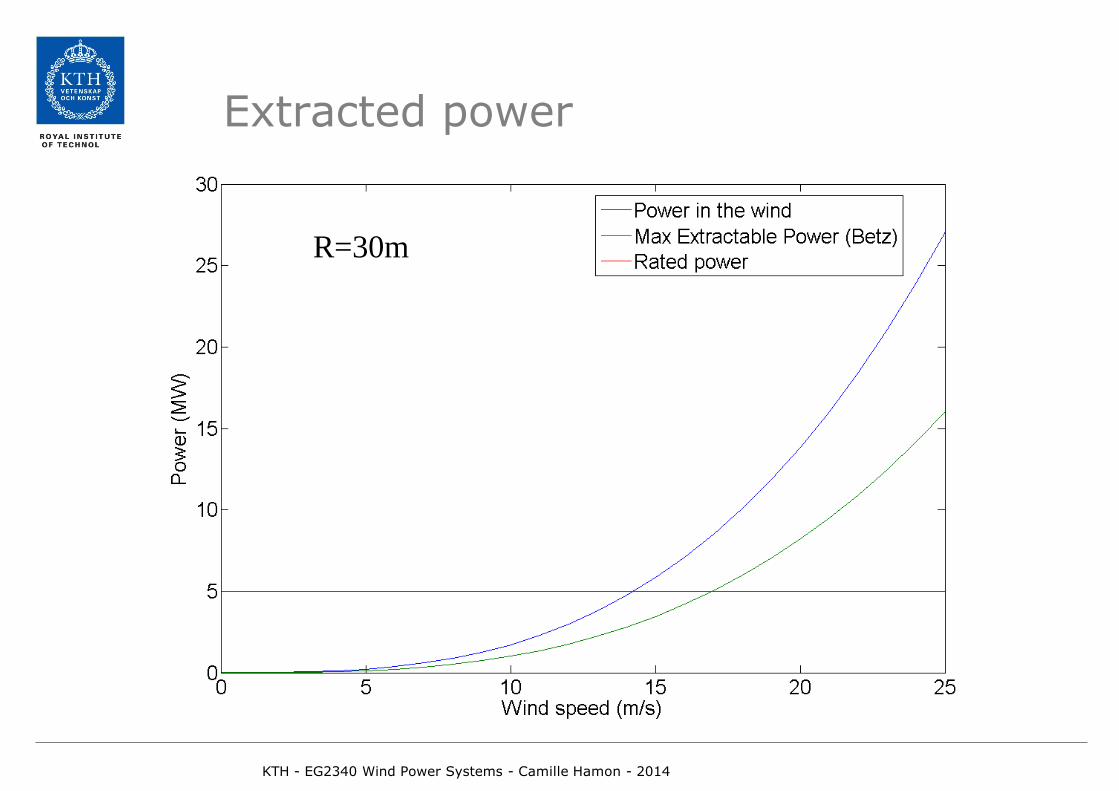
Extracted power
KTH - EG2340 Wind Power Systems - Camille Hamon - 2014
R=30m
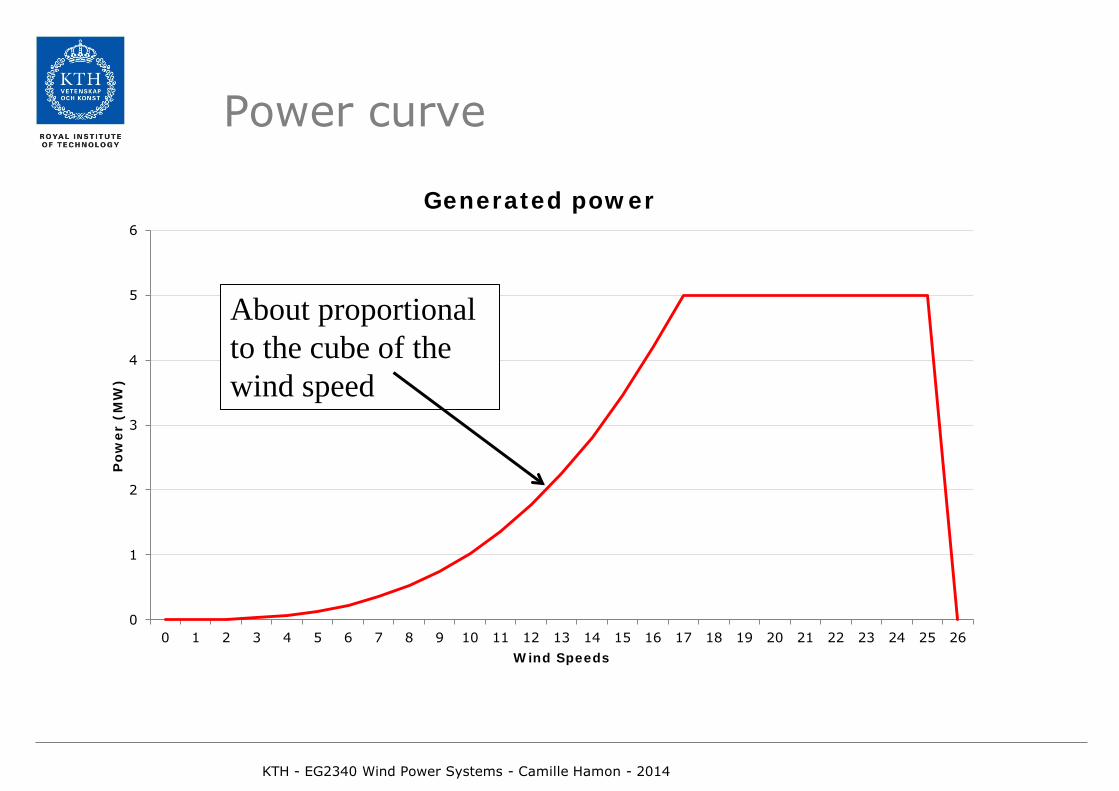
Power curve
KTH - EG2340 Wind Power Systems - Camille Hamon - 2014
0
1
2
3
4
5
6
0 1 2 3 4 5 6 7 8 9 10 11 12 13 14 15 16 17 18 19 20 21 22 23 24 25 26
Pow
er (
MW
)
Wind Speeds
Generated power
About proportional to the cube of the wind speed

Power curve
• The power curve is measuredunder standard conditions.
• Ex: air density in standardconditions: 1.225 kg/m3
• Air density varies with- Altitude - Temperature - => assignment 1
• Other local factors important:orography, turbulence, …
KTH - EG2340 Wind Power Systems - Camille Hamon - 2014
Source: Eric Hau, ”Wind turbines. Fundamentals, Technologies, Application, Economics”, Chapter 14, 2013

Agenda
• Why do we need wind measurements?• Why are accurate wind measurements so important?• Importance of long-term wind measurements• Wind measurements• Data analysis• Wind farms, wake effect and siting• Software and Example
KTH - EG2340 Wind Power Systems - Camille Hamon - 2014

Importance of long-term measurements
KTH - EG2340 Wind Power Systems - Camille Hamon - 2014

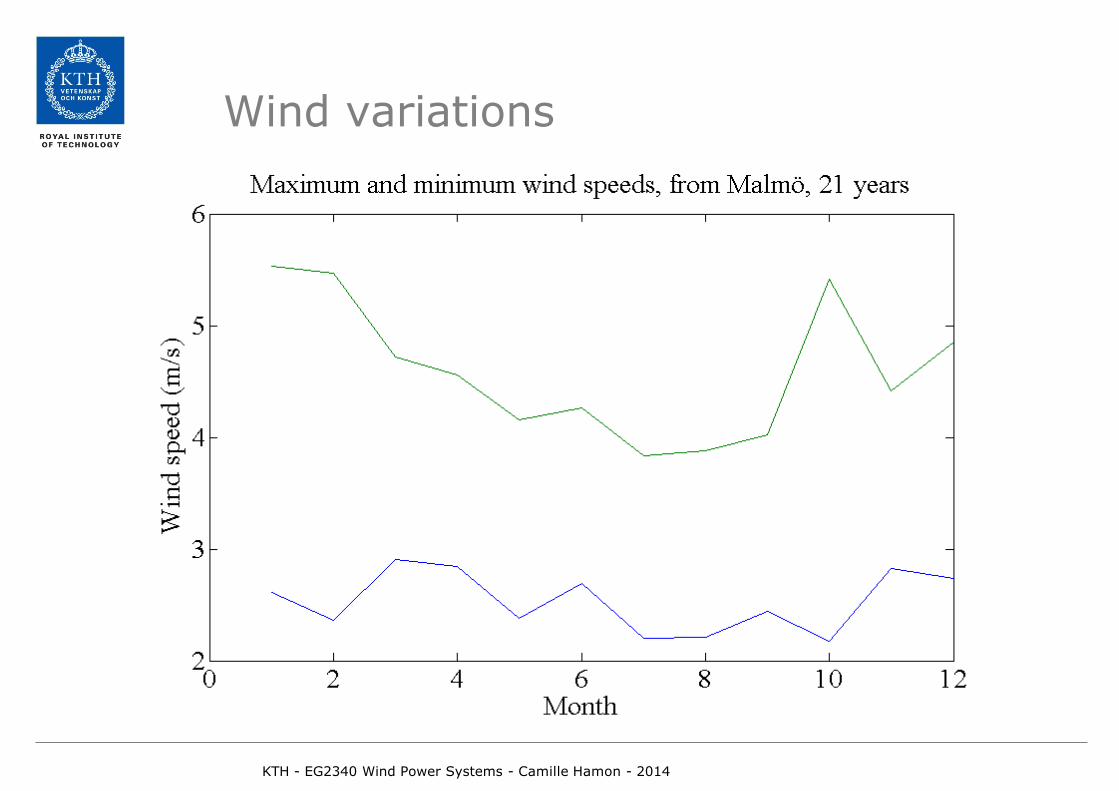
Wind variations
KTH - EG2340 Wind Power Systems - Camille Hamon - 2014
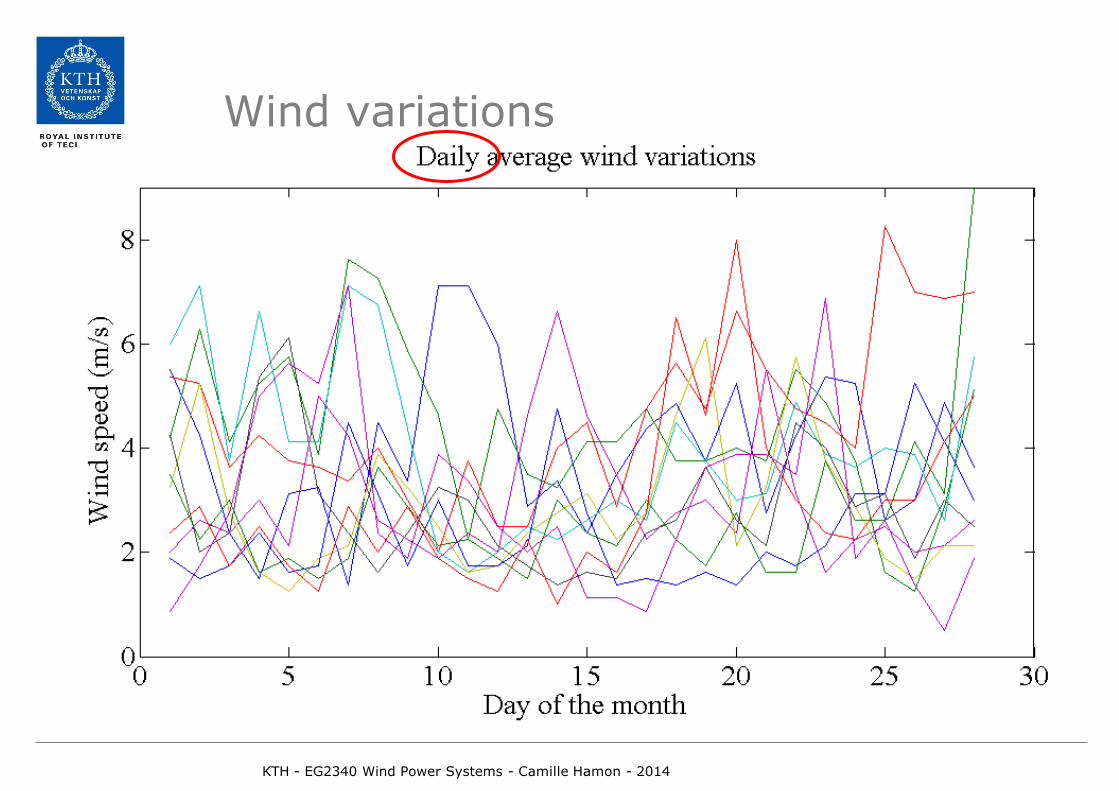
Wind variations
KTH - EG2340 Wind Power Systems - Camille Hamon - 2014

Wind variations
KTH - EG2340 Wind Power Systems - Camille Hamon - 2014

Wind variations
KTH - EG2340 Wind Power Systems - Camille Hamon - 2014
Wind variations
KTH - EG2340 Wind Power Systems - Camille Hamon - 2014

Wind variations
KTH - EG2340 Wind Power Systems - Camille Hamon - 2014
Wind variations
• The shorter the time horizon, the larger the variationsin average, because there is an averaging effect whenconsidering large time horizons.
• Important to get long-term data.
KTH - EG2340 Wind Power Systems - Camille Hamon - 2014
Agenda
• Why do we need wind measurements?• Why are accurate wind measurements so important?• Importance of long-term wind measurements• Wind measurements• Data analysis• Wind farms, wake effect and siting• Software and Example
KTH - EG2340 Wind Power Systems - Camille Hamon - 2014

Wind measurements
KTH - EG2340 Wind Power Systems - Camille Hamon - 2014

Do we need measurements?
Existing measurements from - Meteorological data close to the site: must be processed
with care: • Assumptions when the data was collected?• Height?• Roughness length, obstacles, contour of the local terrain:
must be taken into account when processing the data.• => necessity of making calculations which compensate for
the local conditions under which the meteorologicalmeasurements were made.
- Data from existing turbines close to site: excellent guide of the local wind conditions
KTH - EG2340 Wind Power Systems - Camille Hamon - 2014

Where to measure? Which site to choose?
• Wind atlas and maps:- provide estimates of wind
energy resource - Indicate general areas where
high wind resource might exist - Allow wind energy developers
to choose a general area for more detailed examination
KTH - EG2340 Wind Power Systems - Camille Hamon - 2014
Source: Hans Bergström, “Wind resource mapping of Sweden using the MIUU method”, 2007
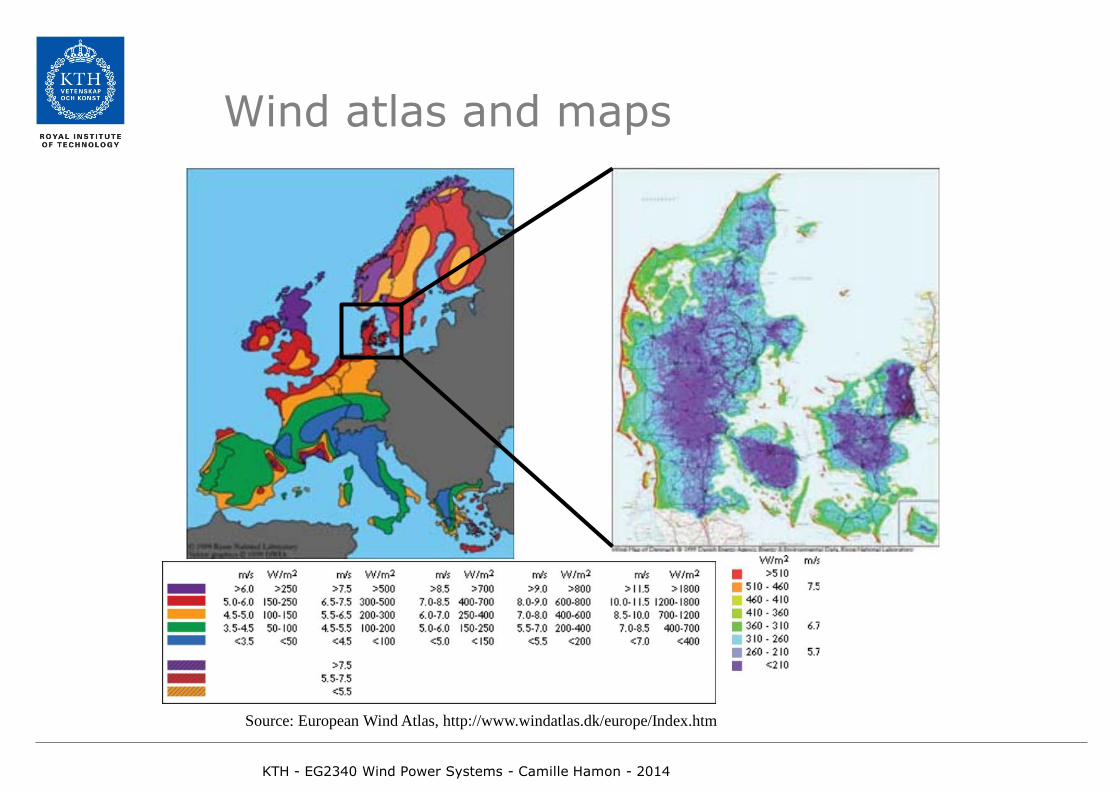
Wind atlas and maps
KTH - EG2340 Wind Power Systems - Camille Hamon - 2014
Source: European Wind Atlas, http://www.windatlas.dk/europe/Index.htm

Instruments
• Wind speed- Anemometers: they rotate with the wind and,
hence, can give a measure of the wind speed at a given height. Problem with ice/dust that can lodge in the bearing.
- LIDAR/SODAR: use the Doppler effect to measure wind speeds: • Need not be put at a given height.• No problem with ice or dust.• But more costly and less reliable.
• Wind direction: wind vane.
• If possible: 10 minute averages – for severalyears
KTH - EG2340 Wind Power Systems - Camille Hamon - 2014

Agenda
• Why do we need wind measurements?• Why are accurate wind measurements so important?• Importance of long-term wind measurements• Wind measurements• Data analysis• Wind farms, wake effect and siting• Software and Example
KTH - EG2340 Wind Power Systems - Camille Hamon - 2014
Data analysis
KTH - EG2340 Wind Power Systems - Camille Hamon - 2014

What to do with the measurements?
• Analyze the data to identifymeasurement errors (usuallystrange values such as -999).
• Scale the measurements- Remember what the wind shear
looks like (wind profile with height) - What if the measurements are
made at 20m and the hub height will be at 70m?
KTH - EG2340 Wind Power Systems - Camille Hamon - 2014
0 2 4 60
20
40
60
80Wind shear
Wind speed (m/s)
Hei
ght (
m)
Wind speed at 20m Wind speed at 70m

Scaling
• The wind shear depends on theroughness length, z0, of theterrain
• Examples- Lawn, water: z0 = 0.01 m - Bushland: z0 = 0.1 m - Towns, forests: z0 = 1m
• z0 is the height above groundat which the wind speed iszero, due to friction with theterrain
KTH - EG2340 Wind Power Systems - Camille Hamon - 2014

Scaling – logarithmic profile
• Has its origins in boundary layer flow in fluidmechanics and atmospheric research
• zref: altitude at which we know the wind speed• Uref: wind speed at zref
• z: altitude at which we want to calculate the windspeed
• U: wind speed at z (to be calculated)
KTH - EG2340 Wind Power Systems - Camille Hamon - 2014
0
0
ln( / )ln( / )re rf ef
z zUU z z
=

Logarithmic profile
0 2 4 60
20
40
60
80Wind shear
Wind speed (m/s)
Hei
ght (
m)
z0 = 1 mz0 = 0.1m
KTH - EG2340 Wind Power Systems - Camille Hamon - 2014

Scaling – Power law
• The power law is used by many wind energyresearchers.
• α: power law coefficient. Two ways to calculate it- From the reference values
- From the roughness length
KTH - EG2340 Wind Power Systems - Camille Hamon - 2014
ref ref
U zU z
α
=
( )0.37 0.088ln( )1 0.088ln /10
ref
ref
Uz
α−
=−
210 0 10 00.24 0.096log 0.016(log )z zα = + +

Power law
2 3 4 5 6 70
20
40
60
80
Wind speed (m/s)
Hei
ght (
m)
Wind shear
z0 = 1mz0 = 0.1m
KTH - EG2340 Wind Power Systems - Camille Hamon - 2014

Comparison
0 2 4 60
20
40
60
80
Wind speed (m/s)
Hei
ght (
m)
Wind shear
Power lawLogarithmic law
KTH - EG2340 Wind Power Systems - Camille Hamon - 2014

After scaling
• Draw the wind distribution:- Gather the wind speed measurements in classes ( 0-1
m/s, …, 24-25 m/s,…) - Draw an histogram showing the frequency of occurrence
of each class versus the wind speeds
• Distribution = probability of occurrence of each windspeed
KTH - EG2340 Wind Power Systems - Camille Hamon - 2014
( )?f U
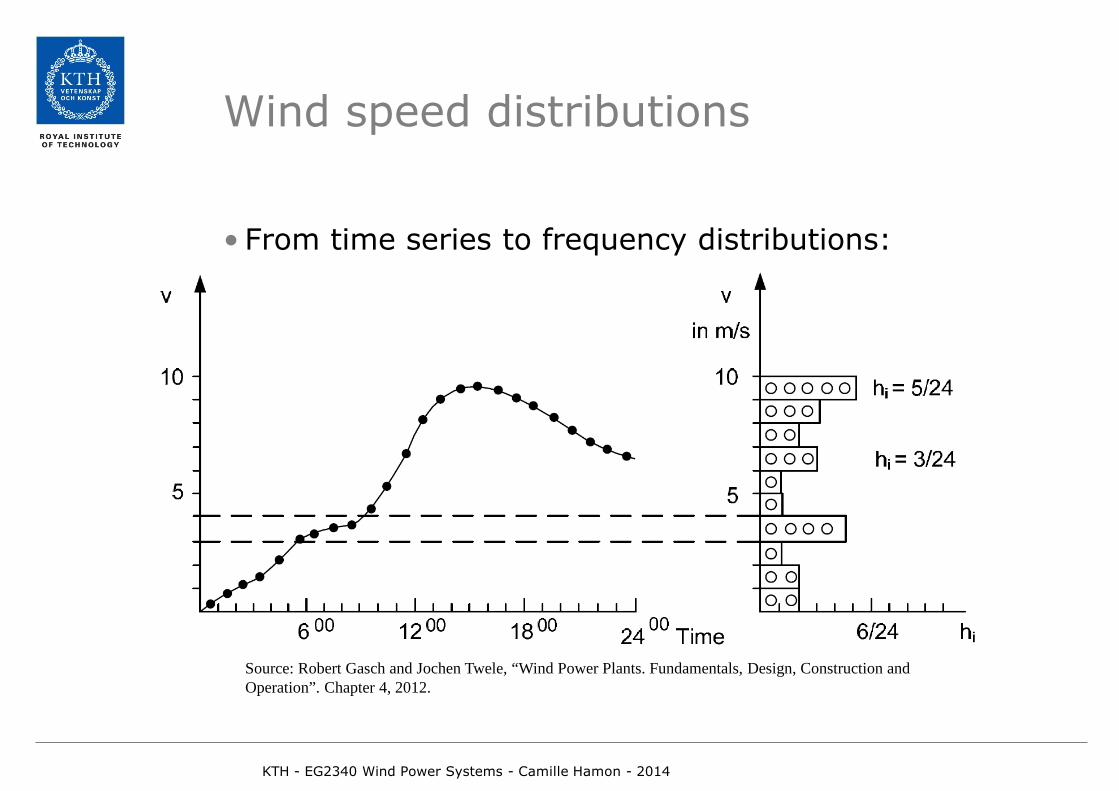
Wind speed distributions
• From time series to frequency distributions:
KTH - EG2340 Wind Power Systems - Camille Hamon - 2014
Source: Robert Gasch and Jochen Twele, “Wind Power Plants. Fundamentals, Design, Construction and Operation”. Chapter 4, 2012.

Wind speed distributions
KTH - EG2340 Wind Power Systems - Camille Hamon - 2014
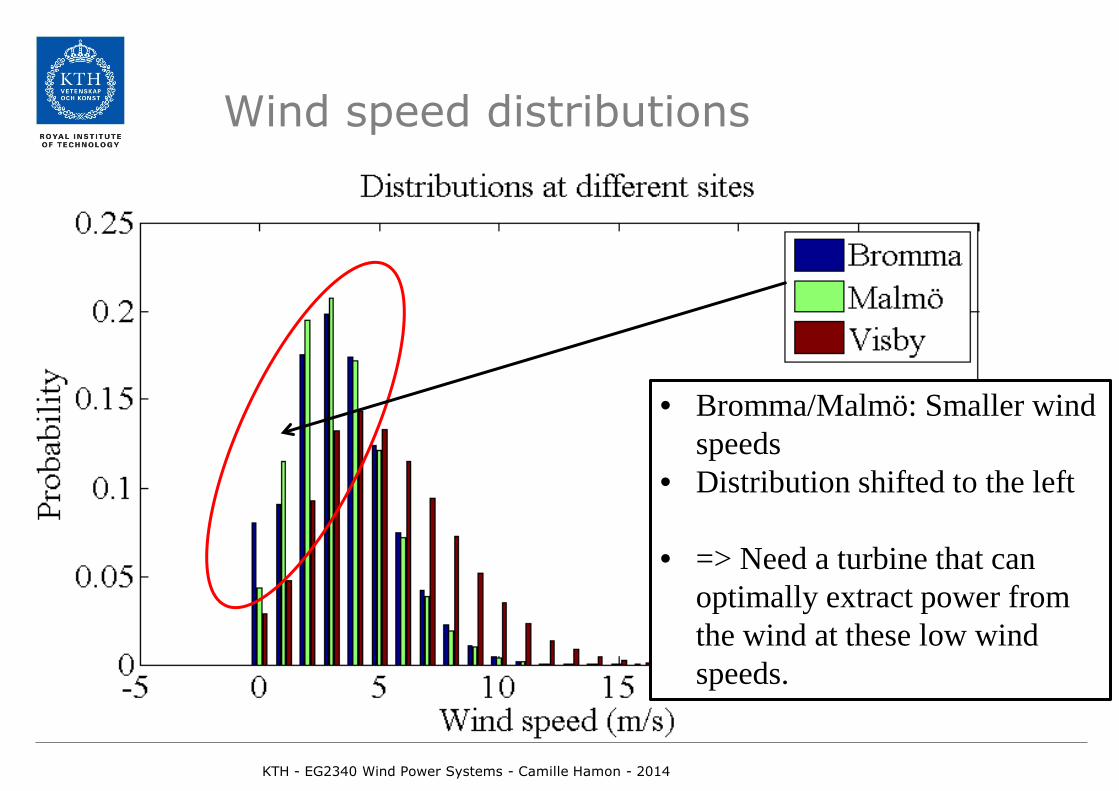
• Different sites have differentcharacteristics.
• You would not choose the sameturbines for different sites.

Wind speed distributions
KTH - EG2340 Wind Power Systems - Camille Hamon - 2014
Something is wrong!

Wind speed distributions
KTH - EG2340 Wind Power Systems - Camille Hamon - 2014
• Larger wind speeds in Visby• Distribution shifted to the
right (compared toBromma/Malmö)
• => Need a turbine thatwithstands these wind speeds
Wind speed distributions
KTH - EG2340 Wind Power Systems - Camille Hamon - 2014
• Bromma/Malmö: Smaller windspeeds
• Distribution shifted to the left
• => Need a turbine that canoptimally extract power fromthe wind at these low windspeeds.
-5 0 5 10 150
0.05
0.1
0.15
0.2
0.25
Wind speed (m/s)
Prob
abili
ty
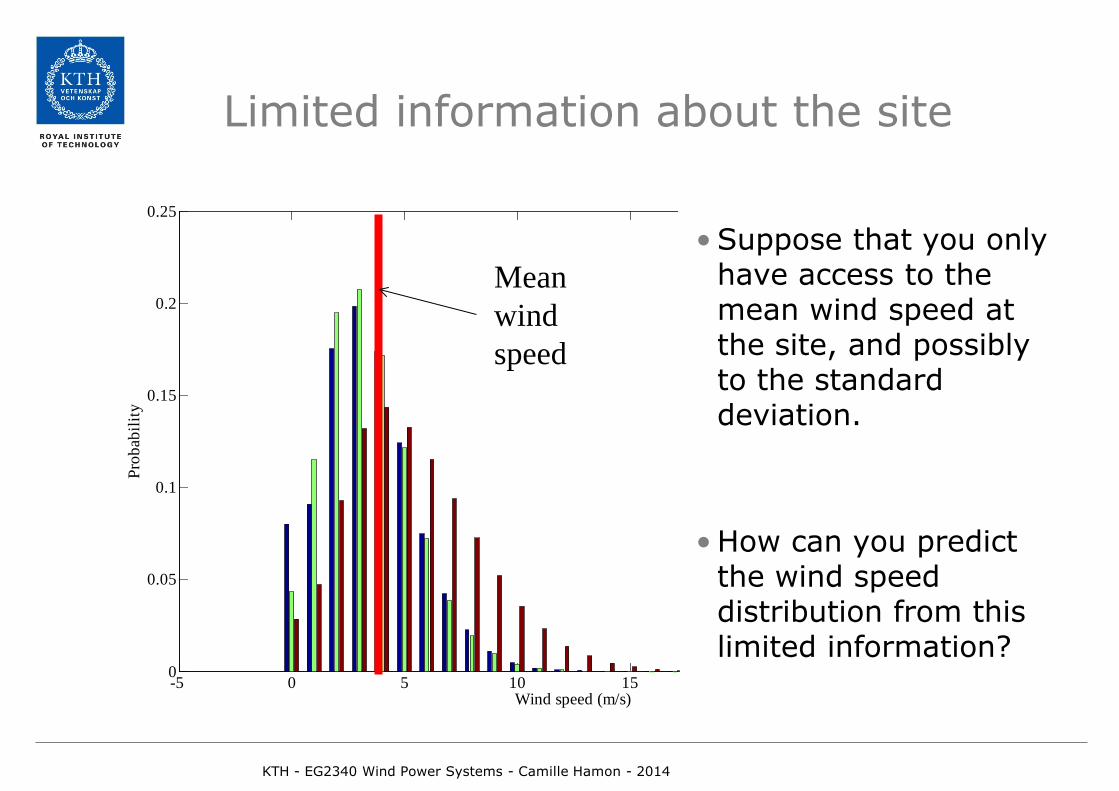
Limited information about the site
• Suppose that you onlyhave access to themean wind speed atthe site, and possiblyto the standarddeviation.
• How can you predictthe wind speeddistribution from this limited information?
KTH - EG2340 Wind Power Systems - Camille Hamon - 2014
Mean wind speed

Rayleigh distribution
KTH - EG2340 Wind Power Systems - Camille Hamon - 2014
2
2( ) exp2 4mean mean
U Uf UU U
π π = −

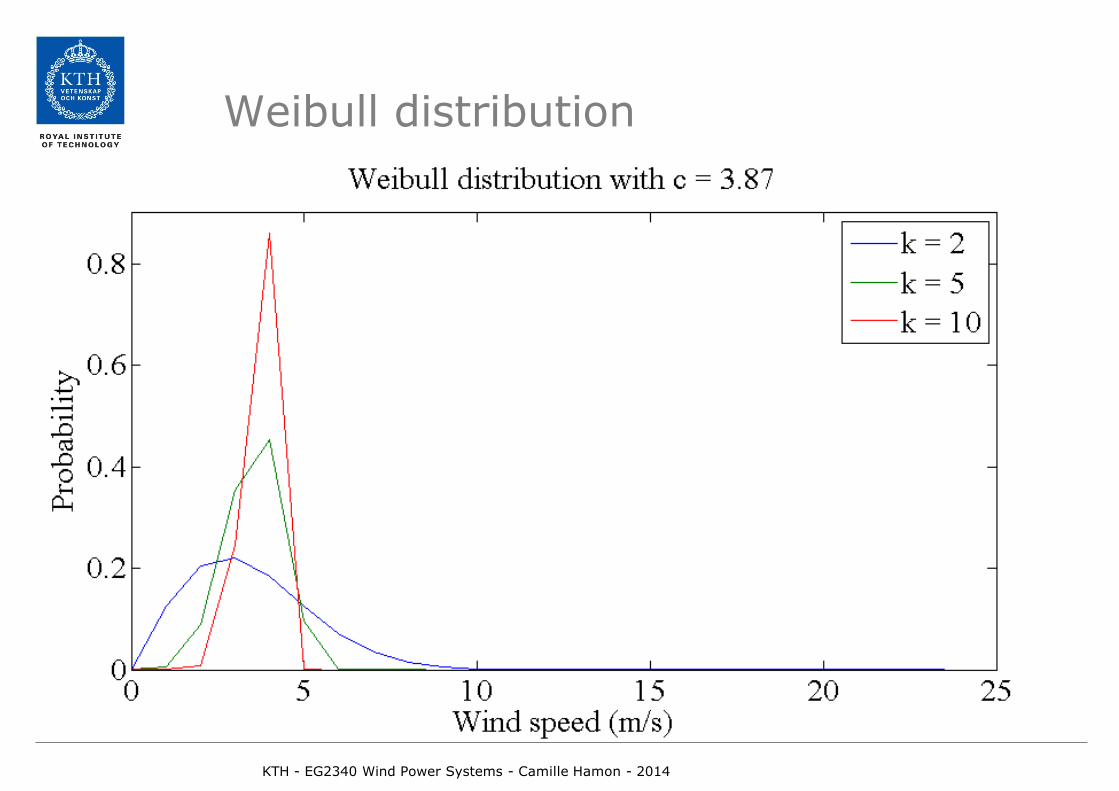
Weibull distribution
KTH - EG2340 Wind Power Systems - Camille Hamon - 2014
1
( ) expk kk U Uf U
c c c
− = −
k>0: shape parameter c>0: scale parameter
k=2 => Rayleigh distribution
Weibull distribution
KTH - EG2340 Wind Power Systems - Camille Hamon - 2014

Weibull distribution
• Calculating k and A from the mean wind speed andthe standard deviation
• The Gamma function is included in Matlab and Excel.
KTH - EG2340 Wind Power Systems - Camille Hamon - 2014
1.086
mean
UkUσ
−
=
(1 1/ )meanUc
k=Γ +

Comparison measurements vs. Rayleigh and Weibull
KTH - EG2340 Wind Power Systems - Camille Hamon - 2014
p
Data (Bromma airport)WeibullRayleigh
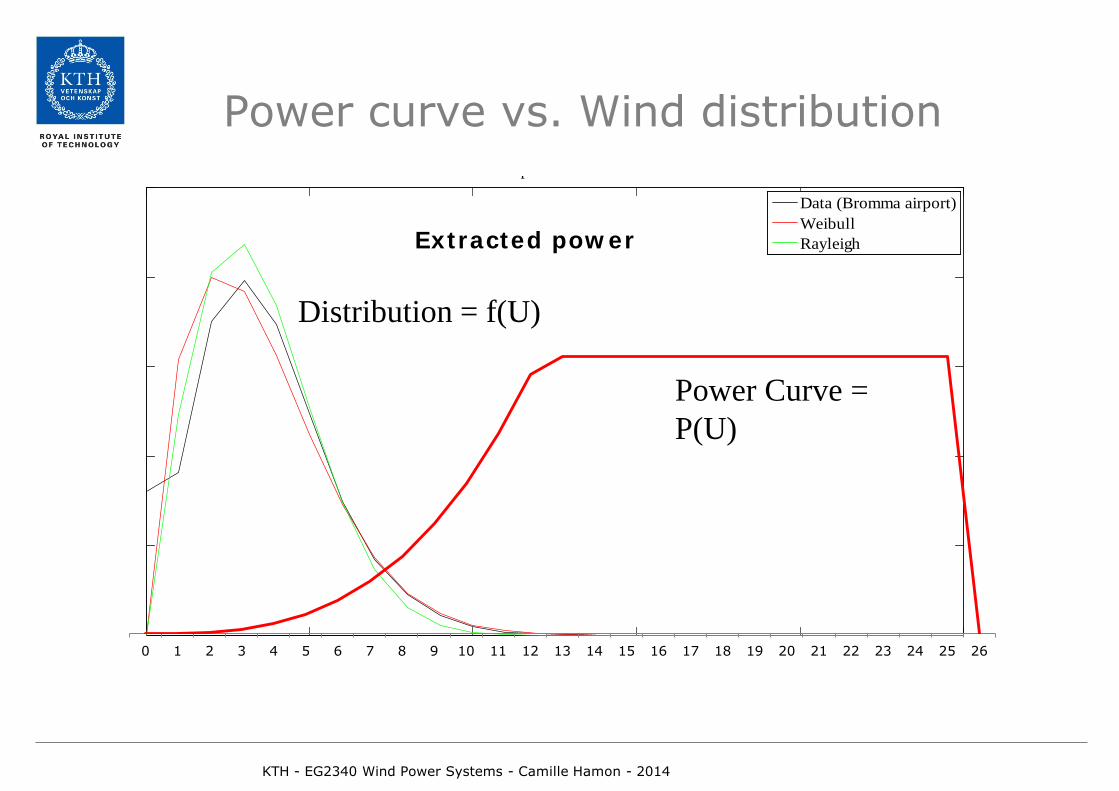
Power curve vs. Wind distribution
KTH - EG2340 Wind Power Systems - Camille Hamon - 2014
0 1 2 3 4 5 6 7 8 9 10 11 12 13 14 15 16 17 18 19 20 21 22 23 24 25 26
Extracted power
Distribution = f(U)
Power Curve = P(U)
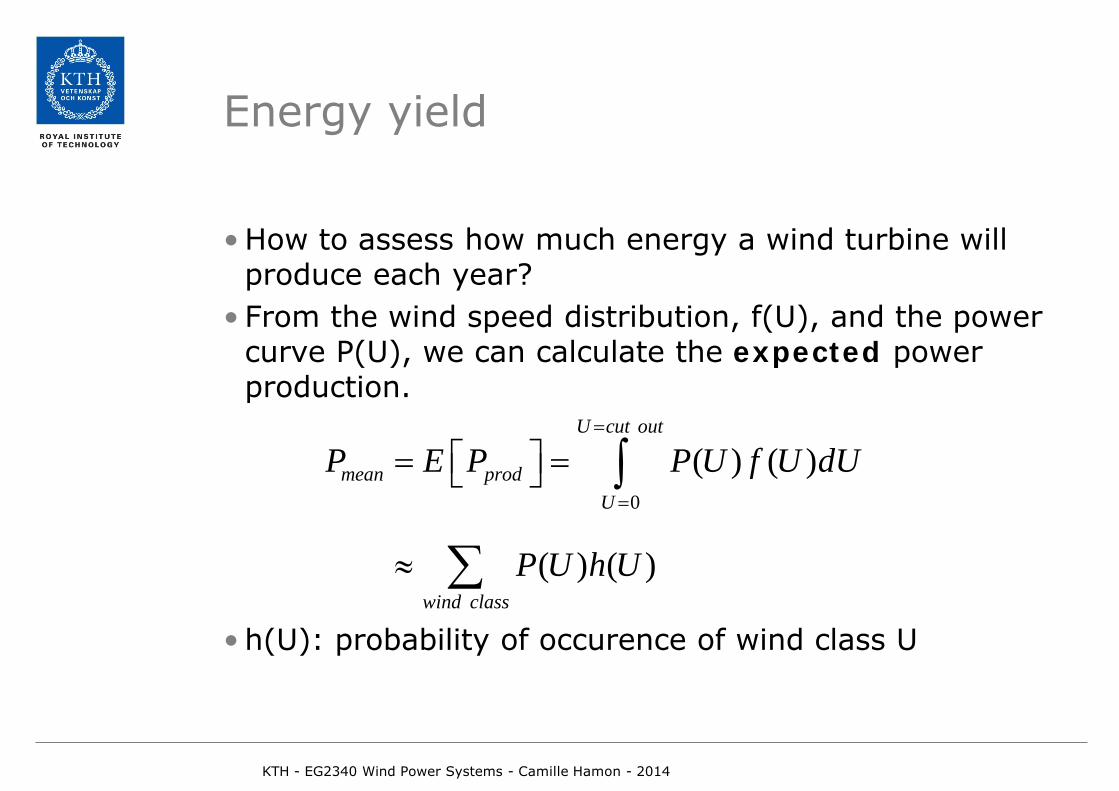
Energy yield
KTH - EG2340 Wind Power Systems - Camille Hamon - 2014
• How to assess how much energy a wind turbine willproduce each year?
• From the wind speed distribution, f(U), and the powercurve P(U), we can calculate the expected powerproduction.
• h(U): probability of occurence of wind class U
0
( ) ( )
( ) ( )
U cut out
U
wind class
mean prodP E P P U f U dU
P U h U
=
=
= =
≈
∫
∑

Energy yield
• Units:- μ: availability < 1 - h(U): probability < 1 - P(U): W / kW / MW (power) - T: usually hours (8760 hours per year for example) - E[Eprod] = expected energy yield under T: Wh, kWh,
MWh (energy)
• Example: expected yearly energy yield, assumeavailability of 98%
KTH - EG2340 Wind Power Systems - Camille Hamon - 2014
( ) ( )prod me
wind classanE E P time availability T P U h Uµ = × × = ∑
0.98 8760 ( ) ( )
wind classprodE E P U h U = ⋅ ⋅ ∑

Availability
• Accounts for stops due to maintenance, failure, …
• Onshore: Usually around 98-99%. 98% = 7.3 daysper year when the turbine is unavailable. But can havea high impact on the energy yield if these are windydays.
• Offshore: 93-95%.
• Larger than conventional sources:- Nuclear/coal: 70 – 90 % - Gas turbines: 80 - 99%
• But wind turbines do not produce at rated power. Seecapacity factor.
KTH - EG2340 Wind Power Systems - Camille Hamon - 2014

Energy yield
KTH - EG2340 Wind Power Systems - Camille Hamon - 2014
Source: Robert Gasch and Jochen Twele, “Wind Power Plants. Fundamentals, Design, Construction and Operation”. Chapter 4, 2012.
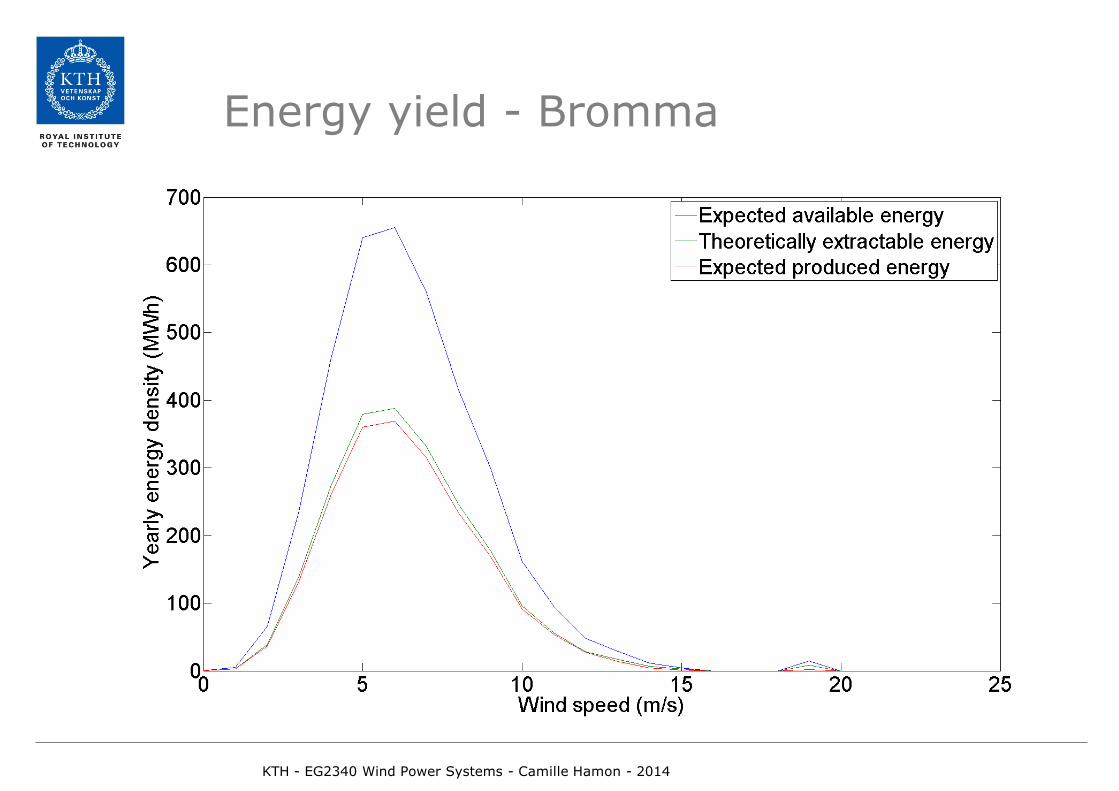
Energy yield - Bromma
KTH - EG2340 Wind Power Systems - Camille Hamon - 2014

Capacity factor
• Wind turbines do not always produce at rated power.• Capacity factor:
• Higher wind speeds => higher capacity factor• Can be used to compare different sites.
• Usually between 0.15 and 0.3
KTH - EG2340 Wind Power Systems - Camille Hamon - 2014
0
1
2
3
4
5
6
0 2 4 6 8 10 12 14 16 18 20 22 24 26
Pow
er (
MW
)
Wind Speeds
Generated power
Actual Energy ProductionHypothetical Energy Production at Rated Power
prod
rated
CF
E EP T
=
=

Capacity factor
• Bigger is not always better
• Ex: smaller rated power- => larger capacity factor but smaller energy production
• Criteria often used to assess how good a project is:- costs of produced energy: $/MWh, €/MWh, …
KTH - EG2340 Wind Power Systems - Camille Hamon - 2014

Capacity credit
• Measure the contribution of wind power to systemsecurity.
• Two ways of calculating it- How much conventional capacity can we replace while
maintaining the same level of system security?
- How much load can we add while maintaining the same level of system security?
KTH - EG2340 Wind Power Systems - Camille Hamon - 2014

Different coefficients, different definitions
• Be careful about the following notions; they aredifferent (click on the words to go to the slide ofinterest):- Availability - Power coefficient - Drive train efficiency - Capacity factor - Capacity credit
KTH - EG2340 Wind Power Systems - Camille Hamon - 2014

Agenda
• Why do we need wind measurements?• Why are accurate wind measurements so important?• Importance of long-term wind measurements• Wind measurements• Data analysis• Wind farm, wake effect and siting• Software and Example
KTH - EG2340 Wind Power Systems - Camille Hamon - 2014

Wind farms, wake effect and siting
KTH - EG2340 Wind Power Systems - Camille Hamon - 2014

Wind direction
• Wind rose: plot withinformation sorted by winddirection.
• ”Information” can be- Frequency of winds ->prevailing wind direction
- Frequency*cube of wind speeds
->prevailing direction from which most wind power comes
KTH - EG2340 Wind Power Systems - Camille Hamon - 2014

Wind rose
• Can be used to design layouts of wind farms: makemost of the wind turbines face the prevailing direction(wake effect)
KTH - EG2340 Wind Power Systems - Camille Hamon - 2014
Prevailing wind direction
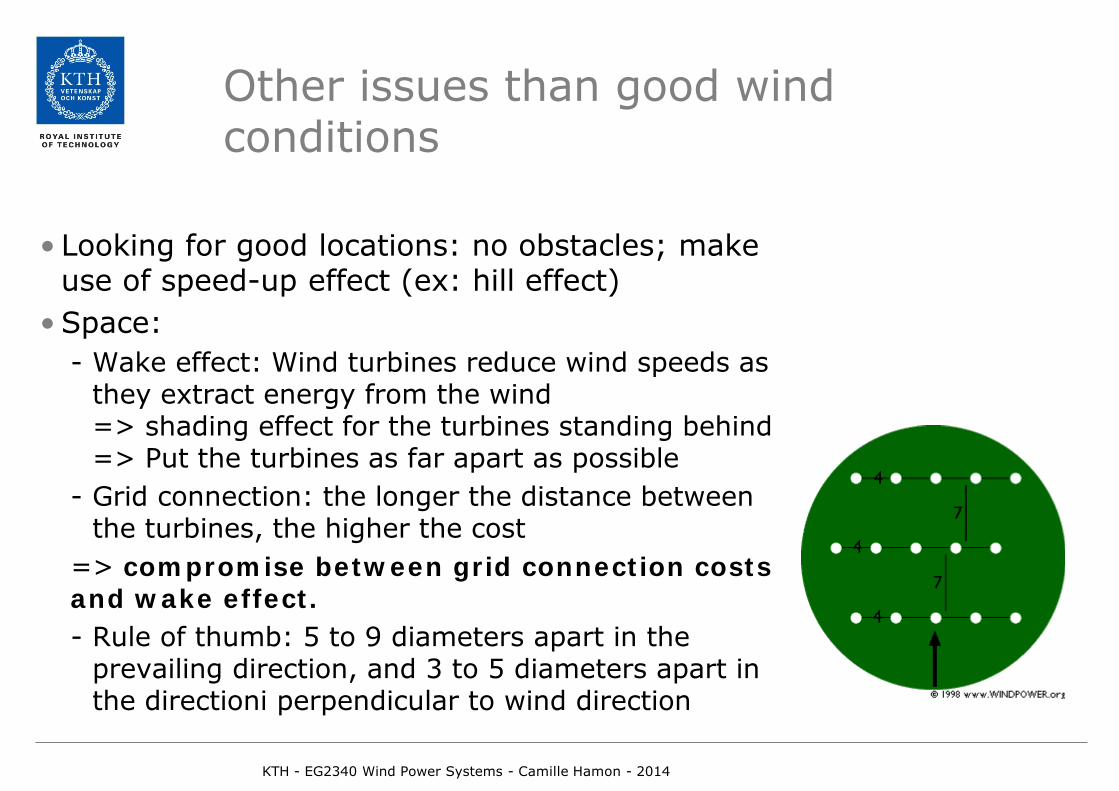
Other issues than good wind conditions
• Looking for good locations: no obstacles; makeuse of speed-up effect (ex: hill effect)
• Space:- Wake effect: Wind turbines reduce wind speeds as
they extract energy from the wind => shading effect for the turbines standing behind => Put the turbines as far apart as possible
- Grid connection: the longer the distance between the turbines, the higher the cost
=> compromise between grid connection costs and wake effect. - Rule of thumb: 5 to 9 diameters apart in the
prevailing direction, and 3 to 5 diameters apart in the directioni perpendicular to wind direction
KTH - EG2340 Wind Power Systems - Camille Hamon - 2014
Other issues than good wind conditions
• Soil conditions- Must be able to build foundations. - Accessibility of the construction site (shipment of material
with heavy trucks).
• Electrical grid- Connection point to the transmission grid as close as
possible. - Strong grid; otherwise, may need reinforcement.
• Distance to neighbouring houses
• …
KTH - EG2340 Wind Power Systems - Camille Hamon - 2014

Energy yield of a wind farm
• Wake effect: Behind a turbine the air flow is affected=> other turbines standing behind other ones do notproduce as much as the first one.
• Different wake effects for different terrains (differentroughness length).
• Different onshore and offshore.
KTH - EG2340 Wind Power Systems - Camille Hamon - 2014

Wake effect
KTH - EG2340 Wind Power Systems - Camille Hamon - 2014
Source: Robert Gasch and Jochen Twele, “Wind Power Plants. Fundamentals, Design, Construction and Operation”. Chapter 4, 2012.

Wake effect
• Many different ways of handling this effect:
- Simple coefficient:
- Energy per sector, different wake effect per sectors, sum up over the sectors
- CFD: Computational fluid dynamics
- …
KTH - EG2340 Wind Power Systems - Camille Hamon - 2014
( ) ( )wake
wind clasr d
sp oE E N T P U h Uµ µ =
∑

330 MW
1004 MW
1409 MW
1227 MW
Map
– s
ourc
e: S
kelle
fteå
Kra
ft’s
web
pag
e
SE 1
SE 2
SE 3
SE 4
Wind power in Sweden
• 1 October 2013: 3970 MWinstalled wind power capacity
• Peak Load = 27 000 MW• Others:
- Hydropower: 16 000 MW - Nuclear power: 9 360 MW - From fossil fuel: 4 666 MW - Biomass: 3 000 MW
Source: https://www.entsoe.eu/publications/statistics/yearly-statistics-and-adequacy-retrospect/Pages/default.aspx
KTH - EG2340 Wind Power Systems - Camille Hamon - 2014

Wind power variations
Year 2011
SE 1
SE 2
SE 3
SE 4
SE
KTH - EG2340 Wind Power Systems - Camille Hamon - 2014

Agenda
• Why do we need wind measurements?• Why are accurate wind measurements so important?• Importance of long-term wind measurements• Wind measurements• Data analysis• Wind farms, wake effect, siting.• Software and example
KTH - EG2340 Wind Power Systems - Camille Hamon - 2014

Software and Example
KTH - EG2340 Wind Power Systems - Camille Hamon - 2014

Software
• RETScreen• WAsP• WindPro• WindFarmer• Homer• …
KTH - EG2340 Wind Power Systems - Camille Hamon - 2014

Example – where to start?
• Where would you install awind farm in Sweden?
KTH - EG2340 Wind Power Systems - Camille Hamon - 2014

Example – where to start?
• Where would you install awind farm in Sweden?
KTH - EG2340 Wind Power Systems - Camille Hamon - 2014

Example – where to start?
• Where would you install awind farm in Sweden?
KTH - EG2340 Wind Power Systems - Camille Hamon - 2014
Let’s choose Malmö
We now need to analyze the wind conditions there.

Example – local wind conditions
• In Sweden, SMHI publisheswind measurements fromits weather stations ->www.smhi.se
KTH - EG2340 Wind Power Systems - Camille Hamon - 2014

Example – getting the data
• Download the data http://opendata-download-metobs.smhi.se/explore/
• Import it to analyze it (to Matlab, Excel, …)• Identify the wind speeds and directions in the data• Remove bad values (negative values, usually -999
indicates bad measurements)• Scale the data• Plot the distributions and wind rose.
KTH - EG2340 Wind Power Systems - Camille Hamon - 2014

Example – distribution
KTH - EG2340 Wind Power Systems - Camille Hamon - 2014

Example - scaling
KTH - EG2340 Wind Power Systems - Camille Hamon - 2014
Distribution shifted to the right because wind speed increases with altitude.
( ) ( )rr
zU z U zz
α
=

Example – comparison: wind speed
KTH - EG2340 Wind Power Systems - Camille Hamon - 2014

Example – comparison: power
0 5 10 15 20 250
0.5
1
1.5
2
2.5
3 x 10⁴
Wind speed (m/s)
Pow
er (W
att)
Power distribution (Watt)
Data (Bromma airport)WeibullRayleigh
KTH - EG2340 Wind Power Systems - Camille Hamon - 2014

Example – comparison: yearly energy yield
KTH - EG2340 Wind Power Systems - Camille Hamon - 2014

Getting the electricity price
KTH - EG2340 Wind Power Systems - Camille Hamon - 2014
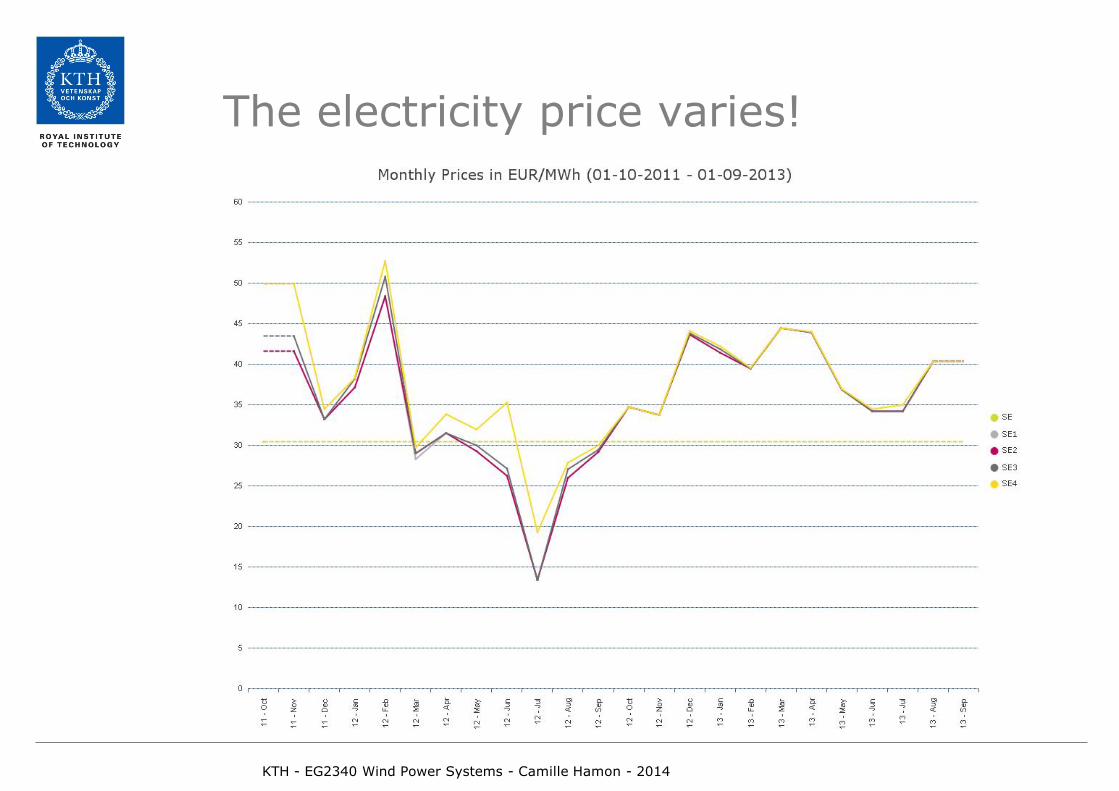
The electricity price varies!
KTH - EG2340 Wind Power Systems - Camille Hamon - 2014

Example: Yearly revenue
KTH - EG2340 Wind Power Systems - Camille Hamon - 2014