wind energy status in renewable electrical energy production in turkey
TRANSCRIPT

Renewable and Sustainable Energy Reviews 14 (2010) 2104–2112
Wind energy status in renewable electrical energy production in Turkey
Kamil Kaygusuz *
Department of Chemistry, Karadeniz Technical University, 61080 Trabzon, Turkey
Contents
1. Introduction . . . . . . . . . . . . . . . . . . . . . . . . . . . . . . . . . . . . . . . . . . . . . . . . . . . . . . . . . . . . . . . . . . . . . . . . . . . . . . . . . . . . . . . . . . . . . . . . . . . . 2104
2. Wind energy for renewable electricity . . . . . . . . . . . . . . . . . . . . . . . . . . . . . . . . . . . . . . . . . . . . . . . . . . . . . . . . . . . . . . . . . . . . . . . . . . . . . . . 2105
3. Wind power and the environment . . . . . . . . . . . . . . . . . . . . . . . . . . . . . . . . . . . . . . . . . . . . . . . . . . . . . . . . . . . . . . . . . . . . . . . . . . . . . . . . . . 2106
3.1. Environmental benefits. . . . . . . . . . . . . . . . . . . . . . . . . . . . . . . . . . . . . . . . . . . . . . . . . . . . . . . . . . . . . . . . . . . . . . . . . . . . . . . . . . . . . . 2106
3.2. Environmental impacts. . . . . . . . . . . . . . . . . . . . . . . . . . . . . . . . . . . . . . . . . . . . . . . . . . . . . . . . . . . . . . . . . . . . . . . . . . . . . . . . . . . . . . 2106
4. Global wind energy . . . . . . . . . . . . . . . . . . . . . . . . . . . . . . . . . . . . . . . . . . . . . . . . . . . . . . . . . . . . . . . . . . . . . . . . . . . . . . . . . . . . . . . . . . . . . . 2107
5. Turkey’s electrical energy status . . . . . . . . . . . . . . . . . . . . . . . . . . . . . . . . . . . . . . . . . . . . . . . . . . . . . . . . . . . . . . . . . . . . . . . . . . . . . . . . . . . . 2109
6. Wind energy in Turkey . . . . . . . . . . . . . . . . . . . . . . . . . . . . . . . . . . . . . . . . . . . . . . . . . . . . . . . . . . . . . . . . . . . . . . . . . . . . . . . . . . . . . . . . . . . 2109
7. Wind energy supports and prices . . . . . . . . . . . . . . . . . . . . . . . . . . . . . . . . . . . . . . . . . . . . . . . . . . . . . . . . . . . . . . . . . . . . . . . . . . . . . . . . . . . 2110
8. Conclusions . . . . . . . . . . . . . . . . . . . . . . . . . . . . . . . . . . . . . . . . . . . . . . . . . . . . . . . . . . . . . . . . . . . . . . . . . . . . . . . . . . . . . . . . . . . . . . . . . . . . 2111
References . . . . . . . . . . . . . . . . . . . . . . . . . . . . . . . . . . . . . . . . . . . . . . . . . . . . . . . . . . . . . . . . . . . . . . . . . . . . . . . . . . . . . . . . . . . . . . . . . . . . . 2112
A R T I C L E I N F O
Article history:
Received 2 February 2010
Accepted 10 March 2010
Keywords:
Wind energy
Renewable energy sources
Renewable electricity
Turkey
A B S T R A C T
Main electrical energy sources of Turkey are thermal and hydraulic. Most of the thermal sources are
derived from natural gas. Turkey imports natural gas; therefore, decreasing usage of natural gas is very
important for both economical and environmental aspects. Because of disadvantages of fossil fuels,
renewable energy sources are getting importance for sustainable energy development and environ-
mental protection. Among the renewable sources, Turkey has very high wind energy potential. The
estimated wind power capacity of Turkey is about 83,000 MW while only 10,000 MW of it seems to be
economically feasible to use. Start 2009, the total installed wind power capacity of Turkey was only 4.3%
of its total economical wind power potential (433 MW). However, the strong development of wind
energy in Turkey is expected to continue in the coming years. In this study, Turkey’s installed electric
power capacity, electric energy production is investigated and also Turkey current wind energy status is
examined.
� 2010 Elsevier Ltd. All rights reserved.
Contents lists available at ScienceDirect
Renewable and Sustainable Energy Reviews
journa l homepage: www.e lsev ier .com/ locate / rser
1. Introduction
There has been a significant increase in electrical energydemand due to the economical and technological developmentsover the world. The global economy grew 3.3% per year over thepast 30 years. In this period the electrical energy demand increased3.6% [1]. The electrical energy production of the world in 2007 was16,429 TWh [2] and it is estimated that the world will consume28,930 TWh in 2030 [2]. In order to supply the required electricitydemand, thousands of new power plants had to be built.
Electrical energy production has been mainly derived fromlimited sources. Because of this fossil sources will be consumed in
* Tel.: +90 462 3772591; fax: +90 462 3253196.
E-mail address: [email protected].
1364-0321/$ – see front matter � 2010 Elsevier Ltd. All rights reserved.
doi:10.1016/j.rser.2010.03.022
the future, studies on electrical energy production with renewablesources such as hydraulic, solar, wind, biomass and geothermalcontinue on with the energy saving studies at the same time. It isnow widely accepted that renewable energy sources are veryimportant for the future of the countries. The ratio of the electricpower produced via usage of renewable resources excepthydroelectricity in 2007 is only 3% and it will be intented toincrease this proportion up to 6% until 2030 [2]. It is expected thatbiomass and wind energy will have a great effect in this increase.The objective is to increase the wind energy up to 920 TWh with arate of 3% of the world electricity production in 2030 [1], which hasa 2.0% proportion in 2007 [2]. So the greatest increase will be inwind energy production. This rate reached 20% in Germany, 6% inDenmark for the year 2007 [3–5].
Wind energy is domestic, independent to abroad, naturaland infinite, obtained in the future as same amount, does not

Fig. 1. Frequency histogram and wind speed frequency Weibull representation [18].
Fig. 2. Wind rose [19].
K. Kaygusuz / Renewable and Sustainable Energy Reviews 14 (2010) 2104–2112 2105
cause acid rain or atmospheric heating, no CO2 emission, noharm to nature and human health, providing fossil fuel saving,no radioactive effect, fast technological development andcurrency gaining sources [6–8]. Turkey has very high windpotential and should benefit from this source, which has manyadvantages [9–17].
In this paper, Turkey’s existing electrical energy status isinvestigated and according to the recent developments on windenergy in the world, Turkey’s wind energy status is considered andthings to be done on this issue are stated.
2. Wind energy for renewable electricity
Choice of design parameters is critical for optimizing windturbine (WT) performance. For any fixed diameter there arevarious parameters influencing energy production: rotor rotationvelocity, blade number, aerofoil chord distribution, and long-itudinal blade twist. These parameters must be optimized bytaking into account the turbine site and local wind intensity so thewhole range of wind velocities and their direction. This distribu-tion is well known in the literature as being represented by aWeibull distribution with its relative shape and scale parameters[18].
The objective is to maximize for a given WT site its annualenergy production (AEP). By analyzing the performance para-meters of a WT, the AEP grows directly with the most part of them,whereas for other parameters the analysis is much more complex.For example, as rotational velocity increases, higher power curvevalues increase at the cost of higher cut-in values. On the otherhand, as the blade number increases, the power coefficient evenmore approaches the theoretical Betz limit [19]. Even for theaerofoil chord, it shows an energy production increasing withsmall positive variations of it. For WTs equipped with adjustableangles of attack, it is well known in the literature [19] that they canbe adjusted accordingly for power.
The choice of twist variation along the blade throughout itsrange is a much more complex task. The literature often quotes theoptimum WT design as having an angle of attack equal to the anglewhich maximizes the ratio between lift and drag coefficients at theon-design velocity. In reality WTs always work in off-designconditions, so it is not possible to obtain maximum wind energy byconsidering only one wind velocity rather than the whole range. Itis important that wind resources will be underestimated if theaverage wind speed for power calculations will be used. Ahorizontal axis wind turbine (HAWT) can be designed to maximizeAEP according to a given wind velocity distribution. Fig. 1 showsthe probability density function taken into account for the WTdesign [18].
Velocity distribution shows an annual availability of 86% and itcan be represented by a Weibull distribution (Eq. (1)) having anaverage velocity of v ¼ 4:6 m=s, shape parameter k = 1.7559, andscale parameter c0 = 5.5082 [18] as follows:
FWeibull ¼k
c� v
c
� �k�1
� exp � vc
� �k� �
(1)
Fig. 2 shows the wind rose for the proceeding distribution. Onthe other hand, the various grey tones refer to velocity intervalsreported in the tables attached to Fig. 2, the prominent winddirection being N-NE, whereas the percentages refer to thedifferent velocity intervals along that direction.
The ‘bin’ method was used to evaluate AEP. AEP is based onthe knowledge of the histogram (Fig. 1) which characterizes thewind resource of a wind site, and on the power curve, Pw, of thedesigned WT.
As reported in Ref. [18], the energy from a wind machine, Ew,may be evaluated as shown in Eq. (2) such as:
Ew ¼XN0Bj¼1
Pwðm jÞ f j Dt (2)
the data are separated in N0B bins of width w, with midpoints mj,and with fj, the number of occurrences in each bin or frequency.The data collected in Fig. 1 have N0B = 20, w ¼ 1, and mj = (j � 0.5).The data was collected over a year (Dt = 8760 h), having an annualavailability of 86%, and so Ew represents the AEP.
Fig. 3 shows in the same graph, the wind speed frequencyhistogram, the power curve of a WT and the Betz limit for powerproduction. To maximize AEP, the WT power curve must be asclose as possible to the Betz limit curve, and/or maximize the ratedpower.

Fig. 3. Histogram, power curve of a WT, and the Betz limit [18].
K. Kaygusuz / Renewable and Sustainable Energy Reviews 14 (2010) 2104–21122106
3. Wind power and the environment
3.1. Environmental benefits
Wind power is a clean, emission-free power generationtechnology. Like all renewable sources it is based on capturingthe energy from natural forces and has none of the polluting effectsassociated with ‘conventional’ fuels. On the other hand, first andforemost, wind energy produces no carbon dioxide—the maingreenhouse gas contributing to climate change during its operation,and minimal quantities during the manufacture of its equipmentand construction of wind farms. By contrast, fossil fuels such as coal,gas and oil are major emitters of carbon dioxide [20–22].
The International Panel on Climate Change’s (IPCC) 4thAssessment Report [23] leaves no doubt that climate change isboth man-made and already happening. It also warned that inorder to avert the worst consequences, global emissions must peakand start to decline before 2020. The potential of wind energy tocurb global emissions within this timeframe is therefore key for thelong-term sustainability of the power sector [1]. The power sectortoday accounts for about 40% of global CO2 emissions, while anyimprovements in the efficiency of thermal power stations are beingoffset by the strong growth in global power demand. To generatethe same amount of electricity as today’s global installed capacityof wind power would require burning more than 25 million tons ofcoal or more than 17 million tons of oil every year [2]. According tothe scenarios presented in this report, global wind energy capacitycould reach more than 1000 GW by the end of 2020, producingabout 2600 TWh of electricity per year. This would save as much as1500 million tons of CO2 every year [23].
Wind power also has a positive effect on the quality of the airwe breathe. The combustion of fossil fuels also produces the gasessulphur dioxide and nitrogen oxide, both serious sources ofpollution. These gases are the main components of the ‘acid rain’effect—killing forests, polluting water courses and corrodingfacades of buildings; not to mention the human health effects.In China, which depends for more than 80% of its electricity oncoal-fired power stations, pollution is so serious that the WorldHealth Organization estimates that it kills upwards of 650,000Chinese people per year [1,2,21].
Wind energy avoids the numerous issues associated with thediscovery and exploitation of fossil fuels. Deaths from mining, themassive destruction of strip mining and ‘hill-top removal’ and fuelspills are just some of the consequences of dependence on
recovering raw materials for electricity generation from under theground. According to the Canadian government’s environmentdepartment, air pollution causes an estimated 5000 prematuredeaths in Canada per year. Children and elderly people face thegreatest risk. Nearly 12% of Canada’s smog is the result of burningfossil fuels to produce electricity [4].
The American Bird Conservancy estimates that mining opera-tions in the states of West Virginia, Tennessee, Kentucky, andVirginia are having a massive and permanent impact on matureforest birds, including the loss of tens of thousands of breedingCerulean Warblers [20–22]. On the other hand, shortage ofsupplies of natural gas in the US has resulted in a growingdemand for coal-bed methane extraction of gas. This is coveringthe country’s western prairie with drilling wells, noisy compressorstations and wastewater pits, all of which threatens wildlifehabitats [3–5].
The European Union-funded research study [22] has examinedin detail the economic consequences for both the environment andhuman health of the different ways in which electricity is producedin the EU, and found that all renewable energy sources haveenvironmental and social benefits compared to conventionalenergy sources such as coal, gas, oil and nuclear. These benefitscan be translated into costs for society. The EU study estimated theexternal cost of gas fired power generation at around 1.1–3.0 scents/kWh and that for coal at as much as 3.5–7.7 scents/kWh, compared to just 0.05–0.25 scents/kWh for wind. The studyconcluded that the cost of producing electricity from coal or oilwould double, and from gas increase by 30%, if their external costswere taken into account [3–5].
3.2. Environmental impacts
The construction and operation of wind farms, often in ruralareas, raises issues of visual impact, noise and the potential effectson local ecology and wildlife. Wind turbines are highly visibleelements in the landscape. They need to be tall in order to catch theprevailing wind and work effectively. In comparison to otherenergy developments, however, such as nuclear, coal and gaspower stations or open cast coal mining, wind farms haverelatively little visual impact. Nevertheless, most countries witha wind power industry have established rules which excludecertain areas from development, such as national parks or naturereserves [20]. Others have identified priority areas where windpower is specifically encouraged. On the other hand, wind farm

Table 1Breakdown of operating wind capacity (Megawatts, MW) [4].
Country/continent End 2007 End 2008 Watts per capita
Germany 22,247 23,903 291.3
Spain 15,145 16,754 394.4
Denmark 3125 3245 589.4
Italy 2726 3736 48.3
UK 2406 3241 64
France 2454 3404 49
Portugal 2150 2862 285
Netherlands 1747 2225 110.6
Total Europe 57,139 65,946
USA 16,824 25,170 109.4
Canada 1846 2372 70.5
Total North America 18,670 27,542
India 7845 9645 9.8
China 5910 12,210 8.6
Taiwan 281 358 14
Total Asia 14,194 22,488
Brazil 247 341 1.9
Mexico 87 87 0.8
Total Latin America 533 629
Japan 1538 1880 12.1
Australia 824 1306 42.7
New Zealand 322 326 80.5
Total Pacific region 2733 3443
Egypt 310 365 4.7
Morocco 124 134 4.2
Iran 67 85 1.3
Total Middle East/Africa 448 467World total 93,835 120,798
K. Kaygusuz / Renewable and Sustainable Energy Reviews 14 (2010) 2104–2112 2107
developers recognise that visual impact can be a concern forneighbouring communities. Considerable effort is thereforecommitted to the planning stages in order to reduce the impactand gain their consent. This includes the use of computermodelling programs to show residents exactly how the turbineswill appear from numerous different viewpoints [3–5,20–22].
Surveys of public opinion show that most people who live nearwind developments find them less intrusive once they areoperating than they might have feared beforehand. Other surveys,for instance in Scotland, have shown that there is no evidence thattourism is seriously affected by the presence of wind farms. It isalso worth emphasizing that wind turbines are not permanentstructures. Once removed, the landscape can quickly return to itsprevious condition. Although a wind energy project can spreadacross a large total land area, it does not occupy all that space.Farming or leisure activities can still continue around the turbines.The European Wind Energy Association has estimated that thenumber of wind farms required to contribute 20% of Europe’selectricity supply would take up only a few hundred squarekilometers [3,4,21].
Compared to other types of industrial plants, wind farms areextremely quiet. Even though turbines are commonly located inrural areas, where background noise is lower, the roar of the windoften masks any sound their operation might make. Measured in arange of 35–45 decibels at a distance of 350 m from the turbines,their sound is similar to the background noise found in a typicalhome. On the other hand, the sounds emitted from wind turbinescan either be mechanical, from internal equipment such as thegearbox or yaw drive, or aerodynamic, from air moving past the rotorblades [3,21]. Modern turbine designs have effectively reducedmechanical sound through sound proofing so that the ‘‘whooshing’’aerodynamic sound is what can normally be heard. Permitted soundlevels, including the distance between turbines and the nearesthouse, are determined at a local level. All wind farms must complywith operating rules laid down by the appropriate authorities,normally based on national recommendations [3–5].
Thousands of wind turbines have been installed around theworld, many in close proximity to other types of land use, withminimal sound issues. The wind industry seeks to be a goodneighbour and addresses concerns where they arise. The mostsignificant long term threat to birds and their habitats comes fromclimate change. Global shifts in the climate are altering the patternof indigenous plant species and their attendant insect life, makingonce attractive areas uninhabitable. According to the UK’s RoyalSociety for the Protection of Birds, ‘‘recent scientific researchindicates that, as early as the middle of this century, climatechange could commit one third or more of land-based plants andanimals to extinction, including some species of British birds’’.Compared to this threat, ‘‘the available evidence suggests thatappropriately positioned wind farms do not pose a significanthazard for birds,’’ it concludes [3,4,21].
Although birds do collide with wind turbines at some sites,modern wind power plants are collectively far less harmful to birdsthan numerous other hazards. The leading human-related causesof bird kills in the United States, according to the US Fish andWildlife Service, are cats (1 billion deaths per year), buildings (upto 1 billion), hunters (100 million), vehicles (60–80 m), as well ascommunications towers, pesticides and power lines. Bird deathsdue to wind development will never be more than a very smallfraction of those caused by other commonly accepted humanactivities, no matter how extensively wind is used in the future [3–5,20–23].
Well publicised reports of bird deaths, especially birds of prey,at sites including the Altamont Pass near San Francisco and Tarifain southern Spain, are not indicative of the day to day experienceat the thousands of wind energy developments now operating
around the world. As a general rule, birds notice that newstructures have arrived in their area, learn to avoid them,especially the turning blades, and are able to continue feedingand breeding in the location. Problems are most likely to occurwhen the site is either on a migration route, with large flocks ofbirds passing through the area. Modern wind turbines, with theirslower turning blades, have proved less problematic than earliermodels [19–21].
Bird studies are routinely carried out at prospective wind sitesin order to understand the local pattern of breeding and feeding.Pre-construction wildlife surveys by a professional consultant arecommon practice. These surveys help reduce the threat to birds toa minimal level. Like birds, bats are endangered by many humanactivities, from pesticide poisoning to collision with structures toloss of habitat. Despite publicity given to bat deaths around windfarms, mainly in the United States, studies [5] have shown thatwind turbines do not pose a significant threat to bat populations. Areview of available evidence by ecological consultants concludedthat ‘‘bat collision mortality during the breeding season is virtuallynon-existent, despite the fact that relatively large numbers of batspecies have been documented in close proximity to wind plants[3,4]. These data suggest that wind plants do not currently impactresident breeding populations where they have been studied.’’
4. Global wind energy
Total installed wind power capacity reached 120,798 MW at theend of 2008 in the world as shown in Table 1 [4,5]. Fig. 4 showsinstalled wind power capacity in the world between 1996 and2007 [4,5]. There is an increasing trend in installed wind energyand average increasing rate is 30% over this period. It is estimatedthat installed wind power will be reached in 136,543 MW in 2010as shown in Table 2 [4].
Approximately 62% of the installed wind capacity of the worldis in the Europe, 22% in America and 16% in Asia. However,

Fig. 5. Top ten countries in terms of total installed wind power capacity in the world
[4].
Fig. 4. Global installed wind power capacity [4].
K. Kaygusuz / Renewable and Sustainable Energy Reviews 14 (2010) 2104–21122108
Germany has the highest installed wind capacity with 22,247 MWwhich is equal the 45% of European and 31.2% of world installedcapacity. The top ten wind energy markets are shown in Fig. 5between 2005 and 2007 [3–5,21,22].
As it is seen from Fig. 5 Germany shows the highestdevelopment in installed wind energy capacity with 26% between2005 and 2007. Spain, USA and India have also high developmentwith 28.4, 26.2 and 20.4%, respectively [4]. The average increasingrate of installed wind capacity in this term for Germany, USA, Spainand India is 36.2, 32.1, 31.1, 25.7%, respectively. The growing rateof Denmark in this term is 6.8%. According to the German WindEnergy Association, in a typical wind year, 8% of Germany’s energy
Table 2Moderate scenario for future global wind energy development [4].
Cumulative (MW) Growth rate (%) Annual included
power (MW)
2005 59,078 21 11,524
2006 71,344 19 12,266
2007 84,837 18 13,493
2008 99,862 17 15,025
2009 116,637 17 16,774
2010 136,543 16 19,905
2015 279,682 15 37,972
2020 560,445 13 77,365
2025 897,014 6 75,507
2030 1,128,707 3 58,260
2035 1,285,087 2 65,057
2040 1,399,133 1 97,737
2045 1,487,253 1 91,476
2050 1,556,901 0 70,957
Fig. 6. Installed wind power capacity by region [4].
Table 3Wind energy projections in European Union End 2008 [13].
Country Technical
potential (MW)
Installed wind
power (MW)
Austria 2000 995
Belgium 2000 312
Denmark 14,000 3180
Finland 4000 96
France 42,000 3404
Germany 12,000 23,903
Greece 22,000 985
Ireland 22,000 1002
Italy 35,000 3736
Netherlands 3000 2225
Norway 38,000 428
Portugal 7000 2862
Spain 43,000 16,754
Sweden 20,000 1021
Switzerland 1000 45
Turkey 83,000 433
UK 57,000 3241
requirement can be supplied from the wind farms, and 48,000people employed by wind energy industry in Germany. Spain, USAand Denmark supply 4, 5, 1 and 20% of their electrical energy fromwind, respectively. The highest wind energy rate in total electricalenergy belongs to the Denmark [5]. Fig. 6 shows installed windpower capacity by region.
Since wind power has significant development in electricalenergy production in the European countries and closer Turkey asgeographically [24], it is important to determine the installed windpower capacity per km2 (kW/km2), and per capita (W/capita) ofsome European countries (Table 3). Also technical potential ofwind energy, installed wind power capacity and the ratio installed
Installed wind power/
technical potential (%)
kW/km2 W/capita
42.95 9.77 100.25
8.87 5.14 16.30
24.34 72.58 582.60
2.95 0.24 15.84
2.20 1.39 12.71
156.6 51.61 222.44
2.81 4.34 53.96
2.75 7.06 130.42
5.22 5.70 22.78
42.63 29.36 76.12
0.98 0.83 60.54
15.6 11.07 101.75
25.32 19.86 250.64
2.95 1.13 57.56
1.66 0.28 1.68
0.06 0.03 0.67
2.77 5.57 22.86

Table 4Installed power capacity by resources in Turkey (MW) [30].
Resources 2003 2004 2005 2006
Fuel-oil + diesel 2222 2222 2222 2122
Imported coal 145 1355 1355 1380
Hard coal 555 555 555 555
Lignite 6763 7813 8173 10,573
Natural gas 12,582 13,352 13,352 13,382
Geothermal 15 15 15 15
Others 291 291 291 510
Total thermal 22,788 25,818 26,178 28,539
Hydraulic 12,721 13,283 14,144 14,894
Wind 19 19 19 84
Total 35,528 39,120 40,341 43,451
Table 5Estimated data of wind energy usage in Turkey [8].
Years Electric energy
consumption
(billion kWh)
Established
wind energy
power (MW)
Average
wind energy
production
(million kWh)
Its share in total
electric energy
consumption (%)
2000 134 300 640 0.47
2005 190 1300 3000 1.57
2010 260 2800 5900 2.26
2015 340 4100 10,130 2.97
2020 480 6500 15,580 3.24
2025 570 10,200 20,110 3.52
2030 660 12,500 24,865 3.76
K. Kaygusuz / Renewable and Sustainable Energy Reviews 14 (2010) 2104–2112 2109
wind power capacity to technical potential are given in Table 3[13]. As it is seen from Table 3 the ratio of installed wind power totechnical potential in Germany reached to 153.56%, the installedwind power capacity is 6427.5 MW higher than the technicalpotential. This rate in Austria, Netherlands, Spain and Denmark are40.95, 40.63, 23.32 and 22.34%, respectively. Although Turkey hasthe highest technical wind energy potential, this rate as given intable is lowest. Germany has the highest installed wind capacitybut Denmark has the highest install capacity both per km2 and percapita [3–5,13].
5. Turkey’s electrical energy status
Turkey’s total installed power capacity obtained from hydrau-lic, thermal and wind sources, is 43,451 MW at the end of the 2006a shown in Table 4. Distribution of the installed power capacity ofTurkey according to the sources is given in Fig. 7. As it is seen fromTable 4, the rate of thermal sources power plants is very high andapproximately half of these are natural gas plants. According to theestimation of Energy and Natural Sources Ministry, installed powerwould be necessary 60 GW until 2010 and 105 GW in 2020 [24–26].
The total gross electrical energy production in 2006 was168,783 GWh and changes in the production rate depended on theeconomical situations and technological developments. Averageincreasing rate was approximately 8.82% in this term [27,28].Although electrical energy production has increased gradually,there was a decrease in electrical energy production in 2001,because of industrial electrical energy demand decreased as aresult of economical crisis throughout the country [13]. However,the natural gas share of the world in production electrical energy is19.3% [2]. Since Turkey imports almost all required natural gas, thishigh rate usage in producing electricity than the world is animportant point to be examined economically [27]. On the otherhand, the share of lignite in electricity generation increases from20% in 2003 to 30% in 2006 [27]. While electrical energy productionfrom the wind has grown rapidly, in the World, especially in theEurope, usage of wind sources in Turkey is very low.
Fig. 7. Shares of installed capacity of Turkey’s electric power plants [11].
6. Wind energy in Turkey
Turkey is located between 268 and 458 east latitudes to theGreenwich, and between 368 and 428 north longitudes to theEquator. Most of the land of Turkey is in Asia and the small part is inEurope. Turkey surrounded by sea on its three borders (Aegean Seaon the west, Black Sea on the north, Mediterranean on the southand Marmara as an inner sea). Aegean, Marmara and EastMediterranean coasts have high wind potential. According tothe ‘‘Turkey Wind Map’’, prepared by General Directorate ofElectrical Power Resources (EIE), wind speed at 50 m height andoutside the residential areas, at Marmara, West Black sea, and EastMediterranean coasts and inner parts of these regions are 6.0–7.0,4.5–5.0 m/s, respectively. The north-west Aegean coasts are also7.0–8.5 m/s, and in the inner parts are 6.5–7.0 m/s [28]. In additionto this, meteorological data by the USA space studies have beenshown that Turkey has high wind capacity [5,29].
It is estimated that Turkey’s technical wind energy potential is88,000 MW, economical potential is approximately 10,000 MWdepending on the technical condition [30]. The EIE’s wind atlasreported that, Turkey’s technical wind energy potential was83,000 MW, production potential was 166 TWh/year [28,30].But, Turkey total installed wind capacity is only 1300 MW in2005 and will be 2800 MW in 2010 as shown in Table 5 [4,30].
The first wind power plant was installed in 1998 Cesme-Germiyan with 1.74 MW capacity [29]. In 1998, the ARES windfarm was built in Cesme-Alacatı and includes 12,600 kW windturbines [29,31]. The biggest wind energy power plant in Turkeyhas 10.2 MW capacity constructed in Bozcaada in 2000 [16,28].There are also some wind power plants established by privatesector to supply their electrical energy needs. These are installed inIzmir in 2003 with 1.5 MW capacity and in Istanbul in 2003 with1.2 MW capacity [26]. Installed wind power capacity for electricalenergy production is shown in Fig. 8. Figs. 9 and 10 also showscattering of wind velocity and potential of 10 m high in Turkey,respectively.
Fig. 8. Installed wind power capacity in Turkey [11].
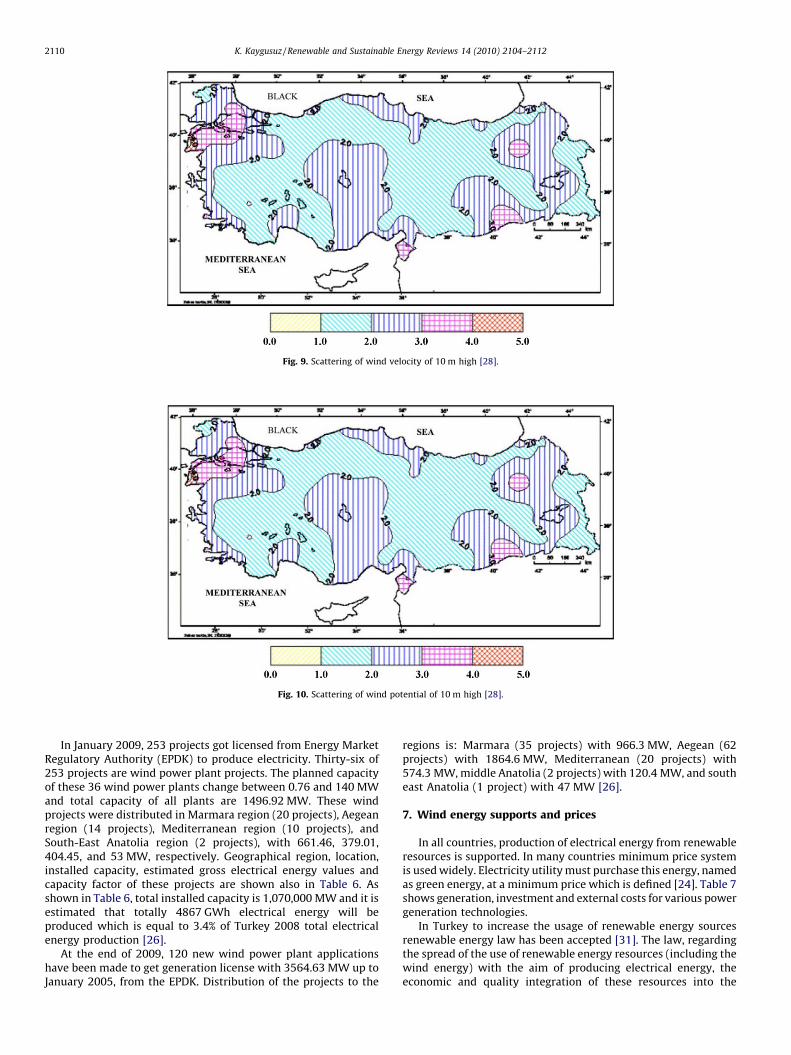
Fig. 9. Scattering of wind velocity of 10 m high [28].
Fig. 10. Scattering of wind potential of 10 m high [28].
K. Kaygusuz / Renewable and Sustainable Energy Reviews 14 (2010) 2104–21122110
In January 2009, 253 projects got licensed from Energy MarketRegulatory Authority (EPDK) to produce electricity. Thirty-six of253 projects are wind power plant projects. The planned capacityof these 36 wind power plants change between 0.76 and 140 MWand total capacity of all plants are 1496.92 MW. These windprojects were distributed in Marmara region (20 projects), Aegeanregion (14 projects), Mediterranean region (10 projects), andSouth-East Anatolia region (2 projects), with 661.46, 379.01,404.45, and 53 MW, respectively. Geographical region, location,installed capacity, estimated gross electrical energy values andcapacity factor of these projects are shown also in Table 6. Asshown in Table 6, total installed capacity is 1,070,000 MW and it isestimated that totally 4867 GWh electrical energy will beproduced which is equal to 3.4% of Turkey 2008 total electricalenergy production [26].
At the end of 2009, 120 new wind power plant applicationshave been made to get generation license with 3564.63 MW up toJanuary 2005, from the EPDK. Distribution of the projects to the
regions is: Marmara (35 projects) with 966.3 MW, Aegean (62projects) with 1864.6 MW, Mediterranean (20 projects) with574.3 MW, middle Anatolia (2 projects) with 120.4 MW, and southeast Anatolia (1 project) with 47 MW [26].
7. Wind energy supports and prices
In all countries, production of electrical energy from renewableresources is supported. In many countries minimum price systemis used widely. Electricity utility must purchase this energy, namedas green energy, at a minimum price which is defined [24]. Table 7shows generation, investment and external costs for various powergeneration technologies.
In Turkey to increase the usage of renewable energy sourcesrenewable energy law has been accepted [31]. The law, regardingthe spread of the use of renewable energy resources (including thewind energy) with the aim of producing electrical energy, theeconomic and quality integration of these resources into the
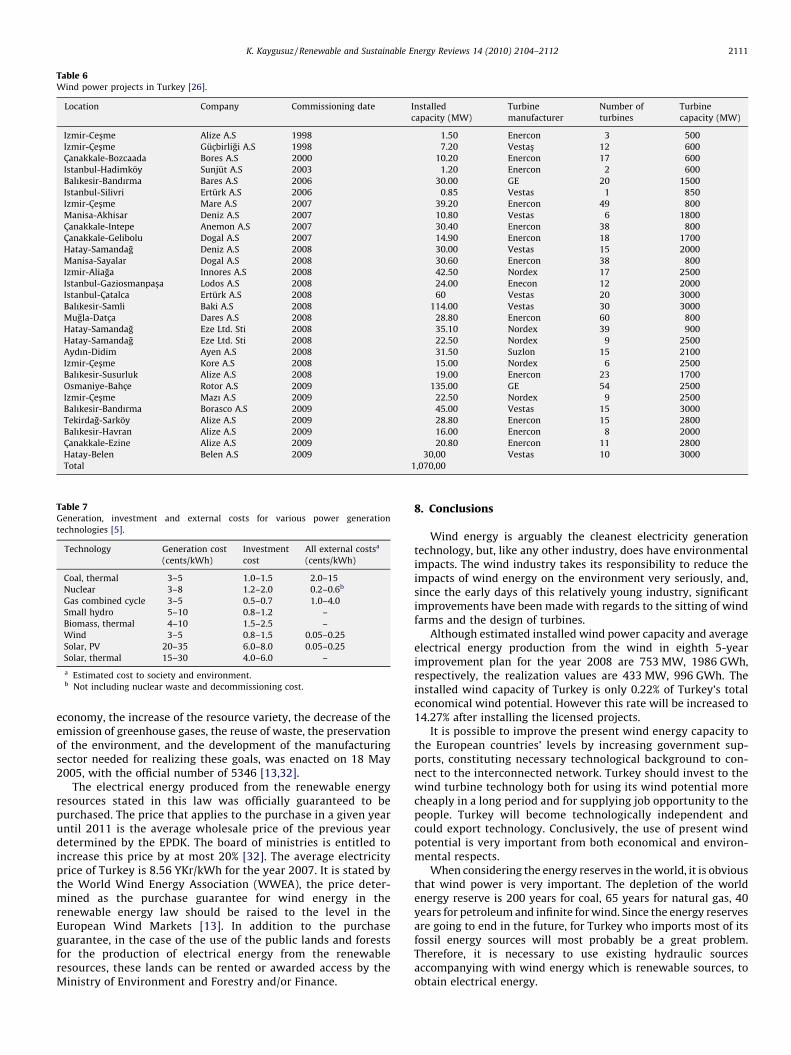
Table 6Wind power projects in Turkey [26].
Location Company Commissioning date Installed
capacity (MW)
Turbine
manufacturer
Number of
turbines
Turbine
capacity (MW)
Izmir-Cesme Alize A.S 1998 1.50 Enercon 3 500
Izmir-Cesme Gucbirligi A.S 1998 7.20 Vestas 12 600
Canakkale-Bozcaada Bores A.S 2000 10.20 Enercon 17 600
Istanbul-Hadimkoy Sunjut A.S 2003 1.20 Enercon 2 600
Balıkesir-Bandırma Bares A.S 2006 30.00 GE 20 1500
Istanbul-Silivri Erturk A.S 2006 0.85 Vestas 1 850
Izmir-Cesme Mare A.S 2007 39.20 Enercon 49 800
Manisa-Akhisar Deniz A.S 2007 10.80 Vestas 6 1800
Canakkale-Intepe Anemon A.S 2007 30.40 Enercon 38 800
Canakkale-Gelibolu Dogal A.S 2007 14.90 Enercon 18 1700
Hatay-Samandag Deniz A.S 2008 30.00 Vestas 15 2000
Manisa-Sayalar Dogal A.S 2008 30.60 Enercon 38 800
Izmir-Aliaga Innores A.S 2008 42.50 Nordex 17 2500
Istanbul-Gaziosmanpasa Lodos A.S 2008 24.00 Enecon 12 2000
Istanbul-Catalca Erturk A.S 2008 60 Vestas 20 3000
Balıkesir-Samli Baki A.S 2008 114.00 Vestas 30 3000
Mugla-Datca Dares A.S 2008 28.80 Enercon 60 800
Hatay-Samandag Eze Ltd. Sti 2008 35.10 Nordex 39 900
Hatay-Samandag Eze Ltd. Sti 2008 22.50 Nordex 9 2500
Aydın-Didim Ayen A.S 2008 31.50 Suzlon 15 2100
Izmir-Cesme Kore A.S 2008 15.00 Nordex 6 2500
Balıkesir-Susurluk Alize A.S 2008 19.00 Enercon 23 1700
Osmaniye-Bahce Rotor A.S 2009 135.00 GE 54 2500
Izmir-Cesme Mazı A.S 2009 22.50 Nordex 9 2500
Balıkesir-Bandırma Borasco A.S 2009 45.00 Vestas 15 3000
Tekirdag-Sarkoy Alize A.S 2009 28.80 Enercon 15 2800
Balıkesir-Havran Alize A.S 2009 16.00 Enercon 8 2000
Canakkale-Ezine Alize A.S 2009 20.80 Enercon 11 2800
Hatay-Belen Belen A.S 2009 30,00 Vestas 10 3000
Total 1,070,00
Table 7Generation, investment and external costs for various power generation
technologies [5].
Technology Generation cost
(cents/kWh)
Investment
cost
All external costsa
(cents/kWh)
Coal, thermal 3–5 1.0–1.5 2.0–15
Nuclear 3–8 1.2–2.0 0.2–0.6b
Gas combined cycle 3–5 0.5–0.7 1.0–4.0
Small hydro 5–10 0.8–1.2 –
Biomass, thermal 4–10 1.5–2.5 –
Wind 3–5 0.8–1.5 0.05–0.25
Solar, PV 20–35 6.0–8.0 0.05–0.25
Solar, thermal 15–30 4.0–6.0 –
a Estimated cost to society and environment.b Not including nuclear waste and decommissioning cost.
K. Kaygusuz / Renewable and Sustainable Energy Reviews 14 (2010) 2104–2112 2111
economy, the increase of the resource variety, the decrease of theemission of greenhouse gases, the reuse of waste, the preservationof the environment, and the development of the manufacturingsector needed for realizing these goals, was enacted on 18 May2005, with the official number of 5346 [13,32].
The electrical energy produced from the renewable energyresources stated in this law was officially guaranteed to bepurchased. The price that applies to the purchase in a given yearuntil 2011 is the average wholesale price of the previous yeardetermined by the EPDK. The board of ministries is entitled toincrease this price by at most 20% [32]. The average electricityprice of Turkey is 8.56 YKr/kWh for the year 2007. It is stated bythe World Wind Energy Association (WWEA), the price deter-mined as the purchase guarantee for wind energy in therenewable energy law should be raised to the level in theEuropean Wind Markets [13]. In addition to the purchaseguarantee, in the case of the use of the public lands and forestsfor the production of electrical energy from the renewableresources, these lands can be rented or awarded access by theMinistry of Environment and Forestry and/or Finance.
8. Conclusions
Wind energy is arguably the cleanest electricity generationtechnology, but, like any other industry, does have environmentalimpacts. The wind industry takes its responsibility to reduce theimpacts of wind energy on the environment very seriously, and,since the early days of this relatively young industry, significantimprovements have been made with regards to the sitting of windfarms and the design of turbines.
Although estimated installed wind power capacity and averageelectrical energy production from the wind in eighth 5-yearimprovement plan for the year 2008 are 753 MW, 1986 GWh,respectively, the realization values are 433 MW, 996 GWh. Theinstalled wind capacity of Turkey is only 0.22% of Turkey’s totaleconomical wind potential. However this rate will be increased to14.27% after installing the licensed projects.
It is possible to improve the present wind energy capacity tothe European countries’ levels by increasing government sup-ports, constituting necessary technological background to con-nect to the interconnected network. Turkey should invest to thewind turbine technology both for using its wind potential morecheaply in a long period and for supplying job opportunity to thepeople. Turkey will become technologically independent andcould export technology. Conclusively, the use of present windpotential is very important from both economical and environ-mental respects.
When considering the energy reserves in the world, it is obviousthat wind power is very important. The depletion of the worldenergy reserve is 200 years for coal, 65 years for natural gas, 40years for petroleum and infinite for wind. Since the energy reservesare going to end in the future, for Turkey who imports most of itsfossil energy sources will most probably be a great problem.Therefore, it is necessary to use existing hydraulic sourcesaccompanying with wind energy which is renewable sources, toobtain electrical energy.

K. Kaygusuz / Renewable and Sustainable Energy Reviews 14 (2010) 2104–21122112
References
[1] IEA. International Energy Agency. In: World energy outlook 2008. Paris: IEA;2008.
[2] IEA. International Energy Agency. In: World energy outlook 2009. Paris: IEA;2009.
[3] EWEA, European Wind Energy Association, Pure power, wind energy scenariosup to 2030; 2009. Available from: www.ewea.org.
[4] GWEC, Global Wind Energy Council, Global wind 2008 report. Available from:www.gwec.net/ [accessed 05.11.09].
[5] American Wind Energy Association, Global wind energy market report, Windenergy industry grows at steady pace; 2008. http://www.awea.org [accessed10.10.08].
[6] Kaygusuz K. Wind power for a clean and sustainable energy future. EnergySources Part B 2009;4:122–33.
[7] Kaygusuz K. Wind energy: progress and potential. Energy Sources 2004;26:95–105.
[8] Kaygusuz K. Developing wind energy in the European Union. Energy SourcesPart B 2006;1:9–21.
[9] Kaygusuz K. Energy use and air pollution issues in Turkey. Clean Soil Air Water2007;35:539–47.
[10] Kaygusuz K. Energy and environmental issues relating to greenhouse gasemissions for sustainable development in Turkey. Renew Sust Energy Rev2009;13:253–70.
[11] Bilgili M. A global review of wind power installations and their development inTurkey. Clean Soil Air Water 2009;37:195–202.
[12] Hepbasli A, Ozgener O. A review on the development of wind energy in Turkey.Renew Sust Energy Rev 2004;8(3):257–76.
[13] Guler O. Wind energy status in electrical energy production of Turkey. RenewSust Energy Rev 2009;13(2):473–8.
[14] Kenisarin M, Karsli VM, Caglar M. Wind power engineering in the world andperspectives of its development in Turkey. Renew Sust Energy Rev2006;10:341–69.
[15] Sahin AD. A review of research and development of wind energy in Turkey.Clean Soil Air Water 2008;36(9):734–42.
[16] Erdogdu E. On the wind energy in Turkey. Renew Sust Energy Rev 2009;13:1361–71.
[17] Alboyaci B, Dursun B. Electricity restructuring in Turkey and the share of windenergy production. Renew Energy 2008;33:2499–505.
[18] Lanzafame R, Messina M. Optimal wind turbine design to maximize energyproduction. Proc IMechE J Power and Energy 2009;223:93–101.
[19] Gash R, Twelve J. Wind power plants: fundamentals, design, construction andoperation. Germany: Solarpraxis AG; 2002.
[20] Walker JF, Jenkins N. Wind energy technology. New York: John Wiley; 1997.[21] GWEC, Global Wind Energy Council. Record installations in US, China and
Spain; 2008. Available from: www.gwec.net.[22] Energy Research. The European Commission Website on Energy Research;
2003, http://www.europa.ea.int.[23] IPPCC, Intergovernmental Panel on Climate Change. Summary for policy-
makers. In: Solomon S, Qin D, Manning M, Chen Z, Marquis M, Averyt KB,Tignor M, Miller HL, editors. Climate change 2007: the physical science basis.Contribution of Working Group I to the fourth assessment report of IPPCC.Cambridge, United Kingdom/New York, NY, USA: Cambridge University Press,2007.
[24] IEA. International Energy Agency. In: Energy policies of IEA countries, Turkey2005 Review. Paris: IEA; 2005.
[25] TEIAS, Turkish Electricity Transmission Company, Electricity statistics ofTurkey; 2008. Available from: www.teias.gov.tr.
[26] EPDK, Energy Market Regulatory Authority. Electricity market; 2009. Availablefrom: www.epdk.gov.tr [accessed date 02.04.09].
[27] Turkish Statistical Institute (TURKSTAT). http://www.tuik.gov.tr.[28] General Directorate of Electrical Power Resources (EIE), Turkey’s wind map.
http://www.eie.gov.tr [accessed date 10.07.09].[29] State Planning Organisation (DPT). 8th development plan, electrical energy
special specialisation commission report, Ankara. http://ekutup.dpt.gov.tr/enerji/.
[30] WECTNC. World Energy Council Turkish National Committee. In: Turkey’senergy report in 2005; 2006. Ankara, Turkey.
[31] Bilgili M, Sahin B, Kahraman A. Wind energy potential in Antakya andIskenderun regions, Turkey. Renew Energy 2004;29(10):1733–45.
[32] Law on utilization of renewable energy resources for the purpose of generatingelectrical energy. Law No. 5346. Official paper. Enactment Date: May 18, 2005.http://rega.basbakanlik.gov.tr/ [accessed date 05.09.08].