willie de beer - esi-africa.com | africa's leading portal for ... de beer.pdfafrican utility...
TRANSCRIPT

African Utility Week 2008, Cape Town, South Africa
Title of presentationDr Willie de Beer
Chief Operations Officer
EDI Holdings

African Utility Week 2008, Cape Town, South Africa
Are the REDs Dead?

African Utility Week 2008, Cape Town, South Africa
• Current Electricity Supply Industry Structure
• Current Situation
• Supply / Demand : In Balance or In Crises?
• Current Electricity Situation from an EDI Perspective
• EDI Maintenance Perspective
• Municipal Case Study : Maintenance and
Refurbishment Requirement
• EDI Maintenance and Refurbishment Requirement
• Technical and Non-Technical Losses
• Conclusion
Presentation Outline

African Utility Week 2008, Cape Town, South Africa
Electricity Supply Chain
Transmission LinesPOWER STATIONS
GENERATION
TRANSMISSION (765/400/275
kV)
TRANSMISSION SUBSTATION
DISTRIBUTION (132/88/66/44/33 kV)
Reticulation HV Lines 22 and 11kV
Reticulation Lines
DISTRIBUTION SUBSTATION
Distribution Lines
ReticulationLV Lines 380/220V
SERVICE CONNECTION
ELECTRICITY DISTRIBUTION INDUSTRY (EDI) FOCUS

African Utility Week 2008, Cape Town, South Africa
• Capacity Shortage
• Longer Term Problem
• Planning reserve margin currently 8–10% against 15%
aspiration (limited opportunity for maintenance)
• A number of generation units are in ‘mid-life’, thus requiring
major planned maintenance and refurbishment
• Current constraints
• Unplanned outages higher than usual
• Generator output reductions (coal quality, handling &
stockpiles)
Source: Eskom
Current situation (…1)

African Utility Week 2008, Cape Town, South Africa
• Plant performance impacted by higher load factor• Immediate Power System Security Problem• Vulnerability increased to unacceptable level – Thursday,
24 January 2008• The highest continuous load shedding of 4000 MW was
required and this compromised system protection• High load shedding due to current constraints• Coal handling problems would continue and possibly
increase with rain forecasts• Customers informed of vulnerability of system and
requested to make their processes safeSource: Eskom
Current situation (…2)

African Utility Week 2008, Cape Town, South Africa
• Current Realities• New build programme delayed• Generation assets stressed (time constraints for
maintenance)• Capacity shortages (under-frequency events,
interruptibility and load-shedding, etc)• Energy shortages more evident• Customers unhappy with industrial customers
(because of interruptibility arrangements)• Stronger economic growth (pressure for increased
supply)• Situation expected to deteriorate over next 8 years
Source: Eskom
Slide 7
Supply/Demand: In balance or In crises

African Utility Week 2008, Cape Town, South Africa
• The electricity distribution industry (EDI) is part of a broader
ESI value chain
• Challenges experienced in generations filter through to
distribution
• Current load-shedding
• These generation capacity problems will disguise
distribution challenges for some time to come
• Every ‘lights off’ moment will most likely be interpreted as
load shedding whilst it could as well be a distribution issue
Current electricity situation from an EDI perspective (…1)

African Utility Week 2008, Cape Town, South Africa
• In 5-7 years time major generation challenges will be
overcome and distribution will be exposed if nothing
happens now:
• Fragmentation and absence of economies of scale
• Maintenance backlogs
• Significant variance in tariff structure
• Inconsistent electrification performance
Current electricity situation from an EDI perspective (…2)
African Utility Week 2008, Cape Town, South Africa
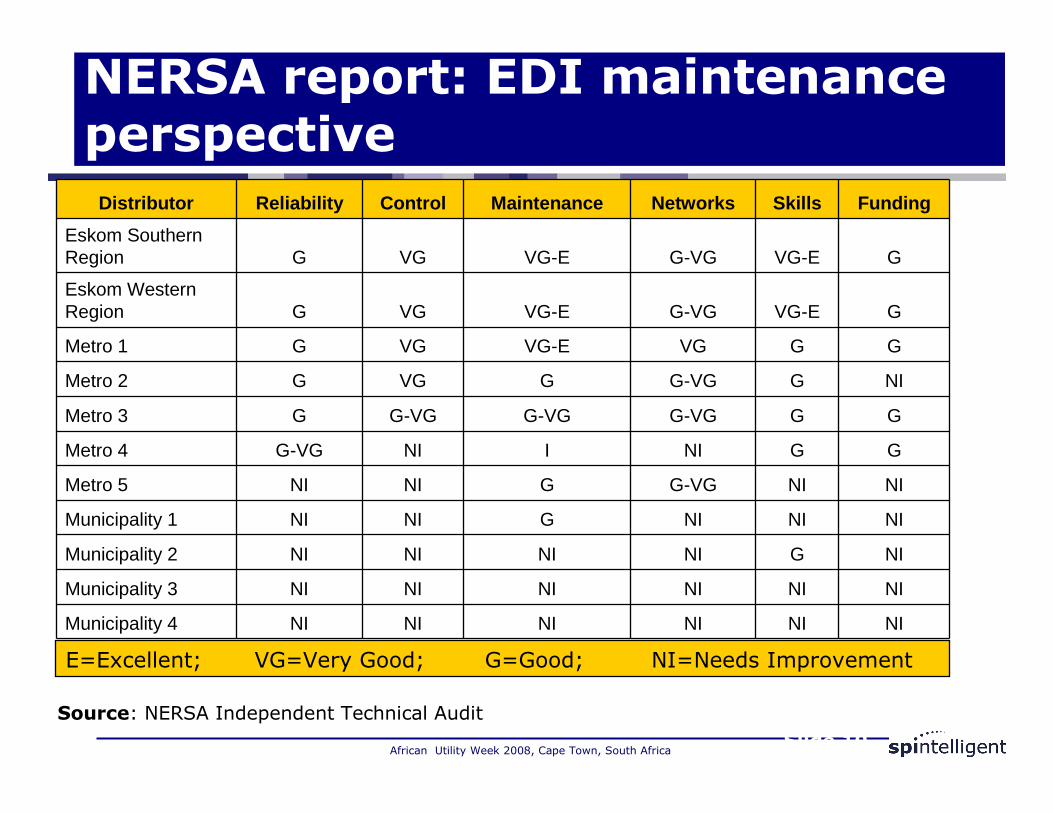
Source: NERSA Independent Technical Audit
E=Excellent; VG=Very Good; G=Good; NI=Needs Improvement
Distributor Reliability Control Maintenance Networks Skills Funding
Eskom Southern Region G VG VG-E G-VG VG-E G
Eskom Western Region G VG VG-E G-VG VG-E G
Metro 1 G VG VG-E VG G G
Metro 2 G VG G G-VG G NI
Metro 3 G G-VG G-VG G-VG G G
Metro 4 G-VG NI I NI G G
Metro 5 NI NI G G-VG NI NI
Municipality 1 NI NI G NI NI NI
Municipality 2 NI NI NI NI G NI
Municipality 3 NI NI NI NI NI NI
Municipality 4 NI NI NI NI NI NI
Slide 10
NERSA report: EDI maintenance perspective

African Utility Week 2008, Cape Town, South AfricaSlide 11
Municipal case study

African Utility Week 2008, Cape Town, South Africa
• The information is based on 2003/2004 as a base year• The combined red and blue bar indicates the total
refurbishment investment backlog• The red bar indicates the current funding allocation • The blue bar reflects the balance of the backlog still to be
addressed• The graph therefore indicates that:• Base year and projected investment suggests an under-investment in
addressing the refurbishment requirement• While it is acknowledged that the ability of the entity to generate revenue
is critical to support financial expenditure, consideration must be given to increase the refurbishment investment
• At the current rate of refurbishment investment, the current entity will not wipe out the current refurbishment backlog in the next 10 years
Municipal case study: narrative

African Utility Week 2008, Cape Town, South Africa
Municipal case study

African Utility Week 2008, Cape Town, South Africa
• The information is based on 2003/2004 as a base year
• The blue bar reflects the total maintenance and
refurbishment requirement per annum for the entity
• The red bar reflects the current maintenance and
refurbishment allocation
• The green bar reflects therefore the additional combined
maintenance and refurbishment requirement18 April 2008
Slide 14
Municipal case study: narrative

African Utility Week 2008, Cape Town, South Africa
• The graph clearly illustrates that the combined maintenance and refurbishment requirement is underfunded, which will results in an increase in maintenance and refurbishment backlog, which will filter through into the network reliability and performance
• The underfunding of the maintenance and refurbishment will result in a further increase in the plant deterioration
• Amongst a number of conclusions that can be derived from the above graph, the most critical one is that the current excessive switching of plant due to load shedding will create an accelerated deterioration of the plant status since it is notmaintained at the desired level.
18 April 2008
Slide 15
Municipal case study: narrative

African Utility Week 2008, Cape Town, South Africa
EDI refurbishment requirement

African Utility Week 2008, Cape Town, South Africa
• The information is based on 2003/2004 as a base year• The combined red and blue bar indicates the total
refurbishment investment backlog for the industry• The red bar indicates the current funding allocation • The blue bar then reflects the balance of the backlog still to
be addressed• The graph therefore indicates that:
• Base year and projected investment suggests an under-investment in addressing the refurbishment requirement
• At the current rate of refurbishment investment, the industry will not wipe out the current refurbishment backlog in the next 10 years
EDI refurbishment requirement: narrative

African Utility Week 2008, Cape Town, South AfricaSlide 18
EDI combined maintenance and refurbishment requirement

African Utility Week 2008, Cape Town, South Africa
• The information is based on 2003/2004 as a base year
• The dark blue bar reflects the current projected investment
• The red bar reflects the required combined refurbishment
and maintenance requirement
• The green bar reflects the total additional requirement
excluding the current investment
• The purple, light blue and orange is a breakdown of the
combined maintenance and refurbishment requirement as
reflected in the green bar
EDI combined maintenance and refurbishment requirement

African Utility Week 2008, Cape Town, South Africa
In addition to the lack of investment in generating capacity, the South African electricity distribution network is (according to industry experts) also in a state of critical under-investment. Eskom is responsible for 95% of generation and 100% of transmission. Distribution, however, is owned about 50-50 between Eskom itself and the “munics” (municipality-owned distribution companies). As a rule of thumb, distribution companies should be investing at a rate of about 10% of asset value per year. However, for a number of reasons beyond the scope of this report, investment rates in many (especially non-Eskom) distribution companies are as low as 1-2% per year. Thus, while much of the focus has been on generating capacity, a major threat to efficient energy supply is distribution.
UBS investment research –March 2008

African Utility Week 2008, Cape Town, South AfricaSlide 21
Technical and non-technical losses per RED

African Utility Week 2008, Cape Town, South Africa
• Losses in a utility are categorised into technical and non-technical losses.
• Technical losses: Network related losses associated with the flow of current through the conductors
• Non-technical losses: Losses normally associated with administrative processes, non-payment, incorrect billing, energy theft e.g. meter tampering
• The norm based on international research, suggest that 7% combined technical and non-technical losses is achievable
• Based on the high losses experienced in the SA industry and considering the international trends, it is regarded as realistic to do an improvement of 2% per annum
• Based on the above, the graph suggests an improvement plan over a 5 year period which will bring each of the REDs within the recommended norm of 7%
Technical and non-technical losses per RED: narrative

African Utility Week 2008, Cape Town, South Africa
Assumptions:
1.Losses are reduced from 16.64% average to a norm of 7%.2.Total Potential Savings = 6,842 GWh
Source: EDI Holdings Industry Model based on 2003/2004 figures
POTENTIAL SAVINGS GWh
Base Year Yr 1 Yr 2 Yr 3 Yr 4
Loss 11,970 10,340 8,711 7,081 6,022Potential Savings 1,629 1,629 1,629 1,059 896
Potential savings in GWh

African Utility Week 2008, Cape Town, South Africa
• Technical Losses
• Network configuration - strengthening
• Power Factor Correction
• Load balancing
• Effective maintenance
• Load flow and network capacity management
• Typical constraints:
• Large investment required
• System constraints
Slide 24
Typical strategies to reduce losses

African Utility Week 2008, Cape Town, South Africa
• Non-Technical Losses
• Metering Error Management
• Metering Audits
• Electricity theft management
• Sales report management
• Inspections
• Investment in technology, e.g. split metering
• Billing process and system improvement
• Credit control management
Typical strategies to reduce losses

African Utility Week 2008, Cape Town, South Africa
RED 1
RED 4
RED 2
RED 3
RED 6
RED 5
Provincial Boundaries
Cape Town Metro Nelson Mandela
Bay Metro
eThekwini Metro
Ekurhuleni Metro
City of Tshwane MetroCity of
Johannesburg Metro
6 wall-to-wall REDs

African Utility Week 2008, Cape Town, South Africa
CREATING SHAREHOLDERAND CUSTOMER VALUE
EFFIENCY AND CONTINIOUS BUSINESS IMPROVEMENT
REVENUE
OPERATING & CAPITAL EXPENDITURE
RED FINANCIALRED FINANCIAL
SUSTAINABILITYSUSTAINABILITY
Business model: RED sustainability

African Utility Week 2008, Cape Town, South Africa
• Promote RED sustainability
• Balance between revenue realisation and continuous
business efficiency improvement
• Close to the customer
• Decentralised focus
• Effective shareholder and stakeholder management
• Focus on, interalia:
• Technical losses
• Non-technical losses
• Effective asset management
• Staff development and skills retention
Business model: Brief summary

African Utility Week 2008, Cape Town, South Africa
• Service Provider to Service Authority (Municipalities)
• SDA as contemplated in MSA 2000 Section 81
• Distinct wires and retail focus
• Pursue appropriate best practices
• Benchmarking
• Integrated inter RED network management approach:
• Managing distribution grid integrity
• Enhance customer interface opportunities
Business model: Brief summary

African Utility Week 2008, Cape Town, South Africa
EDI Holdings Direct & Oversee EDI Restructuring
EDI Holdings Direct & Oversee EDI Restructuring
REDs x 6REDs x 6
Wires
RetailRetailShared ServicesShared Services
Industry AssociationIndustry Association
EDI interim state

African Utility Week 2008, Cape Town, South Africa
EDI Holdings Direct & Oversee EDI Restructuring
EDI Holdings Direct & Oversee EDI Restructuring
REDs x 6REDs x 6
Wires
Retail Companies x n
Retail Companies x n
Shared ServicesShared Services
Industry AssociationIndustry Association
Potential EDI future state

African Utility Week 2008, Cape Town, South Africa
2003 to 2004 2005 to 2006 2007 to Date
o EDI Holdings establishedo Eskom Distribution ringfenced
within Eskom Holdingso Boundaries for the six REDs
definedo Eskom and SALGA signed the
accession to the co-operative agreement
o EDI Holdings developed various tools to reduce cost and to facilitate the restructuring process
o Eskom Distribution (7 Regions) aligned with the boundaries of the six REDs
o RED project governance structures implemented
o Transitional Labour Relation Structure (TLRS) established
o Metros and numerous municipalities started the MSA Sect 78 process and business ringfencing
o NERSA approved (April 2006) through the MYPD R1.2bn over a 3 year period to assist in funding some of the EDI restructuring costs
o 25th October 2006 Cabinet reconfirmed support to the creation of six wall to wall REDs as Public Entities
o RED 1 was established (June 2005)as a Municipal Entity wholly owned by the City of Cape Town & liquidated by City of Cape Town during 2007
o Municipal electricity business asset transfer enabling mechanism approved by National Treasury
o Eskom Distribution 95% ringfenced
o Boundary energy metering installed as per the six RED footprint
o 120 Municipalities (ITD) signed the accession to the co-operative agreement
o 3 Metro’s & 13 municipalities completed Section 78 process
o 4 Metro’s & 13 municipalities ringfenced
o All Six RED establishment governance structures and stakeholder engagement structures established and operational
o Extensive progress towards a system solution for the future REDs
o Funding and support mechanisms in place to support readiness activities
Progress towards sustainable REDs

African Utility Week 2008, Cape Town, South Africa
Conclusion
• Never before has the environment for the establishment of
the REDs looked so promising
• The constraints that were protracting the process are well on
their way to being resolved
• The immediate focus for 2008/9 financial year will be:
• Finalising the implementation strategy
• Concluding the Deal (both design and negotiation)
• Advocating for the EDI restructuring enabling legislation and
policies to ensure rapid implementation;
• Development of a systems solutions for the industry;
Conclusion

African Utility Week 2008, Cape Town, South Africa
Conclusion
• Enhancing current asset owner readiness to transfer to the REDs
• Continued stakeholder engagement to ensure that the restructuring process is accelerated
• The current electricity challenges calls for an integrated and holistic approach to the solution from all industry players, business and citizens of this country
• A restructured Electricity Distribution Industry can only contribute to a sustainable industry:
• Support the economic growth required• Create investor confidence• Meet customer expectations
Conclusion