william h. frey the brookings institution america’s changing racial diversity from the bottom up
TRANSCRIPT

William H. FreyWilliam H. Frey
The Brookings The Brookings InstitutionInstitution
www.brookings.edu/experts/www.brookings.edu/experts/freywfreyw
America’sAmerica’s Changing Racial Changing Racial
DiversityDiversityFrom The Bottom UpFrom The Bottom Up

Source: William H. Frey analysis
US: Population by Age: 2010 US: Population by Age: 2010 and 2050and 2050
0
50,000
100,000
150,000
200,000
250,000
300,000
350,000
400,000
450,000
2010 2050
65+
45-54
20-44
Under 20
13%
20. %

Source: William H. Frey analysis
US: Population by Race: 2010 US: Population by Race: 2010 and 2050and 2050
0
50,000
100,000
150,000
200,000
250,000
300,000
350,000
400,000
450,000
500,000
2010 2050
White
Black
Asian
HispanicOther
64%
46%

Source: William H. Frey analysis
US Growth by Age 2000-10
211
3
-9
19
50
1812
-20
-10
0
10
20
30
40
50
60
0- 14 15-24 25-34 35-44 45-54 55-64 65-74 75+

Source: William H. Frey analysis
Median Ages of Race-Ethnic Median Ages of Race-Ethnic GroupsGroups
41
3430
27
20
05
1015202530354045
Whites Asians Blacks Hispanics 2+Races

Source: William H. Frey analysis
Race Ethnic SharesRace Ethnic Shares
63.712.2
16.31.9
4.7
White Black Am Indian AsianHawaii Othr Race 2+ Races Hispanic
5.0
15.9
13.7
8.3
55.5
2010 Population
2000-10 Growth
Source: William H. Frey analysis
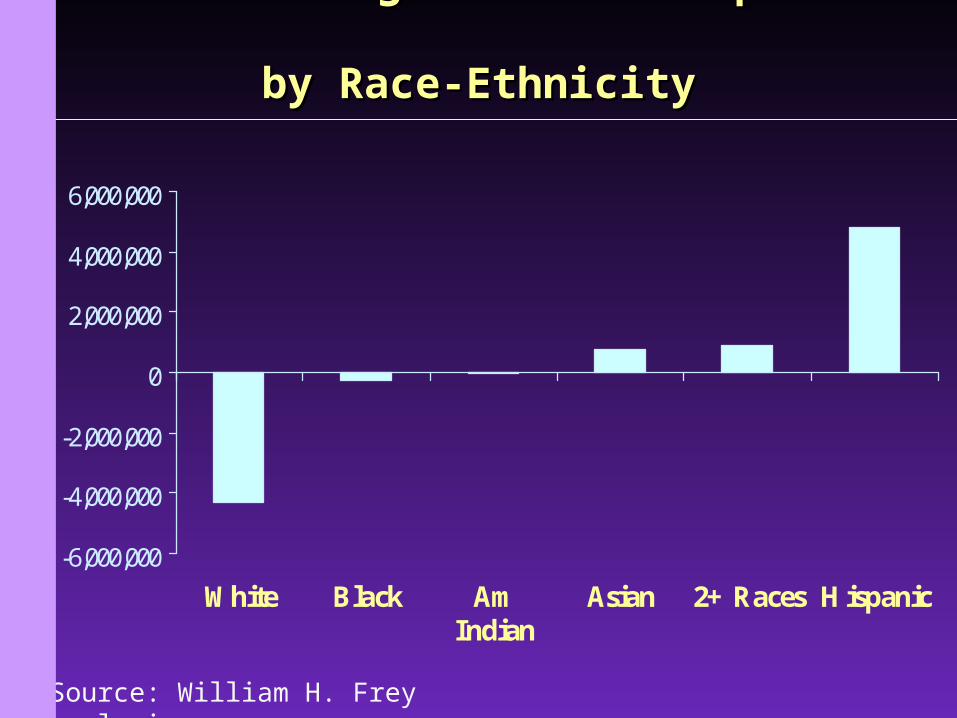
2000-2010 Change in Child Population 2000-2010 Change in Child Population
by Race-Ethnicityby Race-Ethnicity
-6,000,000
-4,000,000
-2,000,000
0
2,000,000
4,000,000
6,000,000
White Black AmIndian
Asian 2+ Races Hispanic

Source: William H. Frey analysis
Source: William H. Frey analysis
Children : 2015-2040Children : 2015-2040
53 51 49 46 44 42
0%
20%
40%
60%
80%
100%
2015 2020 2025 2030 2035 2040
White Black Asian/ other Hispanic
Source: William H. Frey analysis
Source: William H. Frey analysis
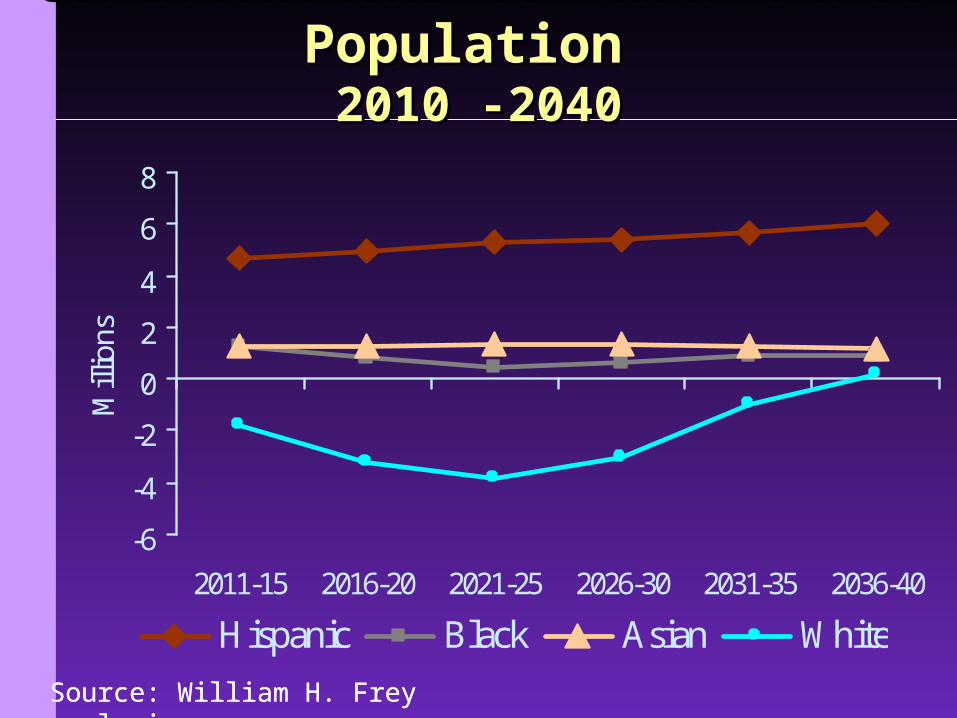
Contributions to Labor Force Contributions to Labor Force Population Population 2010 -20402010 -2040
-6
-4
-2
0
2
4
6
8
2011-15 2016-20 2021-25 2026-30 2031-35 2036-40
Mill
ions
Hispanic Black Asian White

Source: William H. Frey analysis
Source: William H. Frey analysis
Contributions to Labor Contributions to Labor Force Force 2010-2020 (in millions)2010-2020 (in millions)
23.5
9.6
-5
-6-4-202468
1012
White Black Asian/ Other Hispanic

Source: William H. Frey analysis
Source: William H. Frey analysis
Labor Force Ages: 2015-Labor Force Ages: 2015-20402040
62 60 57 54 52 50
0%
20%
40%
60%
80%
100%
2015 2020 2025 2030 2035 2040
White Black Asian/ other Hispanic

Source: William H. Frey analysis
NCES, US Dept of Education
HS Dropout Rates: Age 16-HS Dropout Rates: Age 16-2424
34.3
11.5 11.56.1
3.0
05
10152025303540
HispanicForeignBorn
HispanicNativeBorn
Blacks Whites Asians

Source: William H. Frey analysis
15.5
35.9 35.3
45.7
64.6
010203040506070
HispanicForeignBorn
HispanicNativeBorn
Blacks Whites Asians
Pew Hispanic Center
College Enrollment Rate: College Enrollment Rate: Age 18-24Age 18-24

Source: William H. Frey analysis
Education by Race-EthnicityEducation by Race-Ethnicity
52
22 18 10 14
10 17 1831
50
0%10%20%
30%40%50%60%70%
80%90%
100%
HispanicForeignBorn
HispanicNativeBorn
Black White Asian
Less then HS HS grad Some College College Grads
Pew Hispanic Center

Source: William H. Frey analysis
25% and above
10.0% to 24.9%
5.0 to 9.9%
Under 5%
Hispanic Hispanic Concentrations 2010Concentrations 2010
Data source: William H. Frey analysis of Census2010
Percent of County Population

Source: William H. Frey analysis
Black Concentrations Black Concentrations 20102010
Percent of County Population25% and above
10.0% to 24.9%
5.0% to 9.9%
Under 5% Data source: William H. Frey analysis of Census2010

Source: William H. Frey analysis
Source: William H. Frey analysis
State Growth in Child Population, State Growth in Child Population, 2000-102000-10
Under age 18
Growth 5% and over
Growth under 5%
Decline under 5%
Decline 5% and over

Source: William H. Frey analysis
Source: William H. Frey analysis
Percent Minority Children, 2010
GT 50%
40% - 50%
25% - 40%
Under 25%

Source: William H. Frey analysis
Percent Children with Immigrant Percent Children with Immigrant ParentsParents
0
10
20
30
40
50
60
CA NY NV AZ FL NJ TX US
Ist Gen 2nd Gen
51%
35% 35% 34% 32% 31% 31%
23%

Source: William H. Frey analysis
Children Speaking Other than Children Speaking Other than EnglishEnglish
Source: William H. Frey analysis
GT 20%10% - 20%6% - 10%Under 6% * Ages 5 - 17

Source: William H. Frey analysis
US Growth by Age 2000-10
211
3
-9
19
50
1812
-20
-10
0
10
20
30
40
50
60
0- 14 15-24 25-34 35-44 45-54 55-64 65-74 75+

Source: William H. Frey analysis
Source: William H. Frey analysis
Median Ages for States, Median Ages for States, 20102010
40 and over
38 to 40
36 to 38
Below 36

Source: William H. Frey analysis
Senior Population Shifts: 3 Senior Population Shifts: 3 DecadesDecades
((1000s)1000s)
0
2,000
4,000
6,000
8,000
10,000
12,000
Young Elderly Old Elderly
2000 - 2010 2010 - 2020 2020- 2030
(65 - 74) (75 +)
Source: William H. Frey analysis
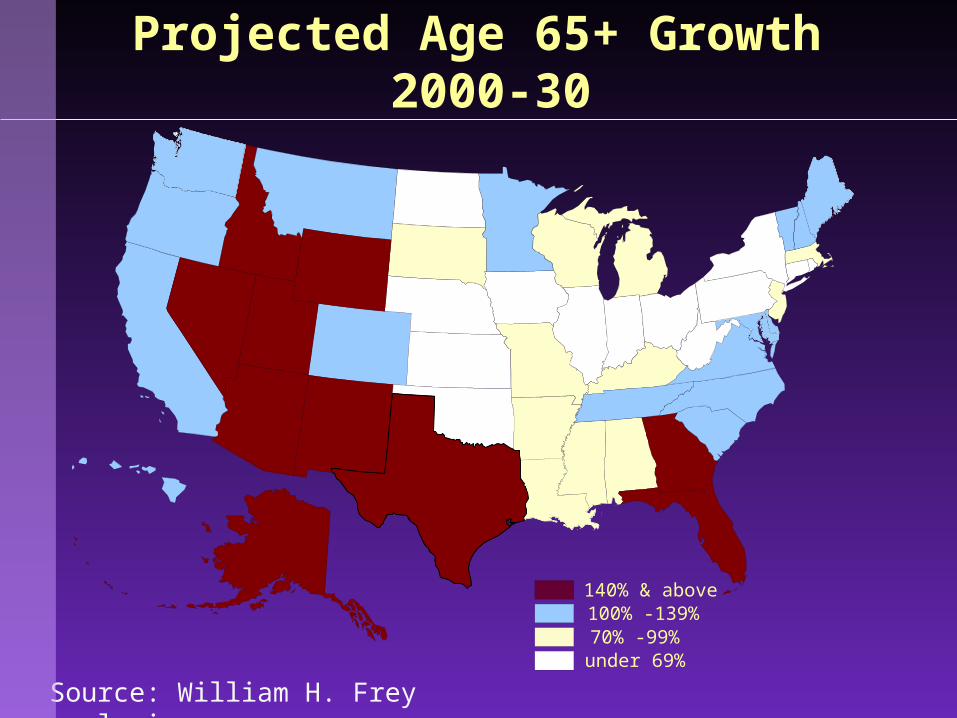
140% & above100% -139%70% -99%under 69%
Projected Age 65+ Growth 2000-30

Source: William H. Frey analysis
Source: William H. Frey analysis
23.520.2
51.7 48.4
0
10
20
30
40
50
60
Married Couples Married Couples withChildren
2000 2010
Share of all US Households Share of all US Households 2000 and 20102000 and 2010

Source: William H. Frey analysis
6255 55
32
61
52 49
28
0
10
20
30
40
50
60
70
Asians Whites Hispanics Blacks2000 2010
Source: William H. Frey analysis
Married Couples as Share of All Married Couples as Share of All HouseholdsHouseholds

Source: William H. Frey analysis
Source: William H. Frey analysis
Projected Race-Ethnic Shares, Projected Race-Ethnic Shares, 2010-302010-30
54 50 46
0%10%20%30%40%50%60%70%80%90%
100%
2010 2020 2030
Children
80 76 71
0%10%20%30%40%50%60%70%80%90%
100%
2010 2020 2030
Seniors
white
Black
Asian/Other
Hispanic

Source: William H. Frey analysis
Source: William H. Frey analysis
Cultural Generation GapsCultural Generation Gaps Difference in White Percent: Seniors Difference in White Percent: Seniors
minus Childrenminus Children
25 and above
20 to 25
15 to 20
Below 15

Source: William H. Frey analysis
Useful WebsitesUseful Websites
www.CensusScope.org/2010www.CensusScope.org/2010 Census Census
www.frey-demographer.orgwww.frey-demographer.org