william h. frey the brookings institution hispanics and the changing racial demographics of the...
TRANSCRIPT

William H. FreyThe Brookings Institution
Hispanics and the Changing Racial Demographics
of the Intermountain West
www.frey-demographer.org

2008: Greater Minority Turnout and Share of the Voter Population
“Fast-Growing” and “Slow-Growing” Purple States
Where did Minorities Win the Election for Obama?
Current Demographics and Polling in the Mountain West

Source: William H. Frey analysis of National Election Poll and VNS
Democratic Margins by Race
-17
77
2012
-12
91
3627
-40-30-20-10
0102030405060708090
100
Whites Blacks Hispanics Asians
2004 2008

Source: William H. Frey analysis of CPS November 2004, 2008 supplements
Number of Voters: 2004, 2008millions
7.6
2.8
14.0
9.7
3.6
16.1
0
10
20
Blacks Hispanics Asians
2004 2008

22%
25%53%
Under Age 18 Age 18+, Non Citizen Eligible Voters
Source: William H. Frey analysis CPS November 2008 Supplement
Eligible Voters as Share of Total Population:
* Non Hispanics
30%
66% 4%
45%42%
13%
Whites* Blacks* Hispanics Asians*
21%
77%
2%
Source: William H. Frey analysis of CPS November 2004, 2008 supplements
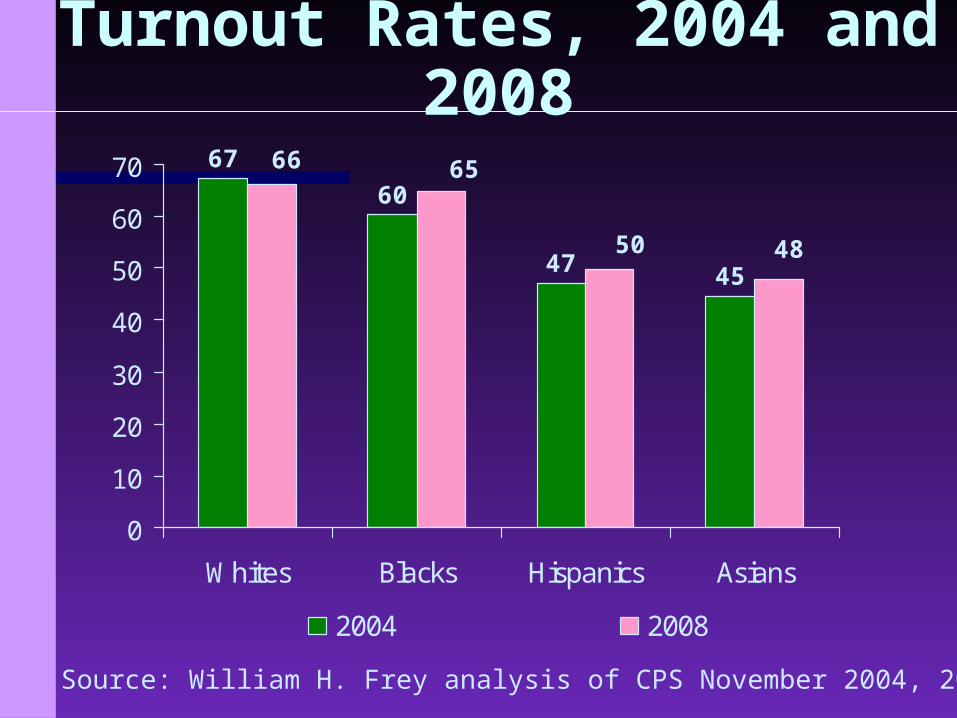
Turnout Rates, 2004 and 2008
60
47 45
67 65
50 48
66
0
10
20
30
40
50
60
70
Whites Blacks Hispanics Asians
2004 2008

Source: Lopez and Taylor, Pew Hispanic Center, 2009
Turnout Rates, 18-29 Year Olds
50
3632
52
58
4143
52
0
10
20
30
40
50
60
Whites Blacks Hispanics Asians
2004 2008
Source: William H. Frey analysis of CPS November 2004, 2008 supplements
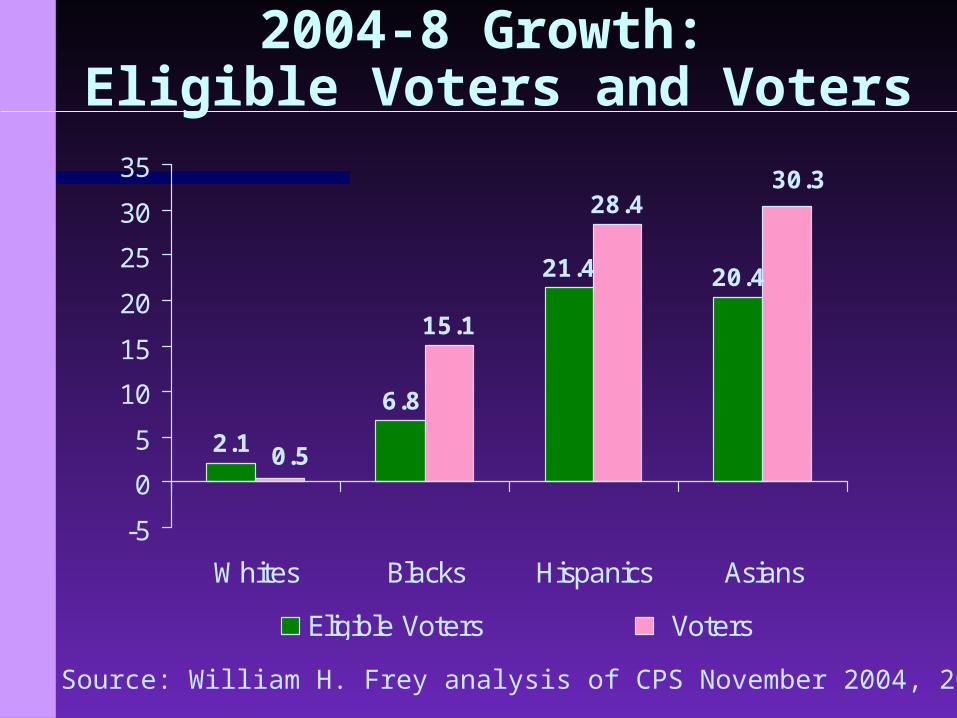
2004-8 Growth: Eligible Voters and Voters
2.1
6.8
21.4 20.4
15.1
28.4
0.5
30.3
-5
0
5
10
15
20
25
30
35
Whites Blacks Hispanics Asians
Eligible Voters Voters
Source: William H. Frey analysis of CPS November supplements
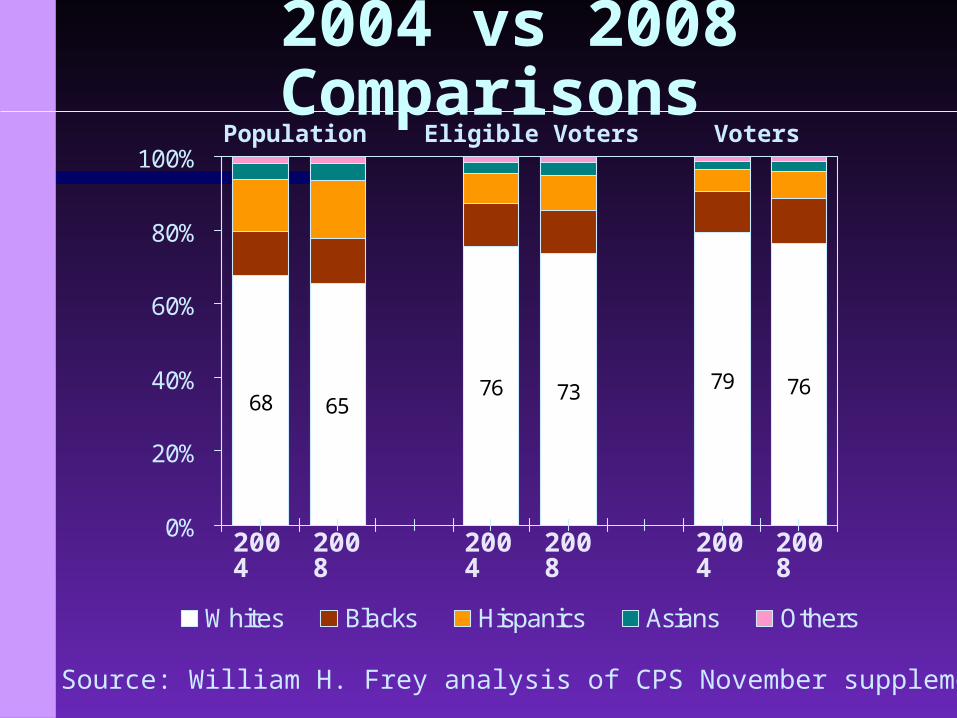
2004 vs 2008 Comparisons
68 6576 73 79 76
0%
20%
40%
60%
80%
100%
Whites Blacks Hispanics Asians Others
Population Eligible Voters Voters
2004
2008
2004
2008
2004
2008

6
10
9
15
12
12
34
14
16
17
18
21
24
32
37
40
47
9
20
21
0 10 20 30 40 50
Illinois
New York
New Jersey
Colorado
Florida
Nevada
Arizona
California
Texas
New Mexico
Voters Population
Source: William H. Frey analysis of CPS November 2008 supplement
Hispanic Shares 2008 Populations, Voters
States With Largest Hispanic Share Populations

Source: William H. Frey analysis
Blue Red and Purple States, 2008
Solid Blue
Solid Red
Purple-Dem
Purple-Rep
Source: William H. Frey analysis
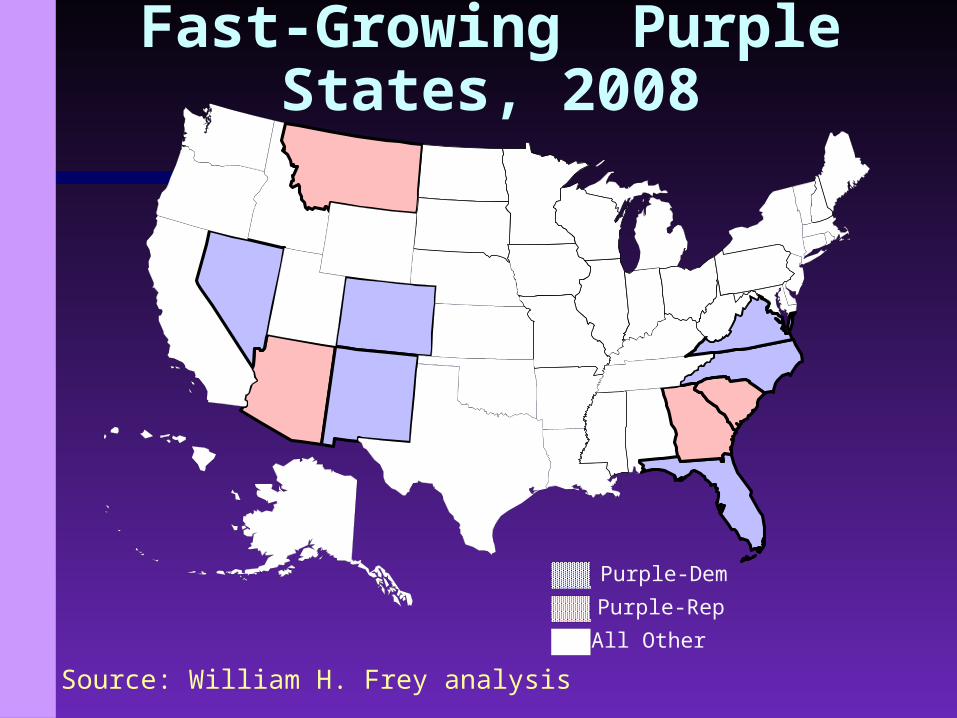
Fast-Growing Purple States, 2008
Purple-Dem
Purple-Rep
All Other

Source: William H. Frey analysis
Slow-Growing Purple States, 2008
Purple-Dem
Purple-Rep
All Other
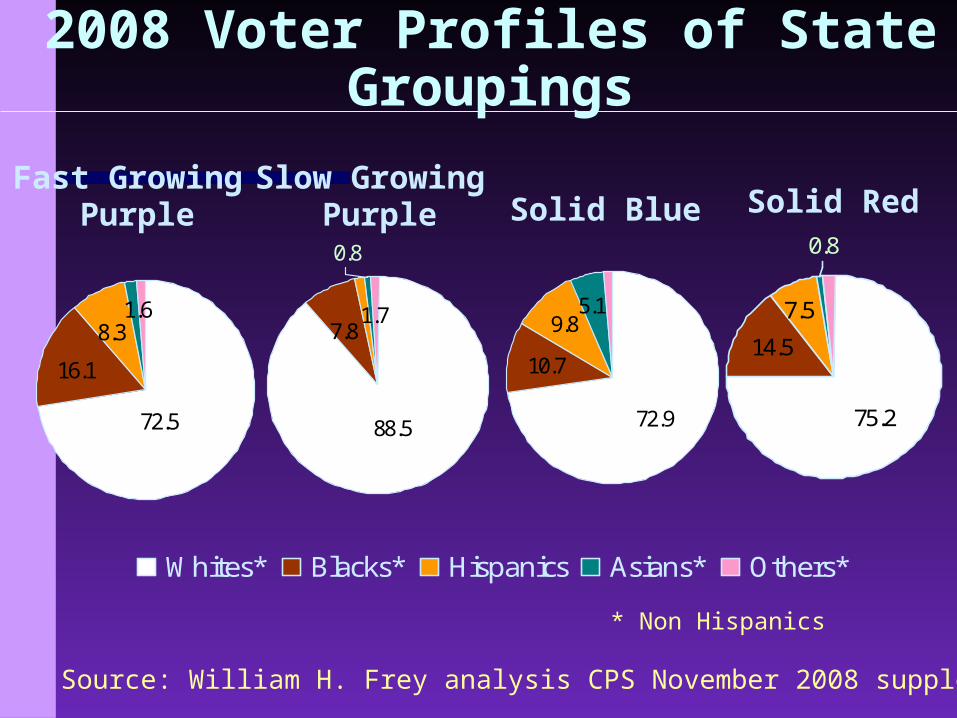
75.2
0.8
7.5
14.5
Whites* Blacks* Hispanics Asians* Others*
88.5
0.8
7.81.7
Source: William H. Frey analysis CPS November 2008 supplement
2008 Voter Profiles of State Groupings
* Non Hispanics
Fast Growing Purple Solid Red
72.5
1.68.3
16.1
72.9
5.1
10.7
9.8
Slow Growing Purple Solid Blue

Source: William H. Frey analysis of CPS November 2004, 2008 supplements
“Fast-Growing” vs “Slow-Growing”
Purple State Growth, 2004-8
7.8
36.8
28.0
41.8
8.3 8.3
-1.7
12.6
-505
101520253035404550
Whites Blacks Hispanics Asians,Other
Fast Growing Slow Growing

Source: William H. Frey analysis of CPS November Supplements
Nevada, New Mexico Voters: 2004, 2008
8073
56 55
0%
10%
20%
30%
40%
50%
60%
70%
80%
90%
100%
2004 2008 2004 2008
Whites Blacks Hispanics Asians Others
Nevada New Mexico
Source: William H. Frey analysis of National Election Poll and VNS
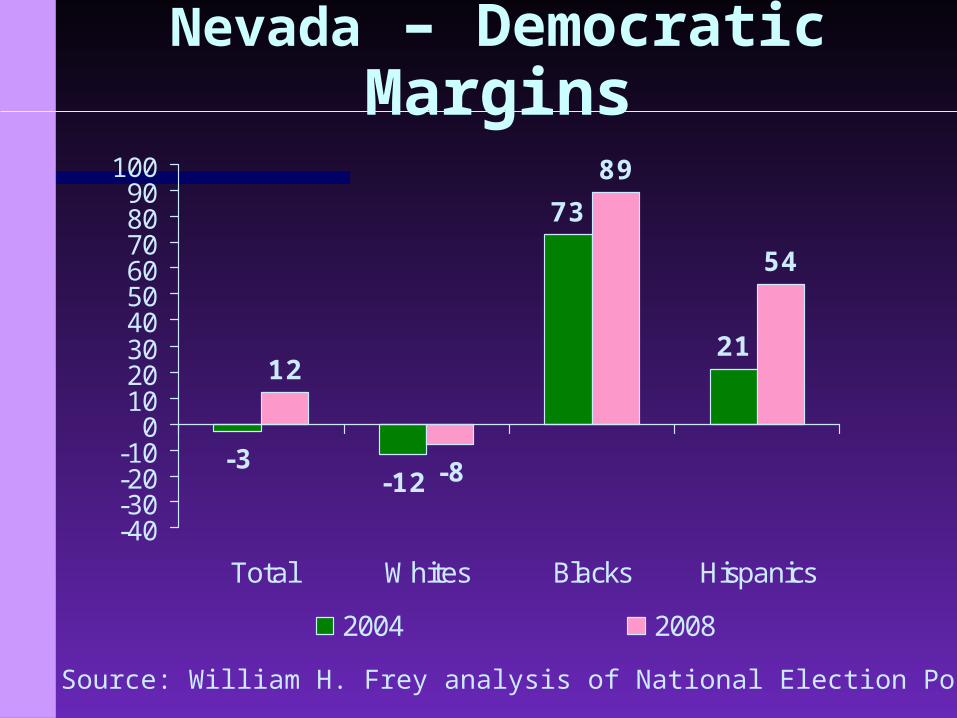
Nevada – Democratic Margins
-3-12
73
2112
-8
89
54
-40-30-20-10
0102030405060708090
100
Total Whites Blacks Hispanics
2004 2008

Source: William H. Frey analysis of National Election Poll and VNS
New Mexico – Democratic Margins
-1
-13
1215
-14
39
-20
-10
0
10
20
30
40
50
Total Whites Hispanics
2004 2008

Source: William H. Frey analysis of CPS November Supplements
Florida, Virginia Voters: 2004, 2008
76 7181 74
0%
10%
20%
30%
40%
50%
60%
70%
80%
90%
100%
2004 2008 2004 2008
Whites Blacks Hispanics Asians Others
VirginiaFlorida
Source: William H. Frey analysis of National Election Poll and VNS
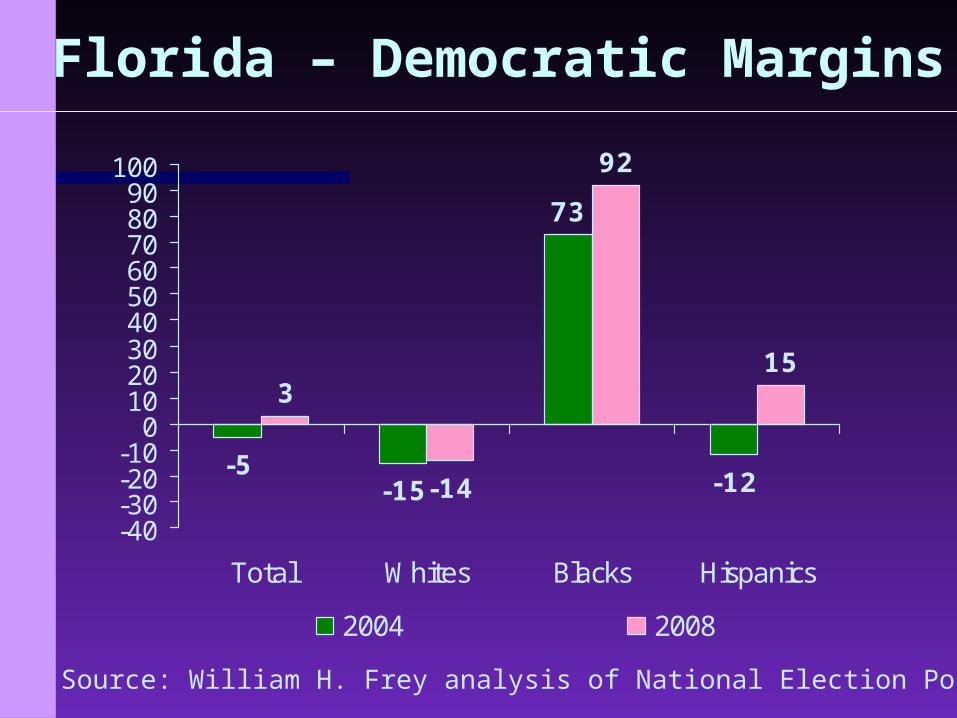
Florida – Democratic Margins
-5-15
73
-12
3
-14
92
15
-40-30-20-10
0102030405060708090
100
Total Whites Blacks Hispanics
2004 2008

Source: William H. Frey analysis of National Election Poll and VNS
Virginia – Democratic Margins
-8
-36
75
6
-21
84
31
-50-40-30-20-10
0102030405060708090
100
Total Whites Blacks Hispanics
2004 2008

Source: William H. Frey analysis of CPS November Supplements
Ohio, Pennsylvania Voters: 2004, 2008
86 85 89 87
0%
10%
20%
30%
40%
50%
60%
70%
80%
90%
100%
2004 2008 2004 2008
Whites Blacks Hispanics Asians Others
PennsylvaniaOhio

Source: William H. Frey analysis of National Election Poll and VNS
Ohio – Democratic Margins
-2-12
68
5
-6
95
-20-10
0102030405060708090
100
Total Whites Blacks
2004 2008
Source: William H. Frey analysis of National Election Poll and VNS
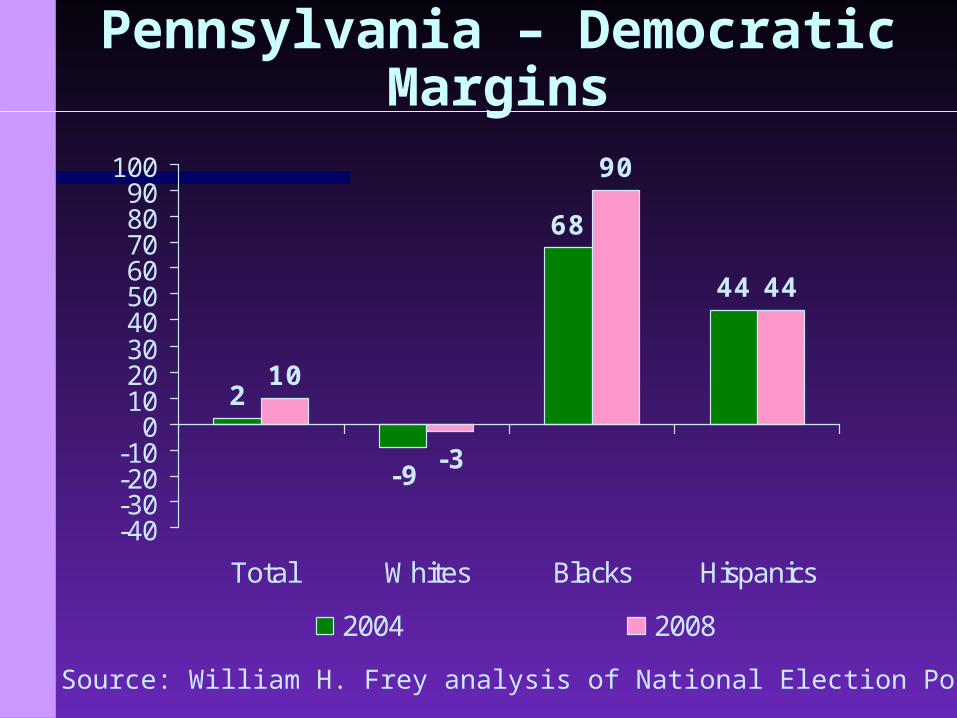
Pennsylvania – Democratic Margins
2
-9
68
44
10
-3
90
44
-40-30-20-10
0102030405060708090
100
Total Whites Blacks Hispanics
2004 2008
Source: William H. Frey
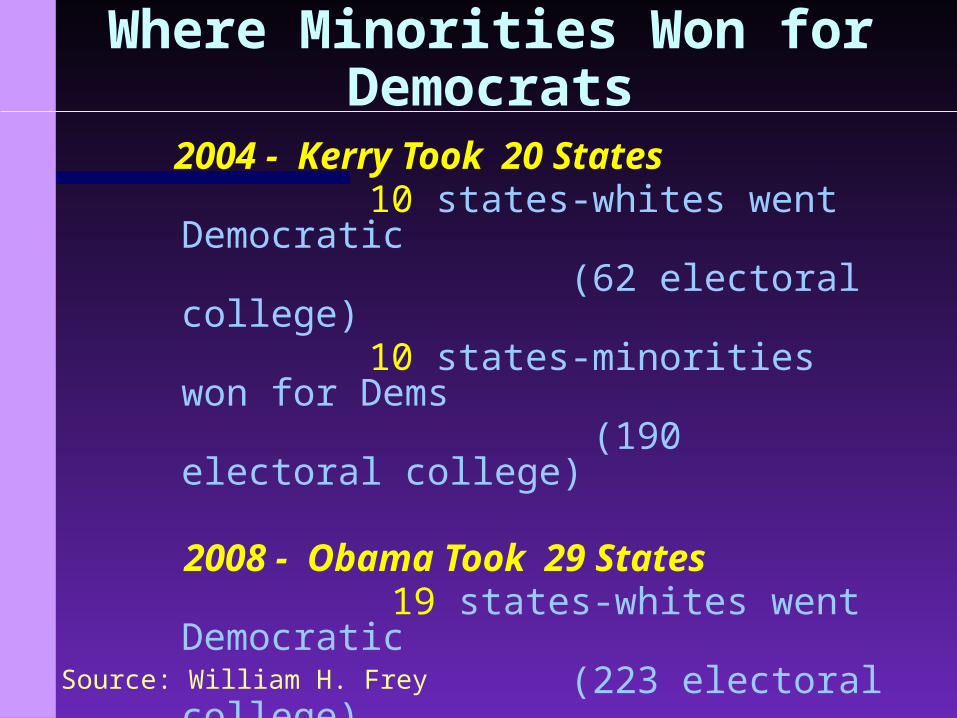
Where Minorities Won for Democrats
2004 - Kerry Took 20 States 10 states-whites went Democratic (62 electoral college) 10 states-minorities won for
Dems (190 electoral college)
2008 - Obama Took 29 States 19 states-whites went
Democratic (223 electoral college) 10 states-minorities won for
Dems (142 electoral college)

Source: William H. Frey analysis
2004 Blue States: Won by Whites and Minorities

Source: William H. Frey analysis
2008 Blue States: Won by Whites and Minorities

2010 Population and Eligible Voters by Race-Ethnicity: US and Mountain West
65 73 6574
16 1024
16
0%
10%
20%
30%
40%
50%
60%
70%
80%
90%
100%
Total Pop Eligible Voters Total Pop Eligible Voters
Whites Blacks Asians Others Hispanics
USA Mountain West

Total Population by Race-Ethnicity, 2010:
Six Mountain West States
4455 57
7384 87
4132 24 19 10 10
0%10%20%30%40%50%60%70%80%90%
100%
NewMexico
Arizona Nevada Colorado Utah Idaho
Whites Blacks Asians Others Hispanics

Eligible Voters by Race-Ethnicity, 2010:
Six Mountain West States
5367 69
81 90 92
3321 14 12 5 5
0%10%20%30%40%50%60%70%80%90%
100%
NewMexico
Arizona Nevada Colorado Utah Idaho
Whites Blacks Asians Others Hispanics

Party Affiliation: US Registered Latino Voters
0
10
20
30
40
50
60
70
y2002 y2004 y2006 y2008 y2010
Democrat Republican
Source: Pew Hispanic Center, "Latinos and the 2010 Elections" October 5, 2010
(Registered Latinos)
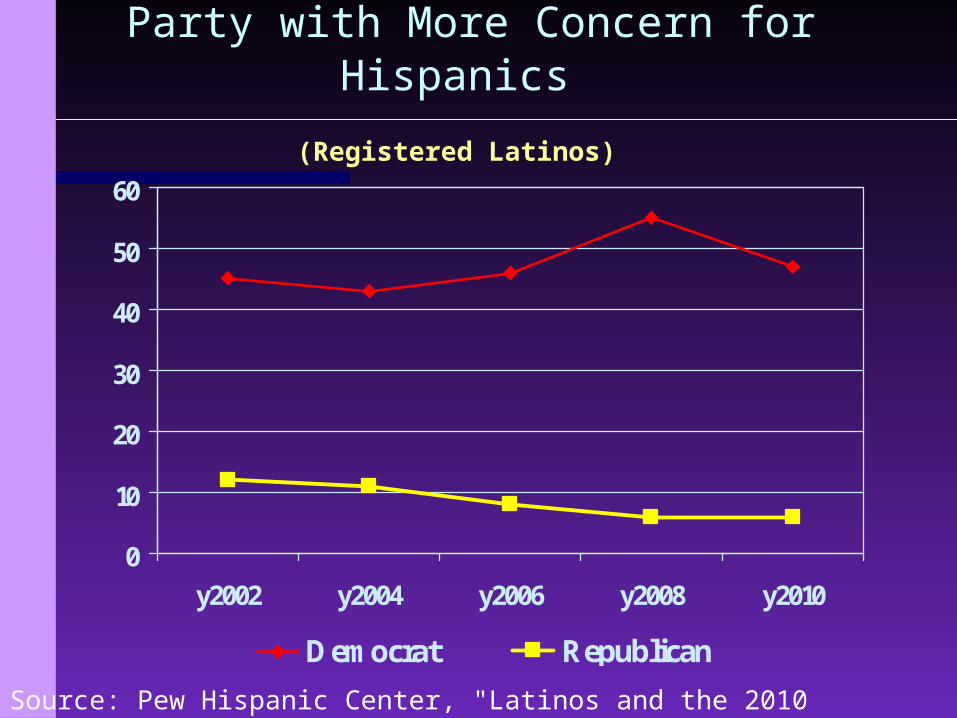
Party with More Concern for Hispanics
0
10
20
30
40
50
60
y2002 y2004 y2006 y2008 y2010
Democrat Republican
Source: Pew Hispanic Center, "Latinos and the 2010 Elections" October 5, 2010
(Registered Latinos)

Right Direction/Wrong Track?
0
10
20
30
40
50
60
70
80
Whites Hispanics Whites Hispanics
Right Wrong
Source: UNLV/BROOKINGS MOUNTAIN WEST Survey
Country State
(Adults.6 MT West States)
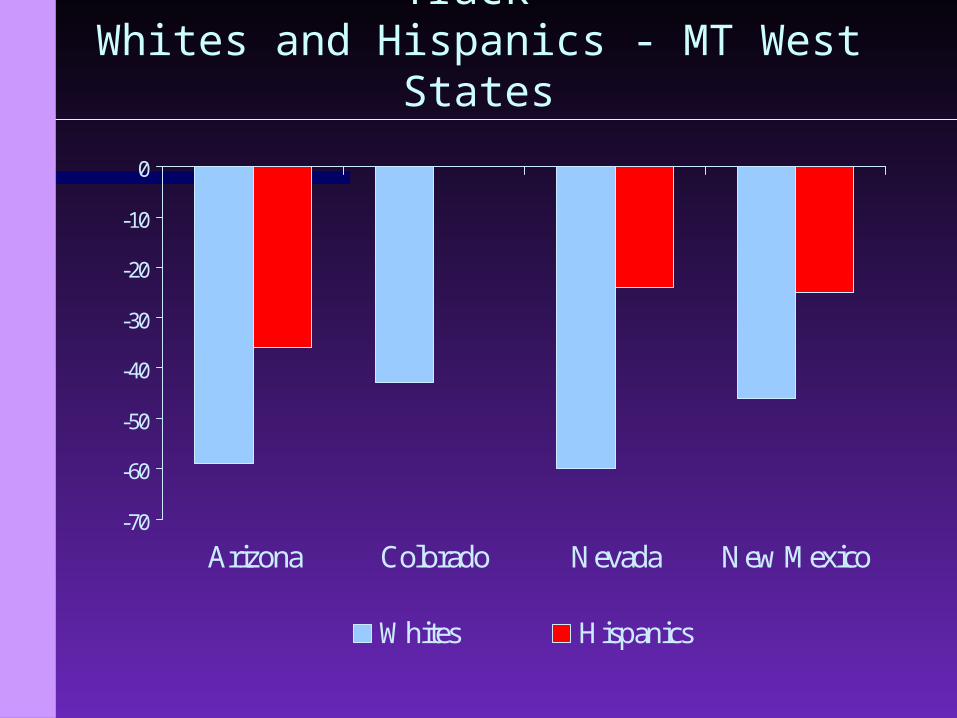
Country: Right Direction Minus Wrong Track
Whites and Hispanics - MT West States
-70
-60
-50
-40
-30
-20
-10
0
Arizona Colorado Nevada New Mexico
Whites Hispanics

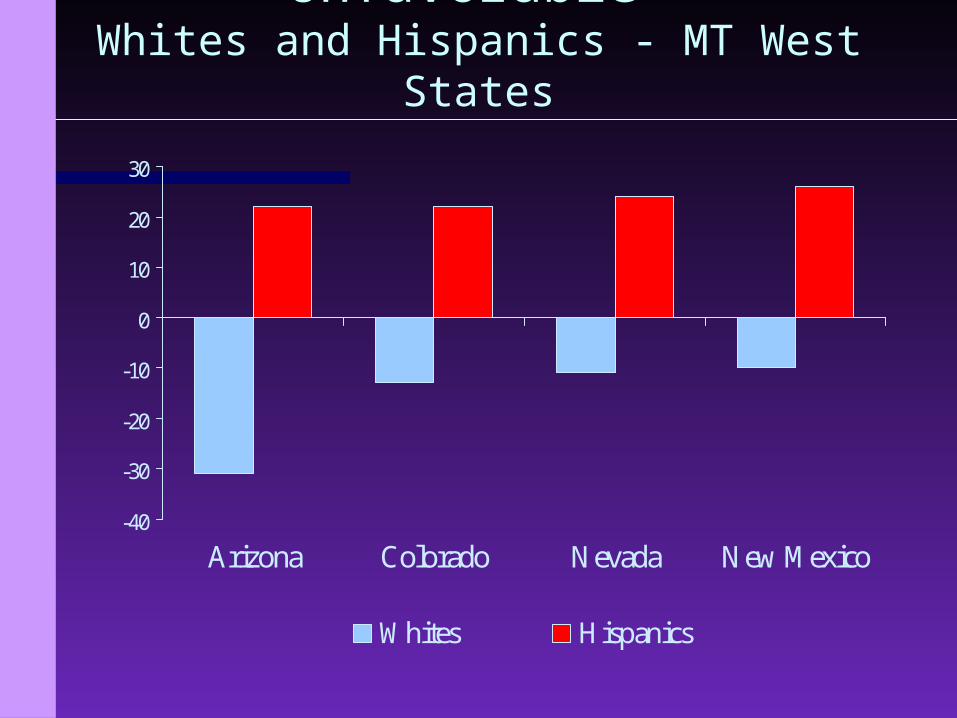
State: Right Direction Minus Wrong Track Whites and Hispanics - MT West States
-70
-60
-50
-40
-30
-20
-10
0
10
Arizona Colorado Nevada New Mexico
Whites Hispanics

Obama Favorability
5535
11
12
8
9
2644
0%
10%
20%
30%
40%
50%
60%
70%
80%
90%
100%
Whites Hispanics
Unfavorable Neutral/ NA Favorable Very Favorable
Source: UNLV/BROOKINGS MOUNTAIN WEST Survey
(Adults: 6 MT West States)
Obama: Favorable Minus Unfavorable
Whites and Hispanics - MT West States
-40
-30
-20
-10
0
10
20
30
Arizona Colorado Nevada New Mexico
Whites Hispanics

Bush Favorability
44 51
1517
1615
25 17
0%
10%
20%
30%
40%
50%
60%
70%
80%
90%
100%
Whites Hispanics
Unfavorable Neutral/ NA Favorable Very Favorable
Source: UNLV/BROOKINGS MOUNTAIN WEST Survey
(Adults: 6 MT West States)

Palin Favorability
47 52
1824
1110
2414
0%
10%
20%
30%
40%
50%
60%
70%
80%
90%
100%
Whites Hispanics
Unfavorable Neutral/ NA Favorable Very Favorable
Source: UNLV/BROOKINGS MOUNTAIN WEST Survey
(Adsult: 6 MT West States)

Congressional Democrat Favorability
5737
18
23
13
17
1223
0%
10%
20%
30%
40%
50%
60%
70%
80%
90%
100%
Whites Hispanics
Unfavorable Neutral/ NA Favorable Very Favorable
Source: UNLV/BROOKINGS MOUNTAIN WEST Survey
(Adults: 6 MT West States)

Congressional Democrats: Favorable Minus Unfavorable
Whites and Hispanics - MT West States
-40
-30
-20
-10
0
10
20
Arizona Colorado Nevada New Mexico
Whites Hispanics

Congressional Republican Favorability
42 47
26 23
17 16
15 14
0%
10%
20%
30%
40%
50%
60%
70%
80%
90%
100%
Whites Hispanics
Unfavorable Neutral/ NA Favorable Very Favorable
Source: UNLV/BROOKINGS MOUNTAIN WEST Survey
(Adults: 6 MT West States)

Congressional Republicans: Favorable Minus Unfavorable Whites and Hispanics - MT West States
-30
-25
-20
-15
-10
-5
0
Arizona Colorado Nevada New Mexico
Whites Hispanics
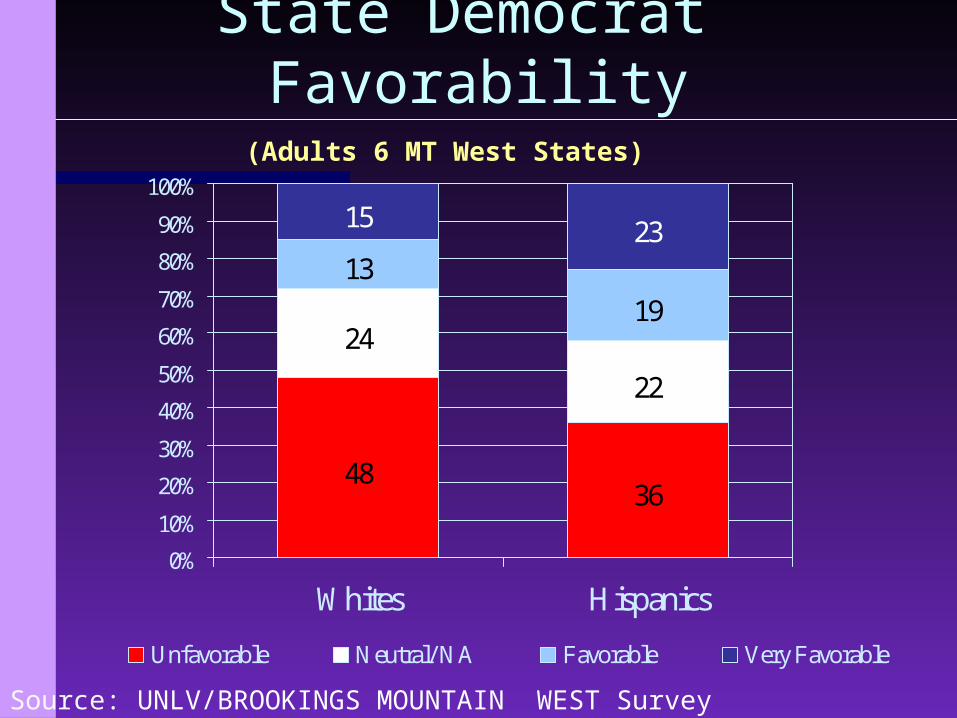
State Democrat Favorability
4836
24
22
1319
15 23
0%
10%
20%
30%
40%
50%
60%
70%
80%
90%
100%
Whites Hispanics
Unfavorable Neutral/ NA Favorable Very Favorable
Source: UNLV/BROOKINGS MOUNTAIN WEST Survey
(Adults 6 MT West States)

State Democrats: Favorable Minus Unfavorable
Whites and Hispanics - MT West States
-40
-30
-20
-10
0
10
20
30
Arizona Colorado Nevada New Mexico
Whites Hispanics

State Republican Favorability
34 42
2524
1716
24 18
0%
10%
20%
30%
40%
50%
60%
70%
80%
90%
100%
Whites Hispanics
Unfavorable Neutral/ NA Favorable Very Favorable
Source: UNLV/BROOKINGS MOUNTAIN WEST Survey
(Adults: 6 MT West States)

State Republicans: Favorable Minus Unfavorable
Whites and Hispanics - MT West States
-25
-20
-15
-10
-5
0
5
10
15
20
Arizona Colorado Nevada New Mexico
Whites Hispanics

Priority Issues for Whites
Source: UNLV/BROOKINGS MOUNTAIN WEST Survey
1 57% Jobs/Econ Growth
2 50% Schools
3 49% Federal Govt Spending
4 49% Illegal Immigrants
5 43% Crime and Drugs
(percent ranking issue as extremely important)

Priority Issues for Hispanics
Source: UNLV/BROOKINGS MOUNTAIN WEST Survey
1 63% Jobs/Econ Growth
2 63% Schools
3 59% Crime and Drugs
4 48% Environment
5 47% Health Care
(percent ranking issue as extremely important)
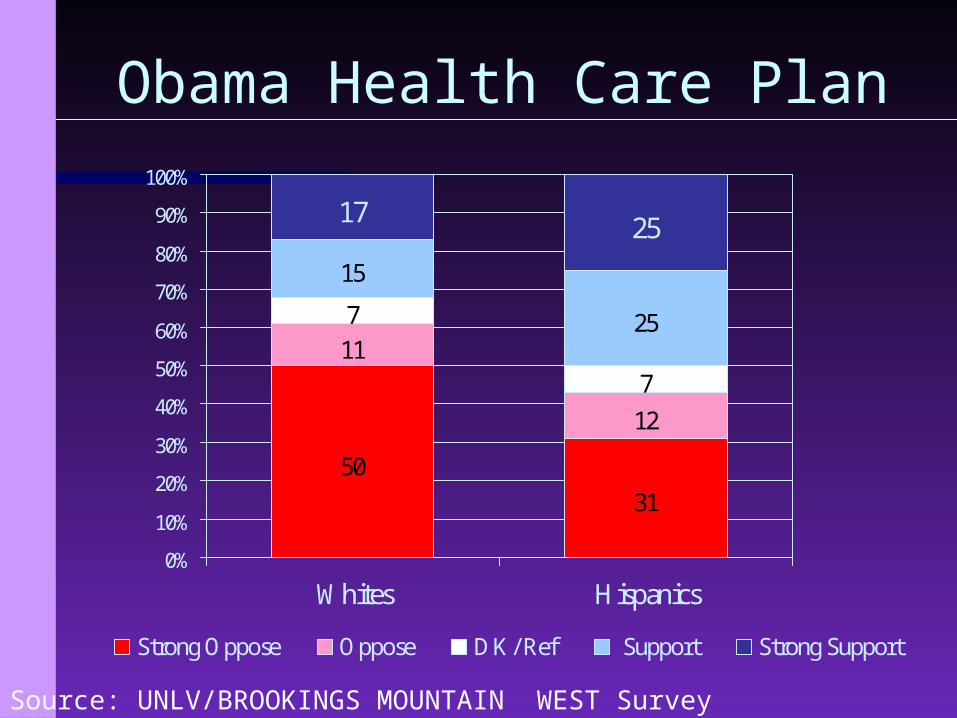
Obama Health Care Plan
5031
11
12
7
7
15
25
17 25
0%
10%
20%
30%
40%
50%
60%
70%
80%
90%
100%
Whites Hispanics
Strong Oppose Oppose DK/ Ref Support Strong Support
Source: UNLV/BROOKINGS MOUNTAIN WEST Survey

Financial Reform
2617
16
11
10
12
1929
29 31
0%
10%
20%
30%
40%
50%
60%
70%
80%
90%
100%
Whites Hispanics
Strong Oppose Oppose DK/ Ref Support Strong Support
Source: UNLV/BROOKINGS MOUNTAIN WEST Survey

Income Taxes
41 42
54 51
4 34
0%
10%
20%
30%
40%
50%
60%
70%
80%
90%
100%
Whites Hispanics
Too High About Right Don't Pay/ DK Too Low
Source: UNLV/BROOKINGS MOUNTAIN WEST Survey

Arizona Immigration Law
18 12
50
28
29
57
0%
10%
20%
30%
40%
50%
60%
70%
80%
90%
100%
Whites Hispanics
Not Far Enough About Right Goes Too Far
Source: UNLV/BROOKINGS MOUNTAIN WEST Survey

AZ Immigration Law: Goes Too FarWhites and Hispanics - MT West States
0
10
20
30
40
50
60
70
80
Arizona Colorado Nevada New Mexico
Whites Hispanics
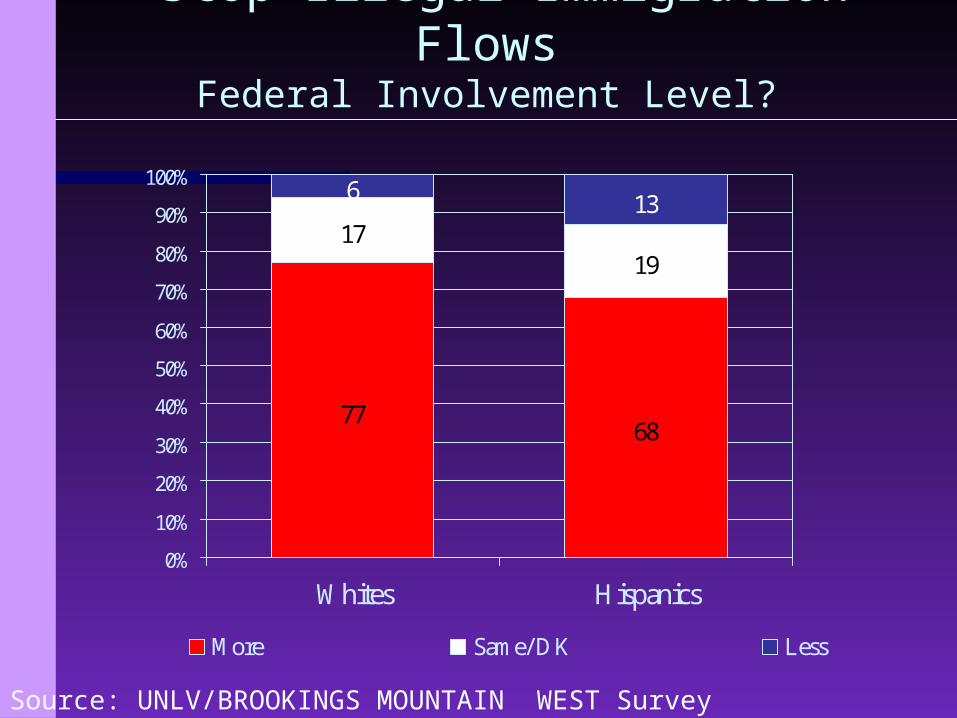
Stop Illegal Immigration FlowsFederal Involvement Level?
7768
1719
6 13
0%
10%
20%
30%
40%
50%
60%
70%
80%
90%
100%
Whites Hispanics
More Same/ DK Less
Source: UNLV/BROOKINGS MOUNTAIN WEST Survey
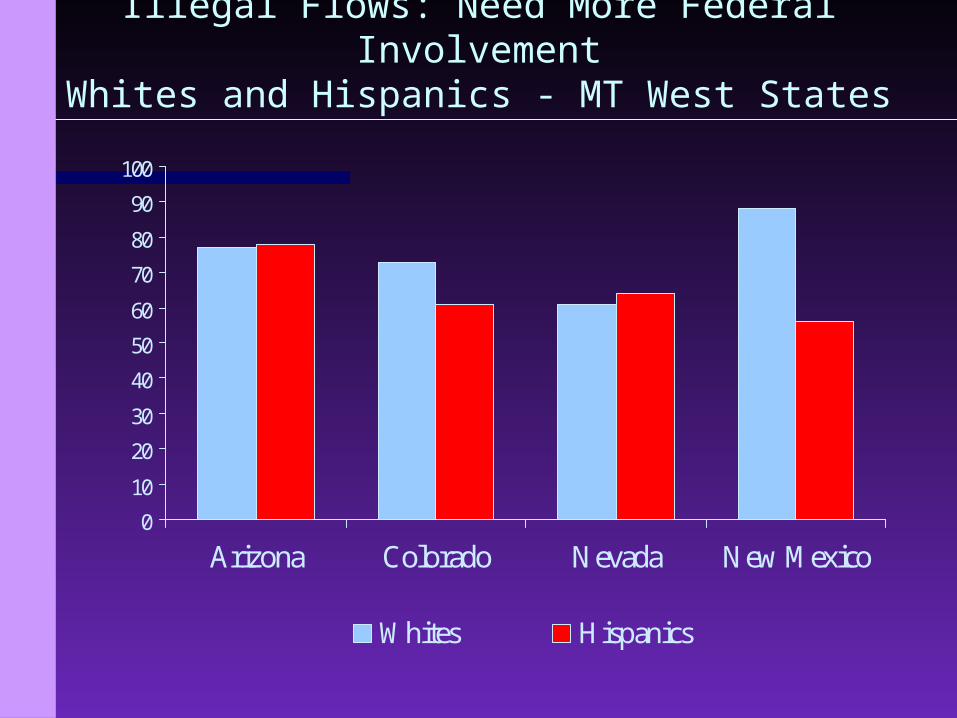
Illegal Flows: Need More Federal InvolvementWhites and Hispanics - MT West States
0
10
20
30
40
50
60
70
80
90
100
Arizona Colorado Nevada New Mexico
Whites Hispanics

Deal with Illegals Here: Federal Involvement Level?
7258
19
22
920
0%
10%
20%
30%
40%
50%
60%
70%
80%
90%
100%
Whites Hispanics
More Same/ DK Less
Source: UNLV/BROOKINGS MOUNTAIN WEST Survey
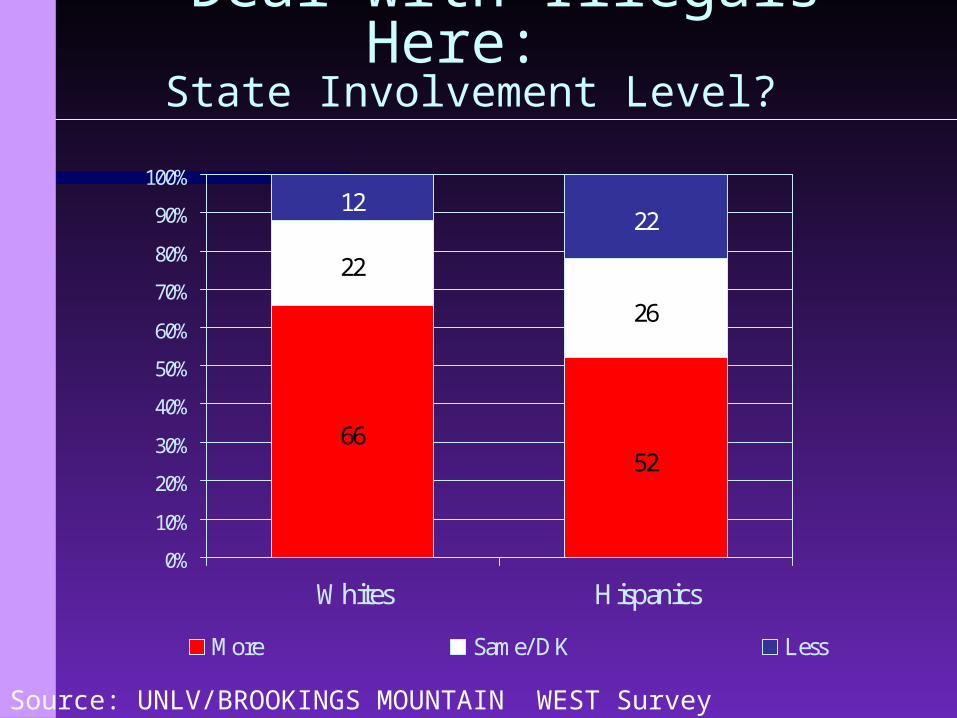
Deal with Illegals Here: State Involvement Level?
6652
22
26
1222
0%
10%
20%
30%
40%
50%
60%
70%
80%
90%
100%
Whites Hispanics
More Same/ DK Less
Source: UNLV/BROOKINGS MOUNTAIN WEST Survey

Illegals Here : Need More State InvolvementWhites and Hispanics - MT West States
0
10
20
30
40
50
60
70
80
Arizona Colorado Nevada New Mexico
Whites Hispanics

Immigrants: Strength vs Burden
30
42
28
23
0
5
10
15
20
25
30
35
40
45
Whites HispanicsStrength Burden
Source: UNLV/BROOKINGS MOUNTAIN WEST Survey

Illegals: Pathway vs No Amnesty
35
46
31
23
0
5
10
15
20
25
30
35
40
45
50
Whites HispanicsPathway No Amnesty
Source: UNLV/BROOKINGS MOUNTAIN WEST Survey