widespread white matter alterations in patients with end-stage
TRANSCRIPT

ORIGINAL RESEARCHBRAIN
WidespreadWhiteMatter Alterations in Patients withEnd-Stage Renal Disease: A Voxelwise Diffusion Tensor
Imaging StudyM.-C. Chou, T.-J. Hsieh, Y.-L. Lin, Y.-T. Hsieh, W.-Z. Li, J.-M. Chang, C.-H. Ko, E.-F. Kao, T.-S. Jaw, and G.-C. Liu
ABSTRACT
BACKGROUNDANDPURPOSE: ESRD results in excessive accumulation of urea and toxicmetabolites. Hemodialysis is usually performedtomaintain health in patients with ESRD; however, it may cause silent whitematter alterations in the earlier stages. Hence, this study aimedto perform voxelwise diffusion tensor analysis for global detection of subtle white matter alterations in patients with ESRD.
MATERIALS AND METHODS: Twenty-eight patients with ESRD and 25 age-matched control subjects were enrolled in this study. Eachsubject underwent CASI assessment and DTI. After spatial normalization of DTI images, voxelwise statistical analyses were performed tocompare DTI parameters between the 2 groups.
RESULTS: In patients with ESRD, AD, RD, and MD values were significantly increased, whereas the FA value was significantly decreased,mostly in the corpus callosum, bilateral sagittal stratum, and pons. Multiple regression analysis further revealed that both RD andMDwerepositively correlated with the duration of hemodialysis in the pons; however, no significant correlation was observed with FA. Negativecorrelations of RD and MD and a positive correlation of FA with the CASI score were observed in the corona radiata.
CONCLUSIONS: Weconcluded that voxelwiseDTI analysis is helpful in the detection ofwhitematter alterations caused by hemodialysis.
ABBREVIATIONS: AD� axial diffusivity; CASI� Cognitive Abilities Screening Instrument; ESRD� end-stage renal disease; FA� fractional anisotropy; MD�meandiffusivity; RD� radial diffusivity
ESRD has become an increasing problem, with a growing num-
ber of patients undergoing hemodialysis in the United States
in recent years.1 ESRD has been characterized as the failure of
renal functions, which permanently decrease to �10% of the nor-
mal status, and is accompanied by multiple organ dysfunction.1
To maintain their health, patients with ESRD usually undergo
regular hemodialysis 3 times per week to remove excess urea and
other toxic metabolites from the body. However, uremic neurop-
athy has been reported in patients with ESRD undergoing hemo-
dialysis. These neurologic complications may be related to ESRD
itself or to dialysis. These neurologic complications include acute
reactions such as dialysis disequilibrium syndrome and osmotic my-
elinolysis and chronic changes such as encephalopathy, dementia,
and stroke.2,3 These acute complications are presumably related to
brain swelling or tissue edema caused by the osmotic gradient be-
tween plasma and brain tissue during hemodialysis.2,4 Excessive
edema may gradually lead to damaged brain tissue.
For direct measurement of water diffusion, in a previous animal
MR imaging study, DWI was performed in nephrectomized rats.5
The results showed that ADC was significantly increased in the rat
brain immediately after hemodialysis. Similar results were also ob-
served in a human brain study in which ADC measurement was
performed in multiple regions of the brain of patients with ESRD by
using region-of-interest analysis.6 That study found that before he-
modialysis, ADC values were significantly higher for both the gray
and white matter in patients with ESRD than in control subjects.
After the initial hemodialysis, ADC values were further increased in
the frontal white matter; this change implied that immediate hemo-
dialysis led to increased water diffusion in brain tissue.
Because hemodialysis may cause white matter alterations,
another previous study used the DTI technique to investigate
Received October 13, 2012; accepted after revision December 25.
From the Departments of Medical Imaging and Radiological Sciences, College ofHealth Sciences; (M.-C.C., T.-J.H., Y.-L.L., Y.-T.H., W.Z.L.. E.-F.K.), and Departments ofRadiology (T.-J.H., T.-S.J., G.-C.L.), Renal Care (J.-M.C.), and Psychiatry (C.-H.K.), Col-lege of Medicine, Kaohsiung Medical University, Kaohsiung, Taiwan; Departmentsof Medical Imaging (T.-J.H., T.-S.J., G.-C.L.), Internal Medicine (J.-M.C.), and Psychiatry(C.-H.K.), Kaohsiung Medical University Hospital, Kaohsiung Medical University,Kaohsiung, Taiwan; Department of Medical Imaging (T.-J.H.), Kaohsiung MunicipalTa-Tong Hospital, Kaohsiung Medical University, Kaohsiung, Taiwan; and Depart-ments of Internal Medicine (J.-M.C.) and Psychiatry (C.-H.K.), Kaohsiung MunicipalHsiao-Kang Hospital, Kaohsiung Medical University, Kaohsiung, Taiwan.
This work was supported in part by grant NSC-99–2314-B-037–070-MY2 from theNational Science Council of Taiwan.
Please address correspondence to Tsyh-Jyi Hsieh, MD, Department of MedicalImaging, Kaohsiung Medical University, 100 Shih-Chuan 1st Rd, Kaohsiung 80708,Taiwan; e-mail: [email protected]
Indicates open access to non-subscribers at www.ajnr.org
http://dx.doi.org/10.3174/ajnr.A3511
AJNR Am J Neuroradiol 34:1945–51 Oct 2013 www.ajnr.org 1945

the effects of long-term hemodialysis on white matter integrity
by comparing FA values between patients with ESRD and
healthy subjects by using manual region-of-interest analysis.7
The results showed that FA values were significantly reduced in
many white matter regions and that negative correlations were
evident between reduction in FA values and the duration of
hemodialysis. Recently, a DTI tractography study further
showed an association between abnormalities of fiber tracts
and cognitive function.8
However, manual region-of-interest analysis has been used in
the studies in which diffusion measurements of the brain tissue of
patients with ESRD were performed. This method is known to be
effort-intensive, and the results are dependent on the locus and
size of the region of interest drawn by the operators.9 In contrast,
voxel-based analysis is an automatic method that normalizes
whole-brain DTI to a standard coordinate system in which 2 da-
tasets are compared on a voxel-by-voxel basis.10 This approach
has been widely used to detect disease-, drug-, or age-related white
matter alterations in the human brain11-13; however, no study has
used this technique in patients with ESRD, to our knowledge.
Recently, better registration accuracy was demonstrated with dif-
feomorphic image registration.14,15 Combining voxel-based anal-
ysis with diffeomorphic registration may provide more accurate
results than conventional methods.16 Moreover, in DTI, AD and
RD represent the diffusivity in directions parallel and perpendic-
ular to fiber orientations, respectively. Both can provide in-depth
insight into underlying biophysical changes in the axon and my-
elin. Thus, white matter alterations may be better characterized in
patients with ESRD by using AD, RD, and MD values together
with FA values.
This study aimed to perform voxelwise DTI analysis with dif-
feomorphic registration for accurate characterization of white
matter alterations in patients with ESRD. AD, RD, and MD values
were combined with FA values in this study, and the relationships
of these values with the duration of hemodialysis and cognitive
function in subjects with ESRD were explored.
MATERIALS AND METHODSSubjectsThis study was approved by the institutional review board of
Hsiao-Kang Municipal Hospital. Twenty-eight patients with
ESRD (male/female ratio � 14:14; 39 � 8 years of age) and 25
age-matched control subjects (male/female ratio � 11:14; 39 � 7
years of age) were enrolled in this study. Patients who had under-
gone hemodialysis for �1 year were regarded as long-term dialy-
sis subjects. The mean of their duration of dialysis was 7 � 5 years,
and their last hemodialysis was conducted 2 days before MR im-
aging. Table 1 shows the demographic characteristics of the en-
rolled subjects. All participants completed an informed consent
form. Subjects who had a history of diabetes, alcoholism, drug
abuse, psychiatric disorders, and major neurologic disorders or
who had claustrophobia were excluded from this study. All par-
ticipants completed the overall evaluation of cognitive functions
in approximately 30 minutes, by using the CASI assessment.17
The CASI covers a broad range of cognitive domains and is usu-
ally used in evaluating cognitive changes clinically.
Data AcquisitionAll brain MR imaging data were acquired from a 1.5T MR imag-
ing scanner (Signa Excite; GE Healthcare, Milwaukee, Wiscon-
sin). After triplanar scans and acquisition of calibration data for
array spatial sensitivity encoding technique parallel imaging, 20
axial T1WI, T2WI, and T2-FLAIR images were sequentially ac-
quired from each subject. Those anatomic images were used to
diagnose pre-existing lesions in patients, and those who had le-
sions diagnosed were excluded from this study.
DTI acquisitions were performed by using single-shot twice-
refocused spin-echo echo-planar diffusion-weighted sequences
with an 8-channel phased array neurovascular coil. Thirty axial
sections were placed to cover the whole-brain region with orien-
tation parallel to the anterior/posterior commissure line. Other
imaging parameters were as follows: TR/TE � 8000/82.8 ms, ma-
trix size � 128 � 128, b�1000 s/mm2, number of noncollinear
diffusion directions � 33, B0 � 1, FOV � 240 � 240 mm, NEX �
1, array spatial sensitivity encoding technique factor � 2.0, sec-
tion thickness � 4.4 mm, and no gap between sections. The scan-
ning time for the DTI acquisition was 4 minutes 48 seconds.
DTI AnalysisAll data were transferred to a stand-alone workstation and were
processed by using the fMRI of the Brain Software Library (http://
www.fmrib.ox.ac.uk/) to obtain diffusion tensor maps. First, the
eddy-current distortions were corrected by using affine registra-
tion to minimize the diffusion gradient–induced eddy-current
distortions in 33 DWIs with b�0 as the reference image. Subse-
quently, a diffusion tensor was fitted with least-squares estima-
tion on a voxel-by-voxel basis to obtain 3 eigenvalues, from which
AD, RD, MD, and FA values were calculated.
Voxel-Based DTI AnalysisIn voxel-based analysis, whole-brain FA maps were spatially nor-
malized to an International Consortium for Brain Mapping FA
template18 by using affine registration to minimize global differ-
ences, followed by nonparametric diffeomorphic demon registra-
tion14 to further minimize local differences between individual
and template images. The displacement maps generated from the
affine and demon registrations were used to spatially normalize
the corresponding AD, RD, and MD maps, respectively. Subse-
quently, the voxel-based analysis was conducted by using SPM5
(Wellcome Department of Imaging Neuroscience, London, UK)
on a Matlab platform (MathWorks, Natick, Massachusetts). The
statistical comparisons of DTI indices between patients with
ESRD and healthy subjects were performed by using a 2-sample t
test. In addition, multiple regression analysis was used to reveal
the associations of DTI indices with the duration of hemodialysis
Table 1: Demographic characteristics of enrolled subjectsa
Patientswith ESRD
ControlSubjects
Age (yr) 39� 8 39� 7Sex (M/F) 14/14 11/14Dialysis duration (yr) 7� 5 N/ACASI score 93.5� 7.2b 96.8� 3.7b
Note:—N/A indicates not applicable.a Data are means.b Statistically significant difference (P� .05).
1946 Chou Oct 2013 www.ajnr.org
and the CASI score, respectively, whose net effects were extracted
by nulling the age and sex influences. In this study, the areas with
statistically significant differences (uncorrected P � .01 and clus-
ter of �50 voxels) were displayed as red-yellow colors superim-
posed on the averaged AD, RD, MD, and FA maps, respectively.
RESULTSAge, Sex, CASI Score, and Duration of HemodialysisIn this study, the sex distributions of patients with ESRD and
healthy subjects were not well-matched but did not have a signif-
icant difference. The results of 2-sample t tests revealed signifi-
cantly lower CASI scores in patients with ESRD than in healthy
subjects (P � .05). Correlation testing found no significant cor-
relations between CASI scores and age, sex, or duration of hemo-
dialysis in patients with ESRD or healthy subjects.
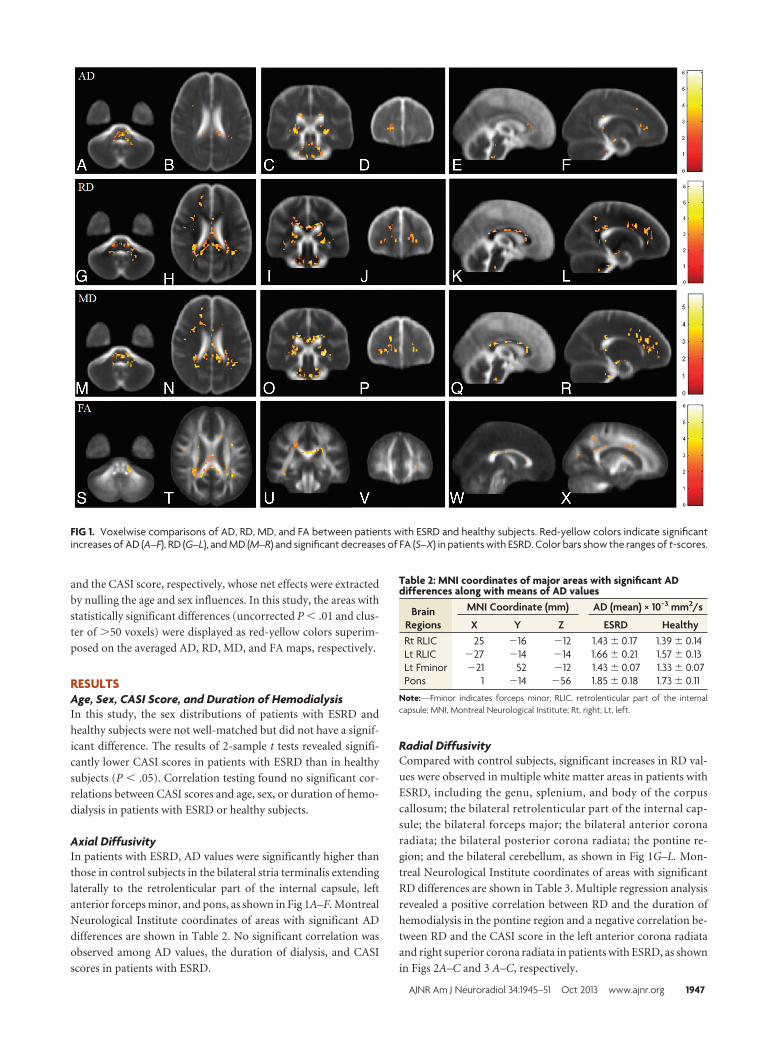
Axial DiffusivityIn patients with ESRD, AD values were significantly higher than
those in control subjects in the bilateral stria terminalis extending
laterally to the retrolenticular part of the internal capsule, left
anterior forceps minor, and pons, as shown in Fig 1A–F. Montreal
Neurological Institute coordinates of areas with significant AD
differences are shown in Table 2. No significant correlation was
observed among AD values, the duration of dialysis, and CASI
scores in patients with ESRD.
Radial DiffusivityCompared with control subjects, significant increases in RD val-
ues were observed in multiple white matter areas in patients with
ESRD, including the genu, splenium, and body of the corpus
callosum; the bilateral retrolenticular part of the internal cap-
sule; the bilateral forceps major; the bilateral anterior corona
radiata; the bilateral posterior corona radiata; the pontine re-
gion; and the bilateral cerebellum, as shown in Fig 1G–L. Mon-
treal Neurological Institute coordinates of areas with significant
RD differences are shown in Table 3. Multiple regression analysis
revealed a positive correlation between RD and the duration of
hemodialysis in the pontine region and a negative correlation be-
tween RD and the CASI score in the left anterior corona radiata
and right superior corona radiata in patients with ESRD, as shown
in Figs 2A–C and 3 A–C, respectively.
Table 2: MNI coordinates of major areas with significant ADdifferences along with means of AD values
BrainRegions
MNI Coordinate (mm) AD (mean) × 10−3 mm2/s
X Y Z ESRD HealthyRt RLIC 25 �16 �12 1.43� 0.17 1.39� 0.14Lt RLIC �27 �14 �14 1.66� 0.21 1.57� 0.13Lt Fminor �21 52 �12 1.43� 0.07 1.33� 0.07Pons 1 �14 �56 1.85� 0.18 1.73� 0.11
Note:—Fminor indicates forceps minor; RLIC, retrolenticular part of the internalcapsule; MNI, Montreal Neurological Institute; Rt, right; Lt, left.
FIG 1. Voxelwise comparisons of AD, RD, MD, and FA between patients with ESRD and healthy subjects. Red-yellow colors indicate significantincreases of AD (A–F), RD (G–L), andMD (M–R) and significant decreases of FA (S–X) in patientswith ESRD. Color bars show the ranges of t-scores.
AJNR Am J Neuroradiol 34:1945–51 Oct 2013 www.ajnr.org 1947

Mean DiffusivityIn patients with ESRD, widespread significant increases in MD
were observed in the white matter regions, including the genu,
splenium, and body of the corpus callosum; the bilateral posterior
corona radiata; the bilateral anterior corona radiata; the bilateral
forceps major; and the bilateral retrolenticular part of the internal
capsule. These increases extended to the bilateral sagittal stratum,
pontine crossing tracts, and middle cerebellar peduncle, as shown
in Fig 1M–R. Montreal Neurological Institute coordinates of areas
with significant MD differences are shown in Table 4. Multiple
regression analysis revealed a positive correlation between MD
and the duration of hemodialysis in the pons, the right retrolen-
ticular part of the internal capsule, and the left anterior frontal
white matter, as shown in Fig 2D–I. A significant negative corre-
lation between MD and the CASI score was also observed in the
left anterior corona radiata and right superior corona radiata, as
shown in Fig 3D–F.
Fractional AnisotropySimilarly, FA values were significantly decreased in multiple areas
of the brain in patients with ESRD. Major differences between
patients with ESRD and healthy subjects were found in clusters in
the genu and splenium of the corpus callosum and the bilateral
retrolenticular part of the internal capsule extending to the bilat-
eral sagittal stratum. Some scattered clusters were found in the
middle cerebellar peduncle, as shown in Fig 1S–X. Montreal Neu-
rological Institute coordinates of areas with significant FA differ-
ences are listed in Table 5. Multiple regression analysis revealed a
positive correlation between FA values and the CASI score in the
left anterior corona radiata, left posterior corona radiata, and
right superior corona radiata in patients with ESRD, as shown in
Fig 3G–I. However, no significant correlations were observed be-
tween FA and the duration of hemodialysis. Montreal Neurolog-
ical Institute coordinates of areas with significant correlations of
RD, MD, and FA values to the duration of hemodialysis and CASI
score are shown in Table 6.
DISCUSSIONIn this study, voxelwise analysis of DTI was performed in patients
with ESRD on long-term hemodialysis to reveal global white mat-
ter alterations not only in the cerebrum but also in the infraten-
torial structures. In general, AD, RD, and MD values increased
significantly, whereas FA decreased sig-
nificantly in multiple white matter areas
in patients with ESRD. Significant in-
creases in MD were observed in many
white matter regions in patients with
ESRD that are similar to those of a pre-
vious DWI study6; however, in this
study, increases in AD, RD, and MD and
a decrease in FA that were not men-
tioned previously were also observed in
the pons and cerebellum. Although these
changes were observed in patients with
ESRD who underwent an MR imaging 2
days after the last weekly hemodialysis,
part of these results may very likely be at-
tributed to the immediate effects of hemo-
dialysis, which were shown to impact cog-
nitive functions longer than 2 days.19
Unlike cognitive function, white
matter alterations in the infratentorial
regions after hemodialysis were only dis-
cussed in a few studies using conven-
tional MR imaging.20-22 Dialysis dis-
equilibrium syndrome, first described in
1962 by Kennedy et al,3 is commonly de-
scribed as an acute neurologic disorder
that occurs in patients undergoing he-
modialysis. In addition, osmotic demy-
elination syndrome, which has been
Table 3: MNI coordinates of major areas with significant RDdifferences along with means of RD values
BrainRegions
MNI Coordinate (mm) RD (mean) × 10−3 mm2/s
X Y Z ESRD HealthyGCC 1 39 �1 0.94� 0.2 0.86� 0.14SCC 1 �14 5 0.65� 0.15 0.56� 0.08Rt. Fmajor 24 �54 �8 0.66� 0.11 0.62� 0.09Lt. Fmajor �28 �42 �8 0.67� 0.09 0.61� 0.11Rt. PCR 25 �23 7 0.64� 0.09 0.63� 0.04Lt. PCR �28 �20 7 0.66� 0.09 0.65� 0.04Rt. ACR 17 51 �6 0.64� 0.06 0.62� 0.05Lt. ACR �20 56 �8 0.63� 0.06 0.59� 0.05Pons 3 �13 �54 0.82� 0.19 0.71� 0.12
Note:—ACR indicates anterior corona radiata; Fmajor, forceps major; PCR, posteriorcorona radiata; SCC, splenium of the corpus callosum; MNI, Montreal NeurologicalInstitute; GCC, genu of the corpus callosum; Rt, right; Lt, left.
FIG 2. Voxelwise multiple regression analysis of DTI indices and the duration of hemodialysis inpatients with ESRD. Red-yellow colors indicate the significant positive correlation in RD (A–C) andMD (D–I). Color bars show the ranges of t-scores.
1948 Chou Oct 2013 www.ajnr.org

observed in patients with ESRD, is characterized by transient
edema and demyelination in the pons and extrapontine regions
after hemodialysis.21 Although both syndromes occur less often in
patients on long-term dialysis, the results of this study suggest that
dialysis-associated changes may occur not only in cerebral white
matter but also in cerebellar and brain stem regions. These
changes may have been associated with both syndromes.
In analyses of diffusivity, AD and RD were associated with
white matter changes in patients with ESRD. In most regions with
increased MD, significant increases in RD but not AD were found.
Similar findings have been reported in previous animal and hu-
man studies in which defective myelin was shown to increase RD
more than AD.23,24 Although the mech-
anisms of uremic neuropathy are com-
plex, the results of this study suggest that
demyelination of white matter is the ma-
jor neuropathy in patients with ESRD
with long-term hemodialysis. Further-
more, a positive correlation of MD and
RD with the duration of hemodialysis
was found. These findings may reflect
progressive changes of demyelination,
which is the subsequent change in ure-
mic neuropathy. Because a previous
study demonstrated that neurologic
complications, whether due to the ure-
mic state or its treatment, play an im-
portant role in the morbidity and mor-
tality of patients with ESRD,25
monitoring the damage to brain micro-
structures is important in these patients.
The results of this study suggest that MD
and RD may be good indices for moni-
toring changes in demyelination in pa-
tients with ESRD.
Similar to our previous study, this
study identified significant decreases in
FA in multiple areas of the brains of pa-
tients with ESRD.7 However, these de-
creases were observed not only in the ce-
rebral white matter but also in the
middle cerebellar peduncle. Similar to
that in previous studies, a decrease in diffusion anisotropy is rec-
ommended as a good index for neural degeneration.23,26 In pa-
tients with ESRD, decreases in FA and increases in MD were
caused by reduced microstructural integrity with macroscopic tis-
sue loss or interstitial edema, whereas decreases in FA and normal
MD were attributed to microstructural changes without gross tis-
sue loss or with the occurrence of gliosis. However, decreases in
FA and increases in RD occurred because of demyelination of
white matter tissue. In multiple regression analysis, though no
significant correlation was observed between FA and the duration
of hemodialysis, a trend of negative correlations was observed
when the statistical criteria were lowered (P � .05), suggesting
that long-term hemodialysis slightly and gradually compromised
the integrity of white matter tissue in these patients.
Two-sample t test analysis revealed significantly lower CASI
scores in patients with ESRD than in healthy subjects. Multiple
regression analysis further revealed significant correlations of RD,
MD, and FA values with CASI scores in the frontal and parietal
white matter that are likely responsible for cognitive function of
the brain. The increases in RD and MD values and decreases in FA
values may highlight microstructural nerve damage, including
axon injury and demyelination, which generally parallel the de-
gree of clinical and pathologic impairment. Previous studies dem-
onstrated that DTI can detect early neurodegenerative changes
and subtle changes in clinical function.27,28 The results of this
study suggested that DTI can detect uremic neuropathy, which is
associated with cognitive function.
Table 4: MNI coordinates of major areas with significant MDdifferences along with means of MD values
BrainRegions
MNI Coordinate(mm) MD (mean) × 10−3 mm2/s
X Y Z ESRD HealthyGCC 1 39 �8 1.16� 0.07 1.08� 0.05SCC 1 �13 5 1.12� 0.13 1.02� 0.06Rt. SS 31 �31 �9 1.27� 0.22 1.21� 0.15Lt. SS �39 �24 �15 1.07� 0.12 1.04� 0.08Rt. Fmajor 25 �42 �3 0.96� 0.11 0.89� 0.04Lt. Fmajor �30 �34 �3 1.15� 0.11 0.99� 0.09Rt. PCR 27 �25 4 1.07� 0.12 0.92� 0.06Lt. PCR �29 �25 1 1.21� 0.18 1.11� 0.15Pons 2 �14 �56 1.28� 0.13 1.13� 0.09
Note:—Fmajor indicates forcepsmajor; PCR, posterior corona radiata; SCC, spleniumof the corpus callosum; SS, sagittal stratum; MNI, Montreal Neurological Institute;GCC, genu of the corpus callosum; Rt, right; Lt, left.
FIG 3. Voxelwise multiple regression analysis of DTI indices and CASI scores in patients withESRD. Red-yellow colors indicate the significant negative correlations in RD (A–C) and MD (D–F)and a positive correlation in FA (G–I). Color bars show the ranges of t-scores.
AJNR Am J Neuroradiol 34:1945–51 Oct 2013 www.ajnr.org 1949
The small number of participants with ESRD is a limitation of
this study. The inclusion criteria that patients had to be young and
undergoing hemodialysis may have been responsible for the small
sample size. An extended study with a larger sample size and in-
clusion of those undergoing peritoneal dialysis, which led to
higher mortality rates than hemodialysis in a previous study,29
may provide more information about the effects of different fac-
tors. A further follow-up study would be helpful for understand-
ing the long-term effects of dialysis methods. In terms of data
acquisition, this study acquired DTI data with a section thickness
of 4.4 mm, which is larger than the in-plane resolution and has
more partial volume averaging in the through-plane direction.
Hence, the results of this study may have been affected by the
partial volume effects of imaging in the through-plane direction.
In cognitive assessment, this study did not record the subject’s
education level. Because the CASI score is associated with educa-
tion,30 the results of this study may also have been affected by the
educational difference between the 2 groups.
CONCLUSIONSThe voxel-based analysis method was used in this study for global
detection of white matter alterations in patients with ESRD on
long-term hemodialysis. The results showed that AD, RD, and
MD were significantly increased, whereas FA was significantly
decreased in many white matter regions of the brain of patients
with ESRD. The interpretation of these white matter alterations
by using all DTI indices led to the conclusion that long-term he-
modialysis caused increased interstitial edema in both the supra-
and infratentorial regions and gradually led to axonal demyelina-
tion in the pons. Finally, voxel-based DTI analysis was helpful in
characterizing white matter alterations in patients with ESRD on
long-term hemodialysis.
REFERENCES1. Foley RN, Collins AJ. End-stage renal disease in the United States:
an update from the United States renal data system. J Am Soc Neph-rol 2007;18:2644 – 48
2. Arieff AI. Dialysis disequilibrium syndrome: current concepts onpathogenesis and prevention. Kidney Int 1994;45:629 –35
3. Kennedy AC, Eaton JC, Linton AL. Urea levels in cerebrospinal fluidafter haemodialysis. Lancet 1962;1:410 –11
4. Pappius HM, Oh JH, Dossetor JB. The effects of rapid hemodialysison brain tissues and cerebrospinal fluid of dogs. Can J Physiol Phar-macol 1967;45:129 – 47
5. Galons JP, Trouard T, Gmitro AF, et al. Hemodialysis increases ap-parent diffusion coefficient of brain water in nephrectomized ratsmeasured by isotropic diffusion-weighted magnetic resonance im-aging. J Clin Invest 1996;98:750 –55
6. Chen CL, Lai PH. A preliminary report of brain edema in patientswith uremia at first hemodialysis: evaluation by diffusion-weighted MR imaging. AJNR Am J Neuroradiol 2007;28:68 –71
7. Hsieh TJ, Chang JM, Chuang HY, et al. End-stage renal disease: invivo diffusion-tensor imaging of silent white matter damage. Radi-ology 2009;252:518 –25
8. Kim H, Park J, Bai D, et al. Diffusion tensor imaging findings inneurologically asymptomatic patients with end stage renal disease.NeuroRehabilation 2011;29:111–16
9. Snook L, Plewes C, Beaulieu C. Voxel based versus region of interestanalysis in diffusion tensor imaging of neurodevelopment. Neuro-image 2007;34:243–52
10. Ashburner J, Friston KJ. Voxel-based morphometry: the methods.Neuroimage 2000;11:805–21
11. Della Nave R, Foresti S, Pratesi A, et al. Whole-brain histogram andvoxel-based analyses of diffusion tensor imaging in patients withleukoaraiosis: correlation with motor and cognitive impairment.AJNR Am J Neuroradiol 2007;28:1313–19
12. Liu HS, Chou MC, Chung HW, et al. Potential long-term effects ofMDMA on the basal ganglia-thalamocortical circuit: a proton MRspectroscopy and diffusion-tensor imaging study. Radiology2011;260:531– 40
13. Grieve SM, Williams LM, Paul RH, et al. Cognitive aging, executivefunction, and fractional anisotropy: a diffusion tensor MR imagingstudy. AJNR Am J Neuroradiol 2007;28:226 –35
14. Vercauteren T, Pennec X, Perchant A, et al. Diffeomorphic demons:Efficient non-parametric image registration. Neuroimage2009;45:S61–72
15. Ashburner J. A fast diffeomorphic image registration algorithm.Neuroimage 2007;38:95–113
16. Takahashi R, Ishii K, Miyamoto N, et al. Measurement of gray andwhite matter atrophy in dementia with Lewy bodies using diffeo-morphic anatomic registration through exponentiated lie algebra:a comparison with conventional voxel-based morphometry. AJNRAm J Neuroradiol 2010;31:1873–78
17. Teng EL, Hasegawa K, A. H., et al. The Cognitive Abilities ScreeningInstrument (CASI): a practical test for cross-cultural epidemiolog-ical studies of dementia. Int Psychogeriatr 1994;6:45–58
18. Mori S, Oishi K, Jiang HY, et al. Stereotaxic white matter atlas basedon diffusion tensor imaging in an ICBM template. Neuroimage2008;40:570 – 82
19. Williams MA, Sklar AH, Burright RG, et al. Temporal effects of dial-
Table 5: MNI coordinates of major areas with significant FAdifferences along with means of FA values
BrainRegions
MNI Coordinate (mm) FA (mean)
X Y Z ESRD HealthyGCC 3 40 �8 0.6� 0.06 0.67� 0.04SCC 3 �14 5 0.65� 0.05 0.72� 0.05Rt. SS 31 �28 �6 0.50� 0.04 0.56� 0.04Lt. SS �27 �39 �6 0.46� 0.05 0.56� 0.07Rt. MCP 13 �18 �58 0.45� 0.03 0.53� 0.04
Note:—MCP indicates middle cerebellar peduncle; SCC, splenium of the corpuscallosum; SS, sagittal stratum;MNI, Montreal Neurological Institute; GCC, genu of thecorpus callosum; Rt, right; Lt, left.
Table 6: MNI coordinates of areas with significant correlationsalong with their correlation coefficients
BrainRegions
MNI Coordinate (mm) CorrelationCoefficientX Y Z
RD and durationLt. Pons �16 �3 �46 0.7093RD and CASILt. ACR �28 33 19 �0.7442Rt. SCR 31 7 21 �0.6154MD and durationRt. RLIC 33 �20 �6 0.6009Lt. FWM �21 63 �5 0.6287Lt. Pons �12 �3 �46 0.6675MD and CASILt. ACR �28 33 19 �0.7657Rt. SCR 31 7 21 �0.5463FA and CASILt. ACR �17 40 18 0.7067Lt. PCR �20 �29 24 0.6117Rt. SCR 33 6 26 0.6815
Note:—ACR indicates anterior corona radiata; PCR, posterior corona radiata; RLIC,retrolenticular part of the internal capsule; SCR, superior corona radiata; MNI, Mon-treal Neurological Institute; FWM, frontal white matter; Rt, right; Lt, left.
1950 Chou Oct 2013 www.ajnr.org

ysis on cognitive functioning in patients with ESRD. Am J KidneyDis 2004;43:705–11
20. Lakadamyali H, Ergun T. MRI for acute neurologic complications inend-stage renal disease patients on hemodialysis. Diagn Interv Ra-diol 2011;17:112–17
21. Tarhan NC, Agildere AM, Benli US, et al. Osmotic demyelinationsyndrome in end-stage renal disease after recent hemodialysis: MRIof the brain. AJR Am J Roentgenol 2004;182:809 –16
22. Agildere AM, Benli S, Erten Y, et al. Osmotic demyelination syn-drome with a disequilibrium syndrome: reversible MRI findings.Neuroradiology 1998;40:228 –32
23. Song SK, Sun SW, Ramsbottom MJ, et al. Dysmyelination revealedthrough MRI as increased radial (but unchanged axial) diffusion ofwater. Neuroimage 2002;17:1429 –36
24. Metwalli NS, Benatar M, Nair G, et al. Utility of axial and radialdiffusivity from diffusion tensor MRI as markers of neurodegen-eration in amyotrophic lateral sclerosis. Brain Res 2010;1348:156 – 64
25. Brouns R, De Deyn PP. Neurological complications in renal failure:a review. Clin Neurol Neurosurg 2004;107:1–16
26. Filippi M, Cercignani M, Inglese M, et al. Diffusion tensor mag-netic resonance imaging in multiple sclerosis. Neurology 2001;56:304 –11
27. Huang J, Friedland RP, Auchus AP. Diffusion tensor imaging of nor-mal-appearing white matter in mild cognitive impairment andearly Alzheimer disease: preliminary evidence of axonal degenera-tion in the temporal lobe. AJNR Am J Neuroradiol 2007;28:1943– 48
28. Kantarci K, Senjem ML, Avula R, et al. Diffusion tensor imaging andcognitive function in older adults with no dementia. Neurology2011;77:26 –34
29. Bloembergen WE, Port FK, Mauger EA, et al. A comparison of mor-tality between patients treated with hemodialysis and peritoneal-dialysis. J Am Soc Nephrol 1995;6:177– 83
30. McCurry SM, Edland SD, Teri L, et al. The Cognitive AbilitiesScreening Instrument (CASI): data from a cohort of 2524 cogni-tively intact elderly. Int J Geriatr Psychiatry 1999;14:882– 88
AJNR Am J Neuroradiol 34:1945–51 Oct 2013 www.ajnr.org 1951