developmental whole brain white matter alterations in
TRANSCRIPT

Developmental Whole Brain White MatterAlterations in Transgenic Huntington's DiseaseMonkeyYuguang Meng, Emory UniversityJie Jiang, Emory UniversityJocelyne Bachevalier, Emory UniversityXiaodong Zhang, Emory UniversityAnthony Chan, Emory University
Journal Title: Scientific ReportsVolume: Volume 7, Number 1Publisher: Nature Publishing Group | 2017-12-01, Pages 379-379Type of Work: Article | Final Publisher PDFPublisher DOI: 10.1038/s41598-017-00381-8Permanent URL: https://pid.emory.edu/ark:/25593/s2s2k
Final published version: http://dx.doi.org/10.1038/s41598-017-00381-8
Copyright information:© 2017 The Author(s).This is an Open Access work distributed under the terms of the CreativeCommons Attribution 4.0 International License(https://creativecommons.org/licenses/by/4.0/).
Accessed December 2, 2021 12:54 PM EST

1Scientific RepoRts | 7: 379 | DOI:10.1038/s41598-017-00381-8
www.nature.com/scientificreports
Developmental Whole Brain White Matter Alterations in Transgenic Huntington’s Disease MonkeyYuguang Meng1, Jie Jiang2,3, Jocelyne Bachevalier4,5, Xiaodong Zhang1,3 & Anthony W. S. Chan2,3
Transgenic Huntington’s disease monkey (HD monkey) model provides great opportunity for studying disease progression that could lead to new insight for developing biomarker, early intervention and novel therapeutics. Whole brain white matter integrity of HD-monkeys was examined longitudinally from 6 to 48 months using diffusion tensor imaging (DTI) and tract-based spatial statistics (TBSS). Progressive developmental white matter alterations in HD monkeys were widespread and were observed not only in fiber bundles connecting cortical areas to the striatum (e.g. striatal bundle and external capsule), but also in long association fiber pathways, commissural fibers, and subcortical fiber bundle. In all fiber tracts, the data indicate an arrest in white matter development around 23 months followed by slight decline until adulthood in HD monkeys. The microstructural changes parallel the progressive motor, memory and cognitive decline previously reported as HD monkeys aged. The findings revealed the widespread progressive temporal-spatial microstructural changes in HD monkey brains from infancy to adulthood, suggesting differentiated degenerations across different brain areas during brain development.
Huntington’s disease (HD) is an inherited autosomal dominant neurodegenerative disorder caused by the abnor-mal expansion of a CAG trinucleotide sequence at the N-terminal of the exon 1 of the Huntingtin (HTT) gene located at chromosome 41. HD is characterized by progressive decline in motor function, cognition and psy-chiatric symptoms2. Death is expected in 10 to 20 years after diagnosis primarily based on motor functions3. Neurological and behavioral assessment is the primary approach to determine disease progression. Recent devel-opment in non-invasive neuroimaging techniques has provided a powerful diagnostic platform to evaluate neu-roanatomical and neurochemical changes that may precede the appearance of clinical symptoms4, 5.
Multiple longitudinal studies on HD patients are ongoing with a large cohort of participants that aimed to investigate disease onset and progression using unified clinical measurements6, 7. Although human longitudi-nal studies are important for understanding the etiology of HD, disease progression is a relatively slow pro-cess and may take decades to evolve from prodromal to clinically manifested stage. Therefore, the development of an animal model with similar genetic constitution, progressive decline in measurable clinical features and neuroanatomical structures, is important for studying HD pathogenesis, the development of biomarkers and novel therapeutics8, 9. Firstly, although rodent HD models mimic some clinical features of HD including neu-ropathology, these models have inherent limitations, such as brain size, neuroanatomy, neural circuitry as well as emotional response10. Secondly, rodent early brain development differs greatly from primates, with greater immaturity at birth but more compressed maturation until adulthood, resulting in greater vulnerability that is not seen in humans, and/or exaggerate effects of genetic manipulation11, 12. In contrast, nonhuman primates are sim-ilar to humans in anatomical structures and functional organizations and in their ontogenetic development13–15. Specifically, white matter fiber connections between striatum and prefrontal cortex or motor domains in primates are well established16. The use of the HD monkey model allows us to study in the same animals the developmental
1Yerkes Imaging Center, Yerkes National Primate Research Center, Emory University, Atlanta, GA, USA. 2Department of Human Genetics, Emory University School of Medicine, Atlanta, Georgia, USA. 3Division of Neuropharmacology and Neurologic Diseases, Yerkes National Primate Research Center, Emory University, Atlanta, Georgia, USA. 4Department of Psychology, Emory University School of Medicine, Atlanta, Georgia, USA. 5Division of Developmental and Cognitive Neuroscience, Yerkes National Primate Research Center, Emory University, Atlanta, Georgia, USA. Correspondence and requests for materials should be addressed to J.B. (email: [email protected]) or X.Z. (email: [email protected]) or A.W.S.C. (email: [email protected])
Received: 24 May 2016
Accepted: 23 February 2017
Published: xx xx xxxx
OPEN

www.nature.com/scientificreports/
2Scientific RepoRts | 7: 379 | DOI:10.1038/s41598-017-00381-8
trajectories of cognitive deficits8, 17, motor changes8, emotional and hormonal alterations18, and the atrophy in specific neural system, such as the striatum, where mutant HTT aggregates were previously reported8. Thus, the full spectrum of HD patient symptoms could be modeled in nonhuman primates across the lifespan and be ben-eficial for the identification of early markers of HD disease and treatment.
Since micro-structural changes are expected to precede macro-structural changes, comparison between macro-structural imaging and micro-structural imaging could provide insight on progressive neurobiological changes4. Diffusion tensor imaging (DTI) is a non-invasive MRI technique for investigating micro-structural integrity of neuronal fibers19. Fractional anisotropy (FA), a scalar measure of the degree of anisotropic water diffusion of brain tissues, is commonly used for quantitative assessment of changes in white matter. Additionally, mean diffusivity (MD) characterizes the overall displacement of water molecules in tissue and is also related to the microstructural features of white matter organization20. In particular, axial diffusivity (Da) and radial diffusivity (Dr) can be used to reveal neuropathological changes, such as the disruption and loss of axonal membranes and myelin in the fiber tracts as well as changes in size, density and organization of axons21, 22. In addition, changes of microglia cells, astrocytosis, neuronal remodeling, or loss of specific fiber tracts could change FA and diffusivities in brain structures23, 24.
Although prior studies have suggested that DTI measurement is a valuable bio-marker to assess HD severity in human, limited longitudinal study has been performed to evaluate progressive changes25–31. In this study, DTI was performed on HD monkeys and age-matched control monkeys starting at six-months and at every 6-months interval up to 48 months of age to assess changes in the integrity of the white matter across development. To per-form exploratory unbiased analysis without any prior assumptions, tract-based spatial statistics (TBSS), a robust and sensitive approach for voxelwise multiple-subject comparisons of DTI data, was utilized to study white matter in fiber tracts and brain structures in this work32. Since rhesus monkeys have shorter life-span than humans33 and develop progressive changes in various clinical measurements8, 17, HD monkeys could be an ideal preclinical animal model for efficient assessments of early disease markers and novel therapeutics.
ResultsComparisons of the age at which maximal FA value was reached for the controls and HD animals indicated sig-nificant age differences in several brain structures including both gray and white matter (see Region of Interests (ROIs) in Fig. 1). These ROIs were selected for further analyses (see below) and included cortical areas, such as the right medial primary motor cortex (mPMC), the left ventral intraparietal cortex (VIP), and the anterior temporal area (TAa) bilaterally. ROIs in white matter included (a) long association fiber pathways, i.e. all three subcomponents of the superior longitudinal fasciculus (SLF) coursing between the parietal and frontal lobes (middle and posterior parts of SLF subcomponent I (i.e., SLF Im, SLF Ip)); anterior, middle and posterior parts of the SLF subcomponent II (i.e. SLF IIa, SLF IIm, SLF IIp); and middle part of SLF subcomponent III, the pos-terior part of arcuate fasciculus (AF) coursing from the parietotemporal region to the frontal lobe, the anterior part of the extreme capsule (EmC) coursing from the superior temporal gyrus to the frontal lobe, the middle and posterior parts of middle longitudinal fasciculus (MdLF) coursing from the parietal cortex to the temporal pole, the uncinate fasciculus (UF) coursing from the anterior temporal lobe to the medial and orbital prefrontal cortex, the occipital part of cingulum bundle (CB), parietal and mid-temporal parts of the inferior longitudinal fasciculus (ILF), and the dorsal occipital bundle (dOB) coursing from the preoccipital region to the calcarine. Other ROIs included the striatal bundles (StB) and external capsule (EC), the commissural fibers, i.e. the corpus callosum (anterior part of CC), the projection fibers, i.e., the internal capsule (IC) traveling to the brain stem and the sagittal stratum (SS) including fibers from the occipital cortex to the lateral geniculate nucleus and the medial longitudinal fasciculus (MLF), and the fornix (FX) coursing from the hippocampus to the anterior thalamus and ventromedial prefrontal cortex.
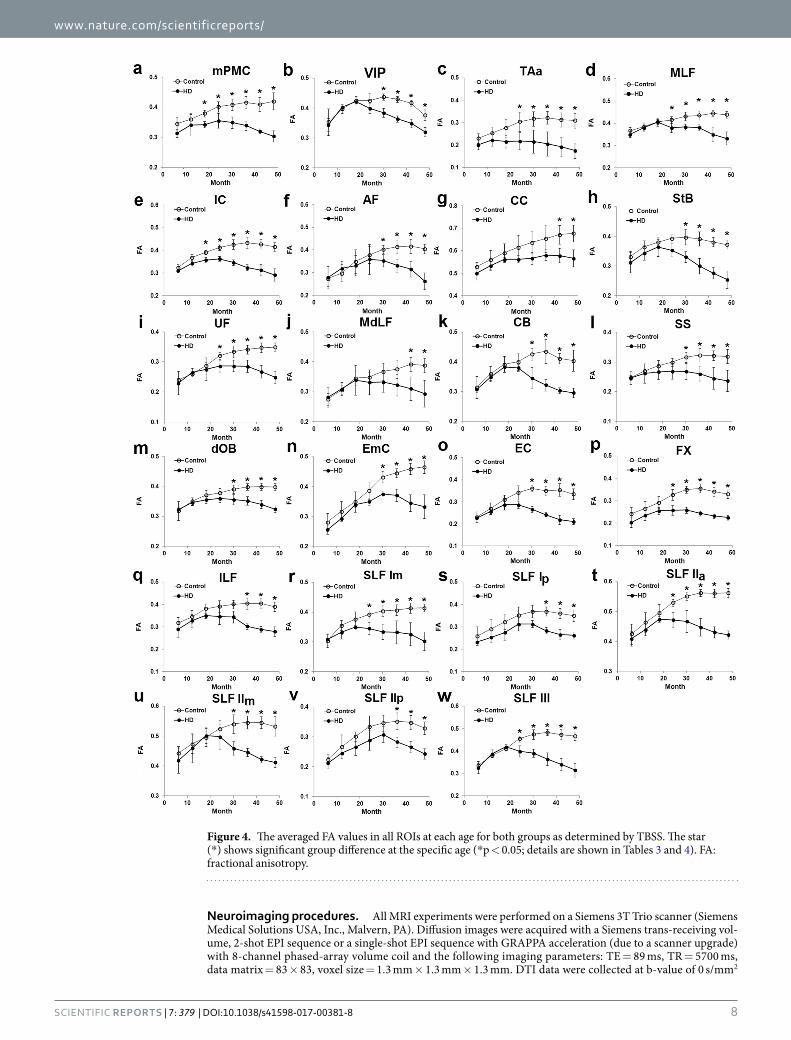
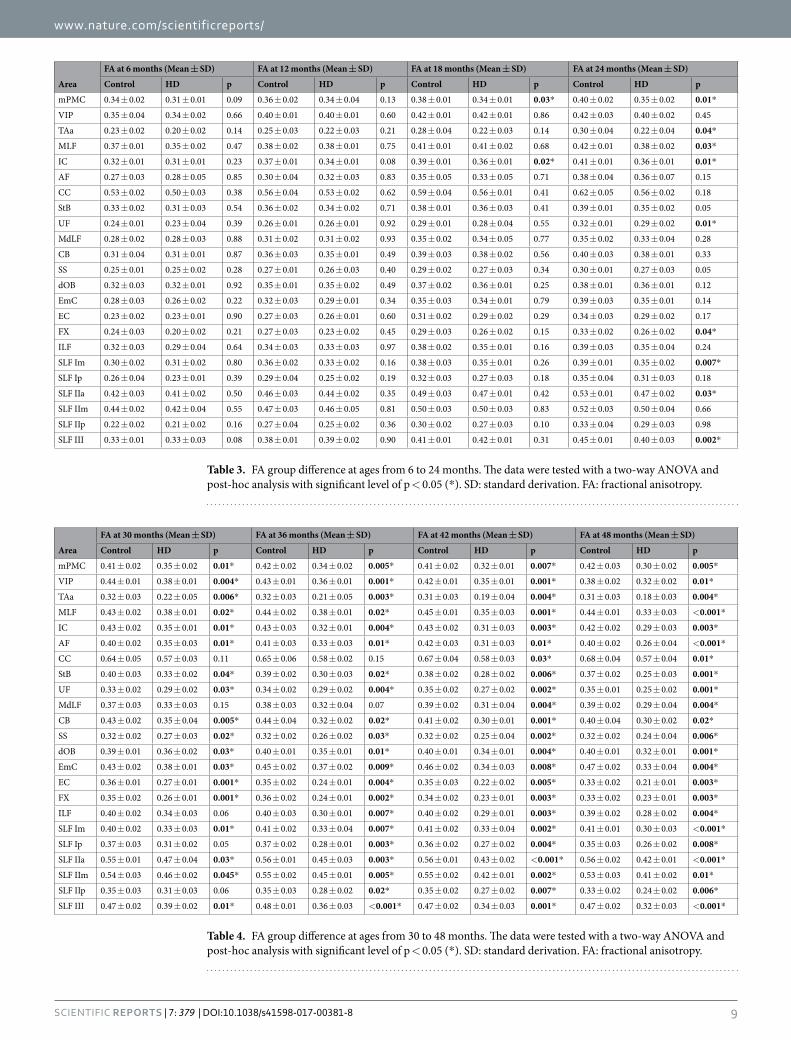
Taking IC as an example, DTI-derived measures of both controls and HD monkeys were fitted across ages using the Poisson model (Fig. 2). The fitting curves revealed that HD animals reached peak (FA)/bottom (MD) DTI-measures at younger ages than controls. HD monkeys also reached lower peak FA value and higher diffu-sivity measures (i.e., MD, Da and Dr) than control monkeys at 34 months of age. Further analyses indicated that the maximal FA value was reached at a younger age for the HD monkeys (22.7 ± 4.8 months) than for the con-trols (47.8 ± 11.7), revealing an arrest of white matter maturation in the HD group predicted by Poisson model (Fig. 3a,c,e and g; see Table 1 for details). Across ages, HD monkeys had significantly lower maximal FA values in all ROIs (Fig. 3b), but significantly higher minimum MD values only in CC and EC (Fig. 3d) as compared to controls. Finally, as compared to controls, the minimum Dr values of HD monkeys were significantly higher only in the fibers of StB (Fig. 3h), whereas the minimum Da values showed no difference between the two groups in all areas (Fig. 3f; see Table 2 for details). A two-way ANOVA analysis for FA values indicated a significant interaction between age and group for all ROIs (all ps < 0.05; see Fig. 4). Post hoc analysis (Tables 3 and 4) showed that no significant FA changes were observed between the two groups in any ROI at the early ages of 6 and 12 months. By 18 months of age, only mPMC and IC showed significant group differences in FA values (p < 0.05) and beginning at 24 months of age, more areas (MLF, UF, TAa, FX, SLF I, SLF II, SLF III) showed significant group differences in FA values. Finally by 42 months, significant group differences in FA values were observed in all ROIs. These results suggest that the emergence of white matter alterations for HD animals varied according to the different areas.
DiscussionWhite matter changes in developing HD monkey brains were investigated using DTI and TBSS analysis. Abnormal development patterns and micro-structural disruptions were observed not only in the fibers (i.e., StB and EC) connecting the cortical areas to the caudate and putamen, but also in multiple fiber tracts and few corti-cal areas across the whole brain. These findings are consistent with the widespread white matter loss reported in

www.nature.com/scientificreports/
3Scientific RepoRts | 7: 379 | DOI:10.1038/s41598-017-00381-8
structural imaging in HD patients as the disease progresses34, and the different onset of white matter changes in various areas could reflect different functional alterations in progressive stages in HD monkeys8. The data suggest that assessment of white matter integrity could be an effective non-invasive method to evaluate disease progres-sion in HD monkeys and to readily translate for patient diagnoses35, 36.
Method aspects. The TBSS processing strategy offers voxelwise comparisons of DTI-derived measures on the skeleton maps of the whole brain to avoid inter-rater variability and has been widely used in DTI studies32. Temporal evolution of both brain maturation and aging has been analyzed with a quadratic regression model37. The quadratic regression model assumes even slopes across both the developing and degenerating periods, thus the trend of the change would not be realistic throughout the lifespan38, 39. In contrast, the Poisson model con-siders different slopes in developing and aging periods and was able to capture asymmetric changes in diffusivity measurements over the lifespan37. Evolution pattern of DTI indices on brain maturation and aging has been found to adequately follow the Poisson regression model in both human and non-human primates’ brains15, 40. As illustrated in Fig. 2, the DTI-derived measures in normal groups changed faster in the initial than the latter periods, suggesting that an increase in white matter (dendrites and spines) emerges quickly in early postnatal brain development but degenerate slowly as pruning of nonfunctional contact occurs, which is consistent with a previous study40.
As shown in Fig. 2 and Tables 1 and 2, significant age differences between controls and HD monkeys were detected for the minimum/maximum DTI-derive measures. The group differences for the maximum FA were detected in all areas, but those for the minimum MD and Dr were detected in fewer areas, such as CC and EC, whereas no group difference was detected for the minimum Da in any area. The results confirmed the general sensitivity of FA for the white matter changes in the HD model used. Although the mechanism is complex, FA changes in white matter could be due to alterations of myelination, axon size, fiber geometry and extracellular water space21. Although not as sensitive as FA, the complementary diffusivity indice changes in the white matter,
Figure 1. TBSS analysis of the whole brain through the horizontal direction (z). Areas with red-yellow color (scale: from low to high) indicate significant group difference for the ages with maximum FA (p < 0.05, corrected with FDR). To facilitate visualization, voxels showing significant difference were thickened using the “tbss_fill” script implemented in the FSL software. In the following ROI-based analysis, DTI-derived measures within the areas were averaged from the corresponding skeletonized map (e.g., FA, in green color). L, R: left or right hemisphere.

www.nature.com/scientificreports/
4Scientific RepoRts | 7: 379 | DOI:10.1038/s41598-017-00381-8
such as Dr decrease, may reflect a disruption of the integrity of fiber myelin sheaths that was confirmed by elec-tron microscopy22, 41. In addition, astrocytosis and/or microglia remodeling may change the diffusion anisotropy and diffusivity in the gray matter brain structures23, 24. Considering that gray matter contains large amount of microglia cells and neuronal cell bodies but small amount of myelin42, the FA changes in mPMC, VIP, and TAa could be due to either astrocytosis, neuronal remodeling, or loss of specific fiber tracts. In this study, the earlier emergence of the peak in white matter tracts maturation in the HD animals as compared to controls may mostly reflect an earlier demyelination process, whereas the earlier emergence of the peak in white matter in brain struc-tures may be affected by earlier astrocytosis and/or microglia remodeling during development. The sensitivity of using FA was also demonstrated in the assessment of the time points at which the two groups differed in different areas (see Fig. 4 and in more details in Tables 3 and 4). The results also confirmed the ability of the Poisson regres-sion model to detect group differences at specific ages, even though some minimum/maximum DTI-derived measures could not differentiate the two groups.
White matter development in control monkey brains. Interestingly, in all cortical areas and fiber tracts (Fig. 4), control animals showed a sharp increase in white matter from birth until early adolescence (≈20–24 months) with sustained, yet reduced, growth thereafter through adolescence until adulthood (60 months). This developmental pattern parallels findings in an earlier DTI study in monkeys43. In addition, the peak of minimum/maximum DTI-derived measures follows a posterior-anterior pattern of the development with the posterior area reaching peak values slightly earlier than the anterior areas. For example, as seen in Table 1, the posterior parts of the superior longitudinal fasciculus (SLF Ip and SLF IIp) reached peak values earlier (38–39 months) than the more anterior parts (SLF Im: 47 months; SLF IIa: 57 months). Interestingly, the longest time to reach peak val-ues was found in the most anterior frontal tract, the extreme capsule (EmC: 81 months). These data indicated a rough posterior-anterior trend for white matter development in these control animals, confirming the later white matter maturation in the frontal lobe and fiber connectivity already shown in human and rhesus monkeys39, 43. Furthermore, at 12 months of age, the FA value of frontal cortex fibers (e.g., EmC, SLF IIa) was within 0.32~0.46, whereas it was much lower (0.27~0.29) in more posterior fibers (e.g., 0.29 for SLF Ip and 0.27 for SLF IIp). These results were also consistent with previous results indicating that by 10 months (≈300 days) FA was highest in frontal regions but lowest in occipital regions43. All our results showed that the white matter development in the control animals parallels similar pattern of white matter development previously reported, though the develop-ment pattern might be slightly affected by the type of rearing conditions used in different studies.
White matter alterations in HD monkey brains. In all areas analyzed, white matter in HD monkeys increased at roughly the same rate as controls from birth to early adolescence (≈24 months). However, as controls
Figure 2. An illustration of the developmental changes of the DTI-derived measures across ages for the internal capsule (IC) of HD and control animals, fitted with the Poisson model. FA: fractional anisotropy; MD: mean diffusivity; Da: axial diffusivity; Dr: radial diffusivity.

www.nature.com/scientificreports/
5Scientific RepoRts | 7: 379 | DOI:10.1038/s41598-017-00381-8
continue to show a slight white matter increase thereafter until adulthood, the HD monkeys demonstrated a sig-nificant decline. This development pattern suggests a widespread arrest, and then decline of white matter devel-opment in HD monkeys.
The hallmark of neuropathological changes in HD patients is the degeneration of caudate and putamen where atrophy takes place decades before the onset of motor and cognitive deficit44, 45. In HD monkeys, striatal growth ceased at 24 to 36 months of age, which is much earlier than that seen in control monkeys8. In the present study, maximal FA in StB fibers coursing in the external capsule on their way to the lateral putamen in HD monkeys
Figure 3. A graphical representation of the age (months) for the minimum/maximum DTI-derived measures (a,c,e,g), and for the minimum/maximum DTI-derived measures (d,f,h; unit: 10−3 mm2/s) averaged across all ages for each ROI. Details are shown in Tables 1 and 2. The star (*) indicates significant group difference with FDR correction (q = 0.05). FA: fractional anisotropy; MD: mean diffusivity; Da: axial diffusivity; Dr: radial diffusivity. Note that for Fig. 3(a,c,e,g), the y-axis value represents the age (months) predicted by the Poisson model and thus could exceed the actual age range of the animals used in the study (48 months).
www.nature.com/scientificreports/
6Scientific RepoRts | 7: 379 | DOI:10.1038/s41598-017-00381-8
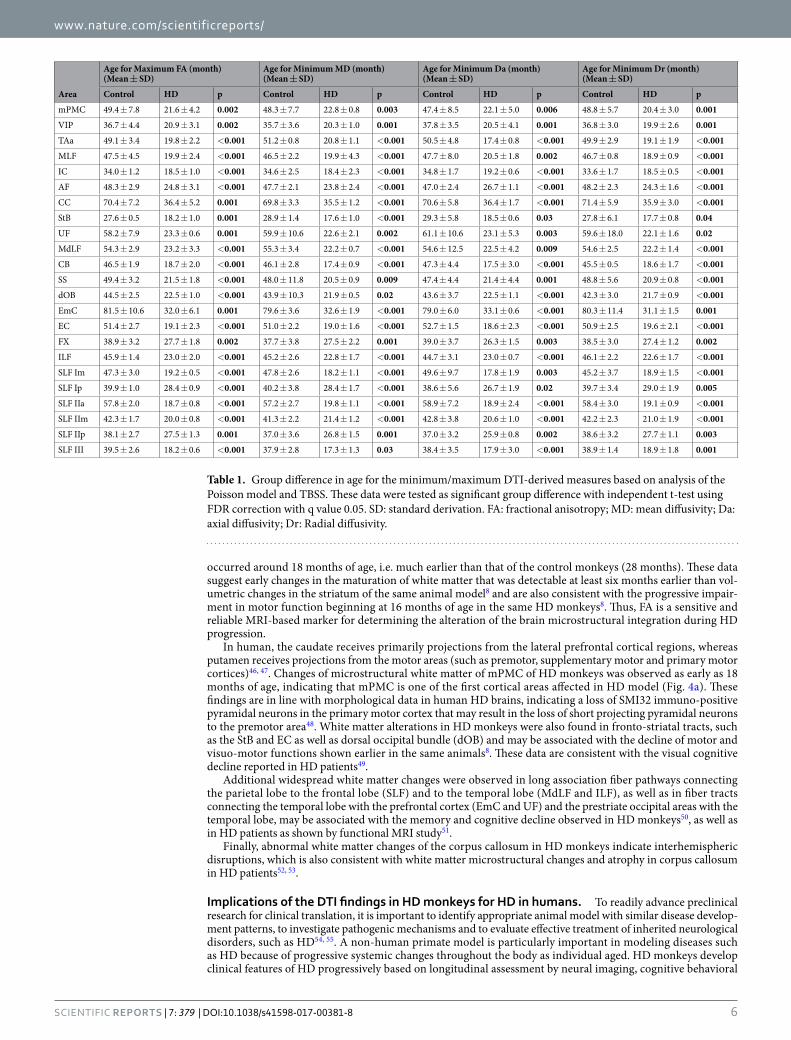
occurred around 18 months of age, i.e. much earlier than that of the control monkeys (28 months). These data suggest early changes in the maturation of white matter that was detectable at least six months earlier than vol-umetric changes in the striatum of the same animal model8 and are also consistent with the progressive impair-ment in motor function beginning at 16 months of age in the same HD monkeys8. Thus, FA is a sensitive and reliable MRI-based marker for determining the alteration of the brain microstructural integration during HD progression.
In human, the caudate receives primarily projections from the lateral prefrontal cortical regions, whereas putamen receives projections from the motor areas (such as premotor, supplementary motor and primary motor cortices)46, 47. Changes of microstructural white matter of mPMC of HD monkeys was observed as early as 18 months of age, indicating that mPMC is one of the first cortical areas affected in HD model (Fig. 4a). These findings are in line with morphological data in human HD brains, indicating a loss of SMI32 immuno-positive pyramidal neurons in the primary motor cortex that may result in the loss of short projecting pyramidal neurons to the premotor area48. White matter alterations in HD monkeys were also found in fronto-striatal tracts, such as the StB and EC as well as dorsal occipital bundle (dOB) and may be associated with the decline of motor and visuo-motor functions shown earlier in the same animals8. These data are consistent with the visual cognitive decline reported in HD patients49.
Additional widespread white matter changes were observed in long association fiber pathways connecting the parietal lobe to the frontal lobe (SLF) and to the temporal lobe (MdLF and ILF), as well as in fiber tracts connecting the temporal lobe with the prefrontal cortex (EmC and UF) and the prestriate occipital areas with the temporal lobe, may be associated with the memory and cognitive decline observed in HD monkeys50, as well as in HD patients as shown by functional MRI study51.
Finally, abnormal white matter changes of the corpus callosum in HD monkeys indicate interhemispheric disruptions, which is also consistent with white matter microstructural changes and atrophy in corpus callosum in HD patients52, 53.
Implications of the DTI findings in HD monkeys for HD in humans. To readily advance preclinical research for clinical translation, it is important to identify appropriate animal model with similar disease develop-ment patterns, to investigate pathogenic mechanisms and to evaluate effective treatment of inherited neurological disorders, such as HD54, 55. A non-human primate model is particularly important in modeling diseases such as HD because of progressive systemic changes throughout the body as individual aged. HD monkeys develop clinical features of HD progressively based on longitudinal assessment by neural imaging, cognitive behavioral
Area
Age for Maximum FA (month) (Mean ± SD)
Age for Minimum MD (month) (Mean ± SD)
Age for Minimum Da (month) (Mean ± SD)
Age for Minimum Dr (month) (Mean ± SD)
Control HD p Control HD p Control HD p Control HD p
mPMC 49.4 ± 7.8 21.6 ± 4.2 0.002 48.3 ± 7.7 22.8 ± 0.8 0.003 47.4 ± 8.5 22.1 ± 5.0 0.006 48.8 ± 5.7 20.4 ± 3.0 0.001
VIP 36.7 ± 4.4 20.9 ± 3.1 0.002 35.7 ± 3.6 20.3 ± 1.0 0.001 37.8 ± 3.5 20.5 ± 4.1 0.001 36.8 ± 3.0 19.9 ± 2.6 0.001
TAa 49.1 ± 3.4 19.8 ± 2.2 <0.001 51.2 ± 0.8 20.8 ± 1.1 <0.001 50.5 ± 4.8 17.4 ± 0.8 <0.001 49.9 ± 2.9 19.1 ± 1.9 <0.001
MLF 47.5 ± 4.5 19.9 ± 2.4 <0.001 46.5 ± 2.2 19.9 ± 4.3 <0.001 47.7 ± 8.0 20.5 ± 1.8 0.002 46.7 ± 0.8 18.9 ± 0.9 <0.001
IC 34.0 ± 1.2 18.5 ± 1.0 <0.001 34.6 ± 2.5 18.4 ± 2.3 <0.001 34.8 ± 1.7 19.2 ± 0.6 <0.001 33.6 ± 1.7 18.5 ± 0.5 <0.001
AF 48.3 ± 2.9 24.8 ± 3.1 <0.001 47.7 ± 2.1 23.8 ± 2.4 <0.001 47.0 ± 2.4 26.7 ± 1.1 <0.001 48.2 ± 2.3 24.3 ± 1.6 <0.001
CC 70.4 ± 7.2 36.4 ± 5.2 0.001 69.8 ± 3.3 35.5 ± 1.2 <0.001 70.6 ± 5.8 36.4 ± 1.7 <0.001 71.4 ± 5.9 35.9 ± 3.0 <0.001
StB 27.6 ± 0.5 18.2 ± 1.0 0.001 28.9 ± 1.4 17.6 ± 1.0 <0.001 29.3 ± 5.8 18.5 ± 0.6 0.03 27.8 ± 6.1 17.7 ± 0.8 0.04
UF 58.2 ± 7.9 23.3 ± 0.6 0.001 59.9 ± 10.6 22.6 ± 2.1 0.002 61.1 ± 10.6 23.1 ± 5.3 0.003 59.6 ± 18.0 22.1 ± 1.6 0.02
MdLF 54.3 ± 2.9 23.2 ± 3.3 <0.001 55.3 ± 3.4 22.2 ± 0.7 <0.001 54.6 ± 12.5 22.5 ± 4.2 0.009 54.6 ± 2.5 22.2 ± 1.4 <0.001
CB 46.5 ± 1.9 18.7 ± 2.0 <0.001 46.1 ± 2.8 17.4 ± 0.9 <0.001 47.3 ± 4.4 17.5 ± 3.0 <0.001 45.5 ± 0.5 18.6 ± 1.7 <0.001
SS 49.4 ± 3.2 21.5 ± 1.8 <0.001 48.0 ± 11.8 20.5 ± 0.9 0.009 47.4 ± 4.4 21.4 ± 4.4 0.001 48.8 ± 5.6 20.9 ± 0.8 <0.001
dOB 44.5 ± 2.5 22.5 ± 1.0 <0.001 43.9 ± 10.3 21.9 ± 0.5 0.02 43.6 ± 3.7 22.5 ± 1.1 <0.001 42.3 ± 3.0 21.7 ± 0.9 <0.001
EmC 81.5 ± 10.6 32.0 ± 6.1 0.001 79.6 ± 3.6 32.6 ± 1.9 <0.001 79.0 ± 6.0 33.1 ± 0.6 <0.001 80.3 ± 11.4 31.1 ± 1.5 0.001
EC 51.4 ± 2.7 19.1 ± 2.3 <0.001 51.0 ± 2.2 19.0 ± 1.6 <0.001 52.7 ± 1.5 18.6 ± 2.3 <0.001 50.9 ± 2.5 19.6 ± 2.1 <0.001
FX 38.9 ± 3.2 27.7 ± 1.8 0.002 37.7 ± 3.8 27.5 ± 2.2 0.001 39.0 ± 3.7 26.3 ± 1.5 0.003 38.5 ± 3.0 27.4 ± 1.2 0.002
ILF 45.9 ± 1.4 23.0 ± 2.0 <0.001 45.2 ± 2.6 22.8 ± 1.7 <0.001 44.7 ± 3.1 23.0 ± 0.7 <0.001 46.1 ± 2.2 22.6 ± 1.7 <0.001
SLF Im 47.3 ± 3.0 19.2 ± 0.5 <0.001 47.8 ± 2.6 18.2 ± 1.1 <0.001 49.6 ± 9.7 17.8 ± 1.9 0.003 45.2 ± 3.7 18.9 ± 1.5 <0.001
SLF Ip 39.9 ± 1.0 28.4 ± 0.9 <0.001 40.2 ± 3.8 28.4 ± 1.7 <0.001 38.6 ± 5.6 26.7 ± 1.9 0.02 39.7 ± 3.4 29.0 ± 1.9 0.005
SLF IIa 57.8 ± 2.0 18.7 ± 0.8 <0.001 57.2 ± 2.7 19.8 ± 1.1 <0.001 58.9 ± 7.2 18.9 ± 2.4 <0.001 58.4 ± 3.0 19.1 ± 0.9 <0.001
SLF IIm 42.3 ± 1.7 20.0 ± 0.8 <0.001 41.3 ± 2.2 21.4 ± 1.2 <0.001 42.8 ± 3.8 20.6 ± 1.0 <0.001 42.2 ± 2.3 21.0 ± 1.9 <0.001
SLF IIp 38.1 ± 2.7 27.5 ± 1.3 0.001 37.0 ± 3.6 26.8 ± 1.5 0.001 37.0 ± 3.2 25.9 ± 0.8 0.002 38.6 ± 3.2 27.7 ± 1.1 0.003
SLF III 39.5 ± 2.6 18.2 ± 0.6 <0.001 37.9 ± 2.8 17.3 ± 1.3 0.03 38.4 ± 3.5 17.9 ± 3.0 <0.001 38.9 ± 1.4 18.9 ± 1.8 0.001
Table 1. Group difference in age for the minimum/maximum DTI-derived measures based on analysis of the Poisson model and TBSS. These data were tested as significant group difference with independent t-test using FDR correction with q value 0.05. SD: standard derivation. FA: fractional anisotropy; MD: mean diffusivity; Da: axial diffusivity; Dr: Radial diffusivity.

www.nature.com/scientificreports/
7Scientific RepoRts | 7: 379 | DOI:10.1038/s41598-017-00381-8
assessment and molecular profiling studies8, 17, 56, 57. Through longitudinal DTI study, progressive spatial-temporal white matter changes in HD brains were revealed for the first time and aligned with symptom development as disease progresses in HD monkeys. Thus, HD monkeys can potentially be used as preclinical large animal model to facilitate the development of novel biomarkers through noninvasive imaging.
Compared to control subjects, this model shows widespread white matter alterations in brain areas (i.e., fron-tal, parietal, temporal, occipital lobes, cerebellum and brain stem) where macro-atrophy, micro-structural, and/or functional changes have also been found in HD patients34, 58, 59. Micro-structural white matter changes in the motor, sensory and cognitive brain areas are consistent with those observed in prodromal and symptomatic HD patients58, 59. However, longitudinal changes of white matter microstructures were rarely reported and these studies involved limited progressive disease stages and only adult HD patients26, 30. There were also case reports in juvenile onset HD patients, in whom volume losses were found in caudate nucleus and putamen60–62. These findings in juvenile onset HD patients are in agreement with the monkey results during brain development. However, due to the feasibility, developmental changes in white matter from infancy to adulthood have not yet been reported in human HD patients.
Methods and MaterialsAnimals. Three HD rhesus monkeys (Macaca mulatta, male) were generated by using lentiviral-mediated transgenesis as previously described8, 63. HD monkeys carry Exon 1–10 of the human HTT gene with expanded polyglutamine repeats (67Q, 70Q, and 72Q) under the regulation of the human HTT promoter8, 57. Four age-matched non-transgenic control monkeys (2 males and 2 females) were used in this study. During MRI scans, animals were anesthetized with 1–1.5% isoflurane mixed with 100% O2 and immobilized in a supine position in a custom-made head holder. Et-CO2, inhaled CO2, O2 saturation, blood pressure, heart rate, respiration rate and body temperature were monitored continuously and the body temperature was maintained with a warm blanket surrounding the animal. All procedures were approved and in compliance with the Institutional Animal Care and Use Committees (IACUC) of Emory University and the NIH guide for the care and use of laboratory animals. All animals were reared under the same conditions after birth. In brief, post-delivery, infants were surrogate/nurs-ery-reared in the primate nursery of the Yerkes National Primate Research Center (Atlanta, GA) that allow nor-mal growth as well as the development of species-specific social skills. All animals received the same treatments and procedures designed for the longitudinal MRI scans. They were monitored at least twice daily from birth by the research team or by animal care personnel at the YNPRC.
Area
FA (Mean ± SD) MD (×10−3 mm2/s) (Mean ± SD) Da (×10−3 mm2/s) (Mean ± SD) Dr (×10−3 mm2/s) (Mean ± SD)
Control HD p Control HD p Control HD p Control HD p
mPMC 0.42 ± 0.03 0.36 ± 0.04 0.04* 0.62 ± 0.08 0.68 ± 0.04 0.28 0.94 ± 0.04 0.94 ± 0.05 0.99 0.54 ± 0.08 0.56 ± 0.02 0.79
VIP 0.46 ± 0.01 0.41 ± 0.02 0.008* 0.64 ± 0.02 0.66 ± 0.01 0.17 0.87 ± 0.04 0.90 ± 0.04 0.34 0.48 ± 0.05 0.52 ± 0.02 0.22
TAa 0.31 ± 0.02 0.22 ± 0.02 0.002* 0.65 ± 0.06 0.70 ± 0.02 0.25 0.84 ± 0.06 0.88 ± 0.04 0.36 0.55 ± 0.07 0.64 ± 0.02 0.09
MLF 0.46 ± 0.01 0.39 ± 0.02 0.002* 0.64 ± 0.03 0.66 ± 0.01 0.21 0.98 ± 0.07 0.99 ± 0.01 0.79 0.43 ± 0.01 0.51 ± 0.05 0.01
IC 0.41 ± 0.01 0.36 ± 0.01 0.001* 0.69 ± 0.02 0.74 ± 0.04 0.08 0.95 ± 0.05 1.01 ± 0.01 0.09 0.56 ± 0.02 0.60 ± 0.03 0.07
AF 0.42 ± 0.03 0.36 ± 0.02 0.02* 0.64 ± 0.03 0.69 ± 0.05 0.15 0.89 ± 0.06 0.99 ± 0.06 0.07 0.47 ± 0.06 0.54 ± 0.03 0.11
CC 0.67 ± 0.04 0.58 ± 0.01 0.02* 0.68 ± 0.02 0.77 ± 0.01 0.001* 1.11 ± 0.09 1.06 ± 0.04 0.43 0.44 ± 0.01 0.49 ± 0.02 0.01
StB 0.41 ± 0.02 0.35 ± 0.02 0.01* 0.68 ± 0.04 0.80 ± 0.04 0.008 1.10 ± 0.14 1.13 ± 0.05 0.68 0.47 ± 0.03 0.62 ± 0.04 0.002*
UF 0.35 ± 0.02 0.29 ± 0.02 0.007* 0.62 ± 0.06 0.72 ± 0.09 0.14 0.94 ± 0.03 0.92 ± 0.20 0.87 0.51 ± 0.06 0.58 ± 0.06 0.20
MdLF 0.39 ± 0.01 0.33 ± 0.02 0.004* 0.61 ± 0.06 0.69 ± 0.04 0.10 0.93 ± 0.06 0.96 ± 0.04 0.56 0.50 ± 0.06 0.58 ± 0.03 0.08
CB 0.44 ± 0.02 0.38 ± 0.01 0.01* 0.67 ± 0.08 0.71 ± 0.07 0.42 0.94 ± 0.10 1.04 ± 0.08 0.22 0.50 ± 0.02 0.55 ± 0.05 0.16
SS 0.32 ± 0.02 0.26 ± 0.02 0.01* 0.70 ± 0.05 0.72 ± 0.02 0.73 0.90 ± 0.07 0.98 ± 0.04 0.17 0.60 ± 0.05 0.59 ± 0.02 0.64
dOB 0.40 ± 0.02 0.36 ± 0.01 0.02* 0.59 ± 0.06 0.68 ± 0.01 0.06 0.89 ± 0.05 0.95 ± 0.02 0.11 0.46 ± 0.04 0.55 ± 0.01 0.02
EmC 0.47 ± 0.03 0.37 ± 0.04 0.02* 0.65 ± 0.05 0.72 ± 0.04 0.11 0.94 ± 0.05 1.00 ± 0.05 0.24 0.49 ± 0.06 0.58 ± 0.06 0.09
EC 0.36 ± 0.02 0.30 ± 0.01 0.007* 0.63 ± 0.01 0.70 ± 0.02 0.001* 0.94 ± 0.07 0.99 ± 0.02 0.27 0.56 ± 0.06 0.63 ± 0.03 0.13
FX 0.36 ± 0.01 0.26 ± 0.02 0.001* 0.79 ± 0.06 0.85 ± 0.08 0.29 0.99 ± 0.07 1.06 ± 0.02 0.15 0.64 ± 0.04 0.72 ± 0.05 0.09
ILF 0.41 ± 0.02 0.35 ± 0.02 0.02* 0.65 ± 0.05 0.70 ± 0.02 0.19 0.98 ± 0.04 1.04 ± 0.03 0.07 0.54 ± 0.04 0.62 ± 0.02 0.02
SLF Im 0.42 ± 0.01 0.36 ± 0.03 0.03* 0.63 ± 0.07 0.70 ± 0.04 0.17 0.94 ± 0.04 0.97 ± 0.04 0.44 0.50 ± 0.06 0.54 ± 0.02 0.38
SLF Ip 0.37 ± 0.01 0.32 ± 0.02 0.02* 0.65 ± 0.08 0.69 ± 0.02 0.39 0.88 ± 0.05 0.95 ± 0.07 0.17 0.52 ± 0.04 0.58 ± 0.06 0.16
SLF IIa 0.56 ± 0.01 0.46 ± 0.01 <0.001* 0.63 ± 0.07 0.68 ± 0.03 0.28 1.03 ± 0.07 1.09 ± 0.06 0.34 0.42 ± 0.02 0.46 ± 0.03 0.13
SLF IIm 0.55 ± 0.01 0.51 ± 0.01 0.001* 0.58 ± 0.06 0.63 ± 0.02 0.31 0.90 ± 0.15 1.10 ± 0.06 0.11 0.41 ± 0.02 0.45 ± 0.02 0.07
SLF IIp 0.36 ± 0.02 0.31 ± 0.02 0.01* 0.58 ± 0.07 0.64 ± 0.04 0.28 0.78 ± 0.01 0.79 ± 0.02 0.70 0.51 ± 0.05 0.54 ± 0.06 0.54
SLF III 0.48 ± 0.01 0.41 ± 0.02 0.002* 0.68 ± 0.03 0.70 ± 0.02 0.30 0.93 ± 0.11 1.04 ± 0.01 0.18 0.51 ± 0.02 0.53 ± 0.01 0.11
Table 2. Group difference in the minimum/maximum DTI-derived measures based on analysis of the Poisson model and TBSS. These data were tested as significant group difference with independent t-test using FDR correction with q value 0.05 (*). SD: standard derivation. FA: fractional anisotropy; MD: mean diffusivity; Da: axial diffusivity; Dr: Radial diffusivity.
www.nature.com/scientificreports/
8Scientific RepoRts | 7: 379 | DOI:10.1038/s41598-017-00381-8
Neuroimaging procedures. All MRI experiments were performed on a Siemens 3T Trio scanner (Siemens Medical Solutions USA, Inc., Malvern, PA). Diffusion images were acquired with a Siemens trans-receiving vol-ume, 2-shot EPI sequence or a single-shot EPI sequence with GRAPPA acceleration (due to a scanner upgrade) with 8-channel phased-array volume coil and the following imaging parameters: TE = 89 ms, TR = 5700 ms, data matrix = 83 × 83, voxel size = 1.3 mm × 1.3 mm × 1.3 mm. DTI data were collected at b-value of 0 s/mm2
Figure 4. The averaged FA values in all ROIs at each age for both groups as determined by TBSS. The star (*) shows significant group difference at the specific age (*p < 0.05; details are shown in Tables 3 and 4). FA: fractional anisotropy.
www.nature.com/scientificreports/
9Scientific RepoRts | 7: 379 | DOI:10.1038/s41598-017-00381-8
Area
FA at 6 months (Mean ± SD) FA at 12 months (Mean ± SD) FA at 18 months (Mean ± SD) FA at 24 months (Mean ± SD)
Control HD p Control HD p Control HD p Control HD p
mPMC 0.34 ± 0.02 0.31 ± 0.01 0.09 0.36 ± 0.02 0.34 ± 0.04 0.13 0.38 ± 0.01 0.34 ± 0.01 0.03* 0.40 ± 0.02 0.35 ± 0.02 0.01*
VIP 0.35 ± 0.04 0.34 ± 0.02 0.66 0.40 ± 0.01 0.40 ± 0.01 0.60 0.42 ± 0.01 0.42 ± 0.01 0.86 0.42 ± 0.03 0.40 ± 0.02 0.45
TAa 0.23 ± 0.02 0.20 ± 0.02 0.14 0.25 ± 0.03 0.22 ± 0.03 0.21 0.28 ± 0.04 0.22 ± 0.03 0.14 0.30 ± 0.04 0.22 ± 0.04 0.04*
MLF 0.37 ± 0.01 0.35 ± 0.02 0.47 0.38 ± 0.02 0.38 ± 0.01 0.75 0.41 ± 0.01 0.41 ± 0.02 0.68 0.42 ± 0.01 0.38 ± 0.02 0.03*
IC 0.32 ± 0.01 0.31 ± 0.01 0.23 0.37 ± 0.01 0.34 ± 0.01 0.08 0.39 ± 0.01 0.36 ± 0.01 0.02* 0.41 ± 0.01 0.36 ± 0.01 0.01*
AF 0.27 ± 0.03 0.28 ± 0.05 0.85 0.30 ± 0.04 0.32 ± 0.03 0.83 0.35 ± 0.05 0.33 ± 0.05 0.71 0.38 ± 0.04 0.36 ± 0.07 0.15
CC 0.53 ± 0.02 0.50 ± 0.03 0.38 0.56 ± 0.04 0.53 ± 0.02 0.62 0.59 ± 0.04 0.56 ± 0.01 0.41 0.62 ± 0.05 0.56 ± 0.02 0.18
StB 0.33 ± 0.02 0.31 ± 0.03 0.54 0.36 ± 0.02 0.34 ± 0.02 0.71 0.38 ± 0.01 0.36 ± 0.03 0.41 0.39 ± 0.01 0.35 ± 0.02 0.05
UF 0.24 ± 0.01 0.23 ± 0.04 0.39 0.26 ± 0.01 0.26 ± 0.01 0.92 0.29 ± 0.01 0.28 ± 0.04 0.55 0.32 ± 0.01 0.29 ± 0.02 0.01*
MdLF 0.28 ± 0.02 0.28 ± 0.03 0.88 0.31 ± 0.02 0.31 ± 0.02 0.93 0.35 ± 0.02 0.34 ± 0.05 0.77 0.35 ± 0.02 0.33 ± 0.04 0.28
CB 0.31 ± 0.04 0.31 ± 0.01 0.87 0.36 ± 0.03 0.35 ± 0.01 0.49 0.39 ± 0.03 0.38 ± 0.02 0.56 0.40 ± 0.03 0.38 ± 0.01 0.33
SS 0.25 ± 0.01 0.25 ± 0.02 0.28 0.27 ± 0.01 0.26 ± 0.03 0.40 0.29 ± 0.02 0.27 ± 0.03 0.34 0.30 ± 0.01 0.27 ± 0.03 0.05
dOB 0.32 ± 0.03 0.32 ± 0.01 0.92 0.35 ± 0.01 0.35 ± 0.02 0.49 0.37 ± 0.02 0.36 ± 0.01 0.25 0.38 ± 0.01 0.36 ± 0.01 0.12
EmC 0.28 ± 0.03 0.26 ± 0.02 0.22 0.32 ± 0.03 0.29 ± 0.01 0.34 0.35 ± 0.03 0.34 ± 0.01 0.79 0.39 ± 0.03 0.35 ± 0.01 0.14
EC 0.23 ± 0.02 0.23 ± 0.01 0.90 0.27 ± 0.03 0.26 ± 0.01 0.60 0.31 ± 0.02 0.29 ± 0.02 0.29 0.34 ± 0.03 0.29 ± 0.02 0.17
FX 0.24 ± 0.03 0.20 ± 0.02 0.21 0.27 ± 0.03 0.23 ± 0.02 0.45 0.29 ± 0.03 0.26 ± 0.02 0.15 0.33 ± 0.02 0.26 ± 0.02 0.04*
ILF 0.32 ± 0.03 0.29 ± 0.04 0.64 0.34 ± 0.03 0.33 ± 0.03 0.97 0.38 ± 0.02 0.35 ± 0.01 0.16 0.39 ± 0.03 0.35 ± 0.04 0.24
SLF Im 0.30 ± 0.02 0.31 ± 0.02 0.80 0.36 ± 0.02 0.33 ± 0.02 0.16 0.38 ± 0.03 0.35 ± 0.01 0.26 0.39 ± 0.01 0.35 ± 0.02 0.007*
SLF Ip 0.26 ± 0.04 0.23 ± 0.01 0.39 0.29 ± 0.04 0.25 ± 0.02 0.19 0.32 ± 0.03 0.27 ± 0.03 0.18 0.35 ± 0.04 0.31 ± 0.03 0.18
SLF IIa 0.42 ± 0.03 0.41 ± 0.02 0.50 0.46 ± 0.03 0.44 ± 0.02 0.35 0.49 ± 0.03 0.47 ± 0.01 0.42 0.53 ± 0.01 0.47 ± 0.02 0.03*
SLF IIm 0.44 ± 0.02 0.42 ± 0.04 0.55 0.47 ± 0.03 0.46 ± 0.05 0.81 0.50 ± 0.03 0.50 ± 0.03 0.83 0.52 ± 0.03 0.50 ± 0.04 0.66
SLF IIp 0.22 ± 0.02 0.21 ± 0.02 0.16 0.27 ± 0.04 0.25 ± 0.02 0.36 0.30 ± 0.02 0.27 ± 0.03 0.10 0.33 ± 0.04 0.29 ± 0.03 0.98
SLF III 0.33 ± 0.01 0.33 ± 0.03 0.08 0.38 ± 0.01 0.39 ± 0.02 0.90 0.41 ± 0.01 0.42 ± 0.01 0.31 0.45 ± 0.01 0.40 ± 0.03 0.002*
Table 3. FA group difference at ages from 6 to 24 months. The data were tested with a two-way ANOVA and post-hoc analysis with significant level of p < 0.05 (*). SD: standard derivation. FA: fractional anisotropy.
Area
FA at 30 months (Mean ± SD) FA at 36 months (Mean ± SD) FA at 42 months (Mean ± SD) FA at 48 months (Mean ± SD)
Control HD p Control HD p Control HD p Control HD p
mPMC 0.41 ± 0.02 0.35 ± 0.02 0.01* 0.42 ± 0.02 0.34 ± 0.02 0.005* 0.41 ± 0.02 0.32 ± 0.01 0.007* 0.42 ± 0.03 0.30 ± 0.02 0.005*
VIP 0.44 ± 0.01 0.38 ± 0.01 0.004* 0.43 ± 0.01 0.36 ± 0.01 0.001* 0.42 ± 0.01 0.35 ± 0.01 0.001* 0.38 ± 0.02 0.32 ± 0.02 0.01*
TAa 0.32 ± 0.03 0.22 ± 0.05 0.006* 0.32 ± 0.03 0.21 ± 0.05 0.003* 0.31 ± 0.03 0.19 ± 0.04 0.004* 0.31 ± 0.03 0.18 ± 0.03 0.004*
MLF 0.43 ± 0.02 0.38 ± 0.01 0.02* 0.44 ± 0.02 0.38 ± 0.01 0.02* 0.45 ± 0.01 0.35 ± 0.03 0.001* 0.44 ± 0.01 0.33 ± 0.03 <0.001*
IC 0.43 ± 0.02 0.35 ± 0.01 0.01* 0.43 ± 0.03 0.32 ± 0.01 0.004* 0.43 ± 0.02 0.31 ± 0.03 0.003* 0.42 ± 0.02 0.29 ± 0.03 0.003*
AF 0.40 ± 0.02 0.35 ± 0.03 0.01* 0.41 ± 0.03 0.33 ± 0.03 0.01* 0.42 ± 0.03 0.31 ± 0.03 0.01* 0.40 ± 0.02 0.26 ± 0.04 <0.001*
CC 0.64 ± 0.05 0.57 ± 0.03 0.11 0.65 ± 0.06 0.58 ± 0.02 0.15 0.67 ± 0.04 0.58 ± 0.03 0.03* 0.68 ± 0.04 0.57 ± 0.04 0.01*
StB 0.40 ± 0.03 0.33 ± 0.02 0.04* 0.39 ± 0.02 0.30 ± 0.03 0.02* 0.38 ± 0.02 0.28 ± 0.02 0.006* 0.37 ± 0.02 0.25 ± 0.03 0.001*
UF 0.33 ± 0.02 0.29 ± 0.02 0.03* 0.34 ± 0.02 0.29 ± 0.02 0.004* 0.35 ± 0.02 0.27 ± 0.02 0.002* 0.35 ± 0.01 0.25 ± 0.02 0.001*
MdLF 0.37 ± 0.03 0.33 ± 0.03 0.15 0.38 ± 0.03 0.32 ± 0.04 0.07 0.39 ± 0.02 0.31 ± 0.04 0.004* 0.39 ± 0.02 0.29 ± 0.04 0.004*
CB 0.43 ± 0.02 0.35 ± 0.04 0.005* 0.44 ± 0.04 0.32 ± 0.02 0.02* 0.41 ± 0.02 0.30 ± 0.01 0.001* 0.40 ± 0.04 0.30 ± 0.02 0.02*
SS 0.32 ± 0.02 0.27 ± 0.03 0.02* 0.32 ± 0.02 0.26 ± 0.02 0.03* 0.32 ± 0.02 0.25 ± 0.04 0.002* 0.32 ± 0.02 0.24 ± 0.04 0.006*
dOB 0.39 ± 0.01 0.36 ± 0.02 0.03* 0.40 ± 0.01 0.35 ± 0.01 0.01* 0.40 ± 0.01 0.34 ± 0.01 0.004* 0.40 ± 0.01 0.32 ± 0.01 0.001*
EmC 0.43 ± 0.02 0.38 ± 0.01 0.03* 0.45 ± 0.02 0.37 ± 0.02 0.009* 0.46 ± 0.02 0.34 ± 0.03 0.008* 0.47 ± 0.02 0.33 ± 0.04 0.004*
EC 0.36 ± 0.01 0.27 ± 0.01 0.001* 0.35 ± 0.02 0.24 ± 0.01 0.004* 0.35 ± 0.03 0.22 ± 0.02 0.005* 0.33 ± 0.02 0.21 ± 0.01 0.003*
FX 0.35 ± 0.02 0.26 ± 0.01 0.001* 0.36 ± 0.02 0.24 ± 0.01 0.002* 0.34 ± 0.02 0.23 ± 0.01 0.003* 0.33 ± 0.02 0.23 ± 0.01 0.003*
ILF 0.40 ± 0.02 0.34 ± 0.03 0.06 0.40 ± 0.03 0.30 ± 0.01 0.007* 0.40 ± 0.02 0.29 ± 0.01 0.003* 0.39 ± 0.02 0.28 ± 0.02 0.004*
SLF Im 0.40 ± 0.02 0.33 ± 0.03 0.01* 0.41 ± 0.02 0.33 ± 0.04 0.007* 0.41 ± 0.02 0.33 ± 0.04 0.002* 0.41 ± 0.01 0.30 ± 0.03 <0.001*
SLF Ip 0.37 ± 0.03 0.31 ± 0.02 0.05 0.37 ± 0.02 0.28 ± 0.01 0.003* 0.36 ± 0.02 0.27 ± 0.02 0.004* 0.35 ± 0.03 0.26 ± 0.02 0.008*
SLF IIa 0.55 ± 0.01 0.47 ± 0.04 0.03* 0.56 ± 0.01 0.45 ± 0.03 0.003* 0.56 ± 0.01 0.43 ± 0.02 <0.001* 0.56 ± 0.02 0.42 ± 0.01 <0.001*
SLF IIm 0.54 ± 0.03 0.46 ± 0.02 0.045* 0.55 ± 0.02 0.45 ± 0.01 0.005* 0.55 ± 0.02 0.42 ± 0.01 0.002* 0.53 ± 0.03 0.41 ± 0.02 0.01*
SLF IIp 0.35 ± 0.03 0.31 ± 0.03 0.06 0.35 ± 0.03 0.28 ± 0.02 0.02* 0.35 ± 0.02 0.27 ± 0.02 0.007* 0.33 ± 0.02 0.24 ± 0.02 0.006*
SLF III 0.47 ± 0.02 0.39 ± 0.02 0.01* 0.48 ± 0.01 0.36 ± 0.03 <0.001* 0.47 ± 0.02 0.34 ± 0.03 0.001* 0.47 ± 0.02 0.32 ± 0.03 <0.001*
Table 4. FA group difference at ages from 30 to 48 months. The data were tested with a two-way ANOVA and post-hoc analysis with significant level of p < 0.05 (*). SD: standard derivation. FA: fractional anisotropy.

www.nature.com/scientificreports/
1 0Scientific RepoRts | 7: 379 | DOI:10.1038/s41598-017-00381-8
and a single b-value of 1000 s/mm2 with 30 diffusion encoding directions chosen to be approximately iso-tropically distributed on a sphere according to the electrostatic repulsion model. Whole brain field maps were acquired using a gradient echo sequence with TE = 6.24 and 8.7 ms, TR = 500 ms, FOV = 96 mm × 96 mm, voxel size = 1.3 mm × 1.3 mm, and slice thickness = 1.3 mm. T1-weighted images were acquired by using a 3D MPRAGE with the following parameters: inversion time = 950 ms, TE/TR = 3.5 ms/3000 ms, FOV = 96 mm × 96 mm, matrix = 192 × 192, 6 averages, and were used for structural identification and to construct an anatomical macaque template for the DTI image registration.
Tract-based spatial statistics (TBSS) analysis. Data were processed with FSL (FMRIB, Oxford) and in-house MATLAB (Mathworks, Natick, MA) scripts. Voxel-wise TBSS analysis was derived using the TBSS toolbox in FSL (FMRIB, Oxford). FA maps were nonlinearly registered to a population-specific FA template, and then skeletonized (i.e., thinning non-maximal FA values perpendicular to the local tract structure) to produce a skeleton mean FA map that represents the major white matter tracts with reduced inter-subject variability. Then, each subject’s registered FA map was projected onto the skeleton by filling the skeleton with FA values from the nearest relevant tract center through searching the surface perpendicular to the local skeleton structure32.
The relationship between FA and animal age was examined by data fitting with a Poisson regression model using custom-written Matlab scripts (MathWorks, Natick, MA). Poisson model considers different change pat-terns during the brain development and degeneration as follows40:
= ⋅ ⋅ +− ⋅FA A age e C (1)B age
where A, B and C are the fitting parameters of the model.The formula allows the ages at the maximal FA value to be calculated. After normal distribution of the calcu-
lated ages was confirmed by a one-sample Kolmogorov-Smirnov test, a two sample independent t-test was used to voxelwisely test the age difference within the skeletonized FA maps using false discovery rate (FDR) multiple comparisons correction with a q-value of 0.05.
In addition, mean diffusivity (MD), axial diffusivity (Da) and radial diffusivity (Dr) were also nonlinearly registered to a population-specific template averaged from the FA maps of all ages, and then skeletonized to pro-duce the skeletons of the corresponding diffusivity maps. With the Poisson model described above, the age for the minimal diffusivities (MD, Da and Dr) were derived with the fitting parameters.
ROI analysis. The brain regions with significant age differences in maximum FA between the controls and HD subjects were selected as regions of interest (ROIs; see Fig. 1). Localization of each ROI was performed using atlas of the rhesus monkey brain in stereotaxic coordinates64 and atlas of fiber pathways of the macaque brain65. Within each ROI, several other measures (the age at the maximum FA or minimal diffusivities, the maximum FA or minimal diffusivities, and FA or diffusivity values with increasing age) were averaged for further analysis (see Fig. 3). Independent t-tests were performed using FDR correction with q value of 0.05. Additionally, a two-way ANOVA with group as the between-subject factor and age as the within-subject factor followed by post hoc analysis with p < 0.05 as the significant threshold, was used to determine the FA difference between groups at different ages.
References 1. Macdonald, M. E. et al. A Novel Gene Containing a Trinucleotide Repeat That Is Expanded and Unstable on Huntingtons-Disease
Chromosomes. Cell 72, 971–983 (1993). 2. Ross, C. A. et al. Huntington disease: natural history, biomarkers and prospects for therapeutics. Nat Rev Neurol 10, 204–216 (2014). 3. Gomez-Tortosa, E. et al. Quantitative neuropathological changes in presymptomatic Huntington’s disease. Ann Neurol 49, 29–34
(2001). 4. Novak, M. J. et al. White matter integrity in premanifest and early Huntington’s disease is related to caudate loss and disease
progression. Cortex 52, 98–112 (2014). 5. Phillips, O. et al. Deep white matter in Huntington’s disease. PLOS One 9, e109676 (2014). 6. Wexler, N. S. & Res, U. V. C. Venezuelan kindreds reveal that genetic and environmental factors modulate Huntington’s disease age
of onset. Proc Natl Acad Sci USA 101, 3498–3503 (2004). 7. Rosenblatt, A. et al. Predictors of neuropathological severity in 100 patients with Huntington’s disease. Ann Neurol 54, 488–493
(2003). 8. Chan, A. W. et al. Progressive cognitive deficit, motor impairment and striatal pathology in a transgenic huntington disease monkey
model from infancy to adulthood. PLoS One 10, e0122335 (2015). 9. Pouladi, M. A., Morton, A. J. & Hayden, M. R. Choosing an animal model for the study of Huntington’s disease. Nat Rev Neurosci 14,
708–721 (2013). 10. Ramaswamy, S., McBride, J. L. & Kordower, J. H. Animal models of Huntington’s disease. ILAR J 48, 356–373 (2007). 11. Loepke, A. W., McGowan, F. X. Jr. & Soriano, S. G. CON: The toxic effects of anesthetics in the developing brain: the clinical
perspective. Anesth Analg 106, 1664–1669 (2008). 12. Paule, M. G. et al. Behavioral toxicology of cognition: extrapolation from experimental animal models to humans: behavioral
toxicology symposium overview. Neurotoxicol Teratol 34, 263–273 (2012). 13. Thiebaut de Schotten, M., Dell’Acqua, F., Valabregue, R. & Catani, M. Monkey to human comparative anatomy of the frontal lobe
association tracts. Cortex 48, 82–96 (2012). 14. Nakahara, K., Adachi, Y., Osada, T. & Miyashita, Y. Exploring the neural basis of cognition: multi-modal links between human fMRI
and macaque neurophysiology. Trends Cogn Sci 11, 84–92 (2007). 15. Meng, Y. & Zhang, X. Transcallosal connectivity changes from infancy to late adulthood: an ex vivo diffusion spectrum imaging
study of macaque brains. Brain Connect 5, 147–155 (2015). 16. Haber, S. N. The primate basal ganglia: parallel and integrative networks. J Chem Neuroanat 26, 317–330 (2003). 17. Chan, A. W. et al. A two years longitudinal study of a transgenic Huntington disease monkey. BMC Neurosci 15, 36 (2014). 18. Raper, J. et al. Increased irritability, anxiety, and immune reactivity in transgenic Huntington’s disease monkeys. Brain Behav Immun
58, 181–190 (2016). 19. Le Bihan, D. et al. Diffusion tensor imaging: Concepts and applications. J Magn Reson Imaging 13, 534–546 (2001).

www.nature.com/scientificreports/
1 1Scientific RepoRts | 7: 379 | DOI:10.1038/s41598-017-00381-8
20. Beaulieu, C. The basis of anisotropic water diffusion in the nervous system - a technical review. NMR Biomed 15, 435–455 (2002). 21. Le Bihan, D. Looking into the functional architecture of the brain with diffusion MRI. Nat Rev Neurosci 4, 469–480 (2003). 22. Song, S. K. et al. Dysmyelination revealed through MRI as increased radial (but unchanged axial) diffusion of water. Neuroimage 17,
1429–1436 (2002). 23. Osuka, S. et al. Elevated diffusion anisotropy in gray matter and the degree of brain compression. J Neurosurg 117, 363–371 (2012). 24. Jacobs, H. I. et al. Decreased gray matter diffusivity: a potential early Alzheimer’s disease biomarker? Alzheimers Dement 9, 93–97
(2013). 25. Sritharan, A. et al. A longitudinal diffusion tensor imaging study in symptomatic Huntington’s disease. J Neurol Neurosurg Psychiatry
81, 257–262 (2010). 26. Weaver, K. E. et al. Longitudinal diffusion tensor imaging in Huntington’s Disease. Exp Neurol 216, 525–529 (2009). 27. Poudel, G. R. et al. White matter connectivity reflects clinical and cognitive status in Huntington’s disease. Neurobiol Dis 65, 180–187
(2014). 28. Novak, M. J. U. et al. White matter integrity in premanifest and early Huntington’s disease is related to caudate loss and disease
progression. Cortex 52, 98–112 (2014). 29. Gregory, S. et al. Longitudinal Diffusion Tensor Imaging Shows Progressive Changes in White Matter in Huntington’s Disease. J
Huntingtons Dis 4, 333–346 (2015). 30. Poudel, G. R. et al. Longitudinal change in white matter microstructure in Huntington’s disease: The IMAGE-HD study. Neurobiol
Dis 74, 406–412 (2015). 31. Matsui, J. T. et al. Prefrontal cortex white matter tracts in prodromal Huntington disease. Hum Brain Mapp 36, 3717–3732 (2015). 32. Smith, S. M. et al. Tract-based spatial statistics: voxelwise analysis of multi-subject diffusion data. Neuroimage 31, 1487–1505 (2006). 33. Colman, R. J. et al. Caloric restriction delays disease onset and mortality in rhesus monkeys. Science 325, 201–204 (2009). 34. Bohanna, I., Georgiou-Karistianis, N., Hannan, A. J. & Egan, G. F. Magnetic resonance imaging as an approach towards identifying
neuropathological biomarkers for Huntington’s disease. Brain Res Rev 58, 209–225 (2008). 35. Rosas, H. D. et al. Evidence for more widespread cerebral pathology in early HD: an MRI-based morphometric analysis. Neurology
60, 1615–1620 (2003). 36. Tabrizi, S. J. et al. Potential endpoints for clinical trials in premanifest and early Huntington’s disease in the TRACK-HD study:
analysis of 24 month observational data. Lancet Neurol 11, 42–53 (2012). 37. Fjell, A. M. et al. When does brain aging accelerate? Dangers of quadratic fits in cross-sectional studies. Neuroimage 50, 1376–1383
(2010). 38. Allen, J. S., Bruss, J., Brown, C. K. & Damasio, H. Normal neuroanatomical variation due to age: the major lobes and a parcellation
of the temporal region. Neurobiol Aging 26, 1245–1260 (2005). 39. Lebel, C. & Beaulieu, C. Longitudinal development of human brain wiring continues from childhood into adulthood. J Neurosci 31,
10937–10947 (2011). 40. Lebel, C., Caverhill-Godkewitsch, S. & Beaulieu, C. Age-related regional variations of the corpus callosum identified by diffusion
tensor tractography. Neuroimage 52, 20–31 (2010). 41. Concha, L., Gross, D. W., Wheatley, B. M. & Beaulieu, C. Diffusion tensor imaging of time-dependent axonal and myelin degradation
after corpus callosotomy in epilepsy patients. Neuroimage 32, 1090–1099 (2006). 42. Dale, P. et al. Neuroscience (4th ed.), 15–16 (Sinauer Associates, 2012). 43. Shi, Y. et al. Diffusion tensor imaging-based characterization of brain neurodevelopment in primates. Cereb Cortex 23, 36–48 (2013). 44. Jernigan, T. L., Salmon, D. P., Butters, N. & Hesselink, J. R. Cerebral structure on MRI, Part II: Specific changes in Alzheimer’s and
Huntington’s diseases. Biol Psychiatry 29, 68–81 (1991). 45. Harris, G. J. et al. Putamen volume reduction on magnetic resonance imaging exceeds caudate changes in mild Huntington’s disease.
Ann Neurol 31, 69–75 (1992). 46. Leh, S. E., Ptito, A., Chakravarty, M. M. & Strafella, A. P. Fronto-striatal connections in the human brain: a probabilistic diffusion
tractography study. Neurosci Lett 419, 113–118 (2007). 47. Haber, S. N. & Knutson, B. The reward circuit: linking primate anatomy and human imaging. Neuropsychopharmacology 35, 4–26
(2010). 48. Macdonald, V. & Halliday, G. Pyramidal cell loss in motor cortices in Huntington’s disease. Neurobiol Dis 10, 378–386 (2002). 49. Lawrence, A. D., Watkins, L. H., Sahakian, B. J., Hodges, J. R. & Robbins, T. W. Visual object and visuospatial cognition in
Huntington’s disease: implications for information processing in corticostriatal circuits. Brain 123 (Pt 7), 1349–1364 (2000). 50. Bachevalier, J., Chi, T., Zhang, X. & Chan, A. W. Progressive behavioral and cognitive deficits in a primate model of Huntington
disease. Soc Neurosci Abstr 241, 12 (2012). 51. D’Esposito, M., Postle, B. R. & Rypma, B. Prefrontal cortical contributions to working memory: evidence from event-related fMRI
studies. Exp Brain Res 133, 3–11 (2000). 52. Crawford, H. E. et al. Corpus callosal atrophy in premanifest and early Huntington’s disease. J Huntingtons Dis 2, 517–526 (2013). 53. Rosas, H. D. et al. Altered white matter microstructure in the corpus callosum in Huntington’s disease: implications for cortical
“disconnection”. Neuroimage 49, 2995–3004 (2010). 54. Courtine, G. et al. Can experiments in nonhuman primates expedite the translation of treatments for spinal cord injury in humans?
Nat Med 13, 561–566 (2007). 55. Rice, J. Animal models: Not close enough. Nature 484, S9–S9 (2012). 56. Kocerha, J., Xu, Y., Prucha, M. S., Zhao, D. & Chan, A. W. MicroRNA-128a dysregulation in transgenic Huntington’s disease
monkeys. Mol Brain 7, 46 (2014). 57. Kocerha, J. et al. Longitudinal transcriptomic dysregulation in the peripheral blood of transgenic Huntington’s disease monkeys.
BMC Neurosci 14, 88 (2013). 58. Rosas, H. D. et al. Regional and progressive thinning of the cortical ribbon in Huntington’s disease. Neurology 58, 695–701 (2002). 59. Kloppel, S. et al. White matter connections reflect changes in voluntary-guided saccades in pre-symptomatic Huntington’s disease.
Brain 131, 196–204 (2008). 60. Patra, K. C. & Shirolkar, M. S. Childhood-onset (Juvenile) Huntington’s disease: A rare case report. J Pediatr Neurosci 10, 276–279
(2015). 61. Comunale, J. P. Jr., Heier, L. A. & Chutorian, A. M. Juvenile form of Huntington’s disease: MR imaging appearance. AJR Am J
Roentgenol 165, 414–415 (1995). 62. Schapiro, M., Cecil, K. M., Doescher, J., Kiefer, A. M. & Jones, B. V. MR imaging and spectroscopy in juvenile Huntington disease.
Pediatr Radiol 34, 640–643 (2004). 63. Yang, S. H. et al. Towards a transgenic model of Huntington’s disease in a non-human primate. Nature 453, 921–924 (2008). 64. Saleem, K. S. & Logothetis, N. K. A combined MRI and histology atlas of the rhesus monkey brain in stereotaxic coordinates.
(Academic Press, 2006). 65. Schmahmann, J. D. & Pandya, D. N. Fiber pathways of the brain. (Oxford University Press, 2006).

www.nature.com/scientificreports/
1 2Scientific RepoRts | 7: 379 | DOI:10.1038/s41598-017-00381-8
AcknowledgementsWe thank the Yerkes National Primate Research Center (YNPRC) veterinarian staff, primate enrichment team, and animal care personnel for providing superior medical and daily care to HD monkeys as disease progressed. YNPRC is supported by the National Center for Research Resources P51RR165 and is currently supported by the Office of Research and Infrastructure Program (ORIP)/OD P51OD11132. This study was supported by a grant awarded by the ORIP/NIH (OD010930) to AWSC.
Author ContributionsY.G. and J.J. -data analysis, preparation of main text and figures, J.B., X.Z., A.W.S.C. -designed the study, preparation of manuscript and final approval. All authors reviewed the manuscript.
Additional InformationCompeting Interests: The authors declare that they have no competing interests.Publisher's note: Springer Nature remains neutral with regard to jurisdictional claims in published maps and institutional affiliations.
This work is licensed under a Creative Commons Attribution 4.0 International License. The images or other third party material in this article are included in the article’s Creative Commons license,
unless indicated otherwise in the credit line; if the material is not included under the Creative Commons license, users will need to obtain permission from the license holder to reproduce the material. To view a copy of this license, visit http://creativecommons.org/licenses/by/4.0/ © The Author(s) 2017