why trade costs matter
TRANSCRIPT

Asia-Pacific Research and Training Network on Trade Working Paper Series, No 7. , April 2006
Why Trade Costs Matter?
Prabir De*
Prabir De is Associate Fellow at the Research and Information System for Developing Countries (RIS), New Delhi, India (Email: [email protected]; [email protected]). This paper is based on the author’s CNAEC Research Series Working Paper, coming up from Korea Institute for International Economic Policy (KIEP), Seoul in April 2006. Author sincerely acknowledges the insightful comments provided by Mia Mikic, Yann Duval, Buddhadeb Ghosh and Inkoo Lee. Discussion with Chang Jae Lee was very useful in conceptualizing the study. Author has also been benefited from ARTNeT’s Capacity Building Workshop on Trade Research, organised by the UNESCAP, Bangkok during 22-25 March 2005. The views presented in this paper are those of the author and do not necessarily reflect the views of RIS, KIEP, ARTNeT members, partners and the United Nations.
The Asia-Pacific Research and Training Network on Trade (ARTNeT) aims at building regional trade policy and facilitation research capacity in developing countries. The ARTNeT Working Paper Series disseminates the findings of work in progress to encourage the exchange of ideas about trade issues. An objective of the series is to get the findings out quickly, even if the presentations are less than fully polished. ARTNeT working papers are available online at: www.artnetontrade.org. All material in the working papers may be freely quoted or reprinted, but acknowledgment is requested, together with a copy of the publication containing the quotation or reprint. The use of the working papers for any commercial purpose, including resale, is prohibited.

Table of Content Table of Content .........................................................................................1
Executive Summary....................................................................................2
Introduction.................................................................................................3
Definition of Trade Costs and Its Relevance..............................................5
Methodology and Data................................................................................7
1 Measuring Transaction Costs ...............................................................7
2 Measuring Trade Infrastructure............................................................9
3 The Augmented Gravity Model .........................................................10
4 The Data .............................................................................................11
Overview of Regional Trade and Trade Costs in Northeast Asia ............11
Impact of Trade Costs on Regional Trade: Estimation Results ...............21
Conclusions...............................................................................................24
Appendix 1................................................................................................27
Appendix 2................................................................................................28
References.................................................................................................31
1

Executive Summary
Trade costs are often cited as an important determinant of the volume of trade. A growing literature has documented the negative impact of trade costs on the volume of trade. Most of these studies show that integration is the resultant of reduced costs of transportation in particular and other infrastructure services in general. Direct evidence on border costs shows that tariff barriers are now low in most countries across the world. Poor institutions and poor infrastructure penalize trade, differentially across countries. Therefore, today’s trade strategy goes beyond the traditional mechanisms of tariffs and quotas and includes “behind-the-border” issues, such as the role of infrastructure and governance in supporting a well-functioning trading economy.
Although the systematic development of trade facilitation in Northeast Asia has for some time been an important consideration, there is clear lack of broader policy framework which is required for long term development. Moreover, there is dearth of studies to establish an appropriate causality of factors required for trade facilitation policy framework. The question then arises: how do the non-price determinants of international trade such as infrastructure and transaction costs affect integration of the Northeast Asia?
To provide an answer to the above question, the analysis carried out in this paper place sufficient evidences to ascertain that today’s trade issues in Northeast Asia go beyond the traditional mechanisms of tariffs, and include “behind-the-border” issues. The link between trade flows and trade costs has been based previously more on intuition than evidence, particularly in context of Northeast Asia. This study shows that variations in transaction costs along with trade mobility infrastructure facilities have significant influence on regional trade flows in Northeast Asia. This paper concludes that when tariffs tend to become low in Northeast Asia, the economies of this region could potentially benefit substantially from higher trade provided trade facilitation measures are strengthened to a great extent.
2

Introduction
Success of globalization across countries of very diverse dimensions remains to be attained in full (Stiglitz, 2003; Friedman, 2005). But the process initiated during last decade has explicitly given rise to growing regionalization in all regions of the world with varying success. The growth of regionalism has been one of the major developments in international relations in recent years; all countries are now members of at least one bloc and many belong to more than one.1 In general, regionalism has shared an objective to reduce trade barriers – quantitative and qualitative.
A growing literature has documented the negative impact of trade costs on the volume of trade.2 Most of these studies show that integration is the resultant of reduced costs of transportation in particular and other infrastructure services in general. Direct evidence on border costs shows that tariff barriers are now low in most countries, on average (trade-weighted or arithmetic) less than 5 percent for rich countries, and with a few exceptions are on average between 10 to 20 percent for developing countries (Anderson and van Wincoop, 2004). Poor institutions and poor infrastructure penalize trade, differentially across countries. Therefore, today’s trade strategy goes beyond the traditional mechanisms of tariffs and quotas and includes “behind-the-border” issues, such as the role of infrastructure and governance in supporting a well-functioning trading economy. For instance, many studies show that liberalisation of international transport services foster international trade very much the same way as tariff liberalization does (Baier and Bergstrand, 2001; Andriamananjara, 2004). In taking this route, the attention is now being focused on minimization of trade costs through facilitation of merchandise and services trade logistics, both inbound and outbound.
In our particular case, the three Northeast Asian countries, namely, China, Japan and Korea, together contain more than 1.46 billion population (23 percent of world population), and boast a GDP of US$ 6.32 trillion (17 percent of world GDP) in 2005. Japan and Korea are termed as high-income economies, whereas China is seen as lower middle-income country.3 While Korea is becoming a mature economy, catching up Japan, China, on the other, has emerged as an engine of growth, not only for the Northeast Asia, but also for the entire world. The rapid trade among China, Japan and Korea has demonstrated broader prospects for regional cooperation. In 2005, China has become the largest trading partner of Korea and second largest trading partner of Japan. A remarkable growth in China’s two-way trade with Korea and Japan has resulted in robust growth of the economies in Northeast Asia. However, Northeast Asia is still characterized by its low level of regional integration, despite the fact that the economies in the region are complementary to a large extent and could potentially benefit substantially from deeper economic integration.4
In recent years, Northeast Asia has received growing attention as a region that has successfully begun the process of integration into the global as well as neighbouring regional
1 Regional Integration Agreements (RIAs) have been around for long period of time since 1664 when a custom union of the provinces of France was proposed (Schiff and Winters, 2003). As on January 2005, 312 RTAs have been notified to the GATT/WTO (of these, 170 are currently in force) and a further 65 are estimated to be operational, although not yet notified (Crawford and Fiorentino, 2005) 2 Refer the study Anderson and van Wincoop (2004), which has elaborately covered the major studies carried out on this subject. 3 According to World Bank (2005) 4 Progress towards forming regional economic bloc in Northeast Asia has always been very slow since its inception. According to Yip (2001), Northeast Asian regionalism has been delayed owing to political factors rather than economic reasons.
3

economies.5 Considering the increase in trade interdependency of the three economies in Northeast Asia6, the need for an FTA in the region has gained high momentum in recent years. This has been reflected in a growing number of studies conduced in last few years aiming to find out the feasibility of an FTA in Northeast Asia.7 Latest is Lee (2005), which using CGE Model, shows that the integration through trade (read, FTA) in Northeast Asia would lead to GDP growth of 5.15 percent for Korea, 1.54 percent for China and 1.21 percent for Japan, and all taken together is likely to generate economic welfare of US$ 30 billion in the region (Lee, 2005).
The fact is that without having any regional trade agreement (PTA or FTA), the tariff barriers among the three countries in Northeast Asia have become low; weighted average tariff in 2004 of the three economies was less than 6 percent, as compared to more than 20 percent in 1991, with a few exception of China’s average 40 percent tariff on imports from Japan and Korea in 1991. Over time, tariff has been reduced to a great extent in this region such that the regional trade volume in Northeast Asia increased from US$ 56 billion in 1991 to US$ 325 billion in 2004.8 However, despite higher intraregional trade observed in Northeast Asia, there is no evidence of lowering costs of trade in the region. For example, bilateral transaction costs between China and Japan has been hovering around 27 - 28 percent for last one and half decade, while the same between Korea and Japan is found to be around 2 - 4 percent. Apparently, it seems that the regional trade would have been much higher had the costs of trade among the three countries were low along with reduced tariffs.
Some studies have indicated that the cost of trade facilitation, specifically trade documentation and procedures, is high, between 4 to 7 percent of the value of goods shipped. In 1996, APEC conducted a study that highlighted the gain from effective trade facilitation. For example, the gains from streamlining customs procedures exceeded those resulting from trade liberalization, such as tariff reduction. Gains from effective trade facilitation accounted for about 0.26 percent of real GDP of APEC members (about US$ 45 billion), while the gains from trade liberalization would be 0.14 percent of real GDP (about US$ 23 billion).9 According to World Bank, raising performance across the region to halfway up to the level of the APEC average could result in a 10 percent increase in intra-APEC exports, worth roughly US$ 280 billion (World Bank, 2002).10
Although the systematic development of trade facilitation in Northeast Asia has for
some time been an important consideration, there is clear lack of broader policy framework which is required for long term development. Moreover, there is dearth of studies to establish an appropriate causality of factors required for trade facilitation policy framework. The
5 In view of recently concluded East Asia Summit 2005, Northeast Asian countries are now looking towards deeper trade integration with ASEAN. An FTA among ASEAN+3 will lead to welfare gain of approximately US$ 129 billion (Yungling, 2005). 6 For a detailed study on trade interdependency in Northeast Asia, refer Lee (2005). According to Lee (2005), trade concentration ratio in Northeast Asia increased from 1.09 in 1990 to 1.65 in 2004, which was even higher than that of EU since 2001. 7 Refer page 31 of Lee (2005) to know the list of studies which have dealt the feasibility of FTA in Northeast Asia. Also refer, Cheong (2005). 8 The share of intra-regional trade in Northeast Asia has increased from 12.40 percent in 1990 to 23.90 percent in 2004 (Lee, 2005). 9 Similar indications were obtained for countries in APEC (Cernat, 2001, World Bank, 2002; Wilson et al, 2003) 10 In a study, De (2004) shown that for most Asian countries, trade cost works as a strong barrier to trade integration than tariff. By estimating a structural Gravity model of economic geography using cross-country data on income, infrastructure, transaction costs and trade of selected Asian economies, De (2004) provided evidence that transaction cost is statistically significant and important in explaining variation in trade in Asia. In addition, this study also found that port efficiency and infrastructure quality are two important determinants of trade costs.
4

question then arises: how do the non-price determinants of international trade such as infrastructure and transaction costs affect integration of the Northeast Asia? This paper attempts to find out the answer to the above question for the following three reasons.
First, the reason for focusing on trade costs in Northeast Asia is pressing if we look into the region’s trade coverage. When most of the Northeast Asian economies – either through ASEAN+3 or through APEC or combination of both11– are planning to promote regional trade, integration of the whole region is limited by lack of an integrated and improved transportation and customs.
Second, since the countries in Northeast Asia are planning to intensify economic cooperation through bilateral FTAs (China-Korea, Korea-Japan, China - Japan), trilateral FTA (China-Japan-Korea), inter-regional FTA (ASEAN+3) and multilateral FTA (WTO), these countries should display small trade costs. These FTA events are expected to put added competitive pressure on Northeast Asian economies, particularly on trade and through which investments.
Third, to gain anything from liberalised trade regime in Northeast Asia, there is an urgent need to control trade costs, which might not only multiply the welfare emanating from liberalized trade environment but also strengthen the trade capacity of the region in the era of globalization.
In view of above, this study is attempted to assess the impact of trade costs on regional trade in Northeast Asia, and propose policy measures that would facilitate trade in the region. The remainder of the paper proceeds as follows. Section 2 deals with the definition of trade costs and its relevance. Data and methodology are dealt in Section 3. Section 4 describes the broad profile of trade and trade costs in Northeast Asia. Section 5 provides some estimates for the impact of trade costs and discusses the results. Finally, conclusions are briefed in Section 6.
Definition of Trade Costs and Its Relevance
Broadly defined trade costs include all costs incurred in getting a good to a final user other than the marginal cost of producing the good itself: transportation costs (both freight costs and time costs), policy barriers (tariffs and non-tariff barriers), information costs, contract enforcement costs, costs associated with the use of different currencies, legal and regulatory costs, and local distribution costs (wholesale and retail). Trade costs are reported in terms of their ad-valorem tax equivalent. In Anderson and van Wincoop’s (2004) term: the 170 percent ‘representative’ trade costs in industrialized countries breaks down into 21 percent transportation costs, 44 percent border related trade barriers and 55 percent retail and wholesale distribution costs (Figure 1).
In general, an exporter or importer incurs trade costs in all the phases of the export or import process starting from obtaining information about market conditions in any given foreign market and ending with receipt of final payment. One part of the trade cost is trader specific and depends upon his operational efficiency. The magnitude of this trade cost diminishes with an increase in the efficiency level of the trader, under the prevailing framework of any economy.
11 Some of the Northeast Asian countries are also members of other extra-regional arrangements too. For example, three Northeast Asian countries, are members of APEC, and two of which (China and Korea) are also member of Bangkok Agreement, now renamed as Asia Pacific Trade Agreement (APTA).
5

The other part of trade costs is specific to the trading environment and is incurred by
the traders due to the in-built inefficiencies in the trading environment. It includes institutional bottlenecks (transport, regulatory, and other logistics infrastructure), information asymmetry and administrative power that give rise to rent seeking activities by government officials at various steps of transaction. This may cost traders (or country) time and money including demurrage charges, making transactions more expensive.
Figure 1: Estimated Trade Costs in Industrialized Countries
Trade Costs (170%)
Transport costs Border related trade barriers** Retail and wholesale distribution costs (21%) (44%)
(55%)
Notes: *Tax equivalent of the time value of goods in transit. Both are based on estimates for US data. ** The combination of direct observation and inferred costs, which, according to author, is an extremely rough breakdown.
Transit costs* Policy barriers Language barrier Currency barrier Information costs barrier Security barrier Freight costs (Tariff and NTBs) (9%) (7%) (14%) (6%) (3%)
(8%)
Source: Drawn from Anderson and van Wincoop (2004)
Trade costs are large, even aside from trade policy barriers and even between apparently highly integrated economies. In explaining trade costs, Anderson and van Wincoop (2004) referred the example of Mattel’s Barbie doll, discussed in Feenstra (1998), indicated that the production costs for the doll were US$ 1, while it sold for about US$ 10 in the United States. The cost of transportation, marketing, wholesaling and retailing represent an ad-valorem tax equivalent of 900 percent. Anderson and van Wincoop (2004) commented: “Tax equivalent of representative trade costs for rich countries is 170 percent. This includes all transport, border-related and local distribution costs from foreign producer to final user in the domestic country. Trade costs are richly linked to economic policy. Direct policy instruments (tariffs, the tariff equivalents of quotas and trade barriers associated with the exchange rate system) are less important than other policies (transport infrastructure investment, law enforcement and related property rights institutions, informational institutions, regulation, language).”
Direct transport costs include freight charges and insurance, which is customarily to the freight charge. Indirect transport user costs include holding cost for the goods in transit, inventory cost due to buffering the variability of delivery dates, preparation costs associated with shipment size (full container load vs. partial loads) and the like. Indirect costs must be inferred. Alongside tariffs and NTB’s, transport costs look to be comparable in average magnitude and in variability across countries, commodities and time.
Trade costs have large welfare implications. Current policy related costs are often worth more than 10 percent of national income (Anderson and van Wincoop, 2002). Obstfeld
6

and Rogoff (2000) commented that all the major puzzles of international macroeconomics hang on trade costs. Details of trade costs also matter to economic geography. For example, the home market effect hypothesis (big countries produce more of goods with scale economies) hangs on differentiated goods with scale economies having greater trade costs than homogeneous goods (Davis, 1998). The cross-commodity structure of policy barriers is important to welfare (e.g., Anderson, 1994).
Figure 2: Trade Costs and Its Components
Trade Costs
Costs imposed Costs imposed by environmentby policy
Miscellaneous costs
Tariffs* NTBs Quota Transport costs
Direct costs Indirect costs
Pre-shipment costs
Freight charges Insurance Transit costs
As shown in Figure 2, we only deal with only those components of trade costs which
are imposed by both policy (tariff) as well as environment (transport and others). In this paper, we term the costs imposed by environment as transaction costs.12
Methodology and Data
The case of Northeast Asia is highly appealing since the countries are showing rising costs of trade despite the drastic fall in tariffs. Focusing on three countries, this study is undertaken in two stages. Firstly, we provide some estimates of trade costs at regional (pooled) level. We stress that the specification of the gravity equation, together with the choice of the distance measure, are crucial for evaluating the size of the barriers. Secondly, we assess the impact of trade costs on regional trade based on a panel data, following which, policy conclusions are drawn.
1 Measuring Transaction Costs
Despite a wide range of theoretical derivations of the gravity equation, the majority of the authors do not model transport costs explicitly, exceptions being Bergstrand (1985, 1989), Davis (1998), Deardorff (1998), Limao and Venables (2001), Fink et al., (2002), Clark, Dollar
12 Despite the structural differences, trade costs are often termed as transaction costs in literature. We avoid dealing with indirect trade costs, such as auxiliary transaction costs, which exporters incur in terms of speed money (bribes) and delays. The auxiliary transaction costs represent real resource cost as well as costs that may just be ways of sharing the economic rents. For example, delay on the road, in Customs, etc., represent real resource costs but “speed money” is a way of transferring income.
7

and Miucco (2004), Redding and Venables (2004), Hummels (2001a, 2001b), Wilson et al, (2003). However, except Limao and Venables (2001) and De (2004), none has incorporated both infrastructure and trade costs in the model.
To estimate bilateral transaction cost in this study, we have followed the model introduced by Limao and Venables (2001), following the difference of cif (cost, insurance and freight) and fob (free on board) values.13 Importing countries report the value of imports from partner countries inclusive of cif, and exporting countries report their value on fob, which measures the cost of the imports and all charges incurred in placing the merchandise aboard a carrier in the exporting port. Let Tij denotes the unit cost of shipping a particular good from country j to country i. We suppose that it is determined by:
Tij= f (xij, Xi, Xj, µij) (1) where xij is a vector of characteristics relating to the journey between i and j, Xi is a vector of characteristics of country i, Xj is a vector of characteristics of country j, and µij represents all unobservable variables. Denoting the fob price shipped from j to i by pij, we define tij, the ad-valorem transaction cost factor, as
tij = cifij / fobij = (pij + Tij) / pij = t (xij, Xi, Xj, µij) (2) where the determinants of Tij are given in equation (1). The ratio of cif/fob provides the measure of transaction costs on trade between each pair of countries. Assuming that tij can be approximated by a log linear function up to some measurement error, the average observed transaction cost rates tij appears as follows.
ln tij = α + β xij + γ ln Xi + δ ln Xj + ωj (3)
Following Limao and Venables (2001), in terms of the data, tij corresponds to the ratio [(cif/fob) – 1 = (IMt
ij / EXtji) -1] for importing country i. The ratio (cif/fob – 1) represents
the ratio of unit transaction costs to the fob price and thus provides a simple summary statistic of the transaction cost on imports. As pointed out by Limao and Venables (2001), cif/fob data does contain information about the cross sectional variation in transport costs, and that results from using this data are quite consistent with those obtained from the shipping cost data.14
13 Many measures have been constructed to measure transport cost. The most straightforward measure in international trade is the difference between the cif and fob quotations of trade. The difference between these two values is a measure of the cost of getting an item from the exporting country to the importing country. See, Brakman. Garretsen and Marrewijk (2001) for further details. There is another source to obtain data for transport costs from industry or shipping firms. Limao and Venables (2001) obtained quotes from shipping firms for a standard container shipped from Baltimore to various destinations. Hummels (2001a) obtained indices of ocean shipping and air freight rates from trade journals which presumably are averages of such quotes. Due to data limitations and the very large size of the resulting datasets, direct methods are best but not always feasible here. The most widely available (many countries and years are covered) is average ad-valorem transport costs are the aggregate bilateral cif/fob ratios from UN’s COMTRADE database, supplemented in some cases with national data sources. Nevertheless, because of their availability and the difficulty of obtaining better estimates for a wide range of countries and years, apparently careful work such as Harrigan (1993) and Baier and Bergstrand (2001) used the IMF (COMTRADE) database. 14 However, cif/fob ratio has some drawbacks. The first is measurement error; the cif/fob factor is calculated for those countries that report the total value of imports at cif and fob values, both of which involve some measurement error. The second concern is that the measure aggregates over all commodities imported, so it is biased if high transport cost countries systematically import lower
8

Here, the transaction costs, TCt
ij (= tij) represents costs of transaction between country i and j for the period t, IMt
ij stands for import (cif) of country i from country j for the period t, and EXt
ji denotes export (fob) of country j to country i for the period t.
2 Measuring Trade Infrastructure
Country’s infrastructure plays vital role in carrying trade, which has been widely dealt in many studies. For example, by incorporating transport infrastructure in a two-country Ricardian framework, Bougheas et al. (1999) have shown the circumstances under which it affects trade volumes.15 According to Francois and Manchin (2006), transport and communication infrastructure and institutional quality are significant determinant not only for country’s export levels but also for the likelihood exports. Nordås and Piermartini (2004) shown that quality of infrastructure is an important determinant of trade performance wherein port efficiency alone has the largest impact on trade among all indicators of infrastructure.
The infrastructure variables have explanatory power in predicting trade volume. Limao and Venables (2001) emphasized the dependence of trade costs on infrastructure, where infrastructure is measured as an average of the density of the road network, the paved road network, the rail network and the number of telephone main lines per person. A deterioration of infrastructure from the median to the 75th percentile of destinations raises transport costs by 12 percent. The median landlocked country has transport costs which are 55 percent higher than the median coastal economy.16 Inescapably, understanding trade costs and their role in determining international trade volumes must incorporate the internal geography of countries and the associated interior trade costs.
Therefore, for country characteristics, we have focused on infrastructure measures – the country’s ability to enhance the movement of merchandise. To assess impact of infrastructure facilities on bilateral trade, we have constructed trade mobility index (TMI), comprising nine infrastructure variables for each individual country.17 The TMI Index we have used is designed to measure the costs of travel in and through a country. In theory the fob and cif prices are border prices and thus it would seem that own and trading partner infrastructures as defined here should not affect these rates. It is possible that there are interactions between the cost variables, which would make a nonlinear form more suitable.
transport cost goods. This would be particularly important if we were using exports, which tend to be concentrated in a few specific goods. It is less so for imports which are generally more diversified and vary less in composition across countries (Limao and Venables, 2001). 15 Bougheas et al. (1999) estimated augmented gravity equations for a sample limited to nine European countries. They included the product of partner’s kilometres of motorway in one specification and that of public capital stock in another and found that these have a positive particle correlation with bilateral exports. 16 Limao and Venables (2001) also reported similar results using the cif/fob ratios of the IMF. 17TMI was constructed based on UNDP method. TMI measures the relative position of a country considering a set of observables. Index is calculated following general formula: Index = [(Actual – Minimum) / Maximum – Minimum)]. While indexing the infrastructure stocks of the countries, we have considered following nine variables: (i) railway length density (km per sq. km of surface area), (ii) road length density (km per sq. km of surface area), (iii) air transport freight (million tons per km), (iv) air transport, passengers carried (percentage of total population), (v) aircraft departures (per airport), (vi) container traffic (per port), (vii) fixed line and mobile phone subscribers (per 1,000 people), (viii) internet users (per 1,000 people), and (ix) electric power consumption (kwh per capita). There are several other methods to construct an index, such as multivariate factor analysis, which can also be attempted to measure the infrastructure stock alternatively. Due to limitation of space, we have avoided placing TMI and corresponding weights. Interested readers may contact author for the same.
9

The simplest example is that an increase in land distance should increase the cost of going through a given infrastructure.
3 The Augmented Gravity Model
In order to explore the impact of trade costs on trade flows, our empirical analysis has considered an augmented gravity model since it is the most robust partial equilibrium model known in explaining the variation of trade flows. The gravity model provides the main link between trade barriers and trade flows.18 The augmented gravity model considered here use a balanced panel data for the period 1991 to 2004 on trade, distances, gross domestic product (GDP), GDP per capita, infrastructure, openness, exchange rate, tariff, and transaction costs for three Northeast Asian economies.19
We look at the trade flows by estimating a gravity model including income, infrastructure and host of institutional and economic variables as reported above. There are two important reasons for doing this. First, the variables are identified keeping in mind their importance in influencing bilateral trade. Second, we can estimate elasticity of trade flows with respect to exogenous variables. Since the gravity equation is the standard analytical framework for the prediction of bilateral trade flows, we apply panel data policy simulation technique rather than extending it for forecasting purposes. The gravity equation which we have estimated in log-linear form takes following shape.
ln IMtij = β1 ln GDPt
i + β2 ln GDPtj + β3 ln GDPPCt
i + β4 ln GDPPCtj + β5 ln
TMIti + β6 ln TMIt
j + β7 ln ONSti + β8 ln ONSt
j + β9 ln TCtij +β10 ln
Ttij + β11 ln ERt
i + β12 ln ERtj + β13 ln Dij + et
ij (4) where i and j are importing and exporting country respectively, IMt
ij represents import by country i from country j, GDP is country’s gross domestic products, taken at constant US$, GDPPC stands for country’s per capita gross domestic products, considered in constant US$, TMI represents country’s trade mobility infrastructure, ONS is country’s openness, measured in terms of trade as percentage of country’s GDP, TCt
ij stands for transaction costs for bilateral trade between countries i and j for the period t, Tt
ij stands for bilateral tariff (weighted average) between country i and j for the period t, ER represents exchange rate, Dij is the
18 The Gravity model has been used extensively in social and behavioural sciences. In analogy to the Newtonian gravity model, James Q. Stewart (1947, 1948) found strong correlations for traffic, migration, and communication between two places, based on the product of the population size and inversely related to their distance squared. This model became popular in the hand of Jan Tinbergen (1962) when it was applied to international trade. Since then the gravity equation has become a standard analytical tool for prediction of bilateral trade flows with simultaneous development of its theoretical discourse. Although there is debate about its theoretical support, the gravity equation is one of the most empirically successful in economics. It relates bilateral trade flows to GDP, distance, and other factors that affect trade barriers. It has been widely used to infer trade flow effects of institutions such as customs unions, exchange-rate mechanisms, ethnic ties, linguistic identity, international borders, and so on and so forth. See, for example, Anderson (1979), Deardoff (1998), Hummels (1999), Baier and Bergstrand (2001), Limao and Venables (2001), Glick and Rose (2002), Fink et al (2002, 2005), Wilson et al, (2003), etc. 19 By taken both tariff and transaction costs, we cover a major portion of trade costs. Ideally, no study has attempted so far to capture all the components of trade costs associated with country’s exports and imports. Due to absence of data, we have avoided taking NTBs in this study, though exists among the three countries.
10

distance between countries i and j and t denotes trading years (t = 1991,…. 2004).20 The parameters to be estimated are denoted by β and eij is the error term. The error term et
ij is defined as
etij = αi + ωt
ij (5) a composite importing country fixed effect, αi such as variations in trade flows due to the unobserved differences, and the random error term, ωt
ij, which is assumed to be normally distributed with mean 0.
4 The Data
The dataset includes bilateral trade between three Northeast Asian economies for the years 1991 to 2004. Given the dataset, there are 84 unidirectional trading pairs and 13 variables that make the dataset as 1092 pooled observations. Table 1 presents correlation coefficients among the dependent and independent variables. Tariffs, transaction costs, exporting country’s trade mobility index are all negatively correlated with imports and highly robust.
Table 1: Correlations between Variables
IMtij TMIt
i TMItj TCt
ij Ttij
IMtij 1
TMIti
0.169* p=.1328 1
TMItj
-0.373 p=.0012
-0.433* p=.0002 1
TCtij
-0.220* p=.0480
0.389* p=.0009
0.239* p=.0319 1
Ttij
-0.213 p=.0562
0.608* p=.0008
0.105 p=.3524
0.396* p=.0006 1
Note: * Significant at 1 percent level
The major sources of secondary data are United Nations Conference on Trade and Development (UNCTAD); United Nations Economic and Social Commission for Asia and the Pacific (UNESCAP); International Monetary Fund (IMF); World Bank (WB); Asian Development Bank (ADB); and United Nations (UN). Data specific sources are briefed in Appendix 1.
Overview of Regional Trade and Trade Costs in Northeast Asia
In Northeast Asia, China is seen as an industry-driven economy, whereas Korea and Japan are services driven. Services sector in Korea and Japan presently contributes over 60 percent to GDP, whereas the industry contributes over 50 percent to GDP in China. Virtually,
20 We do not include common language or currency or FTA dummy because the countries considered in this paper do not share such characteristics.
11

contribution of services sector to GDP in China has been found as static during 1991 to 2003. However, agricultural sector’s contribution to GDP in all the three countries has declined over the period 1991 to 2003. The bigger but less developed economy (China) is industry driven, whereas relatively advanced economies (Japan and Korea) are services driven. Even though the momentum of growth in GDP and GDP per capita in all the three countries has been slowed down since 2001, the trade has surged up. An outcome of aggressive industry-driven development strategy, particularly in China and Korea, is reflected in rising production and expansion of exports, and positive current account balance, thus generating employment, raising wages, and thereby catching up higher income countries in recent period.
Despite the dependency on overseas market, regional trade portfolio differs across countries in Northeast Asia. Trade in the region (among China, Japan, and Korea) has rapidly increased over the last decade. Countries are now more open than they used to be a decade earlier. Rising regional trade shows higher trade openness in Northeast Asia. Table 2 indicates that trade among these three countries has gone up substantially over last one and half decade. In 1991, the total intraregional trade in Northeast Asia was US$ 56 billion, which grew 37 percent per annum since 1991 and became US$ 324 billion in 2004. The share of the intraregional trade in Northeast Asia has also increased from 13.90 percent in 1991 to 23.90 percent in 2004 (Figure 3). It has increased steadily since 1991 except for the years of the Asian financial crisis. In fact, intraregional trade in Northeast Asia is fast catching up with those of the EU and NAFTA. At the country level, Korea’s intraregional trade with China and Japan increased twice faster than her trade with other countries during 2000 and 2004, whereas Japan’s intraregional trade increased five times faster than its trade with other countries in the same period. Since the intraregional trade has intensified in Northeast Asia during 1991 to 2004, in order to gain larger from the trade settings (global and regional), there is an urgent need for free trade among the three countries in Northeast Asia. In particular, the trade concentration ratio in Northeast Asia crossed that of the EU, without any formal regional agreement (Lee, 2005).
Table 2: Trends in Regional Trade in Northeast Asia 1991 2001 2004 Particulars
US$ billion China's Export to Japan 10.25 45.08 73.51 China's Import from Japan 10.03 42.81 94.37 China's Total Trade with Japan 20.28 87.89 167.89 Japan's Export to China 8.60 30.95 73.92 Japan's Import from China 14.25 57.78 94.34 Japan's Total Trade with China 22.85 88.73 168.25 China's Export to Korea 2.18 12.54 27.82 China's Import from Korea 1.07 23.40 62.25 China's Total Trade with Korea 3.24 35.94 90.07 Korea's Export to China 1.00 18.19 49.76 Korea's Import from China 12.80 13.30 29.58 Korea's Total Trade with China 13.80 31.49 79.35 Japan's Export to Korea 20.09 25.29 44.25 Japan's Import from Korea 12.38 17.22 22.06 Japan's Total Trade with Korea 32.47 42.51 66.31 Korea's Export to Japan 12.36 16.51 21.70 Korea's Import from Japan 21.12 26.63 46.14 Korea's Total Trade with Japan 33.48 43.14 67.85 Note: Consider export at fob and import at cif prices Source: IMF (2005)
12

China’s robust trade performance and rapid economic growth have made a strong impact on the regional trade structure over time in Northeast Asia. These countries do more trade among each other compared to their trade with rest of the world (Hai and Zhang, 2004). Gradually, Japan and Korea have become China’s second and forth largest trading partners in 2004 respectively, whereas China and Korea are Japan’s second and third largest trading partners, following the United States in the same year. In case of Korea, China and Japan are the first and third largest trade partners, respectively. Therefore, considering the increase in trade interdependency of the three countries in the Northeast Asia, the need for an FTA has increased substantially.
In general, China and Korea heavily rely on Japan for intermediate products (and also raw materials and technology) and for market of their finished products. Although trade in the region is well diversified, trilateral trade structure among China, Korea and Japan has been quite similar to each other. For example, four products (HS 84, 85, 87, 90) of top 10 bilateral trade items between China and Japan overlapped in 2004. Similarly, six items (HS 27, 29, 72, 84, 85, 90) out of top 10 bilateral trade items between China and Korea overlapped in the same year. The same also holds true in case of trade between Japan and Korea. Eight of the top 10 trade items between Korea and Japan overlapped (HS 27, 29, 39, 72, 84, 85, 87, 90) in 2004. Tables reported in Appendix 2 capture this trend briefly.
Figure 3: Trends in Intraregional Trade in Northeast Asia
0.00
10.00
20.00
30.00
40.00
50.00
60.00
70.00
%
Northeast Asia 13.90 14.10 16.10 17.50 18.60 19.00 18.60 17.40 19.20 20.30 21.80 22.40 23.70 23.90
NAFT A 38.90 39.70 41.00 42.40 42.00 43.50 44.50 45.70 46.80 46.90 46.6 46.10 44.90 43.60
EU 64.70 65.20 60.50 60.90 61.60 60.80 59.60 60.50 61.80 59.80 59.40 59.90 60.40 59.80
1991 1992 1993 1994 1995 1996 1997 1998 1999 2000 2001 2002 2003 2004
Source: Lee (2005)
The manufacturing sector has an overwhelming stake in trade in Northeast Asia. In 2004,
manufacturing products constituted 93.40 and 92.00 percent of Korea’s exports and imports to and from China, and 73.00 percent and 97.10 percent to and from Japan, respectively (Lee, 2005). Among the manufacturing sector, six industries, namely, electronics, automobile, general machinery, textile, steel, and petrochemicals, share the lager pie. These six industries constitute 3/4th of Korea’s and Japan’s exports and 2/3rd of China’s exports in intraregional trade among Korea, China and Japan (Lee, 2005). Also, in total exports, electronics (28.80 percent), textiles (26.10 percent), general and machinery (23.20 percent) have the highest shares, in that order. Excluding petrochemicals (15.50 percent), the rest five industries have a
13

higher market share in the world market than the overall market share (15.80 percent) of the three countries. One of the reasons for rising trade in manufacturing industry is the rapid development of China’s heavy and chemical industries and the rapid increase of Korea’s and Japan’s trade with China after 2000. Therefore, it may be concluded that regional trade interdependence has become very high in Northeast Asia, which has evolved over time due mainly to lowering policy barriers (tariffs, for example) in the region. But has that also been associated with lowering trade costs?
To answer this, we have plotted trade, tariff and transaction costs in a scatter plot for the panel of 1991 to 2004 in Figure 4, which shows that despite lower tariffs, trade in Northeast Asia is still associated with high transaction costs, which, in other words, indicates that even though the regional trade has gone up over time in Northeast Asia with substantial reduction in tariffs, the cost of trade in the region has seen no substantial fall. Perhaps, rise in costs of trade is an outcome of rising international freight costs, which have an impact on trade and trade equivalent to tariffs or even the exchange rate. A reduction in the cost of transport directly stimulates exports and imports, just as an increase in the exchange rate makes exports more competitive, and a reduction in national tariffs lowers the cost of imports. This is more amplified in Table 3, which shows bilateral imports, transaction costs and tariffs for two cross-section years, 1991 and 2004.
Figure 4: Scatter of Trade, Tariff and Transaction Costs in Northeast Asia
7050
Import(%)
0
2
6040
4
6
50
8
30
10
40
T C(%)Tarif f (%)3020 2010 100 0
Notes: 1. Pooled data for the period 1991 to 2004. 2. TC represents transaction costs, calculated based on the methodology as shown in Section 2. 2. Imports, tariffs and TC are based on bilateral trading pairs.
Spurred by trade liberalization, all the three countries are now having lower tariffs
(Table 3). In fact, tariffs have dropped to levels where in many cases any additional reduction would now no longer have a significant impact. However, movement towards lowering transaction costs varies across the three countries. While, in one hand, China’s imports from Korea and Japan have gone up substantially during 1991 to 2004 along with substantial fall in tariffs, on the other, China’s bilateral import costs from Korea have increased from 6.40 percent in 1991 to 25.09 percent in 2004, and from 16.58 percent in 1991 to 27.67 percent in case of imports from Japan. Merchandise trade between Japan and Korea and Korea and China indicate fall in tariffs and transaction costs, and rise in trade during 1991 and 2004. In
14
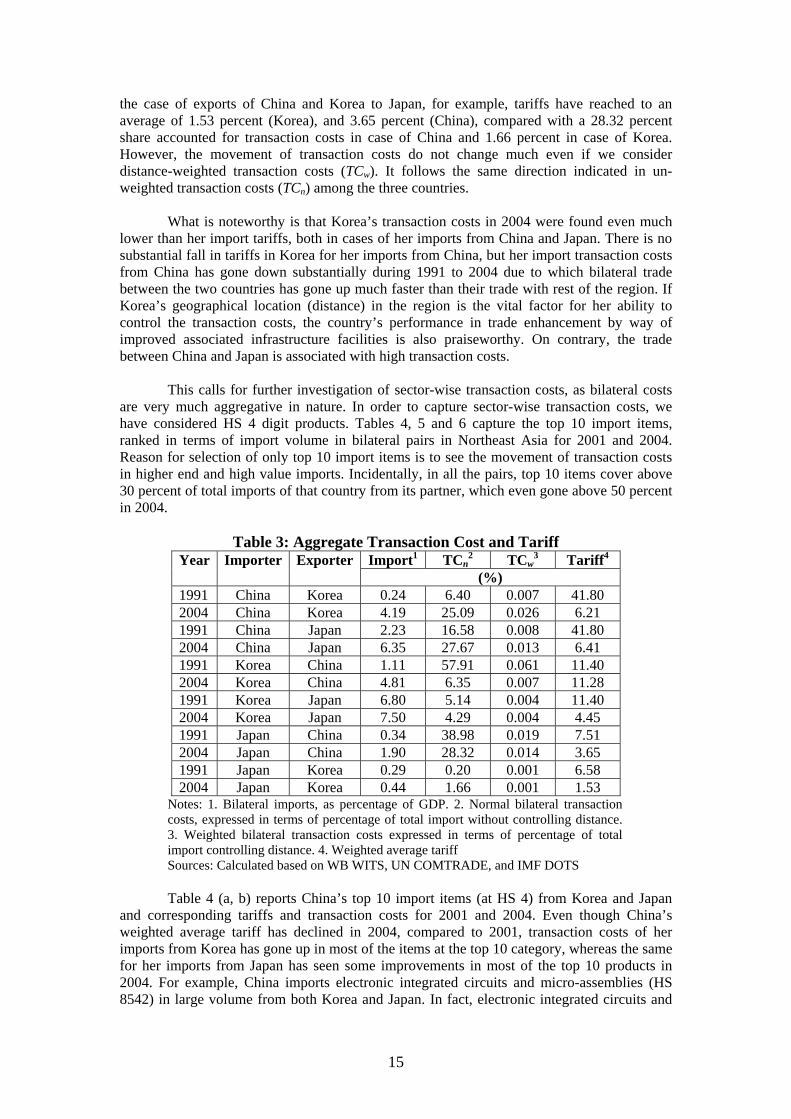
the case of exports of China and Korea to Japan, for example, tariffs have reached to an average of 1.53 percent (Korea), and 3.65 percent (China), compared with a 28.32 percent share accounted for transaction costs in case of China and 1.66 percent in case of Korea. However, the movement of transaction costs do not change much even if we consider distance-weighted transaction costs (TCw). It follows the same direction indicated in un-weighted transaction costs (TCn) among the three countries.
What is noteworthy is that Korea’s transaction costs in 2004 were found even much lower than her import tariffs, both in cases of her imports from China and Japan. There is no substantial fall in tariffs in Korea for her imports from China, but her import transaction costs from China has gone down substantially during 1991 to 2004 due to which bilateral trade between the two countries has gone up much faster than their trade with rest of the region. If Korea’s geographical location (distance) in the region is the vital factor for her ability to control the transaction costs, the country’s performance in trade enhancement by way of improved associated infrastructure facilities is also praiseworthy. On contrary, the trade between China and Japan is associated with high transaction costs.
This calls for further investigation of sector-wise transaction costs, as bilateral costs are very much aggregative in nature. In order to capture sector-wise transaction costs, we have considered HS 4 digit products. Tables 4, 5 and 6 capture the top 10 import items, ranked in terms of import volume in bilateral pairs in Northeast Asia for 2001 and 2004. Reason for selection of only top 10 import items is to see the movement of transaction costs in higher end and high value imports. Incidentally, in all the pairs, top 10 items cover above 30 percent of total imports of that country from its partner, which even gone above 50 percent in 2004.
Table 3: Aggregate Transaction Cost and Tariff Import1 TCn
2 TCw3 Tariff4Year
Importer
Exporter
(%) 1991 China Korea 0.24 6.40 0.007 41.80 2004 China Korea 4.19 25.09 0.026 6.21 1991 China Japan 2.23 16.58 0.008 41.80 2004 China Japan 6.35 27.67 0.013 6.41 1991 Korea China 1.11 57.91 0.061 11.40 2004 Korea China 4.81 6.35 0.007 11.28 1991 Korea Japan 6.80 5.14 0.004 11.40 2004 Korea Japan 7.50 4.29 0.004 4.45 1991 Japan China 0.34 38.98 0.019 7.51 2004 Japan China 1.90 28.32 0.014 3.65 1991 Japan Korea 0.29 0.20 0.001 6.58 2004 Japan Korea 0.44 1.66 0.001 1.53
Notes: 1. Bilateral imports, as percentage of GDP. 2. Normal bilateral transaction costs, expressed in terms of percentage of total import without controlling distance. 3. Weighted bilateral transaction costs expressed in terms of percentage of total import controlling distance. 4. Weighted average tariff Sources: Calculated based on WB WITS, UN COMTRADE, and IMF DOTS
Table 4 (a, b) reports China’s top 10 import items (at HS 4) from Korea and Japan
and corresponding tariffs and transaction costs for 2001 and 2004. Even though China’s weighted average tariff has declined in 2004, compared to 2001, transaction costs of her imports from Korea has gone up in most of the items at the top 10 category, whereas the same for her imports from Japan has seen some improvements in most of the top 10 products in 2004. For example, China imports electronic integrated circuits and micro-assemblies (HS 8542) in large volume from both Korea and Japan. In fact, electronic integrated circuits and
15

micro-assemblies alone share 13.45 percent of China’s total import from Korea and 9.69 percent of her total import from Japan in 2004. Electronic integrated circuits and micro-assemblies have high value - high end use as intermediate products in electronics and electrical industry in China, which thereby influence global market as China has high share in global exports of electronics and electrical products. Looking at its high scale use and value addition in the country, Chinese government has completely withdrawn import tariffs on HS 8542. However, associated transaction costs of import of this item from Korea and Japan are too high; more than 200 percent is found to be as transaction costs for her import of this product from Korea and the same was around 90 percent for her import from Japan in 2004. Similarly, China imports liquid crystal devices (HS 9013) from both Korea and Japan, which almost shares 13.33 percent of China’s total imports from Korea and 3 percent of her total imports from Japan in 2004. These have been used as intermediate items in telecommunication, electronics and electrical industry. However, the cost of import of liquid crystal devices (HS 9013) from Korea is found to be three times higher than the import of the same from Japan.
Table 4(a): Transaction Costs of China’s Import from Korea: Top 10 Products HS
Product Name
Share1
(%) Tariff2
(%) TC2
(%) Year: 2001
2710 Oils petroleum, bituminous, distillates, except crude 7.32 8.80 9.98 8542 Electronic integrated circuits and microassemblies 6.08 5.97 416.60 8540 Thermionic and cold cathode valves and tubes 4.98 12.39 18.91 2917 Polycarboxylic acid, derivatives 3.08 11.08 11.33 3901 Polymers of ethylene, in primary forms 3.02 16.00 17.08 3903 Polymers of styrene, in primary forms 2.84 16.00 91.14 2902 Cyclic hydrocarbons 2.51 7.94 6.16 5407 Woven synthetic filament yarn, monofilament >67dtex 2.50 29.95 83.53 4104 Bovine or equine leather, no hair, not chamois, patent 2.16 8.55 36.66 7219 Rolled stainless steel sheet, width > 600mm 2.13 12.17 13.06
Year: 2004 8542 Electronic integrated circuits and microassemblies. 13.45 0.00 214.50 9013 Liquid crystal devices 13.33 8.44 304.14 8529 Parts suitable for use with the apparatus of headings 85.25 to 85.28 4.80 5.37 * 2710 Petroleum oils, other than crude 4.40 6.55 10.89 2917 Polycarboxylic acids, their anhydrides 3.03 8.24 6.56 2902 Cyclic hydrocarbons. 2.66 2.99 * 7219 Flat-rolled products of stainless steel, of a width of 600 mm or more. 2.50 4.93 11.31 8473 Parts and accessories for use with machines of heading 84.69 to 84.72 2.20 0.02 * 8540 Thermionic, cold cathode or photo-cathode valves and tubes 1.95 8.24 19.96 3903 Polymers of styrene, in primary forms. 1.87 10.10 31.61
16

Table 4(b): Transaction Costs of China’s Import from Japan: Top 10 Products HS
Product Name
Share1
(%) Tariff2
(%) TC2
(%) Year: 2001
8542 Electronic integrated circuits and microassemblies 9.35 5.98 168.63 8479 Machines nes having individual functions 3.10 14.55 46.31 8541 Diodes, transistors, semi-conductors, etc 2.73 10 106.75 8473 Parts, accessories, except covers, for office machines 2.46 9.01 47.22 8708 Parts and accessories for motor vehicles 1.83 26.6 4.85 8529 Parts for radio, tv transmission, receive equipment 1.63 13.46 49.18 5407 Woven synthetic filament yarn, monofilament >67dtex 1.46 29.98 7.04 8522 Parts, accessories of audio, video recording equipment 1.44 32.3 123.32 7210 Flat-rolled iron/steel, >600mm, clad, plated or coated 1.40 9.9 92.10 8536 Electrical switches, connectors, etc, for < 1kV 1.28 11.98 39.70
Year: 2004 8542 Electronic integrated circuits and microassemblies. 9.69 0.00 88.01 8479 Machines and mechanical appliances having individual functions 3.88 1.05 25.60 8541 Diodes, transistors and similar semiconductor devices 3.33 0.00 88.85 8529 Parts suitable for use with the apparatus of headings 85.25 to 85.28 3.23 5.36 48.69 9013 Liquid crystal devices 3.00 8.17 100.53 8473 Parts and accessories for use with machines of heading 84.69 to 84.72 2.78 0.11 20.85 8708 Parts and accessories of the motor vehicles of headings 87.01 to 87.05. 2.63 14.91 4.50 2902 Cyclic hydrocarbons. 1.81 3.00 1.62
8703 Motor cars and other motor vehicles principally designed for the transport, etc.
1.79
35.19
28.20
8532 Electrical capacitors, fixed, variable or adjustable (pre-set). 1.49 0.00 123.30 Notes: 1. Share in country’s total import from partner. 2. Weighted average MFN tariff applied to the partner. 3. Transaction costs of import from partner country. * Not possible to compute due to discrepancy in trade data Source: Calculated based on WB WITS and UN COMTRADE, sourced using KIEP’s online access.
Table 5(a): Transaction Costs of Japan’s Import from China: Top 10 Products
HS
Product Name
Share1
(%) Tariff2
(%) TC2
(%) Year : 2001
6110 Jerseys, pullovers, cardigans, waist-coats and sim 3.70 12.11 82.50 6204 Women's or girls' suits, ensembles, jackets, blaze 3.27 11.98 11.94 8471 Automatic data processing machines and units there 2.70 0.00 27.13 6203 Men's or boys' suits, ensembles, jackets, blazers, 2.29 12.16 * 4202 Trunks, suit-cases, vanity-cases, executive-cases, 2.15 9.26 90.17 8473 Parts and accessories (other than covers, carrying 1.80 0.00 228.31 8504 Electrical transformers, static converters (for ex 1.70 0.00 47.71 8529 Parts suitable for use solely or principally with 1.65 0.00 * 2701 Coal; briquettes, ovoids and similar solid fuels 1.63 0.00 10.33 6109 T-shirts, singlets and other vests, knitted or 0.00 11.03 *
Year : 2004 8471 Automatic data processing machines and units thereof 8.90 0.00 30.75 6110 Jerseys, pullovers, cardigans, waist-coats and similar articles, knitted or . 3.71 10.67 90.24 8473 Parts and accessories for use with machines of heading 84.69 to 84.72 3.21 0.00 76.57 6204 Women's or girls' suits, ensembles, jackets, blazers, dresses, skirts 2.79 9.81 15.43 8529 Parts suitable for use with the apparatus of headings 85.25 to 85.28 1.89 0.00 17.97 2701 Coal; briquettes, ovoids and similar solid fuels manufactured from coal. 1.86 0.00 20.39 6203 Men's or boys' suits, ensembles, jackets, blazers, trousers 1.80 10.08 * 4202 Trunks, suit-cases, vanity-cases, executive-cases, brief-cases 1.79 9.21 130.64 8544 Insulated (including enamelled or anodised) wire, cable 1.51 2.49 72.00 8504 Electrical transformers, static converters (for example, rectifiers) etc. 1.50 0.00 33.62
17

Table 5(b): Transaction Costs of Japan’s Import from Korea: Top 10 Products HS
Product Name
Share1
(%) Tariff2
(%) TC2
(%) Year: 2001
2710 Oils petroleum, bituminous, distillates, except crude 16.56 2.89 * 8542 Electronic integrated circuits and micro assemblies 12.81 0.00 34.53 8471 Automatic data processing machines (computers) 7.09 0.00 8.24 8473 Parts, accessories, except covers, for office machines 3.07 0.00 * 0303 Fish, frozen, whole 1.71 3.87 5.02 8525 Radio and TV transmitters, television cameras 1.58 0.00 34.21 8522 Parts, accessories of audio, video recording equipment 1.53 0.00 81.23 7208 Hot-rolled products, iron/steel, width>600mm, not clad 1.51 1.27 3.00 0307 Molluscs 1.23 6.92 * 8480 Moulds for metals (except ingot), plastic, rubber, etc 1.01 0.00 *
Year: 2004 8542 Electronic integrated circuits and micro assemblies. 15.62 0.00 16.01 2710 Petroleum oils, other than crude 12.49 2.93 * 8473 Parts and accessories for use with machines of heading 84.69 to 84.72 6.09 0.00 145.91 8471 Automatic data processing machines and units thereof 2.60 0.00 * 8529 Parts suitable for use with the apparatus of headings 85.25 to 85.28 2.36 0.00 * 8525 Transmission apparatus for radio-telephony, radio-broadcasting 1.79 0.00 22.51 7219 Flat-rolled products of stainless steel, of a width of 600 mm or more. 1.76 0.00 0.55 7208 Flat-rolled products of iron or non-alloy steel 1.58 0.00 0.44 7209 Flat-rolled products of iron or non-alloy steel 1.42 0.00 * 2902 Cyclic hydrocarbons. 1.34 0.00 *
Notes: 1. Share in country’s total import from partner. 2. Weighted average MFN tariff applied to the partner. 3. Transaction costs of import from partner country. * Not possible to compute due to discrepancy in trade data Source: Calculated based on WB WITS and UN COMTRADE, sourced using KIEP’s online access.
Table 6(a): Transaction Costs of Korea’s Import from China: Top 10 Products HS
Product Name
Share1
(%) Tariff2
(%) TC2
(%) Year : 2001
2701 Coal, briquettes, ovoids etc, made from coal 6.65 1.00 9.18 8473 Parts, accessories, except covers, for office machines 3.75 8.00 193.96 8471 Automatic data processing machines (computers) 3.22 0.00 32.37 8504 Electric transformers,static converters and rectifiers 3.02 8.00 59.88 2710 Oils petroleum, bituminous, distillates, except crude 2.44 8.00 5.53 6110 Jerseys, pullovers, cardigans, etc, knit or crochet 2.43 13.00 * 8529 Parts for radio, tv transmission, receive equipment 2.41 8.00 20.23 0303 Fish, frozen, whole 2.28 10.00 1.83 1005 Maize (corn) 2.25 0.00 * 6203 Mens or boys suits, jackets, trousers etc not knit 2.01 13.00 7.25
Year : 2004 8471 Automatic data processing machines and units thereof 4.69 8.00 * 2701 Coal; briquettes, ovoids and similar solid fuels manufactured from coal. 4.67 1.00 * 8542 Electronic integrated circuits and microassemblies. 3.48 8.00 * 8473 Parts and accessories for use with machines of heading 84.69 to 84.72 3.18 8.00 * 7208 Flat-rolled products of iron or non-alloy steel 2.97 8.00 * 7601 Unwrought aluminium. 2.95 3.00 * 8504 Electrical transformers, static converters (for example, rectifiers) etc. 2.33 8.00 24.03 8531 Electric sound or visual signalling apparatus 1.88 8.00 11.14 8529 Parts suitable for use with the apparatus of headings 85.25 to 85.28 1.84 8.00 22.16 8543 Electrical machines and apparatus with individual functions 1.76 8.00 27.73
18

Table 6(b): Transaction Costs of Korea’s Import from Japan: Top 10 Products HS
Product Name
Share1
(%) Tariff2
(%) TC2
(%) Year : 2001
8542 Electronic integrated circuits and microassemblies 9.93 8.00 16.27 8479 Machines nes having individual functions 4.04 8.00 20.15 7208 Hot-rolled products, iron/steel, width>600mm, not clad 3.78 8.00 13.15 8541 Diodes, transistors, semi-conductors, etc 2.75 8.00 10.23 8529 Parts for radio, tv transmission, receive equipment 2.33 8.00 50.01 8708 Parts and accessories for motor vehicles 2.24 8.00 9.32 2902 Cyclic hydrocarbons 1.76 5.00 * 8471 Automatic data processing machines (computers) 1.71 0.00 76.89 9001 Optical fibres, lenses, mirrors, prisms, etc 1.50 8.00 * 8473 Parts, accessories, except covers, for office machines 1.40 8.00 23.50
Year : 2004 8542 Electronic integrated circuits and microassemblies. 7.66 8.00 * 8479 Machines and mechanical appliances having individual functions 5.84 8.00 * 7208 Flat-rolled products of iron or non-alloy steel 4.73 8.00 8.78 8529 Parts suitable for use with the apparatus of headings 85.25 to 85.28 2.41 8.00 * 8541 Diodes, transistors and similar semiconductor devices 2.27 8.00 * 9001 Optical fibres and optical fibre bundles 1.98 8.00 * 8543 Electrical machines and apparatus, having individual functions 1.97 8.00 *
9010 Apparatus and equipment for photographic (including cinematographic) laboratories
1.91
8.00 1.93
7204 Ferrous waste and scrap; remelting scrap ingots of iron or steel. 1.84 1.00 8.19 2902 Cyclic hydrocarbons. 1.73 5.00 1.84 Notes: 1. Share in country’s total import from partner. 2. Simple average MFN tariff applied to the partner. 3. Transaction costs of import from partner country. * Not possible to compute due to discrepancy in trade data. Source: Calculated based on WB WITS and UN COMTRADE, sourced using KIEP’s online access.
19

Therefore, while the policy barriers (e.g. tariff) have been reduced, environmental barriers are very much in existence due to which prices of the finished products are becoming higher. In general, top 10 Chinese imports from Korea are associated with 0 to 10 percent tariffs and 7 to 304 percent transaction costs, whereas the same for China’s imports from Japan are associated with 0 to 35 percent tariffs and 2 to 123 percent transaction costs, respectively.
In case of Japan’s imports from China (Table 5(a)), most of the top 10 items except apparels and readymade garments, and electrical wire and cables (HS 8544) face no tariff barrier but carry high transaction costs. Total costs (tariff + transaction) are high in case of import of apparel and ready made garments (HS 6110, 6204, 6203) and insulated wire and cable (HS 8544) from China. Virtually, no policy barrier (in terms of tariff) exists in Japan on imports of high value – high end items (electronics and electrical intermediate and finished products) from China, but environmental barriers due to structural differences in the logistics and support services often make the landed price of imports much higher. In case of Japan’s imports from Korea (Table 5(b)), all the top 10 Korean products except petroleum oil, other than crude (HS 2710) faced no tariffs in 2004. In general, aggregate average transaction costs of Japan’s import from Korea is much less than her import from China appearing mainly due to Korea’s location and improved transportation facilities of the two countries, compared to China. Therefore, Japan’s imports from Korea face lesser constraints than her imports from China. In other words, due to favourable policy (tariff) and environment (improved trade infrastructure), Japan’s welfare gain from her imports from Korea and China seems to be much higher. To some extent, it may also be said that trade environment in Japan is far open and competitive, compared to Korea and China. Figure 5: Relative Importance of Transaction Costs and Tariff in Northeast Asia
0
5
10
15
20
25
30
35
40
45
0.00 10.00 20.00 30.00 40.00 50.00 60.00 70.00
T C (%)
Tarif
f (%
)
Notes: 1. Pooled data for the period 1991 to 2004. 2. Tariffs and TC are based on bilateral trading pairs.
On contrary, compared to China and Japan, Korea’s trade environment is more
restrictive. Most of electrical and electronics import items (HS 8542, 8543, 8529) from China and Japan face import tariffs of average 8 percent and also relatively higher transaction costs. In general, due to Korea’s distance advantage and its relatively better-endowed transportation facilities, cost of imports from Japan is much lower than her imports from China. However,
20

Korea’s relatively high tariffs seem to be offsetting its welfare gain arising from her improved trade infrastructure and its strategic location in the region.
Therefore, what follows is that regional trade is increasingly taking place in intermediate goods in Northeast Asia, which are used in regional and international production processes. The price of the vast majority of traded goods is thus not necessarily exogenous (appears to be), particularly in case of China and Korea in the Northeast Asia. Indirectly, as Tables 4, 5, and 6 indicate, the shipping of imports has become more expensive. Since rise in shipping costs being directly related with higher inflation ensues as a result of the increased cost of imported goods, and in the case of intermediate and capital goods, this also increases the costs of local production. Econometric estimates suggest that the doubling of an individual country’s transaction costs leads to a drop in its trade of 80 percent or even more (Hummels, 1999; Limao and Venables, 2001). So, lowering transaction costs is very much important to raise competitiveness of finished goods, particularly in case of Northeast Asia. Trade in intermediate goods requires JIT (just-in-time) deliveries of inputs. JIT in turn requires a particularly sophisticated and efficient transport system, which tends to be widely asymmetric in terms of services across the three countries in Northeast Asia.
Therefore, transaction costs have profound influence on trade. In our case, we found that average incidence of transaction costs seems to exceed that of tariffs over 1991 to 2004 (Figure 5), indirectly pointing towards the fact that trade and transport services are ever more closely linked with one another: to attain higher trade one need to improve its trade services. But does that relationship exogenously determined or can they be influenced by policy? This has been dealt in the next section in the framework of a partial equilibrium model.
Impact of Trade Costs on Regional Trade: Estimation Results
Having discussed the interdependence of Northeast Asian countries in trade, let us turn to see the impact of trade costs on bilateral trade with the help of the fixed effect panel data regression results.21 To assess such impact, as described in Section 3, we have used an augmented Gravity model (equation 4). The least-square estimates are provided in Table 7. Most of the variables do have expected signs as usual in the Gravity equations. As variables are used in natural logarithms, estimated coefficients show elasticity. All the models (1 to 4) explain 87 to 96 percent of the variations in direction of trade flows. The most interesting result is the strong influence that transaction costs and trade mobility infrastructure had on trade (at 1 percent level): the higher the transaction cost between each pair of partners, the less they trade. Therefore, reduction in transactions costs between the trading partners will certainly raise trade by a very large proportion. As can be seen from Table 7, coefficients of transaction costs in most of the cases (except Model 1) are statistically significant and always negative; for example, in the second model, the elasticity of transaction costs is as high as 9 percent with high statistical significance (-2.28 t-value).
Next important factor is GDP (and also GDP per capita) of both exporting and importing countries. But this is a rather common phenomenon as we are dealing with aggregate behaviours. The negative and significant coefficients of tariffs indicate that further reduction of tariff will positively influence the bilateral imports. However, country’s openness (except in case of Model 2, where exporting country’s openness is significant at 5 percent level) has never appeared as significant barrier primarily because of existence of two main
21 To take into account the “individuality” of each country, we have considered fixed effects regression (or what is known as Least-Squares Dummy Variable (LSDV) regression model) in this study, which, in other words, tells us that intercept varies for each country but slope coefficients are constant across countries. This model is applied taking in account balanced panel data as described in Section 3.
21

reasons: (a) existence of low tariff rates among the countries considered here, and (b) Korea and China’s comparatively higher dependence on foreign trade so that absence of any counter-factual variation in the dataset could not make the statistical test going in favour of ‘openness’.
Table 7: Gravity Model Results: Fixed Effect Regression Variable 1 2 3 4
1.659*** -13.984** -10.349* Importing countries GDP (7.928) (-5.229) (-2.232)
1.620*** 2.529*** 1.438** Exporting countries GDP (10.389) (13.484) (4.836)
2.416** 17.260** 13.706* Importing countries GDP per capita (7.543) (5.841) (2.675)
0.826** -0.700** 0.008 Exporting countries GDP per capita (4.275) (-4.695) (0.033)
0.221 -0.224 -0.209 -0.577 Importing countries trade mobility infrastructure (0.506) (-0.358) (-0.637) (-1.004)
-0.446*** -0.229* -0.525*** Exporting countries trade mobility infrastructure (-7.895) (-2.992) (-12.512)
0.240 0.543 0.227 0.474 Importing countries openness (0.778) (1.232) (0.970) (1.164)
0.009 0.583* 0.034 -0.084 Exporting countries openness (0.050) (2.181) (0.208) (-0.301)
0.036 -0.086* -0.105** Transaction costs (1.376) (-2.281) (-3.209)
0.126 -0.336** -0.132* -0.291* Tariff (1.583) (-3.051) (-2.313) (-2.832)
-0.978*** -0.829** -0.461* -0.618* Importing countries exchange rate (-5.331) (-3.153) (-2.801) (-2.150)
-0.735*** -0.751** -0.342* -0.274* Exporting countries exchange rate (-7.355) (-3.368) (-2.754) (-1.289)
-5.682*** -1.378 -6.062*** -3.766** Distance (-6.760) (-1.364) (-9.197) (-3.516) Adjusted R2 0.941 0.876 0.964 0.895 DW 0.995 1.005 1.007 1.002 Notes: Numbers in parentheses are t-values. * Significant at the 10 percent level. ** Significant at the 5 percent level. ***Significant at the 1 percent level On the other hand, exchange rates show a significant (at 1 percent level) negative effect on trade. All the models in Table 7 indicate that a lowering of the exchange rate fluctuations will have a stronger impact on trade. On the cynical side, one could say that actual volume of trade in the world is still a phenomenon which is driven more by exchange rate manipulation than by pure competitiveness (Krugman, 1994).
The importance of ‘nearness’ in Northeast Asia is also seen in Table 7. In all cases, distance is found as a significant variable to influence trade. This is a great advantage for the Northeast Asian countries to achieve higher intraregional trade and mobility of labour and capital by removing common borders.22 22 By removing common borders between Germany and Czech, and also between the United States and Mexico, substantial positive effects could be observed on predicted income per capita in the smaller countries; income per capita of Czech and Mexico have gone up by 26 percent and 27 percent respectively presumably as a result of integration (Redding and Venables, 2004).
22

Quite consistent with the behaviour of transaction cost, exporting country’s trade infrastructure produces a significant positive effect on bilateral trade with the highest elasticity (53 percent) reaching in Model 3 (significant at 1 percent level). The idea behind this result is that if exporting country strengthens its trade infrastructure (namely, railways, roadways, ports, airways and telecommunication facilities) then bilateral trade gets increased even without much compulsion on importing country’s trade infrastructure as sending the goods is much more important than distributing them inside the importing country. But if the latter were also strengthened, there must be higher impact on traded volumes. For example, if we consider poor trading infrastructure facilities (poor quality of such facilities which works against trade), we find that countries which are running fairly well developed transport infrastructure facilities have gone much ahead of others in reaping benefits from export market such as Singapore, Hong Kong, and Taiwan. We found in many cases the positive relationship between country’s exports with its trade infrastructure facilities. Thus strengthening trading infrastructure is equally important while mooting up plan to promote regional cooperation in Northeast Asia.
Table 8: Gravity Model Results: Optimising Impact of Transaction Costs Variable 1 2 3
2.040** -10.272* 2.196*** Importing countries GDP (7.267) (-2.215) (9.316)
1.202** 1.389** 1.154** Exporting countries GDP (5.942) (4.735) (5.863)
13.783* Importing countries GDP per capita (2.690)
0.015 Exporting countries GDP per capita (0.061)
-0.611 Importing countries trade mobility infrastructure (-1.023)
0.488 0.168 0.164 Importing countries openness (1.154) (0.622) (0.585)
-0.321 -0.135 -0.379 Exporting countries openness (-1.248) (-0.492) (-1.514)
-0.117** -0.098** -0.109** Transaction costs (-3.545) (-3.064) (-3.400)
-0.281* -0.286* -0.275** Tariff (-2.630) (-2.782) (-2.577)
-1.026** -0.490 -0.893** Importing countries exchange rate (-4.059) (-1.902) (-4.120)
-0.229* -0.281 -0.230* Exporting countries exchange rate (-2.163) (-1.320) (-2.173)
-3.335** -3.717** -3.274** Distance (-3.075) (-3.474) (-3.023) Adjusted R2 0.887 0.895 0.886 DW 1.001 1.000 1.001
Notes: Numbers in parentheses are t-values. * Significant at the 10 percent level. ** Significant at the 5 percent level. ***Significant at the 1 percent level
Trade infrastructure between any two partners of trade is certainly an important factor
in determining the volume of trade for any bilateral transaction. Importing countries trade infrastructure ought to be statistically insignificant. Statistically speaking, this may be due to the fact that exporting country’s trade infrastructure and transaction cost partly work in the same direction. In fact robustness of transaction costs has gone up in Table 8 where we excluded trade infrastructure facilities to minimize the frictions. In that case (Table 8), we found both transaction costs and tariffs are highly significant and import factors to influence
23

bilateral trade. In all the models in Table 8, transaction costs and tariffs came out as very significant factors explaining over 88-89 percent of the variations in direction of trade flows.
In this study, GDP and GDP per capita (of both exporting and importing country) have come out to exert a statistically significant positive impact on trade through the chain of effective demand. It also may be concluded that countries with relatively low trade mobility infrastructure have encountered with high transaction costs thereby offsetting the gain from higher trade. Besides distance and some other variables, an important determinant for rising intraregional trade is exchange rate. Further depreciation of national currency is likely to increase bilateral trade. Hence, in order to enhance regional trade (and also regional integration) in Northeast Asia, the priority should be therefore to (a) control transaction costs, and (b) strengthen the chain of necessary trading infrastructure facilities, starting from the production point to the shipment point, and associated trade facilitation measures.
However, we may not be able to indicate the country-specific direction of transaction costs and trade mobility from the estimated coefficients as the level of infrastructure endowment and preparedness for free trade differs across countries. The estimated elasticities may produce biased results in case of change of scale. From a policy perspective, the differences in trade flows with respect to the transaction costs and trade mobility suggest that different approaches towards reduction in trade costs (or to trade facilitation) will differentially affect imports of the region as a whole.
In sum, the major concern towards rising intraregional trade in Northeast Asia is trade costs, which seems to be influenced in present context mostly by barriers related to environment rather than policies. The challenge for Northeast Asian countries is to identify improvements in logistics services and related infrastructure that can be achieved in the short-to-medium term and that would have a significant impact on competitiveness of these three countries. Therefore, the need is to continuously upgrade trading infrastructure facilities and strengthen trade facilitation measures which will not only pave the way for sustained intraregional trade but also speed up the regional integration process towards establishing an FTA in near future.
Conclusions
The analysis carried out in this paper place evidences to ascertain that today’s trade issues in Northeast Asia go beyond the traditional mechanisms of tariffs, and include “behind-the-border” issues. The link between trade flows and trade costs has been based previously more on intuition than evidence, particularly in context of Northeast Asia. We found that variations in transaction costs along with trade mobility infrastructure facilities have significant influence on regional trade flows in Northeast Asia. When the tariffs have come down heavily, the economies of this region could potentially benefit substantially from higher trade subject to control of transaction costs. However, a number of obstacles block the realisation of this potential. Among the most serious of these is rising transaction cost as an outcome of the visible and policy constraints on the regional trade and infrastructure system. Therefore, policy protection should tend to complement natural protection, lowering the variability of total trade costs.
Tariffs tend to be lower not only in Northeast Asia but also across most of the economies in the world. Attention is being paid towards trade facilitation, to a varied extent, across the world. The issue of trade facilitation has been highlighted by WTO by many ways giving reasons to that fact that the level of tariffs has been gradually lowered to 4 percent on
24

average according to WTO.23 Generally speaking, tariffs are not regarded as major barriers to trade although high-tariff items and tariff escalation still exist for certain sensitive products. With globalization of economic activities, business and trading communities—in particular, small and medium enterprises—pay greater attention to various government documentation requirements in order to reduce the cost of doing business. Studies by World Bank, OECD, UNCTAD, APEC and UNESCAP clearly show that documentary requirements are burdensome to the trading community, and that trade facilitation efforts will be more beneficial than trade liberalization.24 Needless to say, countries in Northeast Asia have to adopt a common policy towards lowering trade costs – not only for their trade in the region but also for the rest of the world. Therefore, their regional obligations need to match with their WTO commitments towards facilitation of trade. Adopting two different approaches towards trade facilitation (regional and multilateral) will not produce desired results and thus not recommended as trade is not restricted to a particular region and there is high interdependence among the economies across the world.
All the three countries in Northeast Asia have been undertaking trade facilitation measures aiming to reduce current physical and non-physical barriers to transportation and transit – by means of both visible infrastructure (such as multi-modal corridors and terminals) and invisible infrastructure (such as reformed policies and procedures, regulations). There is significant potential for improving Northeast Asian economies, especially in the part of Korea due to its strategic location.
With an increased emphasis on administrative reform, governance, and security, the need for an efficient and effective customs administration is also urgently required. Customs is an intrinsic element of any cross border movement of goods and services, and yields significant influence on the national economy. It is the unique point, where it has a good understanding of the supply chain as well as routine access to trade intelligence and data. Beyond facilitating trade, Customs performs other important functions such as revenue collection and protection against dangerous goods. The time taken for clearance of goods has an impact on the competitiveness of Northeast Asian countries in the global context.
Even though Customs Authorities in Northeast Asia have undergone significant reforms in recent years25, particularly in Korea and Japan, one of the major reasons for high 23 The First WTO Ministerial Conference held in Singapore in 1996 added the issue of trade facilitation in the WTO’s future agenda. It requested the Council for Trade in Goods to undertake a work program to assess the scope for WTO rules concerning the simplification of trade procedures. Together with the issues of trade and investment, trade and competition policy, and transparency in government procurement, the issue of trade facilitation formed the so-called “Singapore Issues.” The inclusion of trade facilitation in the Doha Development Agenda was decided at the Fifth WTO Ministerial Conference held on September 2003 in Cancun, Mexico. It was also agreed to ensure adequate technical assistance and capacity building in this area. Unfortunately, no such agreement was reached at the Cancun Conference. However, in July 2004, WTO’s General Council decided to include trade facilitation in the DDA as part of the “July Package”, and set the date for the completion of DDA to 1 January 2007 (WTO 2004). The WTO’s Sixth Ministerial Conference, held in Hong Kong, China in December 2005, aimed to agree on a basic framework on trade facilitation agreement. Annex D of the July Package states that trade facilitations aims to clarify and improve relevant aspects of Articles V, VIII, and X of the GATT 1994 with a view to further expediting the movement, release, and clearance of goods. In doing this, due account is taken of the relevant work of the World Customs Organisation (WCO). The WCO is an independent specialized international organization for customs matters that provides a set of international standards on customs procedures to facilitate trade. 24 To mention a few, Brooks et al (2005), Ujiie (2006), Duval (2006) 25 With an objective to reduce border transaction time, China, Japan and Korea have successfully simplified administrative documentation, computerization of documents by connecting all custom points through electronic data interchange, paperless trading, alignment with international standards, pre-shipment inspection for all non-government imports, simplified tariff based on the Harmonized Code (8 digit); and red and green channels in major airports, seaports since 1999 (APEC, 2005)
25

transaction costs in Northeast Asia, however, is time taking in cross border trading procedures. Complex requirements in cross-border trade increase the possibility of corruption. Expediting customs clearance procedures reduces the discretionary power of customs officials, thus reducing the scope for corruption. An efficient, friendly and corruption free customs can help boost trade and investment. Customs procedures between China and Korea have improved moderately in recent years since China began to actively develop its export trade but document processing is still largely manual and discourages the seamless flow of traffic.
At the ground level, lack of adequate maritime transportation links among the Northeast Asian members poses serious problems for the expansion of trade. A trade consignment takes minimum 3 to 4 days for clearance from Japanese port, which was even more than 7 days a decade back.26 Again, the present legal arrangement between Japan and China prohibits Japanese flag vessel (or Chinese flag vehicle) to engage in coastal shipping for delivering the consignment to the ultimate user(s). Generally, a consignment needs several documentations, signatures, and copies for the final approval, taking into account both sides, and encounter multiple transhipments, resulting which costs are rising high day-by-day which often tends to change the composition and direction of trade. Therefore, procedural complexities coupled with static trade facilitation measures work as deterrent to trade in Northeast Asia.27
This study has some limitations. The possibility of endogeneity can not be excluded that greater bilateral trade will lead to higher values of trade mobility infrastructure facilities. The usage of trade mobility infrastructure facilities (port, aviation, telecommunication, rail, road, etc.) may improve with a country’s import flows and lower trade costs, and if this endogeneity is present the estimated coefficients for the variable would be biased upward. So, to remove the endogeneity problem, we need to employ instrumental variables. As an extension of this study, perhaps, taking raw inputs of the trade mobility infrastructure index may be adopted to mitigate the endogeneity problem.
In order to better inform policy-making process, future research should be undertaken to complement the findings of this paper in following ways. First, the focus of this study is on the importance of trade costs and trade facilitation in the context of Northeast Asia. Both the measures are very much aggregative in nature. So, future study should attempt to decompose the trade mobility infrastructure index, and find the causal linkages of the variables with the trade flow separately. Second, the study has considered aggregate total trade and transaction costs in bilateral pairs.28 Future research should consider disaggregated trade and trade costs in a dynamic framework at least at the 4-digit level. Third, this paper has considered direct trade costs but omitted infrastructure costs. Variability in infrastructure endowments and costs thus need to be captured more accurately in the model provided the data is made available. Finally, in order to find out the relative robustness of the transaction costs, one may need to replace the transaction costs assessment methodology adopted here by other method(s). 26 The average lead time from port arrival to granting an import permit for all imported cargo in Japan has largely been reduced over the past 10 years. This reduction in the port distribution lead time has resulted in higher efficiency of operations for cargo owners, shipping companies and shipping forwarders, etc. The Customs and Tariff Bureau, Ministry of Finance of Japan, has so far implemented six time release surveys. According to the latest survey conducted in 2001, the average requisite time from port arrival to permit issuance for all imported cargo was 73.8 hours or 3.1 days, representing a major reduction compared with the lead time in the first survey in 1991 of 168.2 hours or 7.0 days (Government of Japan, 2004) 27 Complex customs and tariff administration were also found as strong barriers to trade in Korea (Kim and Park, 2001). Refer Table 2 of Sohn and Yang (2003) for further details. 28 Due to limitation of time of the visiting fellowship provided by the KIEP, this author was unable to extend the analysis on disaggregated (at least 4 digit HS) trade data.
26

Appendix 1
Sources of Data Particular Source Bilateral trade UN COMTRADE
IMF DOTS Bilateral tariff WB WITS
Korea Customs GDP, GDP per capita, surface area, population, openness, exchange rate
WB WDI 2005
Distance Great circle distance, http://www.wcrl.ars.usda.gov/cec/java/lat-long.htm
Infrastructure variables: (i) railway length, (ii) road length, (iii) air transport freight, (iv) air transport passengers carried, (v) aircraft departures, (vi) container traffic, (vii) fixed line and mobile phone subscribers, (viii) internet users, and (ix) electric power consumption
WB WDI 2005 UNESCAP
27

Appendix 2
(a) Trade Structure between China and Japan: Top 10 Commodities in 2004 Value Share Commodity
Code Commodity Description (US$ billion) (%)
(a) Export
HS 85 Electrical machinery and equipment and parts thereof; sound recorders etc. 13.10 17.82
HS 84 Machinery and mechanical appliances; parts thereof 11.69 15.90
HS 62 Articles of apparel and clothing accessories, not knitted or crocheted 7.55 10.27
HS 61 Articles of apparel and clothing accessories, knitted or crocheted 6.06 8.24
HS 27 Mineral fuels, mineral oils and products of their distillation 2.99 4.07
HS 90 Optical, photographic, cinematographic, measuring, checking, precision, etc. 2.55 3.47
HS 16 Preparations of meat, of fish or of crustaceans 2.18 2.97
HS 94 Furniture; bedding, mattresses, cushions and similar stuffed furnishing 1.61 2.19
HS 63 Other made up textile articles; sets; worn clothing and worn textile article, etc. 1.47 1.99
HS 87 Vehicles other than railway or tramway rolling stock 1.46 1.98 (b) Import
HS 85 Electrical machinery and equipment and parts thereof; sound recorders, etc. 28.33 30.04
HS 84 Machinery and mechanical appliances; parts thereof 21.69 23.00
HS 90 Optical, photographic, cinematographic, measuring, checking, precision, etc. 7.82 8.29
HS 72 Iron and steel 5.58 5.92 HS 39 Plastics and articles thereof 4.65 4.93 HS 87 Vehicles other than railway or tramway rolling stock 4.63 4.90 HS 29 Organic chemicals 4.54 4.82 HS 73 Articles of iron or steel 1.43 1.51 HS 74 Copper and articles thereof 1.41 1.50 HS 38 Miscellaneous chemical products 1.06 1.12
Note: Consider China’s two-way trade with Japan Source: UN COMTRADE
28

(b) Trade Structure between China and Korea: Top 10 Commodities in 2004 Commodity
Code Commodity Description
Value (US$ billion)
Share (%)
(a) Export
HS-85 Electrical machinery and equipment and parts thereof; sound recorders etc. 6.64 23.86
HS-84 Machinery and mechanical appliances; parts thereof 2.89 10.38
HS-72 Iron and steel 2.53 9.10
HS-27 Mineral fuels, mineral oils and products of their distillation 1.74 6.24
HS-62 Articles of apparel and clothing accessories, not knitted or crocheted 1.38 4.95
HS-61 Articles of apparel and clothing accessories, knitted or crocheted 1.33 4.78
HS-76 Aluminium and articles thereof 0.97 3.48
HS-03 Fish and crustaceans, molluscs and other aquatic invertebrates 0.85 3.06
HS-29 Organic chemicals 0.59 2.13
HS-90 Optical, photographic, cinematographic, measuring, checking, precision, etc. 0.58 2.10
(b) Import
HS-85 Electrical machinery and equipment and parts thereof; sound recorders, etc. 18.58 29.86
HS-90 Optical, photographic, cinematographic, measuring, checking, precision, etc. 9.18 14.76
HS-84 Machinery and mechanical appliances; parts thereof 6.89 11.07
HS-29 Organic chemicals 4.98 8.01 HS-39 Plastics and articles thereof 4.88 7.83 HS-72 Iron and steel 4.17 6.69
HS-27 Mineral fuels, mineral oils and products of their distillation 3.21 5.16
HS-87 Vehicles other than railway or tramway rolling stock 1.50 2.42
HS-74 Copper and articles thereof 0.86 1.38 HS-54 Man-made filaments 0.78 1.26
Note: Consider China’s two-way trade with Korea Source: UN COMTRADE
29

(c) Trade Structure between Korea and Japan: Top 10 Commodities in 2004 Commodity
Code Commodity Description
Value (US$ billion)
Share (%)
(a) Export
HS-85 Electrical machinery and equipment and parts thereof; sound recorders etc. 6.05 27.86
HS-27 Mineral fuels, mineral oils and products of their distillation 3.39 15.60
HS-84 Machinery and mechanical appliances; parts thereof 2.77 12.76
HS-72 Iron and steel 1.62 7.45 HS-39 Plastics and articles thereof 0.87 4.01 HS-29 Organic chemicals 0.78 3.60 HS-73 Articles of iron or steel 0.62 2.86
HS-03 Fish and crustaceans, molluscs and other aquatic invertebrates 0.60 2.78
HS-90 Optical, photographic, cinematographic, measuring, checking, precision, etc. 0.52 2.37
HS-87 Vehicles other than railway or tramway rolling stock 0.34 1.57
(b) Import
HS-85 Electrical machinery and equipment and parts thereof; sound recorders etc. 12.30 26.65
HS-84 Machinery and mechanical appliances; parts thereof 8.57 18.57
HS-72 Iron and steel 5.85 12.68
HS-90 Optical, photographic, cinematographic, measuring, checking, precision, etc. 4.81 10.42
HS-29 Organic chemicals 2.18 4.73 HS-39 Plastics and articles thereof 2.18 4.72 HS-38 Miscellaneous chemical products 1.28 2.76
HS-87 Vehicles other than railway or tramway rolling stock 1.02 2.21
HS-70 Glass and glassware 0.74 1.61
HS-27 Mineral fuels, mineral oils and products of their distillation 0.71 1.54
Note: Consider Korea’s two-way trade with Japan Source: UN COMTRADE
30

References Andersaon, J. E. 1979. “A Theoretical Foundation for the Gravity Equation”, American
Economic Review, Vol. 69, pp. 106-116. Anderson, J. E. 1994. “The Theory of Protection”, in Surveys in International Trade. David
Greenway and L. Alan Winters (eds.), Blackwell, Oxford, pp. 107 -138 Anderson, J. E. and van Wincoop, E. 2002. “Borders, Trade and Welfare”, in Brookings
Trade Forum 2001. Susan Collins and Dani Rodrik (eds.), Brookings Institution, Washington, pp. 207-244
Anderson, J. E. and van Wincoop, E. 2004. “Trade Costs”, Journal of Economic Literature, Vol. XLII, No. 3, pp. 691 - 751.
Andriamananjara, S. 2004. “Trade and International Transport Services: An Analytical Framework”, Journal of International Integration, Vol. 19, No. 3, pp. 604-625
Asia Pacific Economic Cooperation (APEC). 2002. Measuring the Impact of APEC Trade Facilitation on APEC Economies: A CGE Analysis, Singapore.
Asia Pacific Economic Cooperation (APEC). 2005. APEC Trade Facilitation, Singapore Baier, S L, and Bergstrand, J. F. 2001. “The Growth of World Trade: Tariffs, Transport Costs,
and Income Similarity”, Journal of International Economics, Vol. 53, pp. 1-27 Bergstrand, J. H. 1985. “The Gravity Equation in International Trade: Some Microeconomic
Foundations and Empirical Evidence”, Review of Economics and Statistics, Vol. 67, pp. 474-81
Bergstrand, J. H. 1989. “The Generalized Gravity Equation, Monopolistic Competition, and the Factor-Proportions Theory in International Trade”, Review of Economics and Statistics, Vol. 71, pp. 143-53.
Bougheas, S. et. al. 1999. “Infrastructure, Transport Costs, and Trade”, Journal of International Economics, Vol. 47, pp. 169-89.
Brakman, S., Garretsen, H. and Marrewijk, C. V. 2001. An Introduction to Geographical Economics, Cambridge University Press, Cambridge.
Brooks, D. H., Roland-Host, D. and Zhai, F. 2005. Asia’s Long-term Growth and Integration: Reaching beyond Trade Policy Barriers. ERD Policy Brief No. 38, Asian Development Bank, Manila
Cernat, L, 2001. Assessing Regional Trading Arrangements: Are South-South RTAs More Trade Diverting?, UNCTAD Policy Issues in International Trade and Commodities Study Series No. 16, UNCTAD, Geneva.
Cheong, I. 2005. “Estimation of Economic Effects of FTAs in East Asia – CGE Approach”, in East Asian Economic Regionalism: Feasibilities and Challenges. Ahn, C Y, Baldwin, R. E., and Cheong, I (eds.)., Springer, The Netherlands, pp. 139 – 155
Clark, X., David, D. and Micco, A. 2004. Port Efficiency, Maritime Transport Costs and Bilateral Trade, Working Paper 10353, NBER, Cambridge.
Crawford, Jo-Ann and Fiorentino, R. 2005. The Challenging Landscape of Regional Trade Agreements, Discussion Paper No 8, WTO, Geneva.
David, D. 1998. “The Home Market Effect, Trade and Industrial Structure”, American Economic Review, Vol. 88, No. 5, pp. 1264 – 1276
De, P. 2004. Transaction Costs as Barriers to Economic Integration in Asia: An Empirical Exploration, RIS Discussion Paper No. 77, Research and Information System for Developing Countries, New Delhi
De, P. 2005. “Affect of Transaction Costs on International Integration in the Asian Economic Community”, in Asian Economic Cooperation and Integration: Progress, Prospects, Challenges. Asian Development Bank (ed.), Manila.
Deardorff, A. 1998. “Determinants of Bilateral Trade: Does Gravity Work in a Neo-Classical World?” in: Regionalization of the World Economy, J. Frankel (ed.), University of Chicago Press, Chicago.
31
Duval, Yann. 2006. Cost and Benefits of Implementing Trade Facilitation Measures under Negotiations at the WTO: an Exploratory Survey, Asia-Pacific Research and Training Network on Trade Working Paper Series, No. 3, UNESCAP, Bangkok
Feenstra, R. C. 1998. “Integration of Trade and Disintegration in Production in the Global Economy”, Journal of Economic Perspectives, Vol. 12, No. 4, pp. 31-50
Fink, C., Mattoo A, and Neagu, I. C. 2002. “Trade in International Maritime Services: How Much Does Policy Matter?” The World Bank Economic Review, Vol. 16, pp. 451-79.
Fink, C., Mattoo, A. and Neagu, I. C. 2005. “Assessing the Impact of Communication Costs on International Trade?”, Journal of International Economics, Vol. 67, pp. 428 - 445
Francois, J, and Manchin, M. 2006. Institutional Quality, Infrastructure, and the Propensity to Export, CEPR, London
Friedman, B. M. 2005. The Moral Consequences of Economic Growth, Knopf, New York Glick, R. and Rose, A. K. 2002. “Does a Currency Union Affect Trade? The Time-Series
Evidence”, European Economic Review, Vol. 46. Government of Japan, 2004. Study on the Economic Effects: Resulting from Reduction of
Lead Time for Import Procedures. Ministry of Finance, Customs and Tariff Bureau, Tokyo.
Hai, W. and Zhang, X. 2004. “A Bilateral or Trilateral FTA?”, in Strengthening Economic Cooperation in Northeast Asia, Y H Kim and C J Lee (eds.), Korea Institute for International Economic Policy, Seoul, pp. 137-162
Harrigan, J. 1993. “OECD Imports and Trade Barriers in 1983”, Journal of International Economics, Vol. 34, pp. 91-111
Hummels, D. 1999. Have International Trade Costs Declined?, Working Paper, University of Chicago Business School, Chicago.
Hummels, D. 2001a. Towards a Geography of Trade Costs, Working Paper, Purdue University, West Lafayette
Hummels, D. 2001b. Time as Trade Barrier, Working Paper, Purdue University, West Lafayette
International Monetary Fund (IMF). 2005. Direction of Trade Statistics, Database and Browser, Washington D.C.
Kim, Sang-kyon and Park, Inwon. 2001. The Benefits of Trade Facilitation in APEC, Policy Analysis 01-05, Korea Institute for International Economic Policy, Seoul
Krugman, P. 1994. “Competitiveness: A Dangerous Obsession”, Foreign Affairs, Vol. 73. Lee, C. J. et al. 2005. Rationale for a China-Japan-Korea FTA and Its Impact on the Korean
Economy, Korean Institute for International Economic Policy (KIEP), Seoul. Limao, N. and Venables, A. J. 2001. “Infrastructure, Geographical Disadvantage, Transport
Costs, and Trade”, The World Bank Economic Review, Vol. 15, pp. 451-479. Nordås, H.K and Piermartini R. 2004. Infrastructure and Trade, Staff Working Paper ERSD-
2004-04, Economic Research and Statistics Division, World Trade Organization, Geneva.
Obstfeld, M, and Rogoff, K. 2000. “The Six Major Puzzles in International Macroeconomics: Is There a Common Cause?”, in NBER Macroeconomics Annual 2000. B. S. Bernanke and K. Rogoff (eds.), MIT Press, Cambridge, pp. 339-390
Organisation for Economic Cooperation and Development (OECD). 2005. The Costs and Benefits of Trade Facilitation, October, Paris.
Redding S. and Venables, A. J. 2004. “Economic Geography and International Inequality”, Journal of International Economics, Vol. 62, No. 1, pp. 53-82
Schiff, M and Winters, L. A. 2003. Regional Integration and Development, Oxford University Press, New York.
Sohn, Chan-Hyun, and Yang, Junsok. 2003. Trade Facilitation in the WTO: Implications for Developing Countries and a Roadmap to Cancun, Discussion Paper 03-04, Korea Institute for International Economic Policy, Seoul.
Stiglitz, J. E. 2003. “Globalization, Technology, and Asian Development”, Asian Development Review, Vol. 20, pp. 1-18.
32

Ujiie, T. 2006. Trade Facilitation, ERD Working Paper No. 78, Asian Development Bank, Manila
United Nations Economic and Social Commission for Asia and Pacific (UNESCAP). 2002. ESCAP Trade Facilitation Framework: A Guiding Tool, Bangkok.
Wilson, J. S., Mann, C. L., and Otsuki, T. 2003. “Trade Facilitation and Economic Development: A New Approach to Quantifying the Impact”, The World Bank Economic Review, Vol. 17, No. 3, pp. 367-389
World Bank. 2002. The Economic Impact of Trade Facilitation Measures: A Development Perspective in the Asia Pacific, Washington, D.C.
World Bank. 2005. World Development Indicators 2005, Washington Yip, W. 2001. “Prospects for Closer Economic Integration in East Asia”, Stanford Journal of
East Asian Affairs, Vol. 1, pp. 106-111. Yungling, Z. 2005. The Future Perspective of East Asian FTA, BBL Seminar Proceeding, The
Research Institute of Economy, Trade and Industry (RIETI), Japan, Available at http://www.rieti.go.jp/en/events/bbl/05102401.pdf
33