why study economics? john maynard keynes answer “the ideas of economists and political...
TRANSCRIPT

WHY STUDY ECONOMICS? JOHN MAYNARD KEYNES ANSWER “the ideas of economists and political philosophers, both when they are right and when they are wrong, are more powerful than is commonly understood. Indeed, the world is ruled by little else. Practical men, who believe themselves to be quite exempt from any intellectual influences, are usually slaves of some defunct economist.”
Much of you political beliefs are shaped by economic philosophy. Much of what you take in business has its roots in economic theory. An understanding of economics is necessary if one is to understand society.

CONVENTIONAL WISDOM [A] vested interest in understanding is more
preciously guarded than any other treasure. It is why men react, not infrequently with something akin to religious passion, to the defense of what they have so laboriously learned.
Familiarity may breed contempt in some areas of human behavior, but in the field of social ideas it is the touchstone of acceptability. Because familiarity is such an important test of acceptability, the acceptable ideas have great stability. They are highly predictable. It will be convenient to have a name for the ideas which are esteemed at any time for their acceptability, and it should be a term that emphasizes this predictability. I shall refer to these ideas henceforth as the conventional wisdom. (Galbraith, 1958, pp. 6–7, italics added)

MORE QUOTES FROM JOHN KENNETH GALBRAITH Faced with the choice between changing one's mind and proving that there is no need to do so, almost everyone gets busy on the proof. The only function of economic forecasting is to make astrology look respectable. Economics is extremely useful as a form of employment for economists. Under capitalism, man exploits man. Under communism, it's just the opposite.

VARIOUS VERSUS Thinking vs. Memorization Studying economics requires that you UNDERSTAND the theories and models presented and can use these to reach an answer.
Ideology vs. Science
Arguing from conclusion to evidence vs. Arguing from evidence to conclusion. Ideologues “KNOW” their answer before they start looking at the evidence. Science has to look at the evidence before reaching an answer.
How do you know if a person is an ideologue? The person always gives the same answer.

DEDUCTION VS. INDUCTIONDeduction: a method of reasoning in which on
deduces a theory based on a set of almost self-evident principles.
Induction: a method of reasoning in which one develops general principles by looking for patterns in the data.
As computing power has increased, induction has become more prevalent.
Abduction: a method of analysis that uses a combination of inductive and deductive methods.

Economics Defined Economics - is the study of how human beings coordinate their wants and desires, given the decision-making mechanisms, social customs and political realities of the society.
Economics - The study of the choices people make with respect to scarcity.

Micro vs. Macro Microeconomics - the study of individual choice, and how that choice is influenced by economic forces.
Macroeconomics - the study of the aggregate economy OR the study of economy as a whole, which includes inflation, unemployment, business cycles, and growth.

The Basic Questions
The Basic Questions of Society◦ What to produce?◦ How much to produce?◦ How to produce?◦ For whom to produce?

The Fundamental Problem
Scarcity - the goods available are too few to satisfy individuals’ desires.
Scarcity is the fundamental economic problem.
Scarcity forces us to make choices.
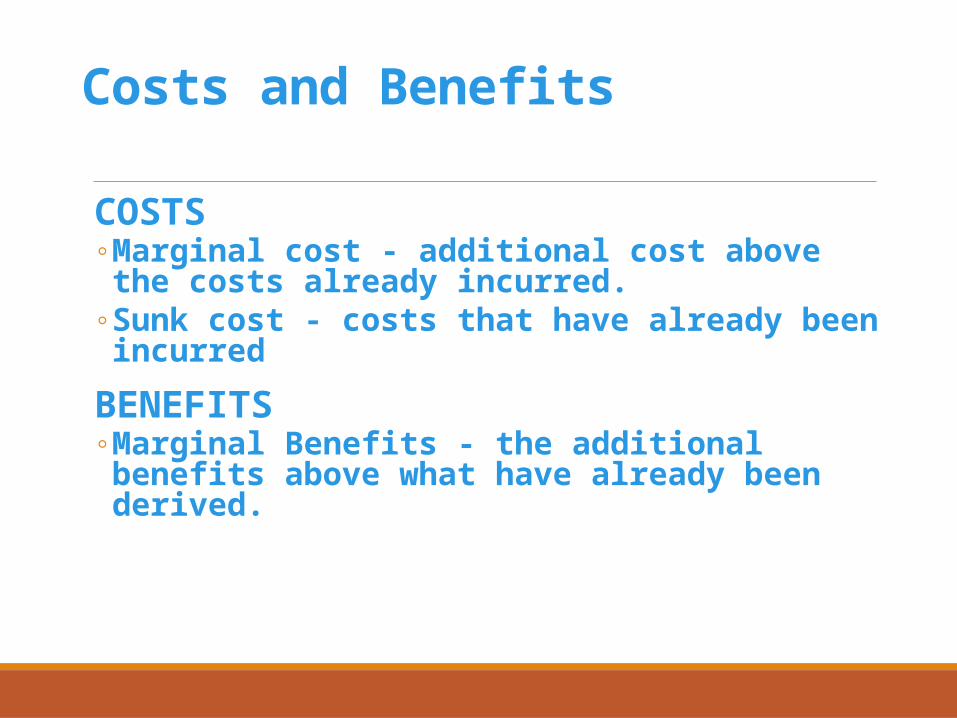
Costs and Benefits
COSTS◦ Marginal cost - additional cost above the costs already
incurred.◦ Sunk cost - costs that have already been incurred
BENEFITS◦ Marginal Benefits - the additional benefits above what
have already been derived.

Economic Decision Rule If the relevant benefits of doing something exceed the relevant costs, do it. If the relevant costs of doing something exceed the relevant benefits, don’t do it.

Voting Behavior(from the work of Deidre McCloskey)
Why do people vote?◦ What are the costs?◦ What are the benefits?
If we only consider standard economics, voting makes little sense. One needs to recognize the importance of non-economic variables.

Opportunity Cost Opportunity Cost - the value of the next best alternative foregone in making a decision. Examples of Opportunity Cost
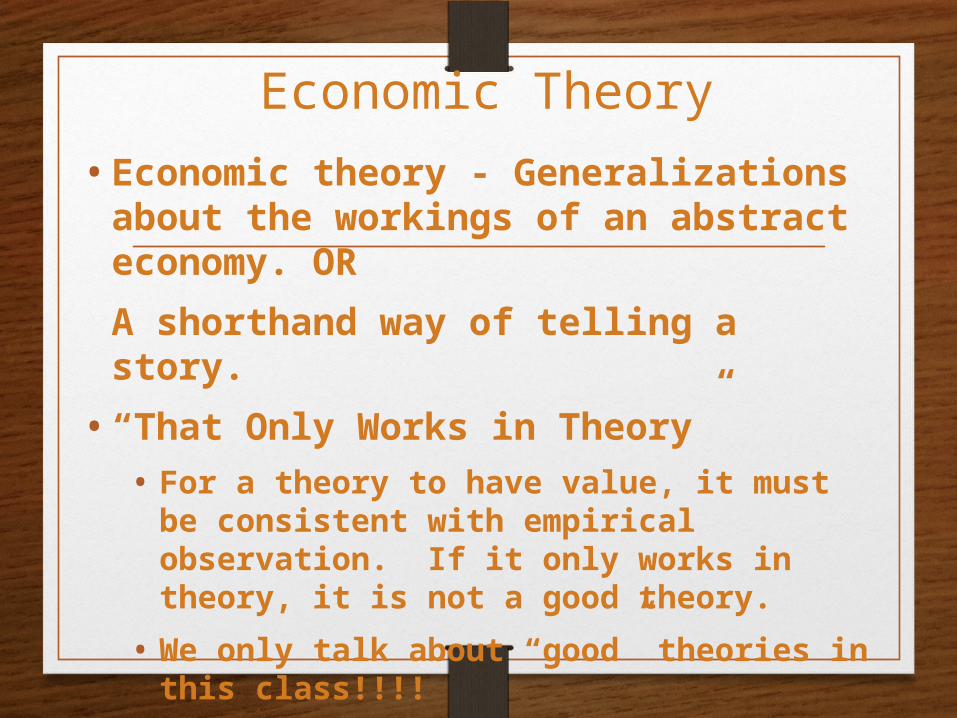
Economic Theory
• Economic theory - Generalizations about the workings of an abstract economy. OR
A shorthand way of telling a story.
• “That Only Works in Theory”• For a theory to have value, it must be
consistent with empirical observation. If it only works in theory, it is not a good theory.
• We only talk about “good” theories in this class!!!!

Models and Principles
• Economic models - A framework that places the generalized insights of the theory in a more specific contextual setting.
• Economic principle - A commonly held economic insight stated as a law or a general assumption.

Positive vs. Normative Economics
• Economic policy - An action (or inaction) taken, usually by government, to influence economic events.
• The work of John Neville Keynes• Positive economics - The study of what is
and how the economy functions.• Normative economics - The study of what
the goals of the economy should be.• Art of economics - the application of the
knowledge learned in positive economics to the achievement of the goals one has determined in normative economics.
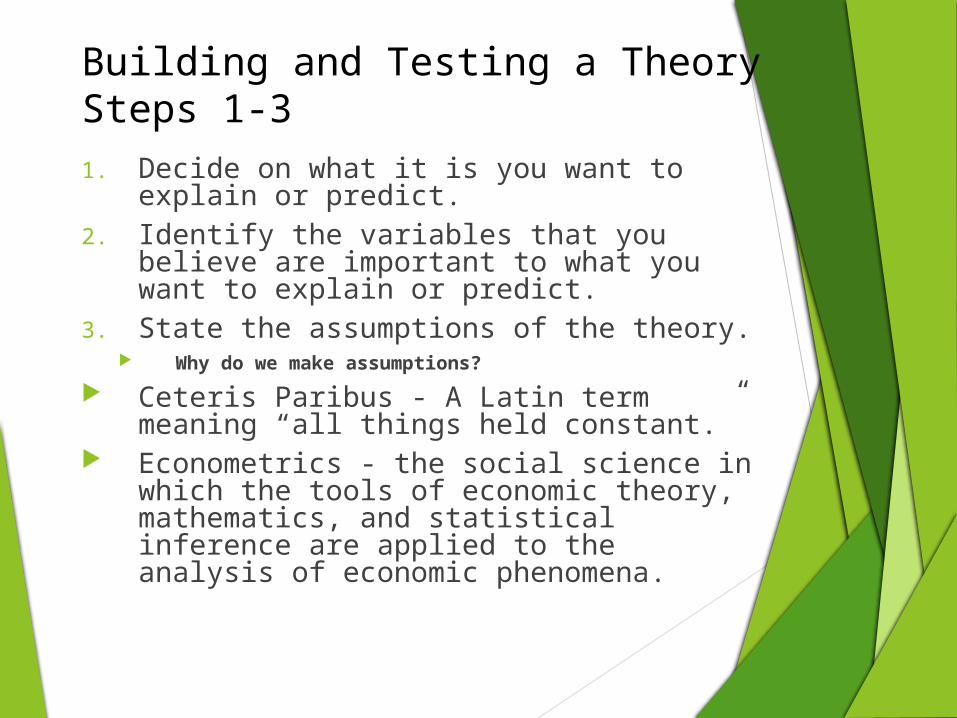
Building and Testing a TheorySteps 1-31. Decide on what it is you want to
explain or predict.2. Identify the variables that you believe
are important to what you want to explain or predict.
3. State the assumptions of the theory. Why do we make assumptions?
Ceteris Paribus - A Latin term meaning “all things held constant.”
Econometrics - the social science in which the tools of economic theory, mathematics, and statistical inference are applied to the analysis of economic phenomena.

Building and Testing a TheorySteps 4-64. State the hypothesis
5. Test the theory by comparing its predictions against real-world events.
6. If the evidence supports the theory, then no further actions is necessary (at the moment!). If the evidence rejects the theory, then
a. conclude the theory is incorrect.
b. conclude the data is inadequate.

Economics and Electing the President

The work of Ray Fair
Ray Fair’s Website: http://fairmodel.econ.yale.edu/
The specific site on presidential elections.
http://fairmodel.econ.yale.edu/vote2012/index2.htm
The review of the 2008 election.
http://fairmodel.econ.yale.edu/vote2008/index2.htm
His model and the data on each election (before 2008)
http://fairmodel.econ.yale.edu/RAYFAIR/PDF/2006CHTM.HTM
Economic Growth and the United States Presidency:Can You Evaluate the Players Without a Scorecard?
David J. BerriDepartment of Applied Economics
California State University – BakersfieldBakersfield, California 93311
James PeachP. O. Box 30001/ MSC 3CQDepartment of Economics
New Mexico State UniversityLas Cruces, NM 88003

Abstract
In several academic papers and a book, Ray Fair (1978, 1996, 2002) has demonstrated a link between the state of the macroeconomy and the outcome of the Presidential Election in the United States. Beginning with the 1916 election, Fair’s model, based on such factors as economic growth, inflation, and incumbency, was able to accurately predict the winner in virtually every election. The purpose of this research is to take the Fair model back to the 19th century. The question we address is as follows: Can a version of Fair’s model accurately predict in an environment where economic data was not made available to the voter?
Louis Bean (1948) How to Predict Elections
“Business depressions played a powerful role in throwing the Republicans out of office in 1874, after 1908, and in 1932, and they had exactly the same influence in ousting Democrats after the panic of 1858 and during the economic setbacks of 1894 and 1920.”
“Harding in 1920, McKinley in 1896, and Cleveland in 1884 were also depression-made presidents. Had the deciding electoral vote been cast for the candidate who had the majority of the popular vote in 1876, Tilden too, would have been a depression-made President.”

The work of Ray Fair
Fair, Ray C. 1978. “The Effect of Economic Events on Votes for President.” The Review of Economics and Statistics (Vol. LX, No. 2):159-173 May 1978.
Fair, Ray C. 1978. “The Effect of Economic Events on Votes for President: 1980 Results.” The Review of Economics and Statistics (Vol. 64, No. 2):322-25 May 1978.
Fair, Ray. C. 1996. “Econometrics and Presidential Elections.” Journal of Economic Perspectives (Vol. 10, No 3):89-102 (Summer 1996).
Fair, Ray C. 2002. “The Effect of Economic Events on Votes for President: 2000 Update.” http://fairmodel.econ.yale.edu/RAYFAIR/PDF/2002DHTM Downloaded Feb 2, 2006.
Fair, Ray C. 2002. Predicting Presidential Elections and other things. Stanford: Stanford Business Books.

A Fair Model
VOTE= a1 + a2GROWTH+ a3INFLATION +
a4PARTY + a5PERSON +
a6DURATION + a7GOODNEWS + ε

Defining the variables employedhttp://fairmodel.econ.yale.edu/RAYFAIR/PDF/2002DHTM.HTM
VOTE = Incumbent share of the two-party presidential vote.
GROWTH = annual growth rate of real per capita GDP in the first three quarters of the election year.
INFLATION = absolute value of the growth rate of the GDP deflator in the first 15 quarters of the administration (annual rate) except for 1920, 1944, and 1948, where the values are zero.

Defining the variables employedhttp://fairmodel.econ.yale.edu/RAYFAIR/PDF/2002DHTM.HTM
PARTY = 1 if Democrats are in power, = -1 if Republicans are in power
PERSON = 1 if the president is running, = 0 otherwise DURATION = 0 if the incumbent party has been in power for one term, 1 if the incumbent party has been in power for two consecutive terms, 1.25 if the incumbent party has been in power for three consecutive terms, 1.50 for four consecutive terms, and so on.
WAR = 1 for the elections of 1920, 1944, and 1948 and 0 otherwise
GOODNEWS = number of quarters in the first 15 quarters of the administration in which the growth rate of real per capita GDP is greater than 3.2 percent at an annual rate except for 1920, 1944, and 1948, where the values are zero.

Table One The Accuracy of the Fair Model
1916-2000
Year Incumbent Party
Candidate Challenger
Actual VOTE received by incumbent
Predicted VOTE received by incumbent Error
Actual Winner
Predicted Winner
1916 Wilson Hughes 51.7 50.9 -0.8 Wilson Wilson 1920 Cox Harding 36.1 39.2 3.1 Harding Harding 1924 Coolidge Davis 58.2 57.3 -1.0 Coolidge Coolidge 1928 Hoover Smith 58.8 57.6 -1.2 Hoover Hoover 1932 Hoover Roosevelt 40.8 38.8 -2.1 Roosevelt Roosevelt 1936 Roosevelt Landon 62.5 63.8 1.4 Roosevelt Roosevelt 1940 Roosevelt Willkie 55.0 55.7 0.7 Roosevelt Roosevelt 1944 Roosevelt Dewey 53.8 52.5 -1.2 Roosevelt Roosevelt 1948 Truman Dewey 52.4 50.5 -1.8 Truman Truman 1952 Stevenson Eisenhower 44.6 44.4 -0.2 Eisenhower Eisenhower 1956 Eisenhower Stevenson 57.8 57.3 -0.5 Eisenhower Eisenhower 1960 Nixon Kennedy 49.9 51.6 1.7 Kennedy Nixon 1964 L. Johnson Goldwater 61.3 61.1 -0.3 L. Johnson L. Johnson 1968 Humphrey Nixon 49.6 50.2 0.6 Nixon Humphrey 1972 Nixon McGovern 61.8 59.4 -2.4 Nixon Nixon 1976 Ford Carter 48.9 48.9 0.0 Carter Carter 1980 Carter Reagan 44.7 45.7 1.0 Reagan Reagan 1984 Reagan Mondale 59.2 62.0 2.9 Reagan Reagan 1988 G. Bush Dukakis 53.9 51.3 -2.6 G. Bush G. Bush 1992 G. Bush Clinton 46.5 51.7 5.1 Clinton G. Bush 1996 Clinton Dole 54.7 53.7 -1.0 Clinton Clinton 2000 Gore G.W. Bush 50.3 48.9 -1.3 G.W. Bush G.W. Bush
Source: http://fairmodel.econ.yale.edu/RAYFAIR/PDF/2002DHTM.HTM

Summarizing Fair: 1916-2000
Only incorrect in three elections: 1960, 1964, 1992.
Average absolute error: 1.5
Results are driven by economic variables with no consideration of a candidate’s appearance, debating talents, advertisements, or general campaign skills.

Taking Fair back to 1824
New measures of growth and inflation are needed.
Louis Johnston and Samuel H. Williamson, "The Annual Real and Nominal GDP for the United States, 1789 - Present." Economic History Services, April 2002, URL : http://www.eh.net/hmit/gdp/
This data has been updated. Updated data did not change our general findings.

The Models to be EstimatedModel 1 Original Fair Model (1916-2000)
Model 2
Fair Model with new measures of GROWTH and INFLATION
(1916-2000)
Model 3
Fair Model with new measures of GROWTH and INFLATION,
no GOODNEWS (1916-2000)
Model 4
Fair Model with new measures of GROWTH and INFLATION,
no GOODNEWS (1916-2004)
Model 5
Fair Model with new measures of GROWTH and INFLATION,
no GOODNEWS (1824-1912)
Model 6
Fair Model with new measures of GROWTH and INFLATION,
no GOODNEWS (1824-2004)
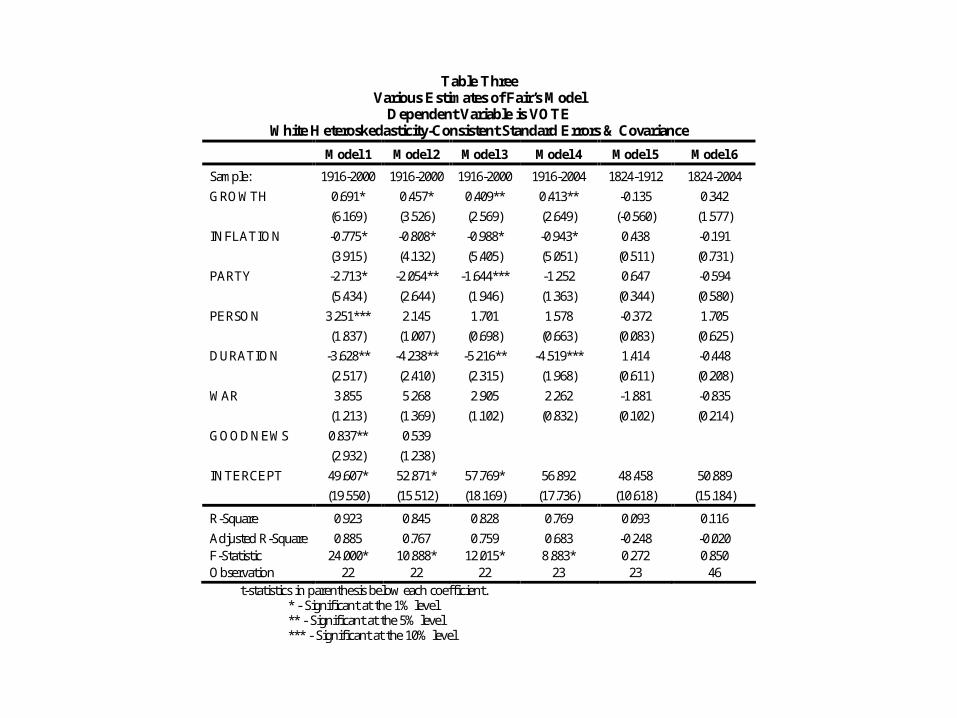
Table Three Various Estimates of Fair’s Model
Dependent Variable is VOTE White Heteroskedasticity-Consistent Standard Errors & Covariance
Model 1 Model 2 Model 3 Model 4 Model 5 Model 6
Sample: 1916-2000 1916-2000 1916-2000 1916-2004 1824-1912 1824-2004
GROWTH 0.691* 0.457* 0.409** 0.413** -0.135 0.342
(6.169) (3.526) (2.569) (2.649) (-0.560) (1.577)
INFLATION -0.775* -0.808* -0.988* -0.943* 0.438 -0.191
(3.915) (4.132) (5.405) (5.051) (0.511) (0.731)
PARTY -2.713* -2.054** -1.644*** -1.252 0.647 -0.594
(5.434) (2.644) (1.946) (1.363) (0.344) (0.580)
PERSON 3.251*** 2.145 1.701 1.578 -0.372 1.705
(1.837) (1.007) (0.698) (0.663) (0.083) (0.625)
DURATION -3.628** -4.238** -5.216** -4.519*** 1.414 -0.448
(2.517) (2.410) (2.315) (1.968) (0.611) (0.208)
WAR 3.855 5.268 2.905 2.262 -1.881 -0.835
(1.213) (1.369) (1.102) (0.832) (0.102) (0.214)
GOODNEWS 0.837** 0.539
(2.932) (1.238)
INTERCEPT 49.607* 52.871* 57.769* 56.892 48.458 50.889
(19.550) (15.512) (18.169) (17.736) (10.618) (15.184)
R-Square 0.923 0.845 0.828 0.769 0.093 0.116
Adjusted R-Square 0.885 0.767 0.759 0.683 -0.248 -0.020 F-Statistic 24.000* 10.888* 12.015* 8.883* 0.272 0.850 Observation 22 22 22 23 23 46
t-statistics in parenthesis below each coefficient. * - Significant at the 1% level ** - Significant at the 5% level *** - Significant at the 10% level

Table Four The Accuracy of the Fair Model
1824-1912 Forecast Based on Model 3
Year Incumbent Party
Candidate Challenger
Actual VOTE received by incumbent
Predicted VOTE received by incumbent Error
Actual Winner
Predicted Winner
1824 Jackson J.Q. Adams 57.2 39.8 17.4 J.Q. Adams* J.Q. Adams 1828 J.Q. Adams Jackson 43.8 56.9 13.1 Jackson J.Q. Adams 1832 Jackson Clay 59.2 58.0 1.2 Jackson Jackson 1836 Van Buren W. Harrison 58.1 43.7 14.4 Van Buren W. Harrison 1840 Van Buren W. Harrison 47.0 51.4 4.4 W. Harrison Van Buren 1844 Clay Polk 49.3 58.6 9.4 Polk Clay 1848 Cass Taylor 47.3 53.5 6.2 Taylor Cass 1852 Scott Pierce 46.3 62.0 15.7 Pierce Scott 1856 Buchanan Fremont 57.8 55.2 2.6 Buchanan Buchanan 1860 Breckinridge Lincoln 31.2 56.4 25.2 Lincoln Breckinridge 1864 Lincoln McClellan 55.0 42.9 12.1 Lincoln McClellan 1868 Grant Seymour 52.7 48.5 4.2 Grant Seymour 1872 Grant Greeley 55.9 55.9 0.0 Grant Grant 1876 Hayes Tilden 48.5 50.3 1.8 Hayes* Hayes 1880 Garfield Hancock 50.0 50.0 0.2 Garfield Hancock 1884 Blaine Cleveland 49.9 45.1 4.8 Cleveland Cleveland 1888 Cleveland B. Harrison 50.4 59.1 8.7 B.Harrison* Cleveland 1892 B. Harrison Cleveland 48.3 61.2 13.0 Cleveland B. Harrison 1896 Bryan McKinley 47.8 53.7 5.9 McKinley Bryan 1900 McKinley Bryan 53.2 59.5 6.3 McKinley McKinley 1904 T. Roosevelt Parker 60.0 49.9 10.1 T. Roosevelt Parker 1908 Taft Bryan 54.5 46.8 7.6 Taft Bryan 1912 Taft/Roosevelt Wilson 54.7 50.6 4.1 Wilson* Taft-Roosevelt
* - did not win popular vote

Why does the Fair model fair poorly before 1916?
Economic data did not exist.
U.S. economy not integrated.
Federal government was not held responsible for the macroeconomy.
Non-economic issues were more important in the 19th century.

Econometrics and Presidential Elections
Larry M. Bartels

Overview of the Fair ModelOne of the most interesting aspects of Fair's
essay is the unusually frank and detailed description it provides of the enormous amount of exploratory research underlying published analyses of aggregate election outcomes. What is the relevant sample period? Which economic variables matter? Measured over what time span? What does one do with third party votes, war years, or an unelected incumbent? In fewer than a dozen pages, Fair raises and resolves many such questions, as any data analyst must. In the process, he makes clear how much of what Leamer (1978) has referred to as “specification uncertainty” plagues this (or any other) statistical analysis of presidential election outcomes.

Choosing a Model ….(Fair’s) choice of model specification seems to have been guided by goodness-of-fit considerations rather than by a priori political or economic considerations. His data set begins in 1916 because “some experimentation . . . using observations prior to 1916" produced results that “were not as good.” Gerald Ford is sometimes counted as an incumbent and sometimes not, depending upon which treatment “improves the fit of the equation.” Revised economic data produced significant changes in several key coefficients, prompting renewed searching “to see which set of economic variables led to the best fit,” and so on.

What have we learned? What most electoral scholars really care about is what the
relationship between economic conditions and election outcomes tells us about voting behavior and democratic accountability.
On that score, what have we learned, and what have we yet to learn?
The clearest and most significant implication of aggregate election analyses is that objective economic conditions -- not clever television ads, debate performances, or the other ephemera of day-to-day campaigning -- are the single most important influence upon an incumbent president's prospects for reelection.
Despite a good deal of uncertainty regarding the exact form of the relationship, the relevant time horizon, and the relative importance of specific economic indicators, there can be no doubt that presidential elections are, in significant part, referenda on the state of the economy.

My own thoughts on why the economy drives elections……
Three voters in the election… Republicans (vote Republican) Democrates (vote Democrat) Independents
The only free agents are independents. These are voters who care so little, they don’t join a party. And these are the voters that matter.
Why the economy? It is the one issue that matters to the independent.

Politics and football…Some football coaches believe the run sets up the pass. Others think the pass sets up the run. Fans, though, don’t care. You win, you keep your job. You lose, you lose your job.Applied to politics… some people believe in smaller government and low taxes. Others believe in more government to solve problems. Independents, though, don’t care. The economy does well, you keep your job. If not, your fired. What the politician believes is simply not relevant.