why house price indexes differ: measurement and · pdf filewhy house price indexes differ:...
TRANSCRIPT

Why House Price Indexes Differ: Measurement and Analysis
Mick Silver
WP/12/125

© 2012 International Monetary Fund WP/12/125
IMF Working Paper
Statistics Department
Why House Price Indexes Differ: Measurement and Analysis
Prepared by Mick Silver1
Authorized for distribution by Kimberly Zieschang
May 2012
Abstract
A key element in the build-up to the global recession and subsequently was the movement in house price indexes (HPIs). These indexes are particularly prone to methodological and coverage differences which can undermine both within-country and cross-country economic analysis. The paper outlines key measurement issues and reports on empirical work using an international panel data set that (i) considers whether differences in HPI measurement matter and, if so, in what way, and (ii) revisits the measurement of global house price inflation and the modeling of the determinants of house price inflation using HPIs corrected for differences in measurement practice.
JEL Classification Numbers: C43, E30, E31, R31.
Keywords: House price indexes; Housing inflation; Global house price inflation.
Author’s E-Mail Address: [email protected]
1 Constructive comments were received at presentations of earlier versions of this paper, including the NBER Summer Institute, 2011. I am particularly grateful to Badi Baltagi (New York University), Erwin Diewert (University of British Columbia), Robert Heath (IMF), Deniz Igan (IMF), Marshall Reinsdorf (Bureau of Economic Analysis), and Kim Zieschang (IMF) for helpful comments. The usual disclaimers apply.
This Working Paper should not be reported as representing the views of the IMF. The views expressed in this Working Paper are those of the author(s) and do not necessarily represent those of the IMF or IMF policy. Working Papers describe research in progress by the author(s) and are published to elicit comments and to further debate.

2
CONTENTS PAGE
I. Introduction ............................................................................................................................3
II. The Potential for Mismeasurement and International Guidelines .........................................4
III. Does Measurement Matter? International Evidence ............................................................5 A. The HPI Series ..........................................................................................................5 B. Coverage and Measurement of Explanatory Variables .............................................6 C. The Results ................................................................................................................7
IV. Measurement of HPIs: Some Analytical Work ...................................................................9 A. Measures of Global House Price Inflation ................................................................9 B. Modelling House Price Changes Using Cross-country/Pooled Data ......................11
V. Conclusions .........................................................................................................................13 Tables and Figures 15–22
Annex 1. Issues in HPI Methodology ......................................................................................23 A. Stocks or Transactions ............................................................................................23 B. Constant-quality Comparisons ................................................................................23 C. Coverage..................................................................................................................25 D. Prices: Source Data, Valuation, and Timelines .......................................................26 E. Weights: Stocks or Transactions and Values or Quantities .....................................26
Annex 2. Data ..........................................................................................................................28 References ................................................................................................................................33

3
I. INTRODUCTION
The October 2009 Report to the G-20 Finance Ministers and Central Bank Governors on the Financial Crisis and Information Gaps2 described data on dwellings and their associated price changes as critical ingredients for financial stability policy analysis. Of the 46 systemic banking crises for which data are available, more than two-thirds were preceded by house price boom-bust patterns (Claessens et al., 2010).3 An understanding of deviations from equilibrium prices in housing markets requires reliable and, for international comparisons, consistently-measured, house price indexes (HPIs).4 Yet HPIs are particularly prone to methodological differences, which can undermine both within-country and cross-country analysis. It is a difficult but important area. There are empirical questions as to first, whether measurement differences matter and, if so, how and to what extent, and second, how such differences impact on analytical work including the measurement of global house price indexes and the modeling of HPI changes. A brief outline of measurement problems and practices is given in section II with more detail in Annex 1. Section II also notes a number of initiatives to harmonize HPI methodology. The empirical analysis in section III is based on a panel of five years of quarterly data for over 150 HPIs from nearly 25 countries; all the series differ (at least within countries) with regard to their methodological features. A fixed effects (for country) model with HPI changes regressed on measurement characteristics identify the extent to which measurement differences matter and the salient measurement features.
Given the importance of measurement in explaining HPI variation, as established in section III, we determine the effect measurement has on the economic analysis of house price inflation. In section IV, national measurement-adjusted and unadjusted HPIs are estimated to first, compile indicators of global house price inflation, and second, in an illustrative economic model of the determinants of house price inflation. The results using measurement-adjusted and unadjusted HPIs are compared.
2 The initiative was taken up by the International Monetary Fund (IMF) Statistics Department (STA) and the Financial Stability Board (FSB). See: http://www.imf.org/external/np/seminars/eng/2010/infogaps/index.htm. 3 Similarly, 35 out of 51 house price boom-bust episodes were followed by a crisis. The corresponding effect of stock market boom-busts was much smaller. Claessens, Kose, and Terrones (2008, page 25) found that “..recessions associated with house price busts are on average over a quarter longer than those without busts. Moreover, output declines (and corresponding cumulative losses) are typically much larger in recessions with busts, 2.2 (3.7) percent versus 1.5 (2.3) percent in those without busts. These sizeable differences also extend to the other macroeconomic variables, including consumption, investment and the unemployment rate.” Reinhart and Rogoff (2009) found the six major banking crises in advanced countries since the mid–1970s were all associated with a housing bust. 4 The term “house price indexes” includes apartments and is interchangeable with residential property price indexes.
4
II. THE POTENTIAL FOR MISMEASUREMENT AND INTERNATIONAL GUIDELINES
House price transactions are infrequent and apply to a highly heterogeneous item. Comparing the prices of like with like on a regular basis is highly problematic. Moreover, secondary source data are generally used for HPIs, and their nature depends on the institutional arrangements in a country for selling, financing, taxing, and registering the sale of a residential property. This gives rise to the potential for quite significant methodological and coverage differences in HPI measurement, details of which are given in Annex 1. Key HPI measurement variables include the: (i) use of stocks or flows (transactions) for weights; (ii) use of values or quantities for weights; (iii) use of fixed or chained weights; (iv) the method of enabling constant quality measures (repeat sales pricing, hedonic approach, mix-adjustment through stratification, sale price appraisal ratio (SPAR); (v) geographical coverage (capital city, urban etc.), (vi) coverage by type of housing (single family house, apartment etc.); (vii) vintage covered, new or existing property; and (viii) valuation method (and source data) of prices (asking, transaction, appraisal etc.).
For many countries more than one national index is available each using quite different methods and having different coverage. Silver (2011) illustrates the substantial within country variation of national HPIs by different compiling organizations for three case studies, Russia, the United Kingdom, and the United States—see also Careless (2011). There are at present, no internationally-accepted guidelines on compiling HPIs. However, a recent initiative to produce a Handbook on House Price Indices5 is near completion. Experimental results have been developed by Eurostat (2012) on the development of comparable HPIs for owner-occupied housing (OOH) in the framework of the Harmonized Indexes of Consumer Prices (HICP) for countries in the euro area and at the European Union level.6 A common set of accepted methods and approaches in this regard is described in a technical manual published by Eurostat (2011). The application of such guidelines is not be straightforward given the dependency of HPIs on secondary source data. Further, HPIs are often published by private organizations such as realtors and lenders and also serve to advertise their business. Private organizations are
5 The U.N. Inter-Secretariat Working Group on Price Statistics (IWGPS) is responsible for developing internationally-accepted guidelines on price indexes. Under its aegis, Eurostat is acting as the lead agency for developing a Handbook on House Price Indexes and in 2009 commissioned its writing, expected to be completed in mid-2012. The current draft is available at: http://epp.eurostat.ec.europa.eu/portal/page/portal/hicp/methodology/owner_occupied_housing_hpi/HPI_handbook.
6 Eurostat has published, since February 2012, a Macroeconomic Imbalance Procedure (MIP) Scoreboard for the surveillance of macroeconomic imbalances. The scoreboard consists of a set of ten indicators that include house price indices (HPIs) taken from the experimental HPI for which data are publicly available in the Eurostat HPI release. Missing experimental HPIs have also been included in the Scoreboard based on other non-harmonised sources. Further information from: http://epp.eurostat.ec.europa.eu/portal/page/portal/hicp/methodology/owner_occupied_housing_hpi/experimental_house_price_indices.

5
unlikely to abandon their indexes if their source data and methods do not meet newly developed international guidelines. To better understand the effect of measurement on HPIs, it natural to consider a data set of many countries each with one or more HPI with differing coverage and/or utilizing different methods. The panel structure of the data would have measures of HPI inflation as cross sections with different coverage and methods as explanatory variables. Fixed effect controls would be by country.7
III. DOES MEASUREMENT MATTER? INTERNATIONAL EVIDENCE
There is evidence of differential HPI growth rates between countries.8 But there is also a variety of quite dispirit methods employed between countries for calculating HPIs. In this section we employ a panel regression that attempts to distinguish measurement effects from house price inflation.
A. The HPI Series
The study is based on a panel of about 157 quarterly house price indexes (HPIs) from 24 countries over 2005:Q1 to 2010:Q1. Details of the HPI series are given in Annex 2. Log rates of changes in quarterly HPIs are defined below for HPI series i = 1,…,N in country c = 1,…,C over t = 1,…,T quarters where N is the number of HPIs in country c, given in Annex 2 alongside each country name, and .1
C
ccN N
.
,, 1
,
lnti ct
i c ti c
hpidhpi
hpi
(1)
Our concern is explaining variation in HPI rates, not levels. For 2005:Q1 to 2010:Q1 the Levin, Lin, and Chu (2002) t statistic of -30.2116 rejected the null hypothesis that each
7 An alternative approach is retrospective country studies that use different HPI methodologies. These include, for Ottawa, Canada: Li, Prud’homme, and Yu (2006); Sydney, Australia: Hill and Melser (2008); the USA: Leventis (2008); and Tokyo, Japan: Shimizu, Nishimuraand, and Watanabe (2009). Such studies provide valuable insights into the empirical effect of methodological differences, though are usually undertaken on constrained data sets, for example to a single city, and are for series not generated in real time. This study benefits from using cross-country information and examines the measurement issues concerning real-time HPIs. 8 Hilbers et al. (2008) demonstrated the variability in European country HPI growth rates by distinguishing between European countries according to their HPI average (real) growth rate between 1985 and 2005-07. House prices in Spain, Belgium, Ireland, the United Kingdom, the Netherlands, and France more than doubled; the Nordic countries, Italy and Greece increased by about 50–100 percent; and Germany, Austria, Switzerland, and Portugal remained largely flat or fell over the two decades.

6
individual series had a common integrated time series versus the alternative hypothesis that all individuals series are stationary (p-value=0.0000).9
B. Coverage and Measurement of Explanatory Variables
Explanatory measurement variables are classified into those based on data coverage (vintage, geographical classification, type of dwelling) and those based on methodology. These measurement variables include:10 Based on coverage:
o Vintage (benchmarked on both new and existing dwellings).
New (newly constructed dwelling)=1 (0 otherwise); Xsting (existing dwelling) =1(0 otherwise).
o Geographical coverage (benchmarked on national coverage).
Capital (major) city=1 (0 otherwise); Big cities=1 (0 otherwise); Urban areas=1 (0 otherwise); Notcapital=1 (0 otherwise); Rural=1 (0 otherwise).
o Type of dwelling (benchmarked on both apartments and single-family homes).
Apartment=1 (0 otherwise); Single family home (Sfh)=1 (0 otherwise).
Based on method:
o Quality-mix adjustment (benchmarked on price per dwelling, no adjustment).
Hedonic regression-based=1 (0 otherwise); Repeat sales=1 (0 otherwise); SPAR=1 (0 otherwise); MixAdjust=1 (0 otherwise); SqMeter=1 (0 otherwise)
o Type of price (benchmarked on transaction price).
Asking price =1 (0 otherwise); Tax/mortgage Appraisal price=1 (0 otherwise).
o Weights: as a flow of sales transactions or stock (benchmarked on sales=0). Wstock=1 (0 otherwise).
o Weights: quantity or value or other shares (benchmarked on value=0).
Wquantity=1 (0 otherwise); Wsqmeter=1(0 otherwise); Wpopulation=1(0 otherwise); Wprice in base-period =1(0 otherwise).
o Weights: fixed or chained/regularly-updated or unweighted (benchmarked on fixed=0).
9The null hypothesis of unit roots for this pooled data set was also rejected when tested using the Im, Pesaran and Shin W-statistic of 46.135 (p-value=0.0000), the ADF Fisher Chi-square statistic of 2,505.39, (p-value=0.0000), and the Phillips and Perron Fisher Chi-square statistic of 3,525.37 (p-value=0.0000). 10 Information on the characteristics of the house price indexes was based on the methodological notes attached to the source data, survey papers, and, often, extensive email correspondence with the providing institutions.

7
Wchain=1 (0 otherwise); Unweighted=1 (0 otherwise). o Weights: rolling/average or annual (benchmarked on annual=0). Wrolling=1 (0 otherwise). o Aggregation at higher level: geometric or arithmetic (benchmarked on arithmetic). Geometric=1(0 otherwise).
Interaction variables were included, but with little success. The categorization was of course not always straightforward. For example, for the Austrian HPIs, the Immobilienpreisindex, one third of the data are transaction prices and two thirds are quotation prices: the index was characterized as being based on the latter.
C. The Results
The regression relates inflation for series i=1,….,I, in periods t=1,….,T to the k=1, ,K coverage (COV) and l=1,….L methodological (METH) explanatory variables outlined in
section B above, fixed time, ,tiD effects that takes a value of 1 if the series is for period t,
and 0 otherwise, and fixed country, ,i cD , effects that takes a value of 1 if the series is for
country c =1,…,C, and 0 otherwise. The regression model is:
, ,1 1 1 1
K L T Ct t t t t t ti k i k l i l i c i i
k l t c
dhpi COV METH D D
……………… …….(2)
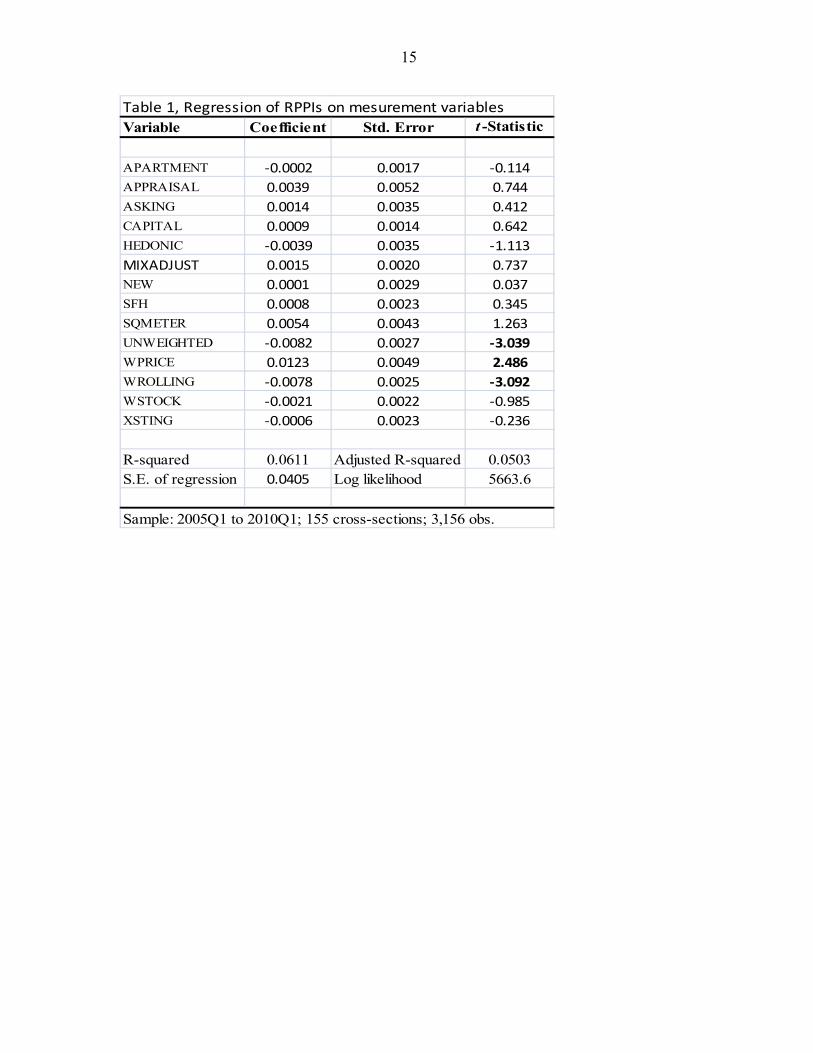
The estimator is a cross-section SUR specification to allow for conditional correlation between the contemporaneous residuals for cross-sections (but restricts residuals in different periods to be uncorrelated), and to allow for cross-sectional heteroskedasticity (Beck and Katz (1995). The results from a specification that includes fixed country effects and a parsimonious selection of explanatory variables are presented in Table 1. Though not given here for brevity,11 about one-third of the 23 fixed country dummy variables were statistically significant at the 5 percent level. Their coefficients provide estimates of the extent to which country house price inflation rates differ, conditioned on the HPI’s differences in measurement.
Of note is the low2R of 0.0503 when measurement variables and fixed country effects are
included. Only three measurement variables are statistically significant at a 5 percent level. Yet when the explanatory measurement variables were tested as being redundant against a specification that included measurement variables and fixed-country effects, the null hypothesis of redundant variables could not be rejected at a 1 percent level (LLR=16.81, p-value=0.665). Measurement, at least in this representation, did not seem to matter.
11 Results are available from the author.

8
The restrictions that the coefficients are constant over time for the model in Table 1 was
relaxed for the parsimonious set of explanatory measurement variables—t
i i and t
i i in equation (2) above to include interaction terms between each such variable and time.12 The specification also included fixed-time effects and fixed country effects. The methodological explanatory variables were categorized, as noted in section IIIB above, as those based on coverage and method. The results for moving window regressions are given in Table 2.
First, the regressions have substantial explanatory power,2R at about 0.45 in mid-2009, a
result especially notable given only fixed effects, and measurement variables were included. There were no structural explanatory variables to explain house price inflation by means of supply and demand (and financing) of a country’s housing market as in, for example, Muellbauer and Murphy (2008).13 From the results of Table 2, column 2, measurement
matters and, in particular, 2R increases over the period of recession, when it really matters.
Second, Table 2 shows the explanatory power of the model is not substantively driven by the fixed time and cou effects. On excluding the country- and time-fixed effects, Table 2 column 4, the effect of the measurement variables alone, while diminished, accounted during the recession for about a quarter of the variation in house price inflation rates.
Third, is the question: given that measurement matters, what matters most, coverage variables or methodological variables? Table 2, columns 5 and 6 find that dropping either set leaves the other with substantial explanatory power, though “method” is for the large part slightly more important than “coverage.”14
Table 3 provides results for an illustrative regression which allows measurement variables to
change over time, for brevity, over the two quarters 2009Q1 to 2009:Q2. 2
0.592R with
12 Likelihood-ratio tests were used to test the null hypotheses of inclusion in the model as time-varying coefficients against fixed (over time) coefficients for each explanatory variable. Time-varying coefficients were included for apartment, appraisal, asking, capital, hedonic, mixadjust, new, sfh, unweighted, wprice, wrolling and wstock. The null hypothesis of redundant time-varying coefficients variables in the unrestricted model was rejected for each of the above variables at the 5 percent level and for asking, capital and sqmeter at the 10 percent (p-values = 0.067, 0.0636, and 0.0667 respectively). The selection was based on the results from a general model for the whole period rather than optimal parsimonious representations for the sub-periods of moving window regressions.
13 The paper finds the main drivers of house prices to include income, the housing stock, demography, credit availability, interest rates, and lagged appreciation. 14 There is likely to be some intercorrelations between the variable sets For example, in the United States, the repeat purchase method is used to hold constant the quality mix of transactions for existing houses, but for new houses sold only once, the hedonic method is used, since new houses (coverage) will generally have only one transaction (method). More generally, Land Registry data based on transaction prices often has a large coverage, but limited characteristic variables, arguing against the use of hedonic regressions, while the opposite applies to realtor data based on asking prices.

9
15 of the 26 (13 in two periods) variables statistically significant at the 5 percent level—a major improvement on the constrained model of Table 1. The impact of the variables is quite volatile over time; a variable being significant in one quarter is no guarantee of it being so in the next.
Figures 1–6 illustrate the nature, magnitude and volatility of individual regression coefficients over time for six illustrative explanatory variables: the coverage of existing properties (as against new and existing); use of stratified mix-adjustment (as against price per dwelling); hedonic regressions (as against price per dwelling); price per sq. meter (as against per dwelling); unweighted or equal weights (as against value shares), appraisal (as against transaction) price data. A lighter-fill marker in the Figures indicates that the coefficient’s value is statistically significant at a 5 percent level. The general pattern is one of a substantively different (lower) effect of these variables on measured inflation during the recession compared with prior to it. There is, in some cases, a marked volatility to the effects of these variables, as illustrated in Figure 6 for the use of appraisal prices as against transaction prices.
Having shown that measurement issues matter when comparing HPIs, and that they matter particularly during the recession—when it matters—we turn to a consideration of the impact of these findings on some macroeconomic analytical work.
IV. MEASUREMENT OF HPIS: SOME ANALYTICAL WORK
Much analysis of the impact of house price inflation on the recession uses cross-country comparisons or regional aggregates. The concern here is with the sensitivity of such analysis to measurement issues.
A. Measures of Global House Price Inflation
Often global/regional house price inflation is measured using averages of selected country HPIs, for example, IMF (2011)—see also Loungani (2012); Girouard (2006) and OECD-published series; Eurostat (2012); and the European Central Bank (ECB) (2012). 15
Figure 7 provides a similar such measure of average house price inflation for 21 countries,16 but conditioned on differences in measurement practices. Country-specific house price indexes are estimated from the time-varying country effects in a regression that also includes measurement variables. The regression allows the estimate of each country’s inflation to vary 15 Eurostat aggregates are for the euro area and for the European Union 27. The euro area aggregate is composed of Belgium, Germany, Estonia (from 2011Q1), Ireland, Greece, Spain, France, Italy, Cyprus, Luxembourg, Malta, the Netherlands, Austria, Portugal, Slovenia, Slovakia and Finland. The EU 27 aggregate is composed of the euro area aggregate plus Bulgaria, Czech Republic, Denmark, Latvia, Lithuania, Hungary, Poland, Romania, Sweden and United Kingdom. ECB data are for the Euro areas (fixed) 16 and 17 and for the European Union.
16 The Czech Republic, New Zealand, and Slovak Republic were excluded since they contributed little to the estimates, given the degrees of freedom used up by their inclusion.

10
over time, via separate country-time interaction dummy variables,t
c c in equation (2).17
The resulting estimates of tc were, for the large part (about 75 percent of the 441
estimates—21 countries by 21 quarterly changes), statistically significant at a 5 percent level. The estimates of individual HPIs for each country, adjusted in the regression for measurement differences, were then averaged using as weights, in a chained Laspeyres formulation, their country’s share of gross domestic product (GDP) based on purchasing-power-parity (PPP).18 Given that measurement matters, the resulting measure shows global house price inflation having abstracted from it country differences in measurement. An unadjusted (for measurement differences) global inflation measure was derived in a similar manner, but the measurement-related variables were excluded from the regression.
Measurement-adjusted and unadjusted global inflation in Figure 7 track each other closely prior to the recession, but then substantially depart during it. Their close tracking of each other prior to the recession is expected since we have established in the previous section that measurement then had little effect on HPI changes. However, the turning points for the measurement-adjusted measure is later (2008:Q3 against 2008:Q2) and the fall very much deeper than the unadjusted measure (2008:Q4 -0.036 against -0.020, that is, a 3.6 compared with 2.0 percent quarter-on-quarter fall). The evidence is that unadjusted global inflation rates were substantially over-estimated during this time of severe recessions.
Insight into the difference between the two measures can be considered in terms of omitted (measurement) variable bias. Two factors underlie such bias: (i) the omitted measurement variable must be a determinant of the dependent variable (i.e., its true regression coefficient is not zero); and (ii) the omitted variable must be correlated with one or more of the included independent variables. As regards (i), we have demonstrated in the previous section that the explanatory power of the measurement variables increased with the onset of the recession. As regards (ii), there is also a relationship between the measurement variables and HPI changes, as apparent from the previous section. The direction and magnitude of bias is pronounced. It
17 We follow Kennedy (1981) and use as the estimate of the proportional impact of the period t time dummy for country c, in this semi-logarithmic regression, the consistent (and almost unbiased) approximation:
ˆ ˆexp exp( ( ) / 2)t tc cV
-1 where ˆtc is the OLS estimator of t
c c in equation (2) above and ˆ( )tcV is its
estimated variance. The approximation is shown by Van Garderen and Shah (2002) and Giles (2011) to be extremely accurate, even for quite small samples. 18 For example, 2004 country GDP-PPP shares are used to weight HPI levels for 2005: Q1, Q2, Q3, and Q4; 2005 country GDP-PPP shares are used to weight HPI levels for 2006: Q1, Q2, Q3, and Q4, and so forth. The 2005, 2006 etc. quarterly series are combined (chained) by successive multiplication to form the overall series. An alternative approach is to include fixed time-effects, not specific to any country. The implicit weights would be the number of series in each country (Kennedy, 1986), something that is difficult to justify. Diewert (2005), in a quite different context, proposed weighting the series in a country-product-dummy regression using a weighted least squares estimator. One problem with this approach here is that weights have been already been introduced here to correct for heteroskedasticity—see also Silver (2002).

11
arises out of the phenomena of falling HPIs combined with negative relationships between HPIs and measurement variables, as apparent from Figures 1-6.19
B. Modelling House Price Changes Using Cross-country/Pooled Data
There is naturally much concern in the literature with the relationship between (real) house price booms and banking busts including Igan and Loungani (2012), Crowe et al. (2011); Claessens et al. (2010) IMF (2008, 2010, and 2011), and Reinhart and Rogoff (2008). Empirical work is often based on a sample of countries20 and includes analysis of the cross-country coincidence of real house price index changes, the magnitude, duration, and characteristics of house price cycles, and cross-country relationship between HPI changes and those of other macroeconomic and household financial variables. Implicit in such analysis is the assumption that the measurement-related differences in house price indexes between countries are not of a nature/sufficient magnitude to adversely affect the results. We take (an earlier version of) the model in Igan and Loungani (2012) (hereafter IL) to illustrate the impact of measurement differences on such analytical work. We stress our and their estimates are not directly comparable. Their estimates are from a regression using (unbalanced) pooled quarterly HPIs from 17 countries over 1970Q1 to 2010Q1. This contrasts with our a shorter period of 2005:Q1 to 2010Q1 and use of a panel data set of about 150 HPI series over a similar, but extended, set of 21 countries. Country house price inflation for our work is estimated using (441 (21 countries by 21 quarterly changes) coefficients on
country-time interaction dummy variables,t
c c in equation (2) from a pooled regression that includes measurement variables, and time-varying country effects. However, we employ the same estimator (OLS with robust standard errors), variable list, and dynamics used by IL. Our comparators are between their model but estimates with our measurement adjusted and unadjusted HPIs. Table 4 column 1 provides from the results by IL from their pooled regression—further details and rationale for their model are given in pages 14–20 of their paper. Quite similar results are found from our analysis given in columns 2 and 3 of Table 4 with the expected signs on the estimated coefficients. Given the quite major differences in the data sets used here and by IL, this study gives further credence to their work. Affordability is not
19 More formally, the bias can be considered as omitted (measurement) variable bias . Our global HPIs are built up from the estimated coefficients on the dummy variables for time. Omitted (measurement) variable bias is given by (i) the coefficient on the excluded (measurement) variables—measurement must matter for them to diverge—multiplied by (ii) the coefficients of the included explanatory (dummy time) variables taken from auxiliary regressions of the omitted (measurement) explanatory variables on the remaining included explanatory variables—measurement must be correlated. For the measurement-adjusted index to exceed the unadjusted index, as in Figure 7, the signs on the time dummy variable and the coefficient from the auxiliary regression must be the same. HPI changes are negative for the recession and parameter estimates of measurement on HPI changes, albeit not from an auxiliary regression, in Figures 1–6 also tend to be negative in the recession.
20 Work has also been undertaken for states within countries, for example Igan and Kang (2011) for within Korea and the United States.

12
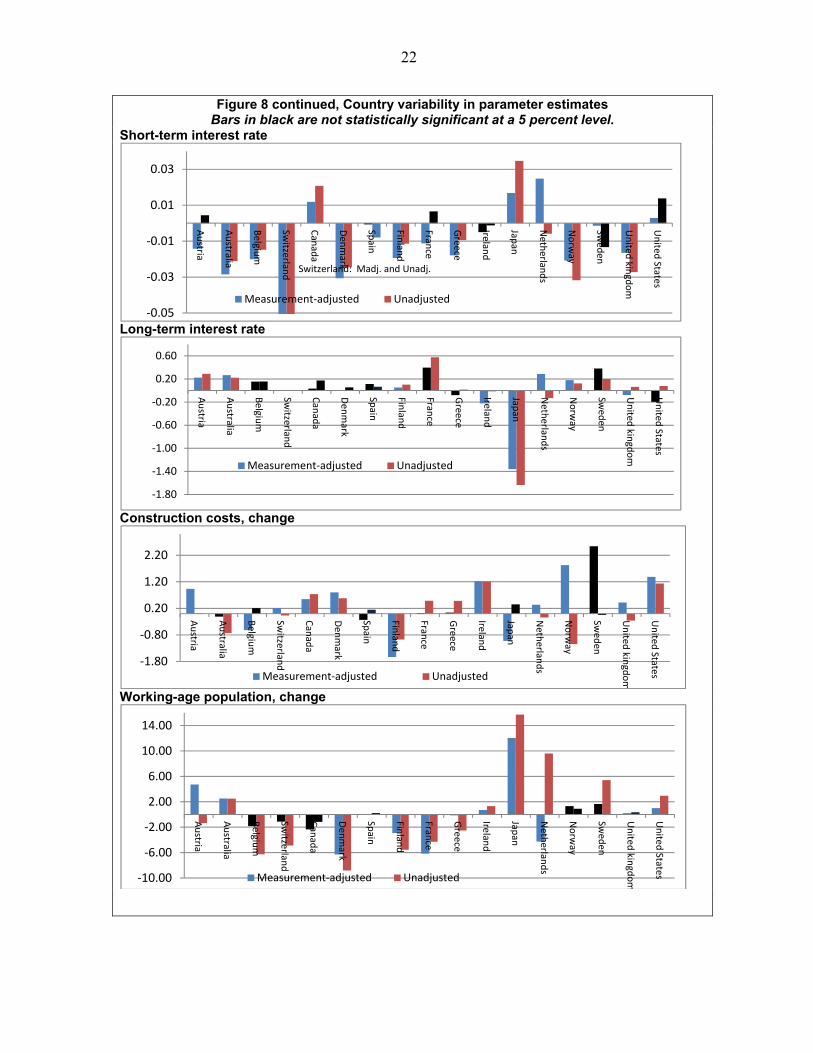
statistically significant at a 5 percent level, but becomes so (columns 4 and 5) when its square is dropped.21 The measurement–adjusted (MAdj.) estimates in columns 2 and 4 improve on the unadjusted ones in columns 3 and 5. Table 4 shows both stock price changes and long-term interest rates have no (statistically significant at a 5 percent level) affect on HPI changes both for the IL estimates (column 1) and unadjusted estimates (columns 3 and 5), but do so with the appropriate sign for the measurement-adjusted estimates (columns 2 and 4).22 For some cases, parameter estimates for MAdj. price changes have larger falls and smaller increases than their unadjusted counterparts. For example, MAdj. and unadjusted house price inflation are estimated to fall by 8.5 and 7.7 percent respectively as (lagged) affordability increases by 1 percent, to increase by 0.40 and 0.52 percent respectively as the change in income per capita increases by 1 percent, and to increase by 0.156 and 0.186 percent respectively as the change in credit increases by 1 percent. Evaluating the MAdj. and unadjusted models in terms of relative explanatory power is not straightforward. While the R-squared for the different regressions differ, this is not a valid basis for comparison since each regression explains variation in a different variable. An alternative measure is the Chi-squared statistic for a redundant country fixed-effects test. Such effects should be smaller for the measurement-adjusted regression than the unadjusted one, if the measurement variables are doing their work. This can be seen to be the case from Table 4; the Chi-squared statistics for the MAdj. regression model are 48.9 and 46.6 (columns 2 and 4) compared with 60.7 and 59.1 (columns 3 and 5) for the respective unadjusted estimates. Thus while the parameter estimates remain relatively robust to measurement issues, the regressions, and policy implications thereof, do benefit from their inclusion. One issue of interest to this study, and also cited and explored by IL, is the cross-country variability in the parameter estimates. In Figure 8 we show the result of relaxing the restriction on the 8 estimated parameters to be constant across the 17 countries, for both measurement-adjusted and unadjusted HPIs. The individual results are for the large part—over 70 percent of the 272 estimates—statistically significant at a 5 percent level. Of note is that while stock price changes and long-term interest rates were not statistically significant when related to the unadjusted measure of housing inflation in the restricted model, Table 4, these country-specific estimates were found to be generally statistically significant when allowed to vary across countries, Figure 8. The nature and extent of the country effect
21 Excluded from Table 4 are the country effects (available for the authors) required by our model given that more than one series is used for each country. F-tests on the redundancy of these country effects found the null hypothesis of no such effects to be rejected at a 1 percent level (F=3.735 and 2.887 respectively for the measurement–adjusted and unadjusted estimates).
22 The coefficient for stock prices in column (4) denoted as statistically significant at a 10 percent level was in fact a borderline p-value of 0.1056. We used a (White) period heteroskedasticity adjustment to the standard errors. Had diagonal or cross-sectional one been applied the p-value would have been 0.017 and 0.069 respectively, compared with p-values of 0.2076 and 0.1884 for the unadjusted estimates.

13
differed across series. In some cases, stock prices, affordability, and long-term interest rates, there is evidence of larger falls when measurement-adjusted HPIs are used, while in others the impact of measurement-adjustment is mixed. The disparity between the estimated parameters arising from using measurement-adjusted and unadjusted HPIs, as well as the magnitude of their effects, can be quite marked in some countries, including Japan, Netherlands, Switzerland, the United Kingdom and the United States.
V. CONCLUSIONS
The paper is motivated by the wide variation in the form HPIs can take both with respect to coverage and method, Section II and Annex I. As noted in Section II, HPIs have been identified as a key data gap by G-20 with current initiatives to ameliorate such differences being undertaken by the Bank of International Settlements, Financial Stability Board, IMF, Eurostat, the European Central Bank, and the (United Nations) Inter-Secretariat Working Group on Price Statistics. Using three country case studies, Silver (2011) identified substantial differences in measured national house price inflation between different indexes within a country. This paper provides an extensive and formal analysis of this measurement problem involving panel data from 24 countries and 153 HPIs over the period 2005Q1 to 2010Q1. The results clearly demonstrate that measurement matters; substantively so and particularly when it really matters, during a recession. Different patterns over time were distinguished for the effects (coefficients) on house price inflation of different measurement variables. Given measurement matters, we turned in Section IV to determine how measurement might matter for economic analysis. First, measurement–adjusted HPIs were generated from the panel regressions for each country in each period, and a GDP-PPP-weighted HPI index derived that abstracted measurement effects from measured changes in house price inflation. This measurement-adjusted global HPI was compared with an unadjusted one generated from a pooled regression that did not benefit from the inclusion of measurement-related variables. Unadjusted inflation rates overstated global house price inflation during the recession by about 10 percentage points. Second, we adopted a model of house price changes by Igan and Loungani (2012) and used, in turn, our measurement-adjusted and unadjusted house price indexes. Measurement-adjusted HPIs were found to perform better in the model with parameters constrained to be the same for all countries. In particular, stock price changes and long-term interest rates entered the measurement-adjusted model as statistically significant, unlike the unadjusted model. However, stock price changes entered both of these pooled regressions as statistically significant when the coefficients were allowed to vary between countries, though the magnitudes were quite different. The coefficients on stock price changes followed the pattern identified for (lagged) affordability, credit, and income per capita: coefficients of explanatory variables relating to measurement-adjusted HPI change have larger falls and smaller increases than their unadjusted counterparts. In sum, measurement matters, particularly and substantially so during the recession. Such measurement problems carry over to global house price index estimates. However, economic

14
models, if specified in a sufficiently flexible way, are robust to such measurement problems except for a differential magnitude in the measured effect, something relevant to macroeconomic policy formulation.
15
Table 1, Regression of RPPIs on mesurement variables
Variable Coefficient Std. Error t -Statistic
APARTMENT -0.0002 0.0017 -0.114
APPRAISAL 0.0039 0.0052 0.744
ASKING 0.0014 0.0035 0.412
CAPITAL 0.0009 0.0014 0.642
HEDONIC -0.0039 0.0035 -1.113
MIXADJUST 0.0015 0.0020 0.737
NEW 0.0001 0.0029 0.037
SFH 0.0008 0.0023 0.345
SQMETER 0.0054 0.0043 1.263
UNWEIGHTED -0.0082 0.0027 ‐3.039
WPRICE 0.0123 0.0049 2.486
WROLLING -0.0078 0.0025 -3.092
WSTOCK -0.0021 0.0022 -0.985
XSTING -0.0006 0.0023 -0.236
R-squared 0.0611 Adjusted R-squared 0.0503S.E. of regression 0.0405 Log likelihood 5663.6
Sample: 2005Q1 to 2010Q1; 155 cross-sections; 3,156 obs.

16
Table 2, Fit of measurement variables in moving window regression
RbarSq including:
Time; Country; Country; Measurement.
Measurement Measurement Measurement Coverage Methodology
05 Q1 0.322 0.211 0.102 0.015 0.079
05 Q2 0.253 0.242 0.120 0.016 0.099
05 Q3 0.282 0.273 0.126 0.023 0.099
05 Q4 0.330 0.324 0.148 0.083 0.114
06 Q1 0.365 0.358 0.120 0.025 0.100
06 Q2 0.416 0.409 0.103 0.004 0.090
06 Q3 0.347 0.343 0.085 0.003 0.081
06 Q4 0.286 0.282 0.070 0.003 0.069
07 Q1 0.266 0.265 0.077 0.009 0.075
07 Q2 0.182 0.177 0.100 0.051 0.095
07 Q3 0.181 0.175 0.110 0.066 0.093
07 Q4 0.193 0.193 0.110 0.074 0.081
08 Q1 0.264 0.254 0.153 0.101 0.116
08 Q2 0.303 0.281 0.195 0.129 0.146
08 Q3 0.343 0.324 0.234 0.128 0.194
08 Q4 0.358 0.342 0.216 0.114 0.164
09 Q1 0.405 0.369 0.228 0.118 0.174
09 Q2 0.445 0.408 0.267 0.158 0.211
09 Q3 0.456 0.444 0.257 0.137 0.194
09 Q4 0.401 0.397 0.175 0.068 0.087
10 Q1* 0.413 0.415 0.099 0.020 0.051
Figures are for 5-quarters' moving (by one quarter) window regressions
appropriately centered. Figures for 2009:Q4 and for 2010:Q1 are based on
regressions over 2009Q2-2010:Q1 and 2009Q4-2010:Q1 respectively.
*The RbarSq are very similar for 2010Q1 for the first two columns, with and
without the time dummies. The degrees of freedom adjustment is responsible for
the latter exceeding the former.

17
Table 3, Illustrative regression results for 2009:Q1 to 2009Q2
Variable Coefficient Std. Error t -Statistic p -value
C 0.006 0.004 1.377 0.17WSTOCK -0.006 0.010 -0.589 0.56APARTMENT--2009Q1 -0.004 0.002 -1.982 0.05APARTMENT--2009Q2 -0.014 0.002 -5.562 0.00APPRAISAL--2009Q1 -0.032 0.006 -4.871 0.00APPRAISAL--2009Q2 0.034 0.008 4.502 0.00ASKING--2009Q1 0.025 0.003 9.601 0.00ASKING--2009Q2 0.020 0.002 8.121 0.00CAPITAL--2009Q1 -0.014 0.003 -4.902 0.00CAPITAL--2009Q2 0.001 0.002 0.565 0.57HEDONIC--2009Q1 0.005 0.005 1.011 0.31HEDONIC--2009Q2 0.016 0.004 3.695 0.00MIXADJUST--2009Q1 0.019 0.007 2.690 0.01MIXADJUST--2009Q2 0.004 0.007 0.524 0.60NEW--2009Q1 0.002 0.006 0.346 0.73NEW--2009Q2 -0.024 0.005 -5.036 0.00SFH--2009Q1 -0.011 0.002 -6.751 0.00SFH--2009Q2 -0.003 0.002 -1.944 0.05SQMETER--2009Q1 -0.013 0.013 -0.975 0.33SQMETER--2009Q2 -0.013 0.013 -1.001 0.32UNWEIGHTED--2009Q1 -0.006 0.006 -1.026 0.31UNWEIGHTED--2009Q2 0.014 0.006 2.462 0.01WPRICE--2009Q1 0.022 0.012 1.771 0.08WPRICE--2009Q2 -0.012 0.012 -1.031 0.30WROLLING--2009Q1 -0.009 0.002 -4.331 0.00WROLLING--2009Q2 -0.011 0.003 -4.414 0.00XSTING--2009Q1 0.000 0.004 -0.057 0.95XSTING--2009Q2 -0.001 0.004 -0.194 0.85
2009Q2--C 0.008
R-squared 0.592 Adjusted R-squared 0.506S.E. of regression 0.033 Log likelihood 619.6
Sample: 2009Q1 2009Q2; 148 cross-sections; 295 obs.
Fixed country effects not shown for brevity.

18
Table 4, Pooled regression results for house price indexes
Dependent variable
House price index, log quarter-on-quarter change:
Igan and Loungani (2012) (1)
Measurement-adjusted estimates (2)
Unadjusted Estimates (3)
Excluding: Affordability-lag squared
Measurement-adjusted estimates (4)
Unadjusted estimates (5)
Affordability, lagged
-0.0517*** (0.0158)
-0.291* (0.1772)
-0.174 (0.1201)
-0.085** (0.037)
-0.077*** (0.0271)
Income per capita, change
0.431*** (0.0684)
0.392** (0.1516)
0.519*** (0.0917)
0.395*** (0.142)
0.520*** (0.0919)
Working-age pop, change
0.999*** (0.1970)
0.735* 0.3941
0.494** (0.2354)
0.754* (0.411)
0.503** (0.2438)
Stock prices, change
0.0044* (0.0026)
-0.017** (0.0086)
-0.007 (0.0071)
-0.016* (0.010)
-0.00604 (0.0077)
Credit, change 0.0190*** (0.0053)
0.165*** (0.0268)
0.191*** (0.0253)
0.156*** (0.031)
0.186*** (0.0273)
Short-term interest rate
-0.0009** (0.0004)
-0.010** (0.0046)
-0.006** (0.0025)
-0.010** (0.005)
-0.006** (0.0025)
Long-term interest rate
-0.0006 (0.0004)
0.000001*** 0.0000
0.000 (0.0000)
0.000006*** (0.0000)
0.000002 (0.0000)
Affordability, lag, squared
-0.0019* (0.0012)
-0.014 (0.0121)
-0.007 (0.0085)
Construction costs, change
0.129*** (0.0366)
0.320* (0.1671)
0.312* (0.1709)
0.285* (0.172)
0.295* (0.1738)
Constant -0.243*** (0.0554)
-1.267** (0.6384)
-0.838** (0.4232)
-0.553** (0.247)
-0.504*** (0.1796)
No. Obs. 1,297 357 357 357 357
No. of periods 1970Q1-2010Q1
2005Q1- 2010Q1
2005Q1-2010Q1
2005Q1- 2010Q1
2005Q1-2010Q1
No. countries 17 17 17 17 17
Redundant country
effect: 2
48.94 (0.0000)
60.72 (0.0000)
46.6 (0.0001)
59.10 (0.0000)
R-squared 0.18 0.29 0.54 0.29 0.54
The dependent variable is the log change in the house price index over the last quarter. Affordability is defined as the log of the ratio of house prices to income per capita. Log change in income per capita is calculated as the quarter-on-quarter change in the log level. Log changes in working-age population and bank credit to the private sector are calculated as the year-on-year change in log levels. Log change in stock prices is calculated as the lagged year-on-year change in the log level. All variables are in real terms except short-term and long-term interest rates. Robust standard errors are in parentheses. ***, **, * denote significance at the 1, 5, and 10 percent level, respectively.

19
Figures 1–6, Varying estimated parameters Points in yellow are statistically significant at a 5 percent level
-0.03
-0.02
-0.01
0
0.01
05 Q1
05 Q3
06 Q1
06 Q3
07 Q1
07 Q3
08 Q1
08 Q3
09 Q1
09 Q3
10 Q1
Existing properties
-0.02
-0.01
0
0.01
0.02
0.03
05 Q1
05 Q3
06 Q1
06 Q3
07 Q1
07 Q3
08 Q1
08 Q3
09 Q1
09 Q3
10 Q1
Mix-adjustment
-0.03
-0.02
-0.01
0
0.01
0.02
0.03
05 Q1
05 Q3
06 Q1
06 Q3
07 Q1
07 Q3
08 Q1
08 Q3
09 Q1
09 Q3
10 Q1
Hedonic regressions
-0.04
-0.02
0
0.02
0.04
0.06
05 Q1
05 Q3
06 Q1
06 Q3
07 Q1
07 Q3
08 Q1
08 Q3
09 Q1
09 Q3
10 Q1
Sq. meters
-0.04
-0.02
0
0.02
0.04
0.06
05 Q1
05 Q3
06 Q1
06 Q3
07 Q1
07 Q3
08 Q1
08 Q3
09 Q1
09 Q3
10 Q1
Unweighted
-0.04
-0.02
0
0.02
05 Q1
05 Q3
06 Q1
06 Q3
07 Q1
07 Q3
08 Q1
08 Q3
09 Q1
09 Q3
10 Q1
Appraisal prices

20
1
1.05
1.1
1.15
1.2
1.25
05 Q1
05 Q2
05 Q3
05 Q4
06 Q1
06 Q2
06 Q3
06 Q4
07 Q1
07 Q2
07 Q3
07 Q4
08 Q1
08 Q2
08 Q3
08 Q4
09 Q1
09 Q2
09 Q3
09 Q4
10 Q1
20
04
:Q4
=1.0
0Figure 7, Global Residential Property Price
Index
Unadjusted Adjusted for measurement effects

21
Figure 8, Country variability in parameter estimates Bars in black denote parameter estimates not statistically significant at a 5 percent level.
Credit, change
Stock prices, changes
Affordability, lagged
Income per capita, change
-0.9
-0.7
-0.5
-0.3
-0.1
0.1
0.3
Au
stria
Au
stralia
Belgiu
m
Switzerlan
d
Can
ada
Den
mark
Spain
Finlan
d
France
Greece
Irelan
d
Japan
Neth
erland
s
No
rway
Swed
en
Un
ited kin
gdo
m
Un
ited States
Measurement-adjusted Unadjusted
-0.09
-0.06
-0.03
0.00
0.03
Au
stria
Au
stralia
Belgiu
m
Switzerlan
d
Can
ada
Den
mark
Spain
Finlan
d
France
Greece
Irelan
d
Japan
Neth
erland
s
No
rway
Swed
en
Un
ited K
ingd
om
Un
ited States
Measurement-adjusted Unadjusted
-1.1
-0.8
-0.5
-0.2
0.1
Au
stria
Au
stralia
Belgiu
m
Switzerlan
d
Can
ada
Den
mark
Spain
Finlan
d
France
Greece
Irelan
d
Japan
Neth
erland
s
No
rway
Swed
en
Un
ited kin
gdo
m
Un
ited States
Measurement-adjusted Unadjusted
-1.5
-1
-0.5
0
0.5
1
1.5
2
2.5
Au
stria
Au
stralia
Belgiu
m
Switzerlan
d
Can
ada
Den
mark
Spain
Finlan
d
France
Greece
Irelan
d
Japan
Neth
erland
s
No
rway
Swed
en
Un
ited kin
gdo
m
Un
ited States
Measurement-adjusted Unadjusted
22
Figure 8 continued, Country variability in parameter estimates Bars in black are not statistically significant at a 5 percent level.
Short-term interest rate
Long-term interest rate
Construction costs, change
Working-age population, change
-0.05
-0.03
-0.01
0.01
0.03
Au
stria
Au
stralia
Belgiu
m
Switzerlan
d
Can
ada
Den
mark
Spain
Finlan
d
France
Greece
Irelan
d
Japan
Neth
erland
s
No
rway
Swed
en
Un
ited kin
gdo
m
Un
ited States
Measurement-adjusted Unadjusted
Switzerland: Madj. and Unadj.
-1.80
-1.40
-1.00
-0.60
-0.20
0.20
0.60
Au
stria
Au
stralia
Belgiu
m
Switzerlan
d
Can
ada
Den
mark
Spain
Finlan
d
France
Greece
Irelan
d
Japan
Neth
erland
s
No
rway
Swed
en
Un
ited kin
gdo
m
Un
ited States
Measurement-adjusted Unadjusted
-1.80
-0.80
0.20
1.20
2.20
Au
stria
Au
stralia
Belgiu
m
Switzerlan
d
Can
ada
Den
mark
Spain
Finlan
d
France
Greece
Irelan
d
Japan
Neth
erland
s
No
rway
Swed
en
Un
ited kin
gdo
m
Un
ited StatesMeasurement-adjusted Unadjusted
-10.00
-6.00
-2.00
2.00
6.00
10.00
14.00
Au
stria
Au
stralia
Belgiu
m
Switzerlan
d
Can
ada
Den
mark
Spain
Finlan
d
France
Greece
Irelan
d
Japan
Neth
erland
s
No
rway
Swed
en
Un
ited kin
gdo
m
Un
ited StatesMeasurement-adjusted Unadjusted

23
ANNEX 1. ISSUES IN HPI METHODOLOGY
HPI methodology can vary according to method used to control for quality mix, coverage, nature of prices, and weights—see the draft Handbook on House Price Indexes.23
A. Stocks or Transactions
A key issue is whether the purpose of the HPI is to measure changes in the price component of the value of the stock of housing or changes in the price component of the value of houses transacted. If the former, then the weights must be based on relative stock values, as outlined in section E below, and the prices should reflect price changes in the stock of housing, as opposed to just those sold. For measures relating to the stock of housing, HPIs that utilize data on the prices of houses sold, or for sale, are subject to selectivity bias if the sample of houses sold is not a random sample of the stock (Mason and Pryce, 2011). Appraisal data, usually required for property tax assessment, may be available for of the stock of housing and, while open to errors from appraiser bias24 or changes in appraisal rules, enable HPIs that have some statistical control for selectivity bias to be estimated. Alternatively, HPIs based on price data of houses sold may be estimated using dummy time variables in a hedonic regression that has a correction for selectivity bias incorporated in the two-stage censored regression estimator, as undertaken in Gatzlaff and Haurin (1998).25
B. Constant-quality Comparisons
At their simplest HPIs are measured as weighted changes in average (often median) prices. Yet since housing is heterogeneous there is a need to ensure that average price change measures are not tainted by changes in the quality mix. Alternative quality-mix adjustment methods include:
23 The current draft is available at: http://epp.eurostat.ec.europa.eu/portal/page/portal/hicp/methodology/owner_occupied_housing_hpi/HPI_handbook.
24 Quan and Quigley (1991) point to a problem of appraisal smoothing. Appraisers are argued to work by updating current estimates of comparable property values each time a transaction occurs. The appraiser’s role is identified as signal extraction that, as a result of their larger set of information and experience, reduces the price dispersion of equivalent transaction prices by buyers and sellers. An implication is a process known as appraisal smoothing or “appraisal lag.” Geltner et al. (2003) discuss the process of de-lagging appraisal indexes to remove the effects of smoothing, the lag bias, and provide a summary of the results of empirical studies.
25 The two-stage estimator requires joint estimation of the probability that a house will sell and the transaction price. The first stage for the probability of a sale uses as explanatory variables, property, owner, and macroeconomic factors that affect reservation and offer prices. From the results, a selection bias correction variable is calculated. Once inserted in the second stage OLS regression of transaction prices, unbiased OLS estimates of HPIs can be derived from the coefficients on the time dummies.

24
Repeat sales method This method restricts the price comparisons to repeat sales considered over a long period, Shiller (1991, 1993). For each, say quarter, data are collected on sales and if a record of an earlier transaction for the home is identified, the two transactions are paired and treated as a repeat sale. By limiting the sample to price comparisons of pairs of like sales it mitigates the shortcomings of HPIs based on median sales that have no control for quality change. The primary disadvantages are (i) the quality of a repeat purchase may depreciate, with wear and tear, or appreciate, with renovations;26 (ii) there is increased sampling error due to relatively small sample sizes and potential sample selectivity bias—houses not sold or sold once.27 The sample would include an unduly higher proportion of atypical houses sold more frequently and exclude atypical houses sold less frequently (see Gatzlaff and Haurin (1998), Hwang and Quigley (2004) and Mason and Pryce (2011) for correction mechanisms for sample selectivity bias); (iii) there are implications for the estimator of the (asymmetric and positive) relationship between the time between repeat transactions and the variance of the error term of a regression of HPIs of repeat sales on time dummy variables used to generate repeat sales HPIs. Alternative assumptions regarding this relationship can have a major impact on the index (see Dreiman and Pennington-Cross (2004) and Leventis (2008); and (iv) as new transaction pairs become available with the addition of new historical data, the index may be subject to a volatile revision history. Hedonic approach The hedonic approach has as its basis a regression of house prices on price-determining characteristics. It can be used for a data set of prices of all houses, say using appraisal data, as long as each price has an associated characteristic data set. Hedonic price indexes take two major forms: (i) characteristics price (or hedonic imputation) indexes in which the quality characteristics in a fixed ‘base’ period are revalued by the coefficients from hedonic regressions in the current periods to form a constant quality HPI. There are as many alternative formulations that include keeping the characteristics set constant in the current period or some average of the two periods. Index number theory provides guidance on an appropriate choice; alternatively (ii), time dummies are included in the hedonic regressions and their coefficients provide the basis for estimates of quality-adjusted price changes. Silver and Heravi (2007), Diewert, Heravi and Silver (2008), Li, Prud’homme, and Yu (2006), Hill and Melser (2008), Shimizu et al. (2009), and Hill (2011) provides accounts of these approaches. 26 Some fairly arbitrary methods are used to mitigate such effects, for example, the CS-HPI (i) assigns smaller weights to sales pairs with large price changes relative to the community around them—in large metro areas typically 10–15 percent of pairs are down-weighted; (ii) sales pairs with longer time intervals are given less weight than sales pairs with shorter intervals—in large metro areas the interval weights for sales pairs with ten-year intervals will be 20–45 percent smaller than those for six-month intervals; (iii) deeds that indicate that the sale is unlikely to be arms-length are excluded; and (iv) homes that sell more than once within 6 months are excluded as they are considered likely to following a major remodeling. The hedonic repeated measure developed by Shiller (1991, 1993) makes it possible to account for possible changes in house characteristics between first and second sales.
27 Chau, et al. (2005) surveys the percentage of repeat sales pairs to number of transactions (maximum 50%) in a number of studies finding high inter-country variability, for example, 23 percent for Hong Kong for comparisons over 10 years compared with 6.6 percent over 18 years for areas in California.

25
Mix-adjustment through stratification Mix-adjusted HPIs are compiled as weighted averages of price changes of strata. The strata may be based on location and other price-determining characteristics (see examples in Wood (2005). The effectiveness of the method depends on the effectiveness of the stratification in accounting for price-change determining characteristics and hedonic regressions have been usefully employed to help determine such stratification factors.28 Sample size permitting, hedonic indices may be usefully employed within strata, and the results of the HPIs for the strata combined using weights to reflect either the relative values of the stock or transactions in housing. Sale price appraisal ratio (SPAR) method SPAR combines information from appraisals and transactions. It includes unmatched transactions and, unlike the repeat purchase method, does not need to be revised when a new transaction is paired. HPIs using SPAR are claimed to be indexes at constant quality provided that appraisals are adjusted by the value of improvements—see Bourassa, Hoesl, and Sun (2006) for details. The unmatched comparisons between say periods t and t-1, are the average prices of the “new” (sold only in period t) compared with the “old” (sold only in period t-1) and the quality adjustment used can be shown to be the ratio of the average appraised values in some previous period 0 of the new against the old. 29 The viability of the method depends critically on the quality of appraisals. Standard ‘model’ portfolio approach This approach is based on controlling for quality changes by making periodic valuation of a standard property portfolio or standard units of different types/specifications in a given areas. The sample may be changed over time to keep constant the age of the property. The sample may be based on active transactions and/or appraisals (Chau et al., 2005)..
C. Coverage
Geographical HPIs can be national, cover just the capital city, major cities, major urban areas, rural areas, or some or all of the above being aggregated from sub-indexes of regional or more local administrative areas. The evidence is of substantial variation in inter-area growth rates in HPIs (for example, Abraham and Hendershott (1996) and Capozza et al. (2002)). Where a reliable national HPI is not available for a country but a say reliable capital city HPI is used as a proxy for a national one, the “national” index has a defective geographical coverage.
28 See Communities and Local Government House Price Index; original source and further series: Department of Communities and Local Government, available at: http://www.communities.gov.uk/housing/housingresearch/housingstatistics/housingstatisticsby/ housingmarket/housepriceindex/.
29 Algebraically, this can be easily done using geometric, recommended for an unweighted SPAR by Vries et al. (2008), as opposed to arithmetic means.
26
Type of housing HPIs may be restricted to (combinations of) types of housing such as newly-built houses and or apartments, single-family houses, apartments, apartment and terrace houses. HPIs may serve different purposes, for example, newly-built house price indexes are appropriate for measuring the cost of shelter in a consumer price index using the net purchase (or acquisitions) concept (see Diewert (2004) and Baldwin, Nakamura and Prud’homme (2006)). Source data and financing Administrative data sources used to record prices may be restricted to purchases financed by a particular mortgage organization.
D. Prices: Source Data, Valuation, and Timelines
The sale and purchase of a house usually touches a number of organizations: to promote its sale (real estate agents), finance its purchase (mortgage lenders), administer taxes (tax authority), and register its legal title (Land Registry or notary30). The price may change along the timeline of the process from asking price to final completion (of contract) price. The continuum is such that the asking price for an individual property can change, and is likely to fall, the longer the property is on the market. While generally it is the final completion price that HPIs should measure, prices at earlier stages may be used for HPIs for pragmatic reasons. For example, the final completion-price data base may not be timely or may exclude many price-determining characteristics necessary for mix-adjustments, while an earlier data base, say from mortgage lenders, may have sufficient price-determining characteristics and be more timely, but would exclude cash sales and the effects of any renegotiation of prices between mortgage approval and completion. The length of the timeline, potential for renegotiating price, and adequacy of source data will usually vary between countries and over time for individual countries. An illustration is provided below based on Wood (2005 for the U.K. timeline which may take 6 months.
E. Weights: Stocks or Transactions and Values or Quantities
First, there is the issue whether democratic or plutocratic weights should be used. For an index aggregated over regions, types of housing, and possibly other stratification factors, democratic weights would require the relative volumes of transactions of each stratum while plutocratic weights would require the relative monetary nominal values. Such values may be purchase values or stock values, depending on the purpose of the index. Weights should be updated as regularly as possible and annual chained Laspeyres-type indexes are preferred as most likely approximations, given timely weights will be unavailable, to chained superlative indexes (see ILO et al. (2004) and Armknecht and Silver (2012) for these index number issues). Regression formulations might be used within a
30 In France, all real estate transactions have to be registered in front of a notary who have a monopoly (Gouriéroux and Laferrère, 2006).

27
stratum with the price changes of individual stratum weighted together to form the national index of all housing types.

28
ANNEX 2. DATA
The GDP-PPP weights used to construct the global measures of HPI inflation are from the IMF, World Economic Outlook Database, September 20, 2011. The data used as explanatory variables for the Section III model based on Igan and Loungani (2012) was supplied by Deniz Igan (IMF). I am also grateful for help with the provision of data to Niall O’Hanlon (Central Statistical Office, Ireland), Marc Prud’Homme (Statistics Canada), and Chihiro Shimizu (Reitaku University). Many of the house price indexes (HPIs) used in this study have been drawn from the Bank for International Settlements’ (BIS) database of property price indexes available at: http://www.bis.org/statistics/pp.htm. The codes cited below alongside “BIS” refer to this database. Use of the database requires a citation of the appropriate national source as noted at: http://www.bis.org/statistics/pp/disclaimer.htm and given below along with the websites used. Many of the statistical agencies and private sources generously helped with the provision of further methodological information and data. The BIS country series have been supplemented by further house price indexes, not always published, from the national sources indicated below. Australia: 14 series
BIS: Q:AU:2:1:1:1:0:0 and Q:AU:4:1:1:1:0:0; House Price Indexes; original source: Australian Bureau of Statistics: http://www.abs.gov.au/AUSSTATS/[email protected]/DetailsPage/6464.02009?OpenDocument.
RP Data; RP Data-Rismark’s Home Value Indexes: Capital Gain (final values), Repeat Sales, and Stratified median; data provided to author by RP Data; website: http://www.rpdata.com/. See also: www.rpnz.com.au/derivatives/pdfs/Basing_NZ.pdf Austria: 10 series BIS:Q:AT:2:8:0:0:1:0, Q:AT:1:1:0:0:1:0, Q:AT:1:8:0:0:1:0, Q:AT:2:8:1:0:1:0, Q:AT:1:2:1:0:1:0, Q:AT:1:8:1:0:1:0, Q:AT:1:8:2:0:1:0, Q:AT:2:1:0:0:1:0, Q:AT:2:2:1:0:1:0, Q:AT:2:8:1:0:1:0; House Price Index; original source: Oesterreichischen Nationalbank: http://www.oenb.at/isaweb/report.do?lang=EN&report=6.6. Belgium: 8 series BIS: Q:BE:2:2:1:2:0:0; Stadim Indexes; original source and further indexes: STADIM (Study and Advice Bureau on Immovables): http://www.stadim.be/index.php?page=stadimdexen&hl=en. BIS: Q:BE:0:1:1:0:0:0, Q:BE:0:2:1:0:0:0, Q:BE:0:3:1:0:0:0, Q:BE:0:4:1:0:0:0, and Q:BE:0:8:1:0:0:0; Prix Ventes de Biens Immobiliersoriginal; original source: SPF Economie, DGSIE (Service public federal Economie, Direction Generale Statistique et Information Economique (FPS Economy, DGSEI (Federal Public Service, Directorate-General Statistics and Economic Information)): http://statbel.fgov.be/fr/modules/publications/statistiques/economie/ventes_de_biens_immobiliers.jsp.

29
Canada: 6 series Teranet (developed in alliance with the National Bank of Canada); Teranet House Price Index; source: http://www.housepriceindex.ca/Default.aspx. New Housing Price Index; Statistics Canada; source: http://www.statcan.gc.ca/daily-quotidien/110210/dq110210a-eng.htm Resale-Housing Prices (Royal LePage); Bank of Canada; source: http://www.bankofcanada.ca/en/rates/indinf/real_data_en.html. The Canadian Real Estate Association (CREA); Residential Average Price; source: CREA, available on subscription: http://creastats.crea.ca/natl/. Czech Republic: 2 series BIS: Q:CZ:0:2:1:1:3:0 and Q:CZ:0:8:1:1:1:0; Price Indexes of Houses and Flats; original source: Czech Statistical Office, Tables 1–6 and 2–6: http://www.czso.cz/CSU/2009EDICNIPLAN.NSF/P/7009-09. Denmark: 4 series BIS: Q:DK:0:2:0:1:0:0 and Q:DK:0:8:0:1:0:0; Price index for sales of property; original source: Statistics Denmark: http://www.statbank.dk/STATBANK5A/DEFAULT.ASP?W=1024. Association of Danish Mortgage Banks; Average Sqm. Prices of Owner Occupied Dwellings: http://www.realkreditraadet.dk/Statistics/Prices_and_trades_of_owner_occupied_homes.aspx Estonia: 2 series BIS: Q:EE:0:8:0:1:1:0 and Q:EE:2:8:0:1:1:0; original source via Statistics Estonia: Estonian Land Board from whose website a data query facility is available: http://www.maaamet.ee/kinnisvara/htraru/Start.aspx. The facility is in Estonian, however, an English-language Guide to its use and technical information are available at: http://www.maaamet.ee/index.php?lang_id=2&page_id=453&menu_id=78. Finland: 9 series BIS: Q:FI:0:1:1:1:1:0, Q:FI:0:1:2:1:1:0, Q:FI:0:2:1:1:1:0, Q:FI:0:8:1:1:1:0, Q:FI:4:2:1:1:1:0, Q:FI:9:1:1:1:1:0, Q:FI:9:1:2:1:1:0, Q:FI:A:1:1:1:1:0, and Q:FI:A:1:2:1:1:0; House Price Index; original source: Statistics Finland, unpublished and available from Bank of Finland (Suomen Pankki): http://www.suomenpankki.fi/en/julkaisut/selvitykset_ja_raportit/main/Pages/default.aspx. France: 8 series
BIS: Q:FR:2:8:1:1:0:0; Indice d'Évolution des Prix des Logements Anciens: original source: INSEE, National Institute of Statistics and Economic Research: http://www.insee.fr/fr/themes/document.asp?ref_id=ip1297 and
http://www.indexes.insee.fr/bsweb/servlet/bsweb?action=BS_RECHGUIDEE&BS_IDARBO=05000000000000.

30
BIS: Q:FR:0:2:2:3:0:0, Q:FR:0:8:2:3:1:0, Q:FR:3:2:2:3:0:0, and Q:FR:3:8:2:3:1:0; Enquete Commercialsation Logements Nuefs; original source: Ministère de l’Equipment Ministère de l'Écologie, de l'Énergiie, du Développement durable, et de la Mer (Meeddm).
Greece: 9 series BIS: Q:GR:0:8:0:0:0:0, Q:GR:0:8:1:0:0:0, Q:GR:0:8:2:0:0:0, Q:GR:1:1:0:0:1:0, Q:GR:3:8:0:0:1:0, Q:GR:4:8:0:0:1:0, Q:GR:5:8:0:0:0:0, Q:GR:8:8:0:0:0:0, and Q:GR:9:8:0:0:1:0; Index of the Price of Dwellings; original source: Bank of Greece: http://www.bankofgreece.gr/PAGES/EN/STATISTICS/REALESTATE.ASPX.
Ireland: 11 series
BIS: Q:IE:0:1:0:2:0:0, Q:IE:1:1:0:2:0:0, and Q:IE:2:1:0:2:0:0; Permanent tsb House Price Index; original source: Economic and Social Research Institute (ESRI) based on data from Permanent TSB Bank; http://www.esri.ie/irish_economy/permanent_tsbesri_house_p/ and https://www.permanenttsb.ie/aboutus/housepriceindex/#d.en.1460.
BIS: Q:IE:0:1:1:3:0:0, Q:IE:0:1:2:3:0:0, and Q:IE:2:1:1:3:0; Average house prices; original source and further series: The Department of the Environment, Heritage, and Local Government; available at: http://www.environ.ie/en/Publications/StatisticsandRegularPublications/HousingStatistics/FileDownLoad,15295,en.XLS and http://www.environ.ie/en/Publications/StatisticsandRegularPublications/HousingStatistics/
Netherlands: 10 series
BIS: M:NL:0:1:1:1:0:0, M:NL:0:2:1:1:0:0, and M:NL:0:8:1:1:0:0; House Price Index and Average Purchase Prices; original source and further series: CBS (Central Bureau voor de Statistiek) published in cooperation with the Dutch Land registry Office, Kadaster: http://statline.cbs.nl/STATWEB/SELECTION/?DM=SLEN&PA=71533ENG&LA=EN&VW=T.
New Zealand: 3 series BIS: Q:NZ:0:1:0:3:0:0, Q:NZ:0:3:0:3:0:0, and Q:NZ:4:3:0:3:0:0; Quotable Value Quarterly House Price Index; original source: Quotable Value Limited; available at: Reserve Bank of New Zealand: http://www.rbnz.govt.nz/keygraphs/1697975.html. Norway: 4 series BIS: Q:NO:0:1:0:1:0:0, Q:NO:0:3:0:1:0:0, Q:NO:0:4:0:1:0:0, and Q:NO:0:8:0:1:0:0; House Price Index; original source and further series (see “More Tables in StatBank”): Statistics Norway: http://www.ssb.no/english/subjects/08/02/30/bpi_en/. Poland: 4 series BIS: Q:PL:2:8:1:2:1:0, Q:PL:2:8:2:2:1:0, Q:PL:4:8:1:2:1:0, and Q:PL:4:8:2:2:1:0; Average Asking Prices of Flats; original source: National Bank of Poland (growth rates): http://www.nbp.pl/HOMEN.ASPX?F=/EN/SYSTEMFINANSOWY/STABILNOSC.HTML.

31
Russia: 2 series BIS: Q:RU:9:1:1:1:1:0 and Q:RU:9:1:2:1:1:0; Indexes of Prices in Primary/Secondary Market of Dwellings; original source: Federal State Statistics Service: http://www.gks.ru/wps/wcm/connect/rosstat/rosstatsite.eng/figures/prices/. Slovak Republic: 3series BIS: Q:SK:0:1:1:2:1:0; House Price Indexes; original source and further series: National Bank of Slovakia: http://www.nbs.sk/EN/STATISTICS/SELECTED-MACROECONOMICS-INDICATORS/RESIDENTIAL-PROPERTY-PRICES. Slovenia: 6 series BIS: Q:SI:0:1:1:1:0:0, Q:SI:0:8:2:1:0:0, and Q:SI:2:1:1:1:0:0; Residential Housing Price Indexes; original source and further series: Statistical Office of the Republic of Slovenia: http://www.stat.si/eng/novica_prikazi.aspx?id=3714.
Spain: 2 series
BIS: Q:ES:0:1:1:1:1:0 and Q:ES:0:1:2:1:1:0; Precio M2 Vivienda Libre; original source: Banco de Espana: http://www.bde.es/infoest/si_1_6.csv. Sweden: 2 series BIS: Q:SE:0:1:0:1:0:0; Real Estate Prices; original source and other indexes; Statistics Sweden: http://www.scb.se/Pages/Product____10966.aspx and http://www.ssd.scb.se/databaser/makro/produkt.asp?produktid=BO0501&lang=2. Switzerland: 6 series BIS: CH:0:2:0:2:0:0 and CH:0:8:0:2:0:0; Real Estate Price Indexes; original source: Swiss National Bank: http://www.snb.ch/en/iabout/stat/statpub/statmon/stats/statmon/statmon_O4_3 (original source: Wüest & Partner AG). Wüest & Partner AG; Transaction and Asking Price Indexes: http://www.wuestundpartner.com/online_services/immobilienindizes/transaktionspreisindex/index_e.phtml. United Kingdom: 27 series BIS: Q:GB:3:1:0:2:0:0; Halifax House Price Index; original source and further series: Halifax Research: http://www.lloydsbankinggroup.com/media1/research/halifax_hpi.asp (historical house price data). BIS: Q:GB:0:1:2:1:0:0; Communities and Local Government House Price Index; original source and further series: Department of Communities and Local Government, available at: http://www.communities.gov.uk/housing/housingresearch/housingstatistics/housingstatisticsby/housingmarket/housepriceindex/. Also available from UK (Office for) National Statistics at: http://www.statistics.gov.uk/hub/people-places/housing-and-households/housing-market/index.html. (© Crown copyright 2008 Land Registry).

32
Acadametrics; LSL Property Services/Acadametrics House Price Index; source: http://www.acadametrics.co.uk/acadHousePrices.php. Land Registry; House Price Index; source: http://www.landreg.gov.uk/houseprices/. Nationwide; Nationwide House Price Index; source: http://www.nationwide.co.uk/hpi/historical.htm. Rightmove; House Price Index; source: http://www.rightmove.co.uk/news/house-price-index. United States: 4 series BIS: Q:US:0:2:2:1:0:0; US Census Bureau; Constant Quality (Laspeyres) Price Index of New One-Family Houses Sold; original source: http://www.census.gov/const/www/constpriceindex.html. Federal Housing Finance Agency (FHFA); FHFA “Purchases-Only” House price index; source: http://www.fhfa.gov/DEFAULT.ASPX?PAGE=84. Standard & Poor’s; S&P/Case-Shiller National Home Price Index; source: http://www.standardandpoors.com/indexes/sp-case-shiller-home-price-indexes/en/us/?indexId=spusa-cashpidff--p-us----. CoreLogic Home Price Index, source: http://www.corelogic.com/about-us/researchtrends/home-price-index.aspx.

33
REFERENCES Abraham, Jesse and Patric H. Hendershott, (1996), “Bubbles in Metropolitan Housing Markets,” Journal of Housing Research, 7, 2, 191–207. Armknecht, Paul and Mick Silver, (2012), “Post-Laspeyres: The Case for a New Formula for Compiling Consumer Price Indexes,” IMF Working Paper Series, forthcoming, March. Baldwin, Andrew, Alice Nakamura and Marc Prud’homme, (2006), “Empirical Estimates of the Various Approaches to Measuring the Cost of “Owner-Occupied” Shelter in Canada,” Paper presented at the OECD-IMF Workshop on Real Estate Price Indexes, November 6-7, OECD: Paris. Available at:http://www.oecd.org/document/47/0,3343,en_2649_33715_37582447_1_1_1_1,00.htm. Beck, Nathaniel and Jonathan N. Katz, (1995), “What to Do (and Not to Do) With Time-Series Cross-Section Data,” American Political Science Review, 89(3), 634-647. Bourassa, Steven C., Martin Hoesl, and Jian Sun (2006), “A Simple Alternative House Price Index Method,” Journal of Housing Economics 15 80–97. Capozza, Dennis R., Patric H. Hendershott, Charlotte Mack, and Christopher J. Mayer, (2002), “Determinants of Real House Price Dynamics,” NBER Working Paper No. W9262. Carless, Emily, (2011), “Reviewing House Price Indexes in the UK.” Paper presented at the Workshop on House Price Indexes, Statistics Netherlands, The Hague, 10-11 February 201. Available at: http://www.cbs.nl/en-GB/menu/organisatie/evenementen/HPIworkshop/presentations/default.htm. Chau, K. W., S. K. Wong, C. Y. Yiu and H. F. Leung, (2005), Real Estate Price Indexes in Hong Kong, Journal of Real Estate Literature, 13, 3, 337–356. Claessens, Stijn, M. Ayhan Kose, and Marco E. Terrones, (2008), “What Happens During Recessions, Crunches and Busts?” IMF Working Paper 08/274 (Washington: International Monetary Fund). Claessens, Stijn, Giovanni Dell’Ariccia, Deniz Igan, and Luc Laeven, (2010), “Cross-Country Experiences and Policy Implications from the Global Financial Crisis,” Economic Policy, Volume 25, pp. 267-293. Crowe, Christopher, Dell'Ariccia, Giovanni, Igan, Deniz and Pau Rabanal, (2011), “How to Deal with Real Estate Booms: Lessons from Country Experiences,” IMF Working Paper Series, WP/11/91. Diewert, W. Erwin, (2004), “The Treatment of Owner Occupied Housing and Other Durables in a Consumer Price Index.” In W.E. Diewert, J. Greenlees and C. Hulten (eds.), Price Index Concepts and Measurement, NBER Studies in Income and Wealth, University of Chicago Press. Diewert, W. Erwin, (2005), “Weighted Country Product Dummy Variable Regressions and Index Number Formulae,” Review of Income and Wealth, 51, 4, December, 561–70.

34
Diewert, W. Erwin, Heravi, Saeed, and Silver, Mick, (2008),“Hedonic Imputation Indexes Versus Time Dummy Hedonic Indexes.” In W. Erwin Diewert, John Greenlees, and Charles R. Hulten (eds.) Price Index Concepts and Measurement, NBER, Chicago: University of Chicago Press, 278–337, 2010. Dreiman, Michele H.. and Anthony N. Pennington-Cross, (2004), “Alternative Methods of Increasing the Precision of Weighted Repeat Sales House Prices Indexes,” Journal of Real Estate Finance and Economics, 28, 4, 200–317. European Central Bank (ECB), (2012 and regularly updated), Statistical Data Warehouse. Available at: http://sdw.ecb.europa.eu/browseSelection.do?DATASET=0&sfl1=4&FREQ=Q&sfl2=4&REF_AREA=341&node=2120781&SERIES_KEY=129.RPP.Q.I5.N.TD.00.3.00. Eurostat, (2011), European Commission, Draft Technical Manual on Owner-Occupied Housing for the Harmonised Index of Consumer Prices, v.1.9.1, July. Available at: http://epp.eurostat.ec.europa.eu/portal/page/portal/hicp/documents_meth/OOH_HPI/OOH_Draft_Technical_Manual_v_1_9_1.pdf Eurostat, (2012), European Commission, Directorate G: Business Statistics, Unit G-6: Price statistics; Purchasing Power Parities, “Experimental house price indices in the Euro area and the European Union in the in the third quarter of 2011, 24 January, 2012. Available at: http://epp.eurostat.ec.europa.eu/portal/page/portal/hicp/methodology/owner_occupied_housing_hpi/experimental_house_price_indices. Gatzlaff, D.H. and Haurin, D. R., (1998), “Sample Selection and Biases in Local House Value Indexes,” Journal of Urban Economics 43 pp. 199–222. Geltner, David, Bryan D. MacGregor and Gregory M. Schwann, (2003), “Appraisal Smoothing and Price Discovery in Real Estate Markets,” Urban Studies, Vol. 40, 5–6, 1047–1064. Gouriéroux, Christian and Anne Laferrère, (2006), “Managing Hedonic Housing Price Indexes: The French Experience.” Paper presented at the OECD-IMF Workshop on Real Estate Price Indexes, November 6-7, OECD: Paris. Available at: http://www.oecd.org/document/47/0,3343,en_2649_33715_37582447_1_1_1_1,00.htm. Gatzlaff, Dean H. and Donald R. Haurin, (1998), “Sample Selection and Biases in Local House Value Indexes,” Journal of Urban Economics, 43, 199–222. Giles, David E., (2011), “Interpreting Dummy Variables in Semi-logarithmic Regression Models: Exact Distributional Results,” University of Victoria, Department of Economics, Econometrics Working Paper EWP1101, January. Girouard, Nathalie, Mike Kennedy, Paul van den Noord and Christophe André, (2006), “Recent House Price Developments: The Role of Fundamentals,” Organisation for Economic Co-operation and Development (OECD), Economics Department Working Paper, ECO/WKP(2006)3. Available at: http://www.oecd.org/findDocument/0,3770,en_2649_34573_1_119669_1_1_1,00.html.

35
Hilbers, Paul, Alexander W. Hoffmaister, Angana Banerji, and Haiyan Shi, (2008), “House Price Developments in Europe: A Comparison,” WP/08/211, October. Hill, Robert J. and Daniel Melser, (2008), “Hedonic Price Indexes for Housing Across Regions and Time: The Problem of Substitution Bias,” Mimeo, April. Hill, Robert J., (2011), “Hedonic Price Indexes for Housing,” OECD Statistics Directorate, Working Paper 35, STD/DOC(2011)1/REV1, February. Hwang, Min and John M. Quigley, (2004), “Selectivity, Quality Adjustment and Mean Reversion in the Measurement of House Values,” Journal of Real Estate Finance and Economics, 28, 2/3, 161–178. Igan, Deniz and Prakash Loungani,(2010), “Global Housing Cycles,” IMF Working Paper Series, November. Igan, Deniz and Heedon Kang, (2011), “Do Loan-to-Value and Debt-to-Income Limits Work? Evidence from Korea,” IMF Working Paper Series, WP/11/297, December. http://www.imf.org/external/pubs/cat/longres.aspx?sk=25441.0. International Labour Office (ILO), IMF, OECD, Eurostat, United Nations, World Bank, (2004), Consumer Price Index Manual: Theory and Practice, (Geneva: ILO). http://www.ilo.org/public/english/bureau/stat/guides/cpi/index.htm. International Monetary Fund (IMF), (2008), World Economic Outlook: Housing and the Business Cycle, World Economic and Financial Surveys, April, Chapter 3 (Washington: IMF, 2008) IMF, (2010), “Rebalancing Growth, Chapter 3: Unemployment Dynamics during Recessions and Recoveries: Okun’s Law and Beyond” World Economic Outlook, April 2010, Washington DC: IMF. Available at: http://www.imf.org/external/pubs/ft/weo/2010/01/pdf/text.pdf IMF, (2011), Global Financial Stability Report, Chapter III. Housing Finance and Financial Stability—Back to Basics? Washington DC: IMF April, 2011. Available at: http://www.imf.org/external/pubs/ft/gfsr/2011/01/index.htm. Kennedy, Peter, E., (1981), “Estimation with Correctly Interpreted Dummy Variables in Semilogarithmic Equations.” American Economic Review, 71, 801. Kennedy, Peter, E., (1986), “Interpreting Dummy Variables,” The Review of Economics and Statistics, 68, 1, February, 174-175. Leventis, Andrew, (2008), “Revisiting the Differences between the OFHEO and S&P/Case-Shiller House Price Indexes: New Explanations,” Office of Federal Housing Enterprise Oversight, January, Available at: www.ofheo.gov/media/research/OFHEOSPCS12008.pdf . Levin, Andrew, Chien-Fu Lin, and Chia-Shang James Chu, (2002), “Unit Root Tests In Panel Data: Asymptotic and Finite-Sample Properties,” Journal of Econometrics, 108, 1–24.

36
Li, Wenzheng, Marc Prud’homme, and Kam Yu, (2006), “Studies in Hedonic Resale Housing Price Indexes,” OECD-IMF Workshop on Real Estate Price Indexes, November 6-7, OECD: Paris. Available at: http://www.oecd.org/document/47/0,3343,en_2649_33715_37582447_1_1_1_1,00.htm. Loungani, Prakash, (2012), “Will House Prices Keep Falling?,” IMF Survey, January. Available at: http://www.imf.org/external/pubs/ft/survey/so/2012/NUM011212A.htm Mason, Phil and Gwilym Pryce, (2011), “Controlling for Transactions Bias in Regional House Price Indexes,” Housing Studies, Volume 26, Issue 5, July, pages 639-660. Muellbauer, John and Anthony Murphy, (2008), “Housing Markets and the Economy: the Assessment,” Oxford Review of Economic Policy, 24, 1, 1–33. Quan, D. C. and Quigley, J. M., (1991), “Price Formation and the Appraisal Function in Real Estate Markets,” Journal of Real Estate Finance and Economics, 4, 127–146. Reinhart, Carmen M. and Kenneth S. Rogoff, 2009, “This Time is Different, Eight Centuries of Financial Folly,” Princeton University Press, Princeton and Oxford. Shiller, R.J., (1991), “Arithmetic Repeat Sales Price Estimators,” Journal Housing Economics, 1, 1, 110–126. Shiller, R.J., (1993), “Measuring Asset Values for Cash Settlement in Derivative Markets: Hedonic Repeated Measures Indexes and Perpetual Futures,” Journal of Finance, 48, 3, 911–931. Shimizu, Chihiro, Kiyohiko G. Nishimura, and Tsutomu Watanabe, (2009), “Housing Prices and Rents in Tokyo: A Comparison of Repeat-Sales and Hedonic Measures.” Paper presented at the 11th Ottawa Group Meeting, Neuchâtel, 27th to 29th May 2009. Available at: http://www.ottawagroup2009.ch/bfs/ottawagroup2009/en/index/05.html Silver, Mick, (2002), “The Use of Weights in Hedonic Regressions : The Measurement of Quality-Adjusted price Changes,” Mimeo, Cardiff Business School, Cardiff University. Silver, Mick, (2011), “House Price Indices: Does Measurement Matter?” World Economics, 12, 3, July-Sept. Silver, Mick and Heravi, Saeed, (2007), Hedonic Indexes: A Study of Alternative Methods. In E.R. Berndt and C. Hulten (eds.) Hard-to-Measure Goods and Services: Essays in Honour of Zvi Griliches, pp. 235–268, NBER/CRIW, Chicago: University of Chicago Press. Van Garderen, K. J. and C. Shah, (2002), “Exact Interpretation of Dummy Variables in Semilogarithmic Equations, Econometrics Journal, 5, 149–159. Vries, Paul de, Jan de Haan, Gust Mariën, and Erna van der Wal, (2008), “A House Price Index Based on the Spar Method.” Paper presented at the 2008 World Congress on National Accounts and Economic Performance Measures for Nations, May 12–17, 2008, Washington DC. Available at: http://www.indexmeasures.com/dc2008/finalprogram.htm

37
Wood, Robert, (2005), “A Comparison of UK Residential House Price Indexes.” In Real Estate Indicators and Financial Stability, Bank of International Settlements Papers 21, 212–217. Proceedings of a joint Conference Organized by the BIS and IMF in Washington DC 27–28 October, 2003.