sensitivity of fit indexes to misspecified structural or measurement model components...
TRANSCRIPT

Sensitivity of Fit Indexes to MisspecifiedStructural or Measurement Model
Components: Rationale of Two-IndexStrategy Revisited
Xitao FanUniversity of Virginia
Stephen A. SivoUniversity of Central Florida
In previous research (Hu & Bentler, 1998, 1999), 2 conclusions were drawn: stan-dardized root mean squared residual (SRMR) was the most sensitive to misspecifiedfactor covariances, and a group of other fit indexes were most sensitive to mis-specified factor loadings. Based on these findings, a 2-index strategy—that is, SRMRcoupled with another index—was proposed in model fit assessment to detect poten-tial misspecification in both the structural and measurement model parameters.Based on our reasoning and empirical work presented in this article, we conclude thatSRMR is not necessarily most sensitive to misspecified factor covariances (structuralmodel misspecification), the group of indexes (TLI, BL89, RNI, CFI, Gamma hat,Mc, or RMSEA) are not necessarily more sensitive to misspecified factor loadings(measurement model misspecification), and the rationale for the 2-index presenta-tion strategy appears to have questionable validity.
The assessment of model fit in structural equation modeling (SEM) has long beena thorny issue in SEM application. As a result, the issues related to model fit as-sessment in SEM analysis have been at the forefront of theoretical and empiricalresearch over the years. Research in this area has focused on different issues con-cerning the use and interpretation of model fit indexes. Studies typically examinedthe performance characteristics of different fit indexes under different data condi-
STRUCTURAL EQUATION MODELING, 12(3), 343–367Copyright © 2005, Lawrence Erlbaum Associates, Inc.
Requests for reprints should be sent to Xitao Fan, EDLF, Curry School of Education, University ofVirginia, 405 Emmet Street South, Charlottesville, VA 22903–2495. E-mail: [email protected]

tions; for example, sample size, estimation methods, and model misspecification(e.g., Fan, Thompson, & Wang, 1999; Fan & Wang, 1998; Gerbing & Anderson,1993; Marsh, Balla, & Hau, 1996). More recently, research shifted to the search forempirically based cutoff criteria for model fit indexes, with the intention of provid-ing more definitive guidelines for evaluating model fit (Enders & Finney, 2003; Hu& Bentler, 1998, 1999; Yu & Muthén, 2002).
TYPES OF MISSPECIFICATIONAND TWO-INDEX STRATEGY
As of now, the most influential studies in this line of research are those by Hu andBentler (1998, 1999). Their studies concluded that different fit indexes are differ-entially sensitive to either measurement model misspecification (e.g., a mis-specified factor loading) or structural model misspecification (e.g., a misspecifiedcovariance between two factors; Hu & Bentler, 1998). More specifically, two con-clusions were drawn: (a) standardized root mean squared residual (SRMR) was themost sensitive to the misspecified factor covariances (misspecified structuralmodel components), and (b) a group of other fit indexes (Tucker–Lewis Index[TLI], Bollen’s delta [BL89], Relative Centrality Index [RNI], Comparative Fit In-dex [CFI], Gamma hat [Gamma], McDonald’s Centrality Index [Mc], and RootMean Squared Error of Approximation [RMSEA]) were most sensitive tomisspecified factor loadings (misspecified measurement model components).
These conclusions naturally led to the proposal (Hu & Bentler, 1998) of atwo-index strategy for model fit assessment: SRMR is always needed because ofits sensitivity to misspecified structural model components, and another fit index(TLI, BL89, RNI, CFI, Gamma, Mc, or RMSEA) is also needed because of its sen-sitivity to misspecified measurement model components. Subsequently, some em-pirically based cutoff criteria for fit indexes were proposed (Hu & Bentler, 1999) inmodel fit assessment. The two-index strategy and the proposed cutoff criteria forfit indexes in model fit assessment have been gaining popularity in SEM applica-tions (e.g., Corten et al., 2002; DiStefano, 2002; Glaser, 2001, 2002; Moulder &Algina, 2002; Pomplun & Omar, 2001).
These new developments on SEM model fit assessment have broken newground. However, a close examination of these pioneering studies reveals that twoimportant issues stand out: (a) The severity of model misspecification has not beenquantified nor adequately controlled, making the internal validity of the conclu-sions from these studies questionable; and (b) there is an obvious lack of diversityin terms of the models and model parameters examined, raising the concern aboutthe external validity (generalizability) of these conclusions.
To extend this line of research, Yu and Muthén (2002) incorporated categoricalvariables in their SEM models. Enders and Finney (2003) considered some impor-
344 FAN AND SIVO

tant issues such as model complexity, choice of population parameter values, andthe issue of differential power for misspecified SEM models. The findings fromEnders and Finney suggest that the proposed cutoff criteria had limited generaliza-bility, and did not fare well under different model and data conditions. More re-cently, Marsh, Hau, and Wen (2004) provided more detailed comments and analy-ses on the utility of using the proposed cutoff criteria in model fit assessment.Based on both theoretical and empirical grounds, Marsh, Hau, and Wen high-lighted some important issues and problems in the practice of using the proposedcutoff criteria in model fit assessment within the framework of hypothesis testing.
SEVERITY OF MODEL MISSPECIFICATION
One critical issue that has not been adequately addressed in this area of research isseverity (degree) of model misspecification. As discussed in Fan et al. (1999) andFan and Wang (1998), model misspecification is a difficult issue, both because ofthe ambiguity and lack of efforts in quantifying the severity of misspecification,and because of the variety of forms in which model misspecification can occur. It istypically not very useful to just explain what has been misspecified in a model(e.g., a factor loading is fixed to zero). It is much more important and informativeto specify the severity of misspecification. In other words, misspecification condi-tions should be quantified so that different misspecified models (e.g., a model withfactor loadings misspecified, and a model with factor covariance misspecified) canbe compared in terms of severity of misspecification. Unfortunately, this issue isnot typically addressed, except in Enders and Finney’s (2003) study in which thestatistical power for rejecting the misspecified models was considered. This issuehas important implications that are discussed later.
When we evaluate the sensitivity of fit indexes to different types of mis-specification, it is logical that severity of misspecification should be considered. Itappears that the most sensible approach is to use the noncentrality parameter (i.e.,noncentral χ2), and its associated statistical power for rejecting the misspecifiedmodel, to describe the severity of misspecification. The noncentrality parameterdescribes the amount of shift from central to noncentral χ2 distributions due tomodel misspecification, regardless of the types of misspecification (e.g., mis-specification in measurement vs. in structural components in a model).
The noncentrality parameter, together with its associated degrees of freedom,determines the statistical power for statistically rejecting the misspecified model.As a result, the statistical power for rejecting the misspecified model is blind to thetypes of model misspecification. It is thus reasonable to say that, if the power forrejecting two different misspecified models is comparable, the severity of mis-specification for the two misspecified models should be considered comparable.
SENSITIVITY OF MODEL FIT INDEXES 345

RATIONALE OF THE TWO-INDEX STRATEGY
Hu and Bentler (1998) considered two confirmatory factor analysis (CFA) modelswith different types of misspecifications, as shown in Figure 1. These two modelswere named simple (Figure 1a) and complex (Figure 1b) models, respectively.
In the simple model, misspecification occurred when the covariance(s) amongthe latent factors were misspecified to be zeros. There were two levels of mis-specified simple model: In the first, one factor covariance was misspecified to be 0(s12 = 0 in Figure 1a); in the second, two covariances were misspecified to be 0(both s12 = 0 and s13 = 0 in Figure 1a). In the complex model, the factor loadings(measurement model components) were misspecified. Again, there were two lev-
346 FAN AND SIVO
FIGURE 1 Simple and complex models.

els of misspecified complex model: In the first, one pattern coefficient wasmisspecified to be 0 (λ13 = 0 in Figure 1b); in the second, two coefficients weremisspecified to be 0 (both λ13 = 0 and λ42 = 0 in Figure 1b).
Based on Monte Carlo simulation work that involved multiple design factors(e.g., model misspecification, sample size, estimation method, data distributionshape), two observations were made. First, the correlations among 15 different fitindexes (Hu & Bentler, 1998, Table 3) suggested two main clusters of fit indexes,with Normed Fit Index (NFI), Fit Index by Bollen (BL86; 1986), Goodness-of-FitIndex (GFI), Adjusted Goodness-of-Fit Index (AGFI), Rescaled Akaike’s Infor-mation Criterion (CAK), and a Cross-validation Index (CK) being in one group,and TLI, BL89, RNI, CFI, Mc, and RMSEA forming another group. SRMR, how-ever, was the least similar to either of these two clusters of fit indexes. This obser-vation suggested a multifactor view for the fit indexes.
Second, the sensitivity of fit indexes to the two types of misspecification(misspecified factor covariances vs. misspecified factor loadings) was compared.The sensitivity of a fit index to model misspecification was quantified as the per-centage of the total variation of a fit index attributable to the design factor of modelmisspecification. Quantitatively, percentage of variation attributable to a designfactor is the η2 (η2 =Sum of Squares source / Sum of Squares total) derived from ananalysis of variance (ANOVA) model. For a fit index, a large η2 attributable to thedesign factor of model misspecification suggests high sensitivity of the index tomodel misspecification conditions. This approach is sensible, and it has been usedby other researchers studying similar issues (e.g., Fan & Wang, 1998).
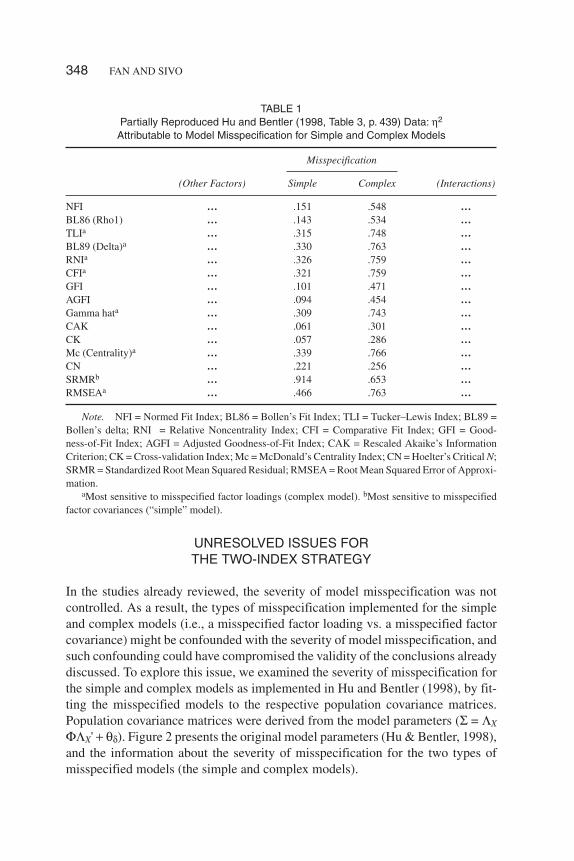
Hu and Bentler (1998) concluded that (a) SRMR was the most sensitive to thecondition of misspecified factor covariances (simple model), and (b) a group ofother fit indexes (TLI, BL89, RNI, CFI, Gamma, Mc, and RMSEA) were mostsensitive to the condition of misspecified factor loadings (complex model). Table 1reproduces a small portion of a table in Hu and Bentler (1998, Table 3, on p. 439) toillustrate these findings.
Table 1 shows that, for the simple model (misspecified factor covariances), the η2
for SRMR (.914) is substantially larger than that (.653) for the complex model(misspecified factor loadings). On the other hand, for a group of other fit indexes(TLI, BL89, RNI, CFI, Gamma, Mc, and RMSEA), the η2s for the complex model(misspecified factor loadings) are much larger than those for the simple model(misspecified factor covariance). These findings led to the conclusions that (a)SRMR is the most sensitive to misspecified factor covariances (structural modelmisspecification), (b) a group of other fit indexes are most sensitive to misspecifiedfactor loadings (measurement model misspecification), and (c) to detectmisspecification in both the structural and measurement model components, atwo-index strategy should be used: SRMR coupled with another index (TLI, BL89,RNI, CFI, Gamma, Mc, or RMSEA). Subsequently, based on simulation work in-volving the same models and model misspecification conditions (see Figure 1), cut-off criteria for these indexes were proposed (Hu & Bentler, 1999).
SENSITIVITY OF MODEL FIT INDEXES 347
UNRESOLVED ISSUES FORTHE TWO-INDEX STRATEGY
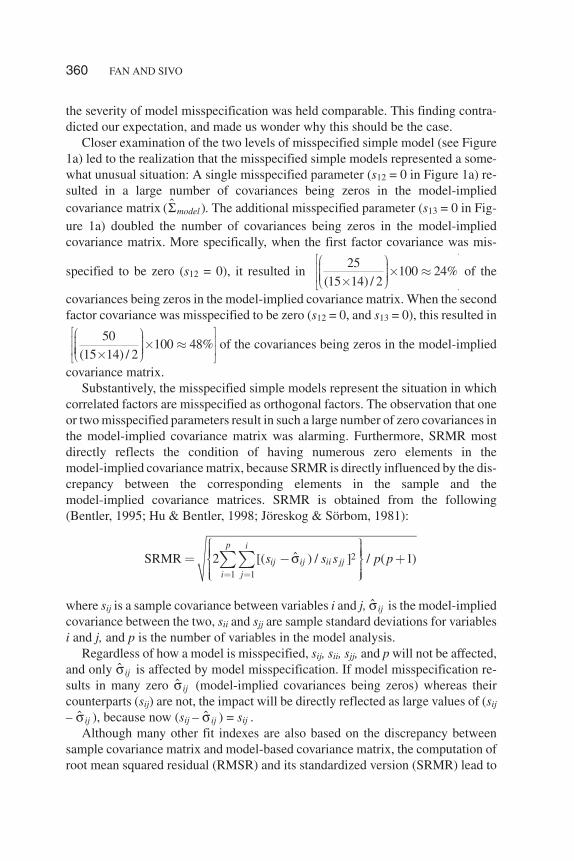
In the studies already reviewed, the severity of model misspecification was notcontrolled. As a result, the types of misspecification implemented for the simpleand complex models (i.e., a misspecified factor loading vs. a misspecified factorcovariance) might be confounded with the severity of model misspecification, andsuch confounding could have compromised the validity of the conclusions alreadydiscussed. To explore this issue, we examined the severity of misspecification forthe simple and complex models as implemented in Hu and Bentler (1998), by fit-ting the misspecified models to the respective population covariance matrices.Population covariance matrices were derived from the model parameters (Σ = ΛX
ΦΛX' + θδ). Figure 2 presents the original model parameters (Hu & Bentler, 1998),and the information about the severity of misspecification for the two types ofmisspecified models (the simple and complex models).
348 FAN AND SIVO
TABLE 1Partially Reproduced Hu and Bentler (1998, Table 3, p. 439) Data: η2
Attributable to Model Misspecification for Simple and Complex Models
Misspecification
(Other Factors) Simple Complex (Interactions)
NFI … .151 .548 …BL86 (Rho1) … .143 .534 …TLIa … .315 .748 …BL89 (Delta)a … .330 .763 …RNIa … .326 .759 …CFIa … .321 .759 …GFI … .101 .471 …AGFI … .094 .454 …Gamma hata … .309 .743 …CAK … .061 .301 …CK … .057 .286 …Mc (Centrality)a … .339 .766 …CN … .221 .256 …SRMRb … .914 .653 …RMSEAa … .466 .763 …
Note. NFI = Normed Fit Index; BL86 = Bollen’s Fit Index; TLI = Tucker–Lewis Index; BL89 =Bollen’s delta; RNI = Relative Noncentrality Index; CFI = Comparative Fit Index; GFI = Good-ness-of-Fit Index; AGFI = Adjusted Goodness-of-Fit Index; CAK = Rescaled Akaike’s InformationCriterion; CK = Cross-validation Index; Mc = McDonald’s Centrality Index; CN = Hoelter’s Critical N;SRMR = Standardized Root Mean Squared Residual; RMSEA = Root Mean Squared Error of Approxi-mation.
aMost sensitive to misspecified factor loadings (complex model). bMost sensitive to misspecifiedfactor covariances (“simple” model).

349
“Simple” Model Parameters:
“Complex” Model Parameters:
Non-comparable Severity of Misspecification for Simple and Complex Models(N = 100)
χ2 df Powera
Simple model (factor covariances misspecified)One misspecified factor covariance 20.83 88 0.43Two misspecified factor covariances 28.33 89 0.61Complex model (factor pattern coefficients misspecified)One misspecified factor loading 40.68 85 0.84Two misspecified factor loadings 75.11 86 0.99
aPower estimation is based on Satorra-Saris method (Satorra & Saris, 1993; Saris & Satorra,1983).
FIGURE 2 Original model parameters in Hu and Bentler (1998) and severity of misspeci-fication.
1.00
.50 1.00
.40 .30 1.00
� �� �� �� � �� �� �� �
�
.70 .70 .75 .80 .80 .00 .00 .00 .00 .00 .00 .00 .00 .00 .00
( ) .00 .00 .00 .00 .00 .70 .70 .75 .80 .80 .00 .00 .00 .00 .00
.00 .00 .00 .00 .00 .00 .00 .00 .00 .00 .70 .70 .75 .80 .80
X Transposed �
� �� �� �� �� �� �� �
�
� ( ) .51 .51 .4375 .36 .36 .51 .51 .4375 .36 .36 .51 .51 .4375 .36 .36Diagonal ���
.70 .70 .75 .80 .80 .00 .00 .00 .00 .00 .00 .00 .00 .00 .00
( ) .00 .00 .00 .70 .00 .70 .70 .75 .80 .80 .00 .00 .00 .00 .00
.70 .00 .00 .00 .00 .00 .00 .00 .70 .00 .70 .70 .75 .80 .80
[ ]
[ ]
X Transposed
same as above
same as above
�
�
� �� �� �� �� �� �� �
��
�
�
�

The χ2s in the table embedded in Figure 2 are actually noncentrality parametersfor the misspecified models. For a misspecified model fitted to the populationcovariance matrix, the nonzero χ2 value represents the shift from central χ2 tononcentral χ2; that is, the noncentrality parameter. Figure 2 shows that the severityof model misspecification is different for the simple and complex models. Basedon the estimated statistical power (Saris & Satorra, 1993; Satorra & Saris, 1983)for rejecting the misspecified models, misspecification is less severe for themisspecified simple models (for α = .05, power = .43 and .61, respectively, for re-jecting the two misspecified simple models) than for the misspecified complexmodels (for α = .05, power = .84 and .99, respectively, for rejecting the twomisspecified complex models). This indicates that severity of misspecification isconfounded with types of misspecification. Here and elsewhere in the article, weuse the estimated noncentrality and its associated statistical power to operationallydefine severity of misspecification. This approach was used primarily because weare not aware of a better approach for this purpose. We are, however, open to othersuggestions or alternative approaches.
The information in Figure 2 indicates that it may not be the types of mis-specification (misspecified factor covariances vs. factor loadings) that contributedto the results observed by Hu and Bentler (1998; see Table 1), but rather, the sever-ity of misspecification. The confounding between types of misspecification andseverity of misspecification may have undermined the validity of the previous con-clusion that some indexes (TLI, BL89, RNI, CFI, Gamma, Mc, and RMSEA) weremore sensitive to misspecified factor loadings, whereas SRMR was more sensitiveto misspecified factor covariances.
PURPOSE AND SCOPE OF THE STUDY
This study intended to evaluate the validity of the two-index strategy by partiallyreplicating the study by Hu and Bentler (1998). The critical issue in this replicationdesign was to control the severity of model misspecification. The findings from theprevious studies (Hu & Bentler, 1998, 1999) were not based on appropriate studydesign; consequently, the confounding of severity of misspecification and types ofmisspecification might have led to incorrect conclusions. Before the proposedtwo-index strategy and the related cutoff criterion of fit indexes can be embracedby SEM researchers in general, the issues raised in this article should be addressed.
It is important to point out that this study was limited to the evaluation of the ra-tionale of the two-index strategy, but there was no attempt to study the implemen-tation of the two-index strategy in the form of using cutoff values of fit indexes inmodel fit assessment. In this regard, Marsh et al. (2004) recently provided detailedcomments and analyses on the utility of using the proposed cutoff criteria in SEMmodel fit assessment, and they highlighted some issues and problems in such prac-
350 FAN AND SIVO

tice. Although the article by Marsh et al. may appear to be similar to this article, theissues discussed here are actually different from those in Marsh et al. Because thescope of this study is much narrower compared with those by Hu and Bentler(1998, 1999), and many issues addressed by Hu and Bentler were not studied inthis article, this study should not be considered a full replication of the Hu andBentler studies.
METHODS
Models and Model Misspecification
A Monte Carlo simulation experiment was conducted to study the issues previ-ously discussed. The same two CFA models (simple and complex models; see Fig-ure 1) as those in Hu and Bentler (1998, 1999) were used in this study, and themisspecified components in the simple and the complex models were identical tothose in Hu and Bentler (1998, 1999). The purpose of this study requires that theseverity of misspecification for the simple and complex models be comparable. Toaccomplish this, population model parameters were adjusted in such a way that themisspecified simple (misspecified factor covariances) and the complex (mis-specified factor loadings) models had comparable severity of misspecification. Forthe purpose of providing a broader context for model misspecification, we createdtwo conditions of misspecifications: slight misspecification (Condition I) andmoderate misspecification (Condition II). Under each condition, there were twolevels of misspecification for the simple and the complex models, in the same man-ner as shown in Figure 1, and the two levels of misspecification for the simple andthe complex models represented comparable degrees of misspecification.
The slight misspecification condition (Condition I) mirrors the degree ofmisspecification for the original simple model in Hu and Bentler (1998), as shownin Figure 2 . This condition was created by adjusting the complex model parametervalues in the �X matrix (factor pattern coefficients) such that the severity ofmisspecification for the two misspecified complex models would be comparable tothe original misspecified simple models in Hu and Bentler (1998). The adjustedcomplex model �X matrix is shown here (two underlined parameters, adjusteddown from the original parameter of 0.70; see original complex model in Figure 2for comparison):
SENSITIVITY OF MODEL FIT INDEXES 351
.70 .70 .75 .80 .80 .00 .00 .00 .00 .00 .00 .00 .00 .00 .00
( ) .00 .00 .00 .28 .00 .70 .70 .75 .80 .80 .00 .00 .00 .00 .00
.455 .00 .00 .00 .00 .00 .00 .00 .70 .00 .70 .70 .75 .80 .80
X Transposed �
� �� �� �� �� �� �� �� �
�

Except for the parameter adjustments just shown, all other parameters are ex-actly the same as those in Figure 2. The upper panel of Table 2 shows that, afterthese adjustments in the �X matrix, the statistical power for rejecting themisspecified simple and complex models is comparable.
Under the moderate misspecification condition (Condition II), the severity ofmisspecification mirrors that of the original complex models in Hu and Bentler(1998) in Figure 2. This condition was created by adjusting the simple model pa-rameters in the � matrix (factor covariance matrix) such that the severity ofmisspecification for the two misspecified simple models would be comparable tothe original misspecified complex models in Hu and Bentler (1998). The adjustedsimple model parameters in the � matrix are shown here (three underlined param-eters, adjusted up from the original parameters of .50, .40, and .30, respectively;see the original simple model parameters in Figure 2 for comparison):
Except for these parameter adjustments in the � matrix, all other parametersare exactly the same as those in Figure 2. The lower panel of Table 2 shows that, af-
352 FAN AND SIVO
TABLE 2Two Misspecification Conditions With Comparable Severity
of Misspecification for Simple and Complex Models
χ2 df Powera
Misspecification condition I (slight misspecification)Simple model (factor covariances misspecified)
One misspecified factor covariance 20.83 88 0.43Two misspecified factor covariances 28.33 89 0.61
Complex model (pattern coefficients misspecified)One misspecified factor loading 20.47 85 0.43Two misspecified factor loadings 27.82 86 0.61
Misspecification condition II (moderatemisspecification)Simple model (factor covariances misspecified)
One misspecified factor covariance 41.24 88 0.84Two misspecified factor covariances 75.75 89 0.99
Complex model (pattern coefficients misspecified)One misspecified factor loading 40.68 85 0.84Two misspecified factor loadings 75.11 86 0.99
aPower estimation is based on Satorra–Saris method (Satorra & Saris, 1993; Saris & Satorra, 1983)for N = 100.
1.00
.67 1.00
.747 .50 1.00
� �� �� �
� � �� �� �� �� �
�

ter these adjustments made in the � matrix, the statistical power for rejecting themisspecified simple and complex models is comparable.
Monte Carlo Simulation Design and Data Conditions
This study considered multivariate normal data only. Although other studies in thisarea typically involved nonnormal data conditions, not enough is known about theissues under study even when the data conditions are ideal. The decision was madeto evaluate these issues under ideal data conditions without the potential complica-tion of nonnormal data conditions.
Both maximum likelihood (ML) and generalized least squares (GLS) estima-tion methods were used, and these two estimation methods were implemented sep-arately. Under each of the two misspecification conditions (slight vs. moderate),there were two models (the simple model and the complex model), with eachmodel having three levels of misspecification (true model with no misspecifi-cation, a model with one parameter misspecified, and a model with two parametersmisspecified). Ten sample size conditions were implemented, ranging from 150 to1,500 at an interval of 150. Under each sample size condition, 500 random samples(i.e., replications) were generated based on the population covariance matrices forthe simple and complex models, respectively. This Monte Carlo simulation designcalled for the generation of 40,000 samples (2 × 2 × 2 × 10 × 500). Because eachsample dataset was fitted to each of three levels of misspecified model (simple andcomplex models, respectively)—the true model, the model with one misspecifiedparameter, and the model with two misspecified parameters (see Figure 1)—the to-tal number of model fittings was 120,000 (40,000 × 3). Relevant model fit indexesfrom each model fitting were saved for later analyses.
Data Source and Analyses
Based on the matrix decomposition procedures (Fan, Felsovalyi, Sivo, & Keenan,2002; Kaiser & Dickman, 1962), data were simulated using a combination of SASmacro, SAS BASE, and SAS PROC IML (Interactive Matrix Language). Modelfitting and estimation were implemented through SAS/PROC CALIS. For eachrandom sample fitted to the three levels of misspecified models, the appropriate fitindexes were saved and accumulated for later analyses.
ANOVA was conducted for each fit index, with the fit index value as the de-pendent variable, and sample size (10 levels) and model misspecification (threelevels: true model, one misspecified parameter, two misspecified parameters), andthe interaction between the two, as the independent variables. ANOVA was con-ducted separately for the simple and complex models, separately for ML and GLSestimation conditions, and separately for Condition I and Condition II of mis-specification. The same 15 fit indexes used in Hu and Bentler (1998) were evalu-ated. For each index, the Type III sum of squares attributable to each factor
SENSITIVITY OF MODEL FIT INDEXES 353

( )SSsourceIII and the total sum of squares (SStotal) were used to compute
η η2 2: .sourcesourceIII
total
SS
SS� The η2 represents the percentage of variation in a fit index
attributable to a factor in the ANOVA model (e.g., sample size, model mis-specification). As discussed previously, because a fit index is designed to detectmodel misspecification, ideally a large proportion of variation in a fit index wouldbe attributable to misspecification conditions. In other words, the η2 value for a fitindex represents the sensitivity of the fit index to misspecified model conditions.
RESULTS AND DISCUSSION
The upper panel of Table 3 presents the correlations among the fit indexes for thedesign conditions previously discussed. Hu and Bentler (1998) discussed that thecorrelation pattern of the fit indexes suggested multiple clusters of fit indexes: NFI,BL86, GFI, AGFI, CAK, and CK appeared to form a cluster, whereas TLI, BL89,RNI, CFI, Mc, and RMSEA grouped into another cluster. SRMR was the least sim-ilar to either of the two groups.
Examination of the upper panel of Table 3 shows that, after controlling for the se-verity of model misspecification in this study, correlation patterns similar to those inHu and Bentler (1998) were also observed. SRMR showed lower correlations withother fit indexes in general, although not nearly as low as those shown in Hu andBentler (1998, Table 3). This suggests the possible multifactor view for the fit in-dexes. To evaluate this proposition, an exploratory factor analysis was conducted forthe fit indexes. Because CAK, CK, and CN are qualitatively different from other fitindexes, and typically, they are not used as stand-alone indexes for evaluating modelfit, these three indexes were excluded in the exploratory factor analysis.
The results of the exploratory factor analysis indicated that a single factor ade-quately explains the correlation pattern among the fit indexes (the upper panel ofTable 3). For the 12 fit indexes included in the analysis, the first three eigenvalues(principal component extraction) were 10.64, 0.79, and 0.46, respectively, indicat-ing that a single dominant factor was sufficient in accounting for the correlationpattern among the fit indexes (89% of variance accounted for by this single factor).Another extraction method (e.g., principal factor extraction) led to the same con-clusion. So for the design conditions implemented in this study, it appears thatthere is insufficient evidence to conclude that a multifactor view of the fit indexesshould be adopted. The transposed vector of the pattern coefficients (based onprincipal component extraction) on this single factor is shown here:
354 FAN AND SIVO
NFI BL86 TLI BL89 RNI CFI GFI AGFI GAMMA Mc SRMR RMSEA
.95 .95 .98 .98 .98 .98 .91 .90 .98 .98 .72 .95P �
� �
� �� �� �� �

355
TABLE 3Correlations Among Fit Indexes (Maximum Likelihood Estimation)
1 2 3 4 5 6 7 8 9 10 11 12 13 14 15
Complex and Original Simple Models (Comparable Misspecification Severity)1. NFI2. BL86 (Rho1) 0.9993. TLI 0.881 0.8794. BL89 (Delta) 0.880 0.877 0.9995. RNI 0.882 0.879 0.999 0.9996. CFI 0.886 0.883 0.998 0.999 0.9997. GFI 0.960 0.968 0.822 0.814 0.817 0.8208. AGFI 0.952 0.960 0.813 0.804 0.807 0.810 0.9999. Gamma hat 0.871 0.871 0.995 0.993 0.993 0.992 0.833 0.826
10. CAK –0.942 –0.947 –0.705 –0.700 –0.703 –0.709 –0.962 –0.960 –0.70811. CK –0.934 –0.939 –0.685 –0.680 –0.684 –0.690 –0.956 –0.954 –0.689 0.99912. Mc Centrality 0.870 0.869 0.994 0.992 0.992 0.990 0.833 0.826 0.999 –0.705 –0.68513. CN 0.735 0.740 0.651 0.648 0.648 0.650 0.754 0.753 0.653 –0.688 –0.680 0.66514. SRMR –0.682 –0.662 –0.708 –0.724 –0.723 –0.724 –0.504 –0.478 –0.667 0.496 0.484 –0.672 –0.54015. RMSEA –0.850 –0.851 –0.958 –0.955 –0.955 –0.951 –0.829 –0.823 –0.963 0.691 0.673 –0.971 –0.761 0.677
(continued)

356
TABLE 3 (Continued)
1 2 3 4 5 6 7 8 9 10 11 12 13 14 15
Complex and Original Simple Models (Comparable Misspecification Severity)1. NFI2. BL86 (Rho1) 0.9993. TLI 0.920 0.9184. BL89 (Delta) 0.919 0.916 0.9995. RNI 0.921 0.918 0.999 0.9996. CFI 0.923 0.920 0.998 0.999 0.9997. GFI 0.962 0.952 0.898 0.906 0.907 0.9108. AGFI 0.970 0.961 0.904 0.911 0.912 0.914 0.9999. Gamma hat 0.913 0.912 0.996 0.995 0.995 0.994 0.899 0.905
10. CAK –0.947 –0.951 –0.763 –0.759 –0.762 –0.766 –0.892 –0.904 –0.76311. CK –0.938 –0.943 –0.745 –0.741 –0.744 –0.749 –0.883 –0.895 –0.746 0.99912. Mc Centrality 0.910 0.909 0.995 0.994 0.994 0.992 0.898 0.904 0.999 –0.760 –0.74213. CN 0.777 0.782 0.719 0.715 0.715 0.718 0.766 0.778 0.727 –0.739 –0.731 0.73614. SRMR –0.844 –0.863 –0.846 –0.828 –0.829 –0.830 –0.725 –0.749 –0.849 0.793 0.783 –0.853 –0.78615. RMSEA –0.896 –0.897 –0.971 –0.968 –0.968 –0.966 –0.884 –0.892 –0.978 0.756 0.739 –0.983 –0.796 0.877
Note. NFI = Normed Fit Index; BL86 = Bollen’s Fit Index; TLI = Tucker–Lewis Index; BL89 = Bollen’s delta; RNI = Relative Noncentrality Index; CFI =Comparative Fit Index; GFI = Goodness-of-Fit Index; AGFI = Adjusted Goodness-of-Fit Index; CAK = Rescaled Akaike’s Information Criterion; CK =Cross-Validation Index; Mc = McDonald’s Centrality Index; CN = Hoelter’s Critical N; SRMR = Standardized Root Mean Squared Residual; RMSEA = RootMean Squared Error of Approximation.

Table 4 presents the η2 values for the 15 fit indexes under two conditions ofmodel misspecification (light and moderate misspecifications) obtained with MLestimation for model fitting. These are the same 15 fit indexes evaluated in Hu andBentler (1998). As explained previously, Condition I (slight misspecification) andCondition II (moderate misspecification) represent different levels of severity ofmisspecification (see Methods section for details).
The findings in Table 4 should be interpreted and discussed in relation to Table1. As shown in Table 1, for model misspecification, a group of fit indexes (TLI,BL89, RNI, CFI, Gamma, Mc, RMSEA) have much higher η2 values (~.75) underthe complex model than those under the simple model (~.35), suggesting that theseindexes are more sensitive to misspecified factor loadings (complex model) than tomisspecified factor covariances (simple model). On the other hand, SRMR has amuch higher η2 value (.91) under the simple model than under the complex model(.65), suggesting that SRMR is more sensitive to misspecified factor covariances.
As argued previously, the validity of Hu and Bentler’s (1998) results and con-clusions might have been compromised by the confounding between types ofmodel misspecification and severity of model misspecification. This argument islargely supported by the results in Table 4, obtained while holding the severity ofmodel misspecification comparable between the simple and complex models. It isobvious that the group of fit indexes (TLI, BL89, RNI, CFI, Gamma, Mc,RMSEA) had very comparable η2 values for the simple and complex models. ForCondition I (slight misspecifications), the η2 values (in the range of .85–.90) wereall comparable across the two types of models. For Condition II (moderatemisspecifications), the findings under Condition I were replicated, and the η2 val-ues were again quite comparable across the two types of misspecified models. Be-cause Condition II represented more severely misspecified models, it makes sensethat the η2 values were higher (generally above .95) than those under Condition I,because a fit index should be more sensitive to more severely misspecified models.These findings suggest that, when severity of model misspecification is controlled,these indexes are not differentially sensitive to different types of model mis-specification (misspecified factor covariance vs. misspecified factor loadings) asconcluded in Hu and Bentler (1998). Very similar results were obtained with theGLS estimation method for model fitting, as shown in Table 5.
Considerations for SRMR
The fit index SRMR was advocated (Hu & Bentler, 1998) as the most sensitive tostructural model misspecification (i.e., misspecified factor covariances). It still ap-pears to show more sensitivity to misspecified factor covariances (Table 4 for Con-dition I, η2 = .965 vs. .771 for simple and complex models, respectively; for Condi-tion II, η2 = .988 vs. .902 for simple and complex models, respectively), even when
SENSITIVITY OF MODEL FIT INDEXES 357

TABLE 4Percentage of Variance (η2) Attributable to Sample Size
and Model Misspecification for Simple and Complex Models—Maximum Likelihood Estimation
Sample Size Misspecification Interaction
Simple Complexa Simple Complex Simple Complex
Condition Ib (slight misspecifications)NFI .554 .551 .393 .382 .000 .000BL86 (Rho1) .563 .560 .382 .372 .000 .000TLIc .002 .002 .861 .843 .000 .000BL89 (Delta)c .002 .002 .864 .846 .000 .000RNIc .002 .003 .862 .844 .000 .000CFIc .005 .005 .867 .846 .001 .001GFI .624 .567 .327 .377 .000 .001AGFI .634 .577 .317 .366 .001 .001Gamma hatc .003 .003 .853 .847 .000 .000CAK .818 .829 .154 .144 .000 .000CK .833 .844 .141 .131 .000 .000Mc Centralityc .002 .002 .859 .853 .000 .000CN .216 .214 .522 .523 .214 .214SRMRd .006 .147 .965 .771 .003 .017RMSEAc .004 .004 .892 .889 .005 .006
Condition II (moderate misspecifications)NFI .169 .159 .810 .807 .000 .000BL86 (Rho1) .173 .164 .805 .801 .001 .001TLIc .001 .000 .973 .959 .000 .000BL89 (Delta)c .000 .000 .974 .960 .000 .000RNIc .001 .000 .974 .959 .000 .000CFIc .001 .001 .975 .960 .000 .000GFI .297 .182 .679 .790 .002 .002AGFI .305 .187 .671 .784 .002 .002Gamma hatc .001 .000 .968 .961 .000 .000CAK .432 .442 .548 .534 .000 .000CK .458 .470 .523 .507 .000 .000Mc Centralityc .000 .000 .970 .964 .000 .000CN .137 .136 .611 .608 .212 .214SRMRd .001 .050 .988 .902 .001 .011RMSEAc .002 .001 .965 .963 .002 .002
Note. NFI = Normed Fit Index; BL86 = Bollen’s Fit Index; TLI = Tucker–Lewis Index; BL89 =Bollen’s delta; RNI = Relative Noncentrality Index; CFI = Comparative Fit Index; GFI = Good-ness-of-Fit Index; AGFI = Adjusted Goodness-of-Fit Index; CAK = Rescaled Akaike’s InformationCriterion; CK = Cross-validation Index; Mc = McDonald’s Centrality Index; CN = Hoelter’s Critical N;SRMR = Standardized Root Mean Squared Residual; RMSEA = Root Mean Squared Error of Approxi-mation.
aSimple model: factor covariances misspecified (structural model misspecification); complexmodel: factor pattern coefficients misspecified (measurement model misspecification).The severity ofmisspecification is comparable across the two models. bUnder Condition I, misspecification is slight(see Table 2 and related discussion for details).Under Condition II, misspecification is moderate (seeTable 2 and related discussion for details). cIn Hu and Bentler (1998), these were characterized as themost sensitive to misspecified factor loadings (complex model). dIn Hu and Bentler (1998), these werecharacterized as the most sensitive to misspecified factor covariances (simple model).

359
TABLE 5Percentage of Variance (η2) Attributable to Sample Size
and Model Misspecification for Simple and Complex Models—Generalized Least Squares Estimation
Sample Size Misspecification Interaction
Simple Complexa Simple Complex Simple Complex
Condition Ib (slight misspecifications)NFI .545 .532 .410 .422 .007 .006BL86 (Rho1) .556 .544 .397 .408 .009 .008TLIc .012 .007 .816 .807 .000 .000BL89 (Delta)c .019 .014 .826 .821 .002 .001RNIc .012 .007 .818 .810 .000 .000CFIc .003 .001 .847 .842 .008 .006GFI .721 .705 .235 .244 .001 .000AGFI .730 .715 .225 .233 .001 .001Gamma hatc .021 .014 .819 .810 .004 .002CAK .898 .900 .084 .081 .001 .000CK .908 .911 .076 .073 .001 .000Mc centralityc .022 .015 .819 .811 .004 .002CN .270 .272 .470 .465 .207 .205SRMRd .013 .178 .949 .734 .003 .006RMSEAc .007 .004 .856 .850 .014 .012
Condition II (moderate misspecifications)NFI .216 .197 .748 .775 .016 .012BL86 (Rho1) .223 .204 .739 .767 .018 .013TLIc .005 .002 .938 .949 .000 .000BL89 (Delta)c .011 .007 .938 .950 .002 .001RNIc .005 .002 .939 .951 .000 .000CFIc .001 .000 .954 .964 .003 .002GFI .482 .398 .488 .571 .001 .001AGFI .491 .407 .477 .560 .002 .001Gamma hatc .014 .009 .926 .938 .003 .002CAK .761 .716 .223 .268 .001 .001CK .782 .740 .204 .245 .001 .001Mc centralityc .014 .010 .926 .938 .003 .002CN .186 .184 .550 .553 .220 .216SRMRd .002 .070 .984 .875 .001 .004RMSEAc .003 .002 .936 .940 .008 .006
Note. NFI = Normed Fit Index; BL86 = Bollen’s Fit Index; TLI = Tucker–Lewis Index; BL89 =Bollen’s delta; RNI = Relative Noncentrality Index; CFI = Comparative Fit Index; GFI = Good-ness-of-Fit Index; AGFI = Adjusted Goodness-of-Fit Index; CAK = Rescaled Akaike’s InformationCriterion; CK = Cross-validation Index; Mc = McDonald’s Centrality Index; CN = Hoelter’s Critical N;SRMR = Standardized Root Mean Squared Residual; RMSEA = Root Mean Squared Error of Approxi-mation.
aSimple model: factor covariances misspecified (structural model misspecification); complexmodel: factor pattern coefficients misspecified (measurement model misspecification). The severity ofmisspecification is comparable across the two models. bUnder Condition I, misspecification is slight(see Table 2 and related discussion for details). Under Condition II, misspecification is moderate (seeTable 2 and related discussion for details). cIn Hu and Bentler (1998), these were characterized as themost sensitive to misspecified factor loadings (complex model). dIn Hu and Bentler (1998), these werecharacterized as the most sensitive to misspecified factor covariances (simple model).
the severity of model misspecification was held comparable. This finding contra-dicted our expectation, and made us wonder why this should be the case.
Closer examination of the two levels of misspecified simple model (see Figure1a) led to the realization that the misspecified simple models represented a some-what unusual situation: A single misspecified parameter (s12 = 0 in Figure 1a) re-sulted in a large number of covariances being zeros in the model-impliedcovariance matrix ( � )Σmodel . The additional misspecified parameter (s13 = 0 in Fig-ure 1a) doubled the number of covariances being zeros in the model-impliedcovariance matrix. More specifically, when the first factor covariance was mis-
specified to be zero (s12 = 0), it resulted in of the
covariances being zeros in the model-implied covariance matrix. When the secondfactor covariance was misspecified to be zero (s12 = 0, and s13 = 0), this resulted in
of the covariances being zeros in the model-implied
covariance matrix.Substantively, the misspecified simple models represent the situation in which
correlated factors are misspecified as orthogonal factors. The observation that oneor two misspecified parameters result in such a large number of zero covariances inthe model-implied covariance matrix was alarming. Furthermore, SRMR mostdirectly reflects the condition of having numerous zero elements in themodel-implied covariance matrix, because SRMR is directly influenced by the dis-crepancy between the corresponding elements in the sample and themodel-implied covariance matrices. SRMR is obtained from the following(Bentler, 1995; Hu & Bentler, 1998; Jöreskog & Sörbom, 1981):
where sij is a sample covariance between variables i and j, �σ ij is the model-impliedcovariance between the two, sii and sjj are sample standard deviations for variablesi and j, and p is the number of variables in the model analysis.
Regardless of how a model is misspecified, sij, sii, sjj, and p will not be affected,and only �σ ij is affected by model misspecification. If model misspecification re-sults in many zero �σ ij (model-implied covariances being zeros) whereas theircounterparts (sij) are not, the impact will be directly reflected as large values of (sij
– �σ ij ), because now (sij – �σ ij ) = sij .Although many other fit indexes are also based on the discrepancy between
sample covariance matrix and model-based covariance matrix, the computation ofroot mean squared residual (RMSR) and its standardized version (SRMR) lead to
360 FAN AND SIVO
2
1 1
ˆSRMR 2 [( ) / ] / ( 1)p i
ij ij ii jji j
s s s p pσ� �
� � �� �� �� � �� �� �� �� �� ���
25100 24%
(15 14) / 2
� �� ���� �� ��� �� �� �� �� �� �
50100 48%
(15 14) / 2
� �� ���� �� ��� �� �� �� �� �� �

the expectation that the large number of zero covariances caused by the mis-specified model parameters will make this index especially sensitive to this kind ofmodel misspecification. As a result, the finding that SRMR is more sensitive tostructural model misspecification (e.g., misspecified factor covariances) may notbe generalizable beyond this condition.
To evaluate this hypothesis, a different type of misspecified factor covariancewas considered in the simple model. Instead of factor covariances being mis-specified to be zeros (s12 = 0, s13 = 0 in Figure 1a), the correlation between two fac-tors was misspecified to be 1.00 (i.e., in Figure 1a, correlation between ξ1 and ξ2,and that between ξ1 and ξ3 were misspecified to be r = 1.00). Substantively, thismisspecification represents the situation where two (highly) correlated factors aremisspecified to be the same factor. For this purpose, we created a new simplemodel with parameters in the � matrix (factor covariance matrix) being such that,when the factor correlations were misspecified to be 1.00, the severity of mis-specification for the misspecified new simple models would be comparable tothose of the original misspecified complex models in Hu and Bentler (1998). Thenew simple model’s � matrix parameters are shown here (three underlined param-eters; see the original simple model parameters in Figure 2 for comparison):
Except for these parameter adjustments in the � matrix, all other parameterswere exactly the same as those in Figure 2. Table 6 shows that the estimated statis-tical power was comparable for rejecting the misspecified new simple and com-plex models.
The first misspecified new simple model (r12 = 1.0) represents the situationwhere two correlated factors (ξ1 and ξ2) were misspecified to be the same factor,and a three-factor model was misspecified to be a two-factor model. The secondmisspecified new simple model (r12 = 1.0 and r13 = 1.0) represented the situationwhere a three-factor model was misspecified to be a one-factor model. Althoughthe misspecification was still related to factor covariances, unlike the original sim-ple model (Figure 1a), this type of misspecification for factor covariances did notforce the model-implied covariances to be zeros. In addition, the severity of modelmisspecification between the new simple model and the original complex modelwas comparable, as shown in Table 6 by the estimated power for rejecting themisspecified new simple and complex models.
The lower panel of Table 3 presents the correlations among the fit indexes underthese new conditions. The correlation pattern indicated that, in general, SRMR hadslightly lower correlations with other fit indexes, although to the same degree as
SENSITIVITY OF MODEL FIT INDEXES 361
1.00
.79 1.00
.80 .80 1.00
� �� �� �
� � �� �� �� �� �
�

shown previously (Hu & Bentler, 1998, Table 3). An exploratory factor analysiswas conducted for the fit indexes (with CAK, CK, and CN excluded). The resultsof the exploratory factor analysis suggested that a single factor explained the corre-lations among the fit indexes well. For the 12 fit indexes included in the analysis,the first three eigenvalues (principal component extraction) were 11.21, 0.41, and0.30, respectively, indicating again that a single dominant factor was sufficient inexplaining the correlations among the fit indexes (93% of variance accounted forby this single factor). The findings here suggest that, for the design conditions im-plemented in this study, there is insufficient evidence to support a multifactor viewfor the fit indexes. The transposed vector of the pattern coefficients (based on prin-cipal component extraction) on this single factor was:
Table 7 presents the percentage of variation (η2) in sample fit indexes attribut-able to the factors of sample size and model misspecification for the new simpleand the original complex models. The findings in Table 7 confirmed suspicions.Under ML estimation, the η2 for SRMR is .834 and .902 for the new simple andcomplex models, respectively. Under GLS estimation, the η2 for SRMR is .730and .875 for the new simple and complex models. So contrary to the previous ob-servation (Hu & Bentler, 1998), SRMR did not appear to be more sensitive to themisspecified factor covariances (simple model) than to the misspecified measure-ment factor loadings (complex model).
The findings in Table 7 provide support for our hypothesis: The previous con-clusion concerning SRMR (i.e., SRMR was most sensitive to misspecified factorcovariances) was very likely the result of a special type of misspecification thatcaused a large number of covariances to become zeros in the model-implied
362 FAN AND SIVO
TABLE 6Comparable Severity of Misspecification for New Simple
and Complex Models
χ2 df Powera
New simple model (factor covariances misspecified)One misspecified factor covariance 42.26 89 0.85Two misspecified factor covariances 75.67 90 1.00
Complex model (pattern coefficients misspecified)One misspecified factor loading 40.68 85 0.84Two misspecified factor loadings 75.11 86 0.99
aPower estimation is based on Satorra–Saris method (Satorra & Saris, 1993; Saris & Satorra, 1983)for N = 100.
NFI BL86 TLI BL89 RNI CFI GFI AGFI GAMMA Mc SRMR RMSEA
.96 .96 .98 .98 .98 .98 .94 .95 .98 .98 .87 .97P �
� �
� �� �� �� �

363
TABLE 7Percentage of Variance (η2) Attributable to Sample Sizeand Model Misspecification for the New Simple Modela
and the Original Complex Model
Sample Size Misspecification Interaction
Simple Complexa Simple Complex Simple Complex
Maximum likelihood estimationNFI .169 .159 .779 .807 .000 .000BL86 (Rho1) .175 .164 .772 .801 .000 .001TLIb .001 .000 .940 .959 .000 .000BL89 (Delta)b .001 .000 .942 .960 .000 .000RNIb .001 .000 .941 .959 .000 .000CFIb .001 .001 .941 .960 .000 .000GFI .092 .182 .861 .790 .001 .002AGFI .096 .187 .856 .784 .002 .002Gamma hatb .001 .000 .950 .961 .000 .000CAK .426 .442 .542 .534 .000 .000CK .452 .470 .518 .507 .000 .000Mc centralityb .000 .000 .955 .964 .000 .000CN .138 .136 .611 .608 .213 .214SRMRc .106 .050 .834 .902 .016 .011RMSEAb .002 .001 .958 .963 .002 .002
Generalized least squares estimationNFI .249 .197 .721 .775 .016 .012BL86 (Rho1) .261 .204 .706 .767 .018 .013TLIb .003 .002 .920 .949 .000 .000BL89 (Delta)b .008 .007 .928 .950 .001 .001RNIb .003 .002 .923 .951 .000 .000CFIb .000 .000 .949 .964 .002 .002GFI .542 .398 .419 .571 .000 .001AGFI .557 .407 .402 .560 .001 .001Gamma hatb .008 .009 .904 .938 .002 .002CAK .797 .716 .184 .268 .001 .001CK .815 .740 .167 .245 .001 .001Mc centralityb .008 .010 .904 .938 .002 .002CN .222 .184 .519 .553 .211 .216SRMRc .207 .070 .730 .875 .014 .004RMSEAb .002 .002 .911 .940 .008 .006
Note. NFI = Normed Fit Index; BL86 = Bollen’s Fit Index; TLI = Tucker–Lewis Index; BL89 =Bollen’s delta; RNI = Relative Noncentrality Index; CFI = Comparative Fit Index; GFI = Good-ness-of-Fit Index; AGFI = Adjusted Goodness-of-Fit Index; CAK = Rescaled Akaike’s InformationCriterion; CK = Cross-validation Index; Mc = McDonald’s Centrality Index; CN = Hoelter’s Critical N;SRMR = Standardized Root Mean Squared Residual; RMSEA = Root Mean Squared Error of Approxi-mation.
aIn this new simple model, factor correlations were misspecified to be 1.0 (instead of fixed to be ze-ros as before; structural model misspecification). The severity of misspecification is comparable for thenew simple and complex models, as shown in Table 6. bIn Hu and Bentler (1998), these were character-ized as the most sensitive to misspecified factor loadings (complex model). cIn Hu and Bentler (1998),these were characterized as the most sensitive to misspecified factor covariances (simple model).

covariance matrix. As a result, that conclusion does not appear to be generalizablebeyond that specific condition. Consequently, SRMR should not be considered themost sensitive to misspecified structural parameters in general.
CONCLUSIONS
Previously, Hu and Bentler (1998, 1999) concluded that (a) the correlation patternof the fit indexes suggests a multifactor view for the fit indexes; (b) SRMR was themost sensitive to misspecified factor covariances (i.e., misspecified structuralmodel parameters); (c) a group of other fit indexes (e.g., TLI, BL89, RNI, CFI,Gamma, Mc, or RMSEA) were the most sensitive to misspecified factor loadings(i.e., misspecified measurement model parameters); and (d) a two-index strategy isrecommended for model fit assessment: SRMR is needed (for detecting mis-specified structural model components), and it should be supplemented by anotherindex (e.g., TLI, BL89, RNI, CFI, Gamma, Mc, or RMSEA) that is sensitive tomisspecified measurement model components.
Based on our reasoning and the empirical findings presented here, we conclude:(a) there is insufficient evidence to support the multifactor view for the fit indexes;(b) SRMR is not generally most sensitive to misspecified factor covariances (struc-tural model misspecification), and (b) the group of indexes (TLI, BL89, RNI, CFI,Gamma, Mc, or RMSEA) are not more sensitive to misspecified factor loadings.Consequently, the validity of the rationale for the proposed two-index strategy is inquestion.
We argued in this article that the design problems in the previous studies (Hu &Bentler, 1998, 1999) compromised the validity of the rationale that led to thetwo-index strategy proposal. First, types of model misspecification (misspecifiedfactor covariance vs. misspecified factor loadings) and the severity of modelmisspecification were confounded, and this confounding led to the incorrect con-clusion that some indexes were differentially sensitive to different types of modelmisspecification.
Second, the misspecified factor covariances in the simple model represented asomewhat unusual type of misspecification: A large number of covariances in themodel-based covariance matrix were forced to be zeros by one or two misspecifiedfactor covariances. SRMR appears to be sensitive to this condition, thus leading tothe conclusion that it was the most sensitive to misspecified factor covariances ingeneral. This type of misspecification might not be representative of models withmisspecified structural parameter(s), and as a result, the conclusion would not gen-eralize to other kinds of structural parameter misspecification.
We partially replicated the study by Hu and Bentler (1998) to reevaluate thevalidity of the rationale of the proposed two-index strategy. In the study design,there were two important changes: (a) Two types of model misspecifications(misspecified factor covariances vs. misspecified factor loadings) had compara-
364 FAN AND SIVO

ble severity of misspecification, and (b) misspecified factor covariances did notresult in a large number of zeros in the model-based covariance matrix. Empiri-cal findings showed that the previous conclusions concerning the proposedtwo-index strategy were not supported. Consequently, SEM researchers shouldreconsider the applicability of the two-index strategy in model fit assessment inSEM applications.
It should be emphasized that this study examined the rationale for the two-indexstrategy as proposed in Hu and Bentler (1998). Hu and Bentler (1999) later ex-tended the line of research by specifying cutoff values of different indexes, and ex-amined the optimal use of the two-index strategy in making model rejection deci-sions. This study did not evaluate the actual application of the two-index strategywith regard to using specific cutoff values in making model rejection decisions (Hu& Bentler, 1999).
It is also important to point out that, although the two-index strategy and thelater proposed fit index cutoff values have become extremely popular (see moredetailed discussion on this issue in Marsh et al., 2004), Hu and Bentler (1998) werecautious about potential overgeneralization of their findings, as they discussed that“the performance of fit indices is complex and that additional research with a widerclass of models and conditions is needed, to provide final answers on the relativemerits of many of these indices” (p. 446). The findings of this study indicate thatthis caution is warranted. As suggested by Marsh et al. (2004), many SEM practi-tioners have disregarded Hu and Bentler’s (1998) caution, and overgeneralized Huand Bentler’s findings and tentative conclusions.
The reasoning and findings in this article questioned the rationale of thetwo-index strategy as advocated in Hu and Bentler (1998, 1999), but some similar-ities were observed with regard to the performance of some indexes across the twostudies. Hu and Bentler (1998) showed that a group of fit indexes (e.g., NFI, BL86,GFI, AGFI) were more sensitive to sample size condition (i.e., larger η2 values at-tributable to sample size variation), an undesirable feature of a model fit index.This finding was largely replicated in this study, as shown by the relatively largerη2 values associated with these indexes in Tables 4, 5, and 7.
Although tempting to conclude that these fit indexes were less useful because ofthis undesirable characteristic, we refrain from drawing such a definite conclusionbased on these findings. As discussed in Marsh et al. (2004), the majority of themisspecified models considered in Hu and Bentler (1998, 1999) were actually ac-ceptable models with very minor degrees of misspecification (acceptable mis-specified models). The η2 value is a relative term. It is possible that an index is notsensitive to very minor model misspecifications, and as a result, it may appear thatfactors other than model misspecification contribute to its sampling variation.However, when model misspecification becomes more unacceptable, the situationmay change. Before we discount this group of indexes as being less useful, the per-formance of these indexes should be further evaluated by involving more severemodel misspecification conditions (unacceptable misspecified models).
SENSITIVITY OF MODEL FIT INDEXES 365

Limitations
This study has some obvious limitations. First, although the confounding betweenseverity of model misspecification and types of model misspecification was tack-led, research was limited to replicating previously used models; as a result, we didnot study a wider class of models. This means that the generalizability of the find-ings in this study can be potentially limited. Future research may extend to differ-ent and more complex types of models (e.g., from CFA models to full structuralequation models with latent exogenous and endogenous variables).
Second, we concluded that SRMR may be sensitive to a large number of zerocovariances in the model-based covariance matrix. This finding, however, is notanalytically based, but empirically based. It is possible that this finding and its re-lated conclusion may not be able to stand the test of further scrutiny as future re-search involves a wider class of models and model misspecification conditions.Future research in this area may examine this issue more closely.
Third, in this study, a narrow focus on the issue of differential sensitivity of fitindexes to different types of model misspecification was chosen. As such, thisstudy did not address many other issues studied by Hu and Bentler (1998, 1999),such as those related to data distribution (e.g., nonnormality), alternative estima-tion methods (e.g., asymptotic distribution-free method [ADF]), different combi-nation rules involving fit indexes in model fit assessment, and so on.
This conclusion about the questionable validity of the rationale of the two-indexstrategy does not mean that we advocate the use of a single fit index in model fit as-sessment, instead of looking for convergence of multiple indexes. It simply meansthat the validity of the specific two-index strategy as proposed by Hu and Bentler(1998) is questionable. Because SEM researchers do not fully understand thestrengths and weaknesses of the individual fit indexes, the reliance on a single indexis more likely to lead to incorrect conclusions about model fit than relying on the tri-angulation of several fit indexes. For this reason, the use of multiple fit indexes inmodel fit assessment makes good sense. However, to use multiple fit indexes suc-cessfully in model fit assessment, we need to demonstrate that the information pro-vided by different indexes is complementary rather than redundant. The work by HuandBentler (1998,Table3)has laidsomegroundworkfor research in thisdirection.
Model fit assessment in SEM is a complicated issue that does not appear to haveclear-cut solutions at this time. The validity and generalizability of the findingsfrom any particular study, including the one presented in this article, should beevaluated in broader contexts, such as using different models with varying modelcomplexity, with different parameter values, and under different data conditions.
REFERENCES
Bentler, P. M. (1995). EQS structural equations program manual. Encino, CA: MultivariateSoftware.
366 FAN AND SIVO

Bollen, K. A. (1986). Sample size and Bentler and Bonett’s nonnormal fit index. Psychometrika, 51,375–377.
Corten, I.W.,Saris,W.E.,Coenders,G.,vanderVeld,W.,Aalberts,C.E.,&Kornelis,C. (2002).Fitofdif-ferent models for multitrait-multimethod experiments. Structural Equation Modeling, 9, 213–232.
DiStefano, C. (2002). The impact of categorization with confirmatory factor analysis. Structural Equa-tion Modeling, 9, 327–346.
Enders, C., & Finney, S. (2003, April). SEM fit index criteria re-examined: An investigation of ML androbust fit indices in complex models. Paper presented at the annual meeting of the American Educa-tional Research Association, Chicago.
Fan, X., Felsovalyi, A., Sivo, S. A., & Keenan, S. (2002) SAS for Monte Carlo studies: A guide forquantitative researchers. Cary, NC: SAS Institute.
Fan, X., Thompson, B., & Wang, L. (1999). The effects of sample size, estimation methods, and modelspecification on SEM fit indices. Structural Equation Modeling, 6, 56–83.
Fan, X., & Wang, L. (1998). Effects of potential confounding factors on fit indices and parameter esti-mates for true and misspecified SEM models. Educational and Psychological Measurement, 58,699–733.
Gerbing, D. W., & Anderson, J. C. (1993). Monte Carlo evaluations of goodness-of-fit indices for struc-tural equation models. In K. A. Bollen & J. S. Long (Eds.), Testing structural equation models (pp.40–59). Newbury Park, CA: Sage.
Glaser, D. N. (2001). [Review of A first course in structural equation modeling by Tenko Raykov &George A. Marcoulides]. Structural Equation Modeling, 8, 316–323.
Glaser, D. N. (2002). [Review of Structural equation modeling: Foundation and extensions by DavidKaplan]. Structural Equation Modeling, 9, 141–150.
Hu, L., & Bentler, P. M. (1998). Fit indices in covariance structure modeling: Sensitivity to under-parameterized model misspecification. Psychological Methods, 3, 424–453.
Hu, L., & Bentler, P. M. (1999). Cutoff criteria for fit indexes in covariance structure analysis: Conven-tional criteria versus new alternatives. Structural Equation Modeling, 6, 1–55.
Jöreskog, K. G., & Sörbom, D. (1981). LISREL V: Analysis of linear structural relationships by themethod of maximum likelihood. Chicago: National Educational Resources.
Kaiser, H. F., & Dickman, K. (1962). Sample and population score matrices and sample correlation ma-trices from an arbitrary population correlation matrix. Psychometrika, 27, 179–182.
Marsh, H. W., Balla, J. R., & Hau, K. T. (1996). An evaluation of incremental fit indices: A clarificationof mathematical and empirical properties. In G. A. Marcoulides & R. E. Schumacker (Eds.), Ad-vanced structural equation modeling: Issues and techniques (pp. 315–353). Mahwah, NJ: LawrenceErlbaum Associates, Inc.
Marsh, H. W., Hau, K. T., & Wen, Z. (2004). In search of golden rules: Comment on hypothesis-testingapproaches to setting cutoff values for fit indexes and dangers in overgeneralizing Hu and Bentler’s(1999) findings. Structural Equation Modeling, 11, 320–341.
Moulder, B. C., & Algina, J. (2002). Comparison of methods for estimating and testing latent variableinteractions. Structural Equation Modeling, 9, 1–19.
Pomplun, M., & Omar, M. H. (2001). Score comparability of a state reading assessment across selectedgroups of students with disabilities. Structural Equation Modeling, 8, 257–274.
Saris, W. E., & Satorra, A. (1993). Power evaluations in structural equation models. In K. A. Bollen & J.S. Long (Eds.), Testing structural equation models (pp. 181–204). Newbury Park, CA: Sage.
Satorra, A., & Saris, W. E. (1983). The accuracy of a procedure for calculating the power of the likeli-hood ratio test as used within the LISREL framework. In C. O. Middendorp (Ed.), Sociometric re-search 1982 (pp. 129–190). Amsterdam: Sociometric Research Foundations.
Yu, C., & Muthén, B. (2002, April). Evaluation of the model fit indices for latent variable models withcategorical and continuous outcomes. Paper presented at the annual meeting of the American Educa-tional Research Association, New Orleans, LA.
SENSITIVITY OF MODEL FIT INDEXES 367