why do nations trade . . .?
DESCRIPTION
Why Do Nations Trade . . .?. Economics is based on. Supply and Demand And Incentives. Market-Oriented Economic System. Market-Oriented Economic System includes. Basic Competitive Model: Consumers making rational choices Profit Maximizing Firms Highly competitive markets. - PowerPoint PPT PresentationTRANSCRIPT

Why Do Nations Trade . . .?

Economics is based on. . .
• Supply and Demand
And
• Incentives
Market-Oriented Economic System

Market-Oriented Economic System includes . . .
Basic Competitive Model:• Consumers making rational choices• Profit Maximizing Firms• Highly competitive markets
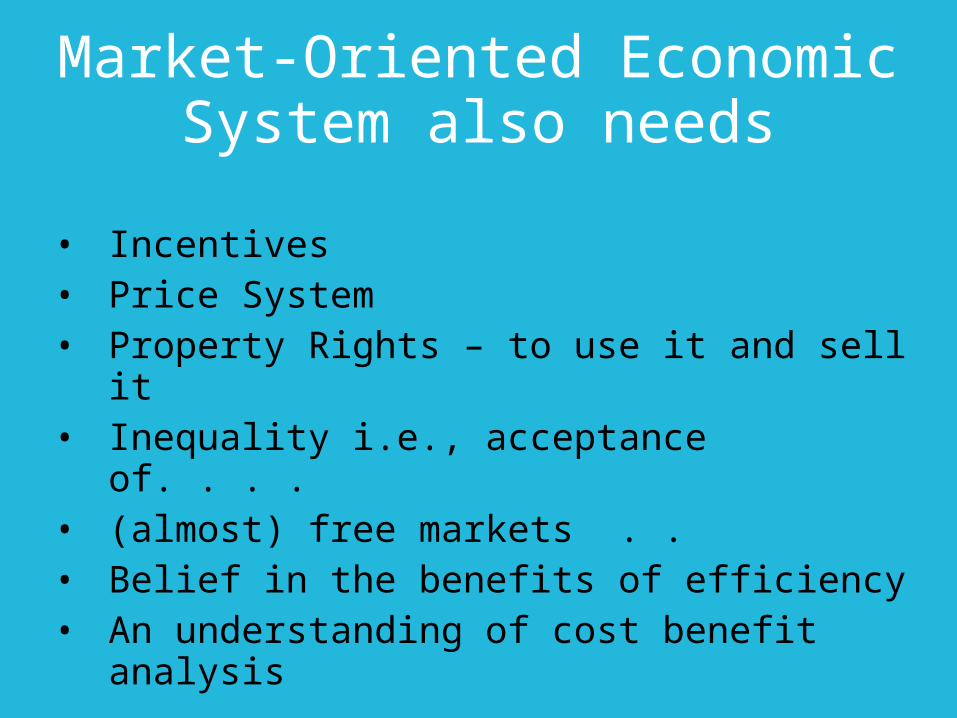
Market-Oriented Economic System also needs
• Incentives• Price System• Property Rights – to use it and sell it• Inequality i.e., acceptance of. . . .• (almost) free markets . .• Belief in the benefits of efficiency• An understanding of cost benefit analysis

Market-Oriented Economic (Price) System vs . . .
• Rationing system• Pure free market/libertarianism • Strong government regulatory system

Market-Oriented Economic (Price) System vs . . .
• Command economy• State owned enterprises• Communist• Socialism• national socialism
• Mixed market economies

Market-Oriented Economic (Price) System vs . . .
- The International economy (trade and finance, etc.) is based on a mix of economic systems, but primarily a market-based, free trade system
- Every economic system must deal with it on those terms
- The global economy – international trade, finance, investment – is more free-market than most domestic economies
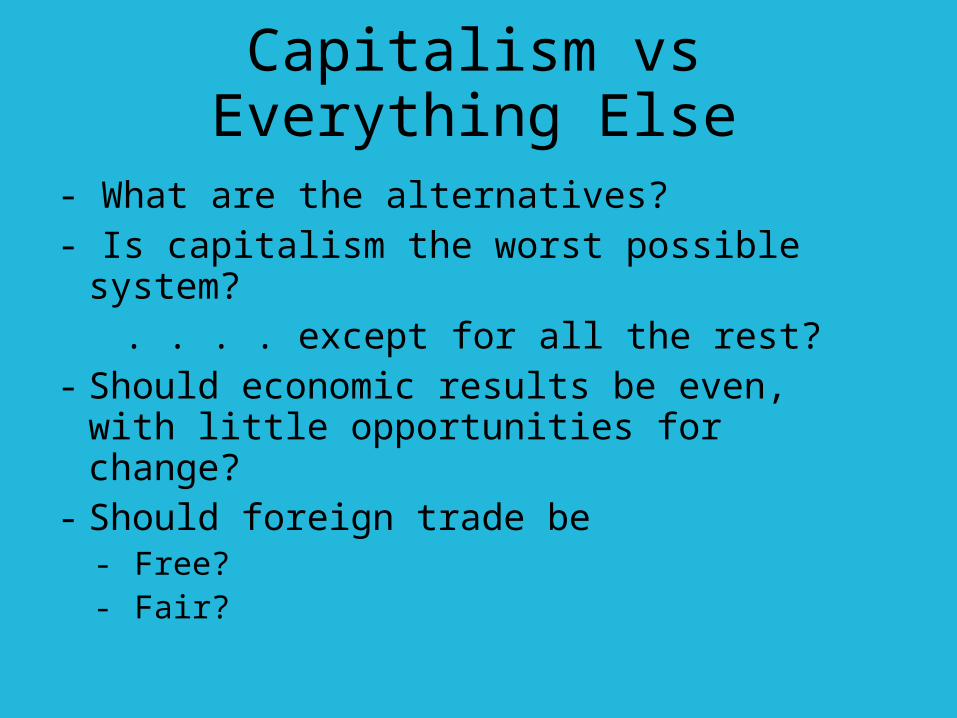
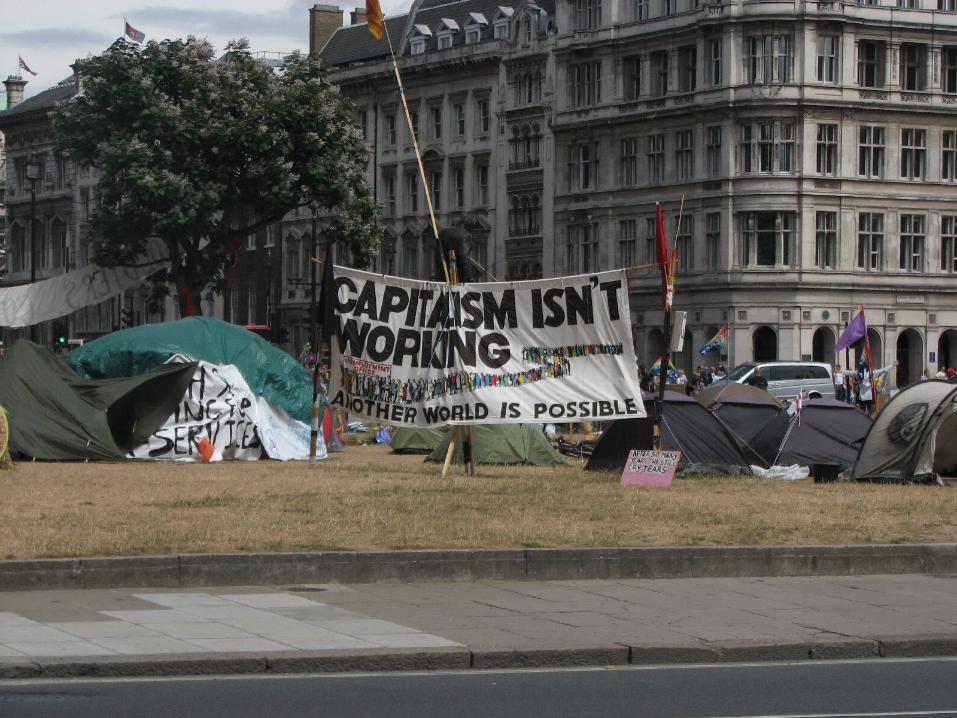
Capitalism vs Everything Else
- What are the alternatives?- Is capitalism the worst possible system? . . . . except for all the rest?- Should economic results be even, with
little opportunities for change?- Should foreign trade be
- Free?- Fair?

Bilateral vs Multilateral Trade
• Virtually all trade is multilateral• No country can just have bilateral trade• Too much emphasis on bilateral balances• Need not be a zero sum game, but gains are not equal• Exposes trading nations to external factors and makes them interdependent• Cannot survive without trade
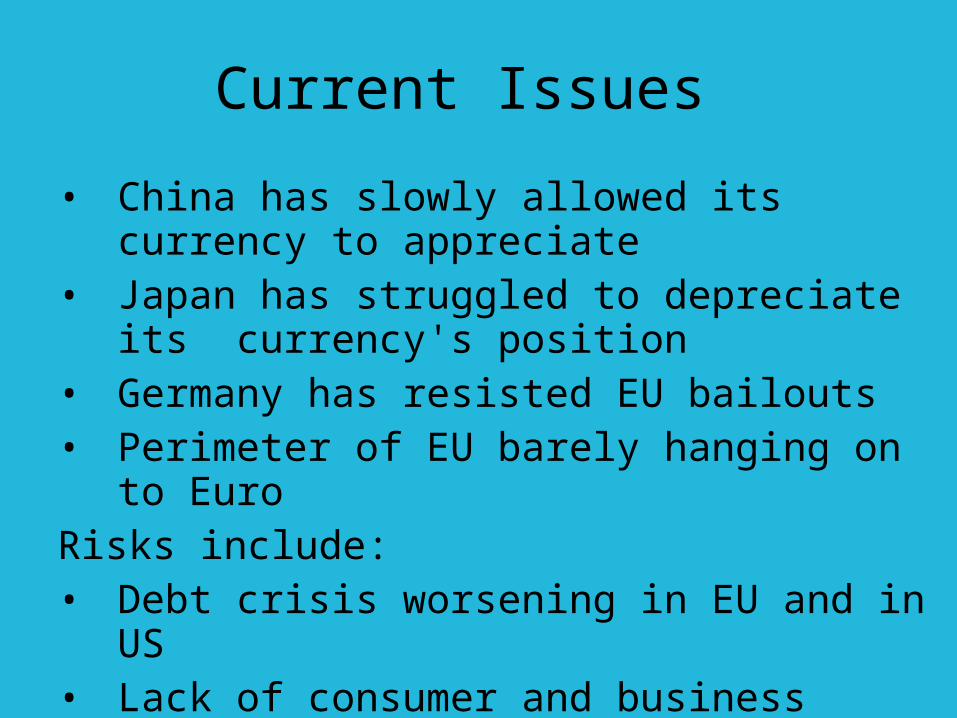
Current Issues
• China has slowly allowed its currency to appreciate
• Japan has struggled to depreciate its currency's position
• Germany has resisted EU bailouts• Perimeter of EU barely hanging on to EuroRisks include:• Debt crisis worsening in EU and in US• Lack of consumer and business
confidence
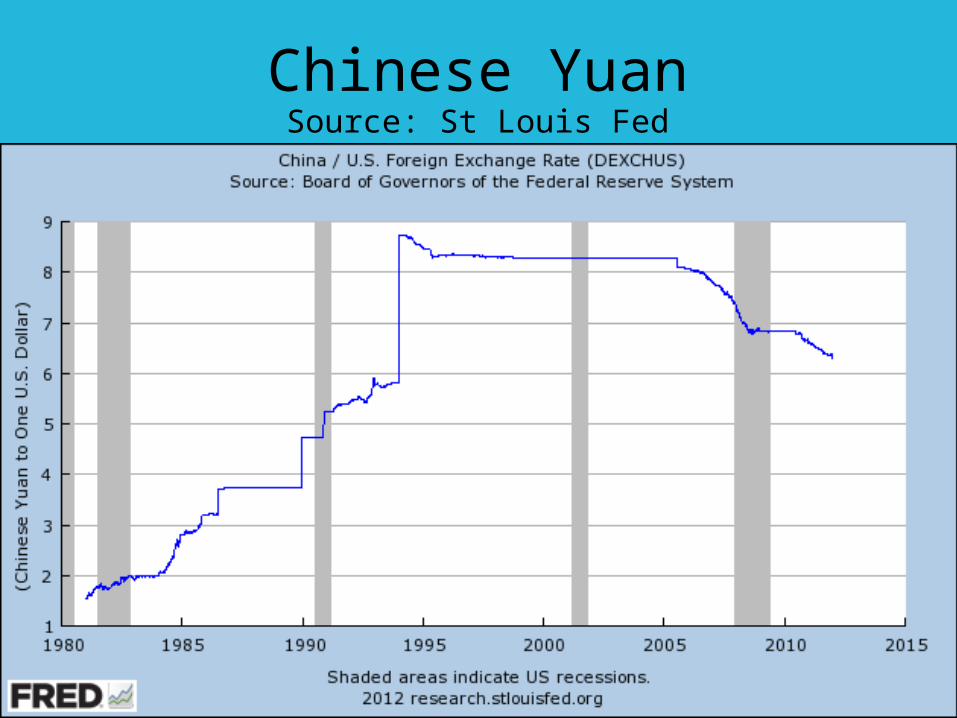
Chinese YuanSource: St Louis Fed
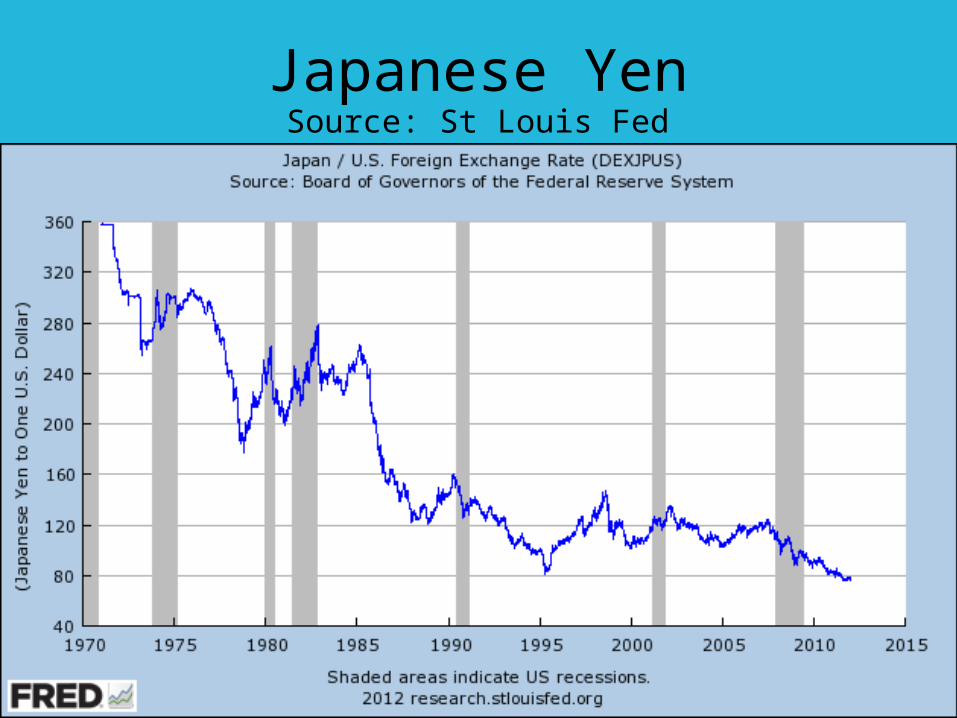
Japanese YenSource: St Louis Fed

EuroSource: St Louis Fed

Trade Weighted Value of US$Source: St Louis Fed

Daily Foreign Exchange TradingSource: BIS via WSJ
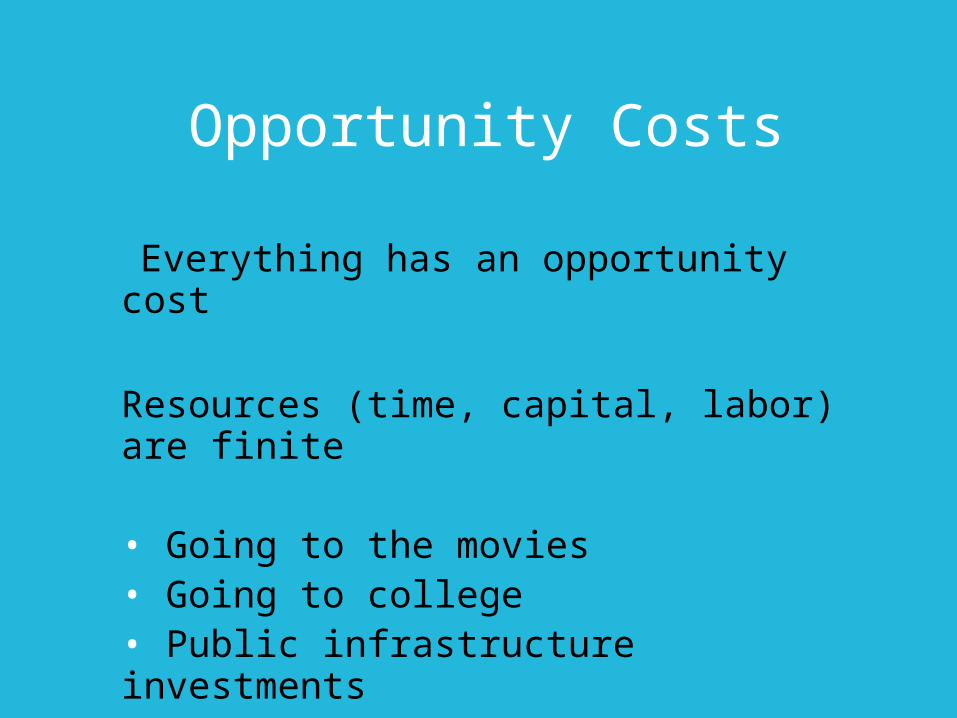
Opportunity Costs
Everything has an opportunity cost
Resources (time, capital, labor) are finite
• Going to the movies• Going to college • Public infrastructure investments • Private financial investments

Sunk Costs
• An Economic Cost – that can be discounted.
• Should take them into account before deciding, but ....
• Example: Mortgage Loan Application Fees

Marginal Costs vsMarginal Benefits
To do something or not to do something – trade offs are critical to most decisions
• Related to opportunity costs Examples• Reducing carbon emissions
- Tire pressure rules in California???• Auto safety standards

Opportunity Set
• Group of available options• Involve Trade-offs, i.e. what is possible• Involve Budget Constraints• Time Constraints• Consumption Curve

Opportunity Set A group of available options
Budget constraints for individuals
DVDS
12
6
savings?
Borrowing?
$120 available
CDs

Production Possibility Curve and Diminishing Returns . . . for
societiesGuns
Butter
Note: Curved line vs. straight line
Diminishing Returns
Efficiency and productivity decline the more inputs are used
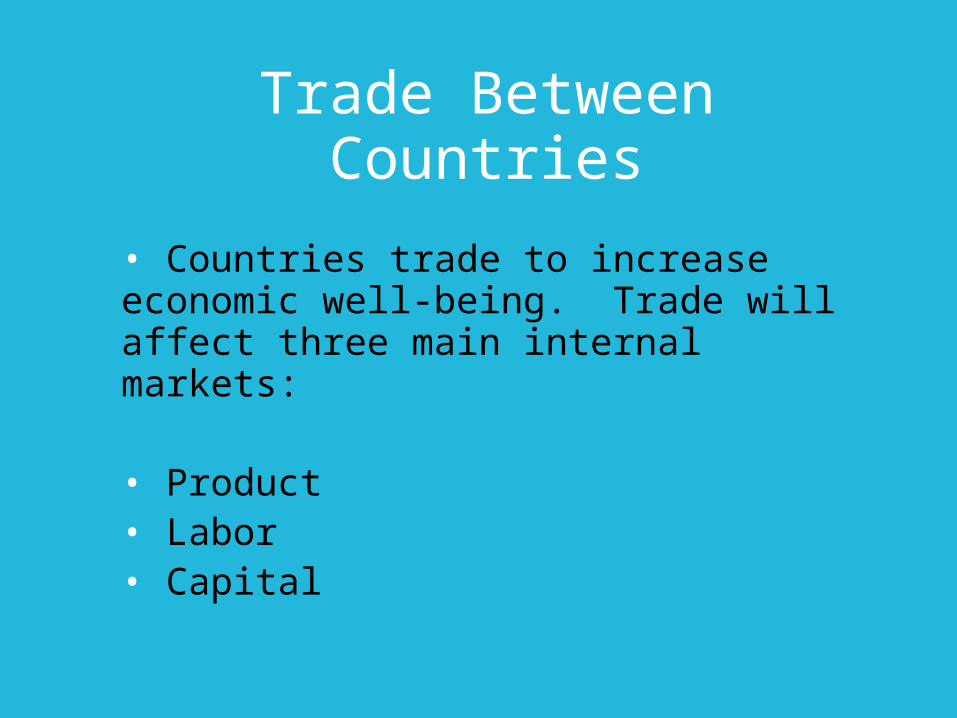
Trade Between Countries
• Countries trade to increase economic well-being. Trade will affect three main internal markets:
• Product• Labor• Capital

Comparative vs Absolute Advantage
Labor Cost of Producing Computers & Wheat
US Japan
Labor for one computer (# hrs) 100 120
Labor for one ton of wheat (# hrs) 5 8
Cost of one computer 20 tons of wheat 15 tons of wheat
Cost of 100 tons of wheat 5 computers 6.66 computers
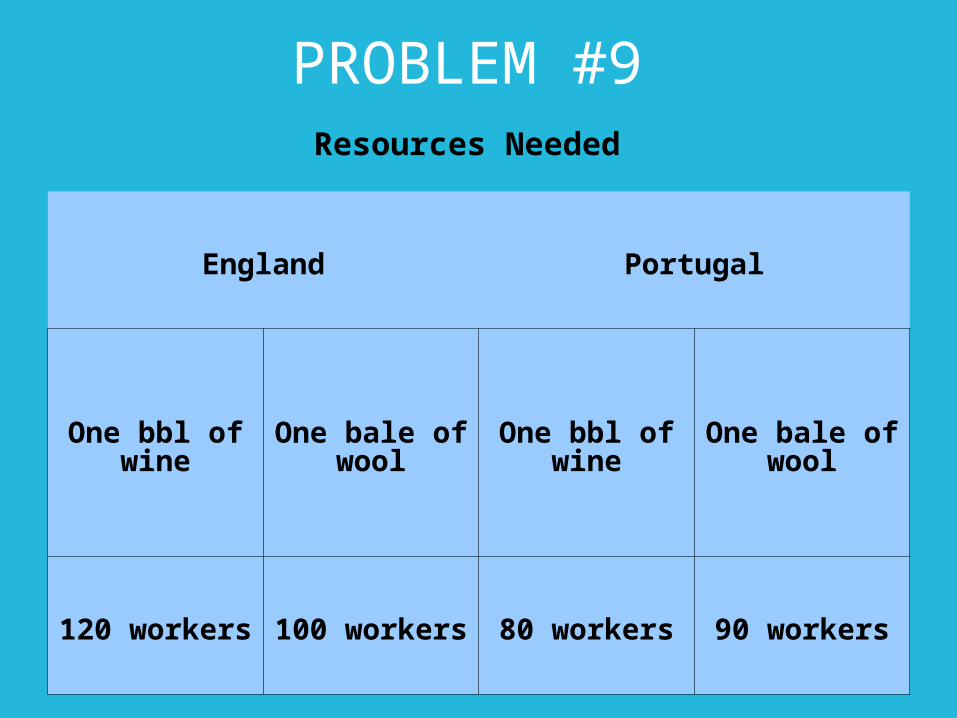
PROBLEM #9Resources Needed
England Portugal
One bbl of wine
One bale of wool
One bbl of wine
One bale of wool
120 workers 100 workers 80 workers 90 workers

PROBLEM #9Resources Needed
England Portugal
One bbl of wine
One bale of wool
One bbl of wine
One bale of wool
1.2 balesof wool
0.833 bblsof wine
0.88 balesof wool
1.125 bblsof wine
Different Production Costs
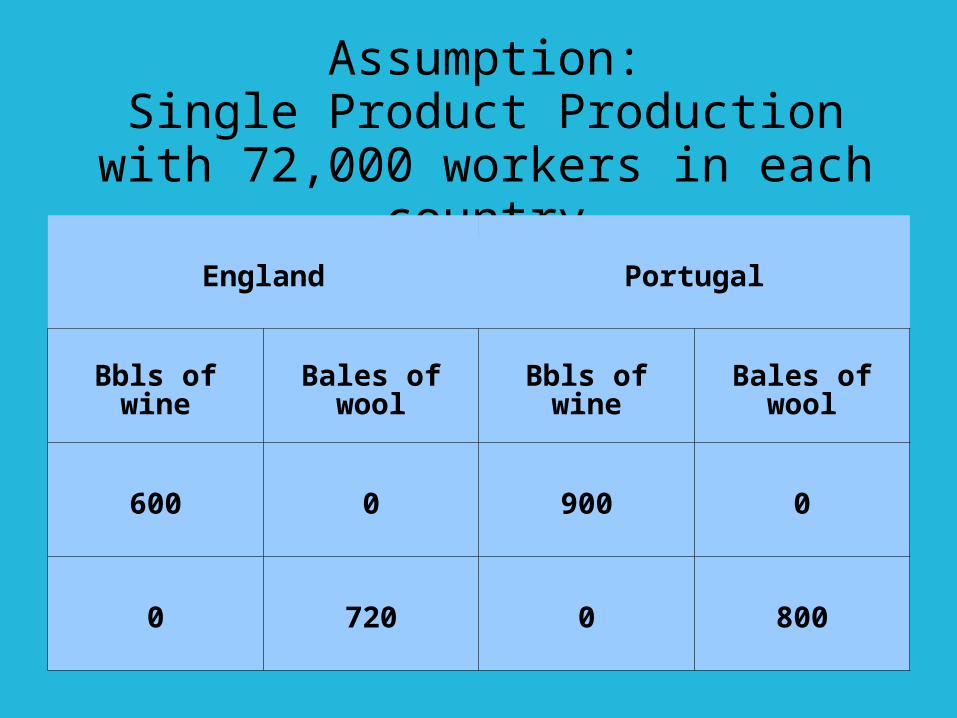
Assumption:Single Product Production with 72,000
workers in each country
England Portugal
Bbls of wine Bales of wool Bbls of wine Bales of wool
600 0 900 0
0 720 0 800

OPPORTUNITY SETSWool
Wine
800 Portugal Production Possibilities
England Production Possibilities
720
900600

Assumption:Single Product Production with 72,000
workers in each country
England Portugal
Bbls of wine Bales of wool Bbls of wine Bales of wool
600 0 900 0
0 720 0 800
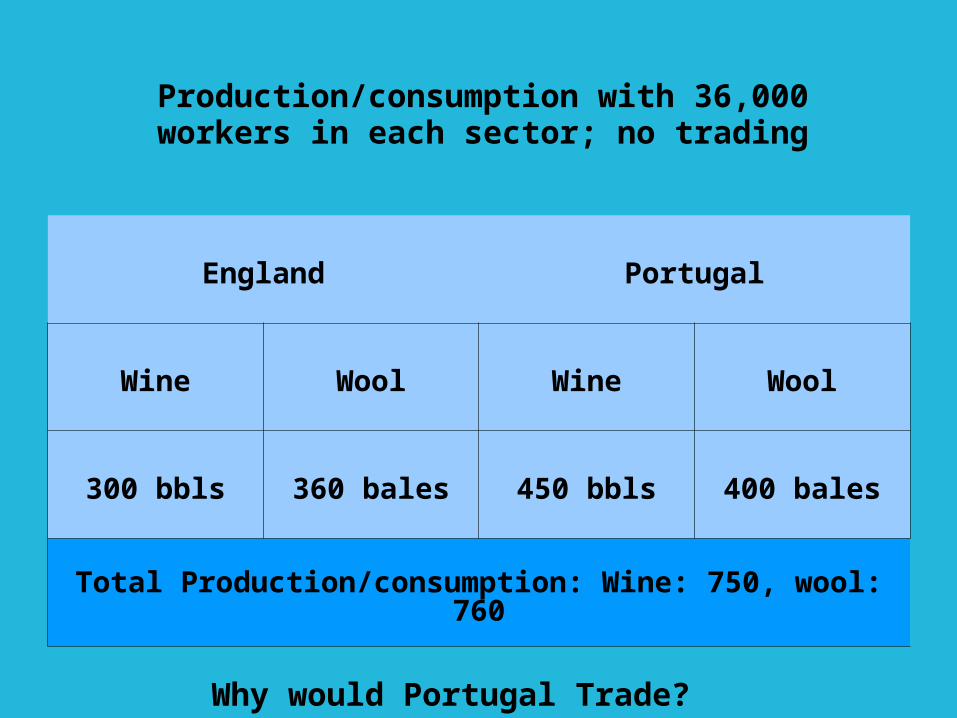
England Portugal
Wine Wool Wine Wool
300 bbls 360 bales 450 bbls 400 bales
Total Production/consumption: Wine: 750, wool: 760
Production/consumption with 36,000 workers in each sector; no trading
Why would Portugal Trade?
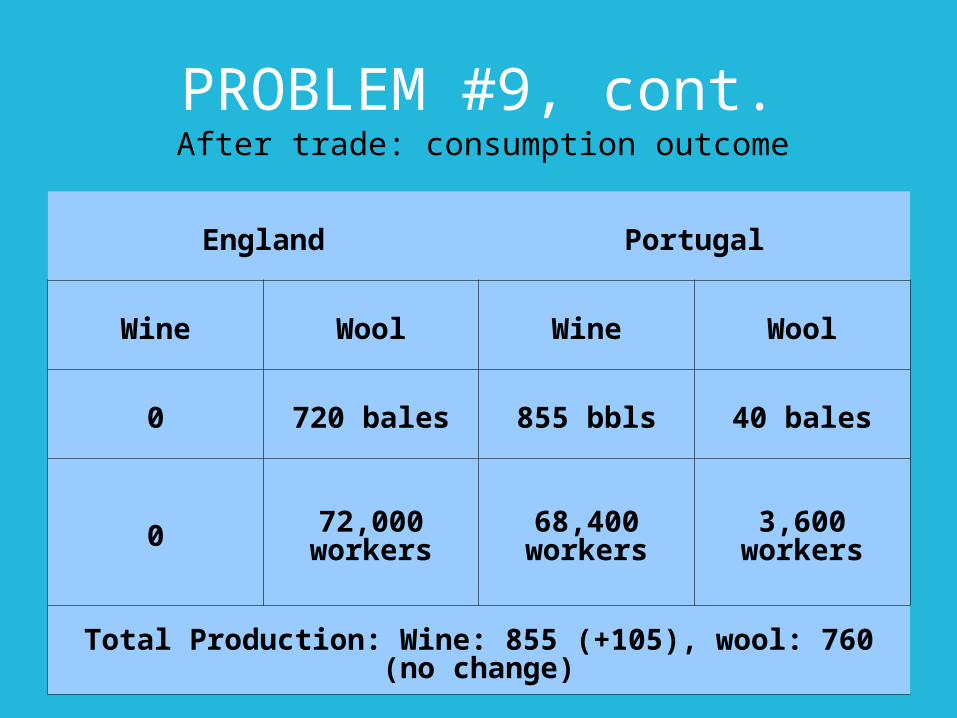
PROBLEM #9, cont.After trade: consumption outcome
England Portugal
Wine Wool Wine Wool
0 720 bales 855 bbls 40 bales
0 72,000 workers
68,400 workers 3,600 workers
Total Production: Wine: 855 (+105), wool: 760 (no change)

US China
Airplanes Garments Airplanes Garments
Initial Production Point 200 10,000 200 10,000
Revised Production Point 300 9,000 100 20,000
Net Change in Joint Production
No net change in aircraft production
9,000 net additional garments (in China)
Trade Possibilities
US Exports 100 aircraft, imports 4,500 garments
China imports 100 aircraft, exports 4,500 garments
Additional Consumption +3,500 garments (net) +4,500 garments (net)
Comparative Advantage vs. Absolute Advantage (see Stiglitz pp 42-43)

Comparative Costs for Airplanes and Garments
Production US China
100 airplanes 1,000 garments 10,000 garments
10,000 garments 1,000 airplanes 100 airplanes

PRODUCTION POSSIBILITIES(Stiglitz, p. 42-43)Garments
Airplanes Produced
20,000
China’s Production Possibilities
US Production Possibilities.
10,000
300
E’
E’’E
100 200
9,000
Marginal Rate of Transformation

PROBLEM #11Initial Situation with Total 240,000 worker hours, no trade and
labor equally divided among industries within countries
European Union United States
Car Truck Car Truck
Cost - Labor 100 600 80 400
0.166 trucks 6 cars 0.2 trucks 5 cars
Output # 1200 200 1500 300
Total Production: 2700 cars, 500 trucks
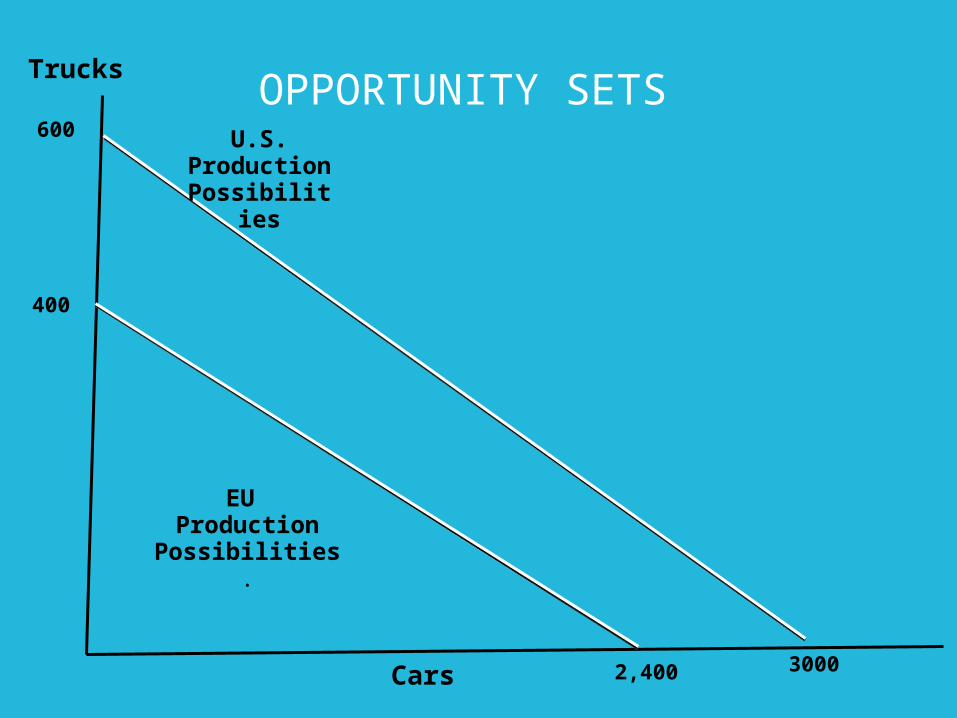
OPPORTUNITY SETSTrucks
Cars
600 U.S. Production Possibilities
EU Production Possibilities.
400
30002,400

PROBLEM #11Problem: Increase car production by 10 units, leave
Truck production unchanged
Private Consumption Consumption with Trade
EU US EU US
Cars Trucks Cars Trucks Cars Trucks Cars Trucks
1200 200 1500 300 1205 200 1505 300
Total cars: 2700 Total trucks: 500 Total cars: 2710 Total trucks: 500

PROBLEM #11Problem: Increase car production by 10 units, leave
Truck production unchanged
1. US produces 50 fewer cars and adds ten additional Trucks2. EU drops 10 Trucks, increases car production by 60 units3. US exchanges 10 Trucks with Europe for 55 cars