chapter 04© mike w. peng (ohio state university)1 chapter 4: international trade theory learning...
TRANSCRIPT

Chapter 04 © Mike W. Peng (Ohio State University) 1
Chapter 4: International Trade Theory
Learning objectives:
1. Understand why nations trade
2. Grasp a number of important theories underlying international trade
3. Be able to draw managerial implications

Chapter 04 © Mike W. Peng (Ohio State University) 2
Outline1. Why do nations trade?
2. Theory I: Mercantilism
3. Theory II: Absolute advantage
4. Theory III: Comparative advantage
5. Theory IV: Product life cycle
6. Theory V: Strategic trade
7. Theory VI: Competitive advantage
8. Managerial implications
Chapter 04 © Mike W. Peng (Ohio State University) 3
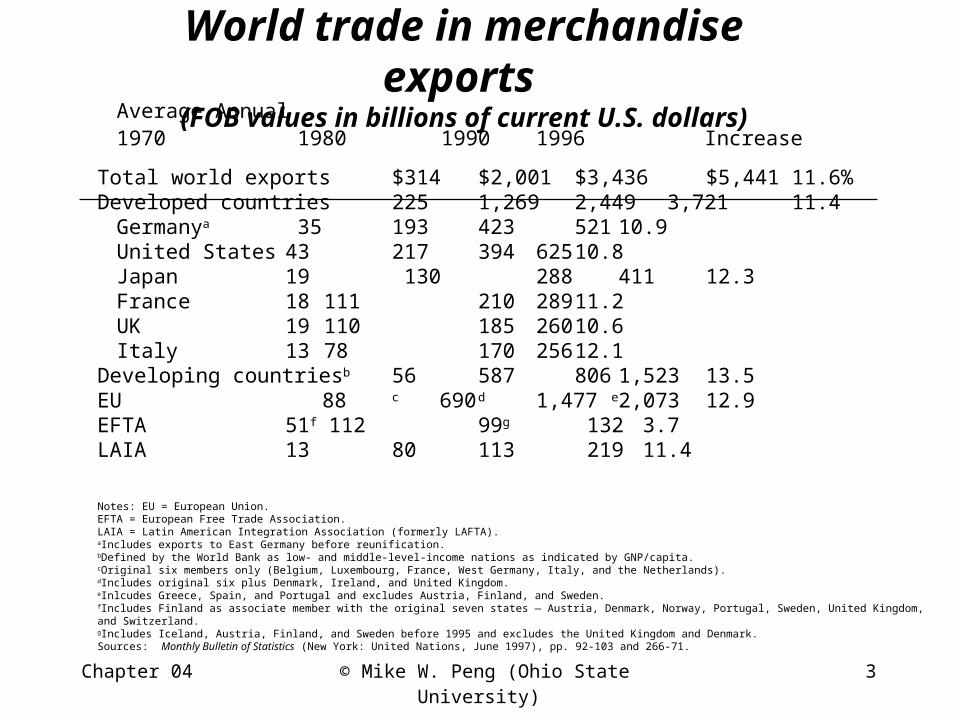
World trade in merchandise exports (FOB values in billions of current U.S. dollars)
Average Annual 1970 1980 1990 1996 Increase
Total world exports $314 $2,001 $3,436 $5,441 11.6%Developed countries 225 1,269 2,449 3,721 11.4
Germanya 35 193 423 521 10.9United States 43 217 394 625 10.8Japan 19 130 288 411 12.3France 18 111 210 289 11.2UK 19 110 185 260 10.6Italy 13 78 170 256 12.1
Developing countriesb 56 587 806 1,523 13.5EU 88 c 690 d 1,477 e 2,073 12.9EFTA 51 f 112 99 g 132 3.7LAIA 13 80 113 219 11.4
2-6
Table 2.2
Notes: EU = European Union.EFTA = European Free Trade Association.LAIA = Latin American Integration Association (formerly LAFTA).aIncludes exports to East Germany before reunification.bDefined by the World Bank as low- and middle-level-income nations as indicated by GNP/capita.cOriginal six members only (Belgium, Luxembourg, France, West Germany, Italy, and the Netherlands).dIncludes original six plus Denmark, Ireland, and United Kingdom.eInlcudes Greece, Spain, and Portugal and excludes Austria, Finland, and Sweden.fIncludes Finland as associate member with the original seven states — Austria, Denmark, Norway, Portugal, Sweden, United Kingdom, and Switzerland.gIncludes Iceland, Austria, Finland, and Sweden before 1995 and excludes the United Kingdom and Denmark.Sources: Monthly Bulletin of Statistics (New York: United Nations, June 1997), pp. 92-103 and 266-71.

Chapter 04 © Mike W. Peng (Ohio State University) 4
1996/1970 export ratios
based on current dollars and quantum indexes Figure 2.12-
7
17.316.5
14.9 14.5
21.6
16.1
13.7
19.7
27.2
23.6
3.8 3.8
6.6
4.4 4.86.1 6.3
5.53.9 3.4
0
5
10
15
20
25
30T
ota
l wo
rld
exp
ort
s
Dev
elo
ped
cou
ntr
ies
Ger
man
y
Un
ited
Sta
tes
Jap
an
Fra
nce
Un
ited
Kin
gd
om
Ital
y
Dev
elo
pin
gco
un
trie
s EU
Current Dollars Ratios, 1996/1970
Qantum Index Ratios, 1996/1970
Areas

Chapter 04 © Mike W. Peng (Ohio State University) 5
Major trading partners of the U.S. ($ billions in current dollars)
1965 1996 1965 1996
Imports from Amount Imports from Amount Exports to Amount Exports to Amount
1. Canada $4.83 1. Canada $158.64 1. Canada $5.64 1. Canada $134.61
2. Japan 2.41 2. Japan 115.17 2. Japan 2.08 2. Japan 65.95
3. U.K. 1.41 3. Mexico 75.11 3. W. Germany1.65 3. Mexico 56.74
4. W. Germany 1.34 4. China 51.51 4. U.K. 1.62 4. U.K. 30.25
5. Venezuela 1.02 5. Germany 38.83 5. Mexico 1.11 5. S. Korea 25.66
6. Mexico 0.64 6. Taiwan 29.90 6. Netherlands 1.09 6. Germany 22.97
7. Italy 0.62 7. U.K. 28.83 7. France 0.97 7. Taiwan 17.54
8. France 0.62 8. S. Korea 22.61 8. India 0.93 8. Netherlands 16.50
9. Brazil 0.51 9. Singapore 20.34 9. Italy 0.89 9. Singapore 16.25
10. Bel. & Lux. 0.49 10. France 18.63 10. Australia 0.80 10. France 14.45
11. Philippines 0.37 11. Italy 18.29 11. Bel. & Lux. 0.65 11. Hong Kong 13.87
12. India 0.35 12. Malaysia 17.82 12. Venezuela 0.63 12. Bel. & Lux. 12.69
13. Hong Kong 0.34 13. Venezuela 13.17 13. Spain 0.47 13. Brazil 12.34
14. Neth. Ant. 0.32 14. Thailand 11.33 14. S. Africa 0.44 14. China 11.94
15. Australia 0.31 15. Hong Kong 9.85 15. Switzerland 0.37 15. Australia 11.71
Notes: Exports are stated on an f.a.s. (free alongside ship) value basis. Services not included.Imports are stated on a CIF (Cost, Insurance, Freight) value basis. Services not included.U.K. = United Kingdom.Bel. & Lux. = Belgium and Luxembourg. Their export and import statistics are reported jointly. Neth. Ant. = Netherlands AntillesSource: Department of Commerce, Survey of Current Business, June 1997, pp. 74-77.
Table 2.42-9

Chapter 04 © Mike W. Peng (Ohio State University) 6
Intra-Triad Trade, 1995 ($billions)13-4 Figure 13.1
UnitedStatesUnitedStates
JapanJapanEUEU
$133.7billion
$116.3billion
$61.0billion
$122.0billion
$70.5billion
$42.5billion

Chapter 04 © Mike W. Peng (Ohio State University) 7
1. Why do nations trade?(A) Global trade is always on the rise
historically
(B) The rise is evidently more dramatic recently
(C) Why? There must be economic gains from international trading!
(D) Evolution of theories is a historical tour of the development of economic thought

Chapter 04 © Mike W. Peng (Ohio State University) 8
2. Theory I: Mercantilism
(A) 1600s-1700s: The era of mercantilism
(B) A zero-sum game: Essential to a nation’s welfare to accumulate a trade surplus (export more than import)
(C) Forerunner of protectionism
(C) Modern day trace of mercantilism: Japan, Korea, China … and the United States (!)

Chapter 04 © Mike W. Peng (Ohio State University) 9
3. Theory II: Absolute advantage(A) Adam Smith (1776): The Wealth of
Nations– Market forces (or the “invisible hand”), rather
than government, should determine the scale and scope of international trade (and, in fact, all economic activities)
– Under free trade, each nation gains, and the world economy gains, by specializing in activities in which it has absolute advantage

Chapter 04 © Mike W. Peng (Ohio State University) 10
3. Theory II: Absolute advantage
(B) The classic example in Smith’s book: England (cotton) versus Portugal (grape/wine)
(C) The book example: Ghana (cocoa) versus South Korea (rice)
(D) Critical assumptions and limitations:– Two countries and two goods in the world– No transportation costs– Constant (linear) returns to scale
Chapter 04 © Mike W. Peng (Ohio State University) 11
4. Theory III: Comparative advantage
(A) Ricardo (1817): – Same two countries, two goods model– Even though a nation has an absolute advantage
in the production of both goods, the two nations can still gainfully trade
– The less efficient nation is not equally less efficient in the production of both goods; and vice versa for the more efficient nation

Chapter 04 © Mike W. Peng (Ohio State University) 12
4. Theory III: Comparative advantage
(B) Heckscher-Ohlin (1920s-1930s): – Pattern of international trade is determined by
relative differences in factor endowments, rather than differences in productivity (as argued by Ricardo)
– The more abundant the factor, the lower its cost
(C) The Leontief paradox (1950s): – The U.S. should export more capital-intensive goods,
but it focuses on labor-intensive exports. Why?

Chapter 04 © Mike W. Peng (Ohio State University) 13
5. Theory IV: Product life cycle
(A) Previous theories assume no change in the trade pattern and in factor endowments, which is not true in the real world
(B) Vernon (1960s): – Incorporating changes in the pattern of
international trade– Three life stages, three groups of countries
(C) Influence and critiques

Chapter 04 © Mike W. Peng (Ohio State University) 14
6. Theory V: Strategic trade
(A) “New trade theory” (e.g., Krugman) in the 1970s and 1980s: – Consolidating earlier work with the new
realities such as government intervention – First-mover advantages in developing certain
resources and factors in new markets– Governments should proactively intervene to
increase to odds for international success for domestic firms (e.g., Airbus in Europe)

Chapter 04 © Mike W. Peng (Ohio State University) 15
• Founded 1915 by William Boeing
• Substantial military orders in WWII
• Largest commercial aircraft manufacturer:– 9,000 in service

Chapter 04 © Mike W. Peng (Ohio State University) 16
• Established 1967
• Substantial subsidies from governments: France (37.9% ownership), Germany (37.9%), Great Britain (20%), and Spain (4.2%)
• To date: 3,203 orders and 1,890 deliveries

Chapter 04 © Mike W. Peng (Ohio State University) 17
7. Theory VI: Competitive advantage(A) Porter (1990): The “diamond” model
– Global competitiveness of a particular industry in a given nation is determined by the combined impact of
• Factor endowments
• Domestic demand conditions
• Related and supporting industries
• Domestic rivalry within the industry
– The role of chance and government– A global focus on competitiveness
Chapter 04 © Mike W. Peng (Ohio State University) 18
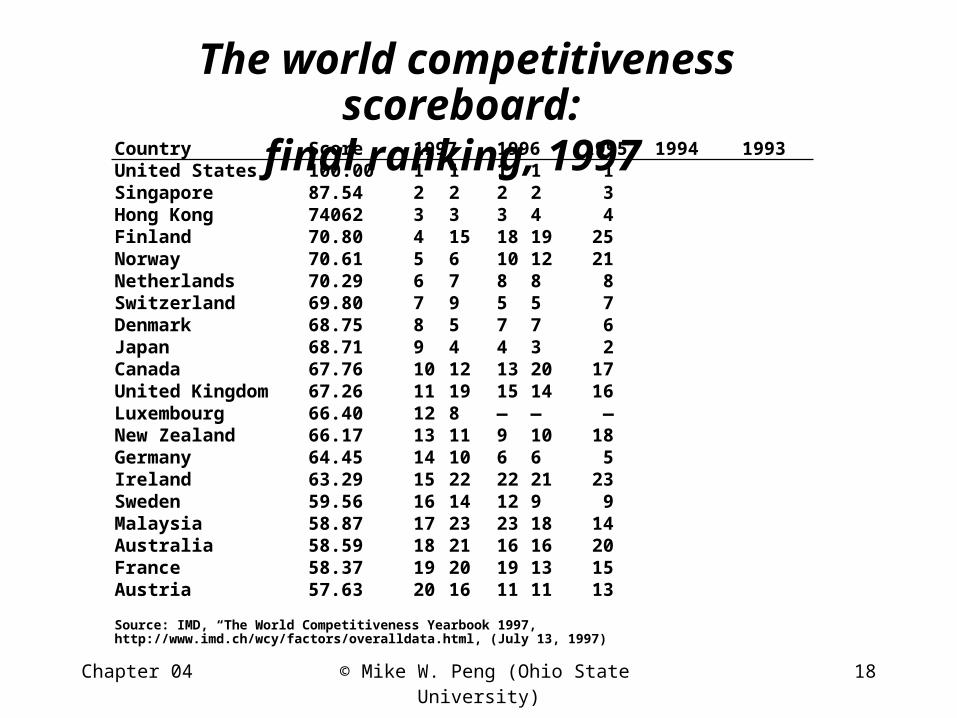
The world competitiveness scoreboard: final ranking, 1997
Country Score 1997 1996 1995 1994 1993United States 100.00 1 1 1 1 1Singapore 87.54 2 2 2 2 3Hong Kong 74062 3 3 3 4 4Finland 70.80 4 15 18 19 25Norway 70.61 5 6 10 12 21Netherlands 70.29 6 7 8 8 8Switzerland 69.80 7 9 5 5 7Denmark 68.75 8 5 7 7 6Japan 68.71 9 4 4 3 2Canada 67.76 10 12 13 20 17United Kingdom 67.26 11 19 15 14 16Luxembourg 66.40 12 8 — — —New Zealand 66.17 13 11 9 10 18Germany 64.45 14 10 6 6 5Ireland 63.29 15 22 22 21 23Sweden 59.56 16 14 12 9 9Malaysia 58.87 17 23 23 18 14Australia 58.59 18 21 16 16 20France 58.37 19 20 19 13 15Austria 57.63 20 16 11 11 13
Source: IMD, “The World Competitiveness Yearbook 1997, http://www.imd.ch/wcy/factors/overalldata.html, (July 13, 1997)
Table 13.413-14

Chapter 04 © Mike W. Peng (Ohio State University) 19
8. Managerial implications
(A) Capturing location advantages: The case of laptop computers– R&D: Japan and the United States– Standard components: Singapore, Korea, and
Taiwan– Advanced components: Japan and the United
States– Final assembly: Mexico

Chapter 04 © Mike W. Peng (Ohio State University) 20
8. Managerial implications (cont’d)
(B) Capturing first mover advantages in new product and country markets: See my article, Y. Luo and M. W. Peng, First mover advantages in investing in transitional economies, Thunder-bird International Business Review, 1998 (2).
(C) How should companies deal with the political pressure interested in protection-ism? The myth of an “American” car

Chapter 04 © Mike W. Peng (Ohio State University) 21
The myth of an “American” car
A “patriotic” car customer told the dealer:– I want to get an American car!– Well, sir, would you like to take this American
car assembled in Canada, this Japanese car made in America, or that American car which was deigned in Europe and had 50 percent foreign content made in Mexico? Which would you like?