who exports high-quality products? some empirical regularities from
TRANSCRIPT

BANK OF GREECE
EUROSYSTEM
Working Paper
Economic Research Department
BANK OF GREECE
EUROSYSTEM
Special Studies Division21, E. Venizelos Avenue
Tel.:+30 210 320 3610Fax:+30 210 320 2432www.bankofgreece.gr
GR - 102 50, Athens
WORKINGPAPERWORKINGPAPERWORKINGPAPERWORKINGPAPERISSN: 1109-6691
Sarantis Kalyvitis
Who exports high-quality products? Some empirical regularities from Greek
exporting firms
DECEMBER 2015WORKINGPAPERWORKINGPAPERWORKINGPAPERWORKINGPAPERWORKINGPAPER
201

BANK OF GREECE
Economic Analysis and Research Department – Special Studies Division
21, Ε. Venizelos Avenue
GR-102 50 Athens
Τel: +30210-320 3610
Fax: +30210-320 2432
www.bankofgreece.gr
Printed in Athens, Greece
at the Bank of Greece Printing Works.
All rights reserved. Reproduction for educational and
non-commercial purposes is permitted provided that the source is acknowledged.
ISSN 1109-6691

WHO EXPORTS HIGH-QUALITY PRODUCTS? SOME EMPIRICAL
REGULARITIES FROM GREEK EXPORTING FIRMS
Sarantis Kalyvitis
Athens University of Economics and Business
Abstract This study assesses the quality of Greek exports and links the estimates with exporters’
characteristics. Export quality in manufacturing is estimated to have fallen by 1% per year on
average for the period 1998-2010, but recovered in 2011 and 2012 when export quality
displayed a cumulative rise of 25.7%, yielding a cumulative rise of 9.2% for the entire period
1998-2012. Export quality in agriculture displays a slightly upward trend with the average
annual rise over the period 1998-2012 amounting to 1.6%. Linking the quality estimates at the
product level with exporting firms in the manufacturing sector shows that higher product
quality is associated with firms that have a higher share of their wage bill paid to skilled
workers. This positive relationship stems from firms with higher skilled to unskilled
employment ratios, rather than higher wage skill premia, and is more pronounced in large and
rich destinations.
Keywords: international trade, firm exporting, product quality
JEL classification: F14, L15, L25, J31.
Acknowledgements: Financial support by the Bank of Greece (ΕΡ-2238-01) is acknowledged.
I thank Heather Gibson, Dimitris Malliaropoulos, and seminar participants at the Bank of
Greece for useful comments and suggestions. I would also like to thank Eirini Thomaidou and
Evi Zervoudi for excellent research assistance.
Correspondence:
Sarantis Kalyvitis
Athens University of Economics and Business
Patision Str. 76,
Athens 10434 Greece
e-mail: [email protected]

3
1. Introduction
Α number of recent studies have pointed out the importance of the quality of goods
produced and exported for economic outcomes. In particular, product quality is a key feature
that affects both how countries specialize in production and the direction of trade between
countries, as higher-quality varieties of existing products help build on existing comparative
advantages to boost productivity and export revenues (see, among others, Schott, 2004; Hallak,
2006; Hausmann et al., 2007; Sutton and Trefler, 2011). Hummels and Klenow (2005) infer
quality by adopting the premise that if large exporters systematically sell high quantities at
high prices, this is consistent with these exporters producing higher-quality goods, and show
that richer countries export higher quality goods at modestly higher prices. Fontagné et al.
(2008) report that, on average, Japanese unit values are 2.9 times higher than for China, for
the same products, shipped to the same markets, within the same year. They analyze unit
prices of HS 6-digit products fοr 200 countries and find that the products of developed
countries are not directly competing with those of developing countries. Crozet et al. (2012)
obtain direct measures of quality for one industry and show that firms with higher measured
quality have a higher ratio of consumer benefits to producer costs and are more likely to
export higher quantities at higher prices.
As pointed out by Harrigan et al. (2015), these stylized facts are broadly supportive of
models where consumers value quality, but quality is expensive to produce. Consumers
choose goods on the basis of “quality-adjusted” prices and are willing to pay a higher price
for an expensive, high-quality good. In turn, the marginal firm sells low-quality goods at a
low price. Market entrants charge lower prices and thus average unit value in a market will
fall. When markets differ in their level of competition, more entry implies lower average
prices in less competitive markets. Yet a simple comparison of average nominal prices across
markets will have misleading implications, since the quality-adjusted price index can be lower
when the average nominal price is higher. Johnson (2012) checks if quality is “homogeneous”
(meaning there is no difference in quality and thus firms compete only on price) or
heterogeneous (meaning quality varies and thus firms compete on quality-adjusted price), and
shows that heterogeneous quality is dominant.
The present study provides new elements to understand the relation between export
quality and firm characteristics by investigating whether key attributes at the firm level are
related to the estimated quality of exported products. To this end, I obtain a measure of the
quality of Greek exports at the product level based on a modified version of the rationale

4
followed by Khandelwal (2010) for US imports, who develops an estimation strategy that utilizes
both unit value and quantity information to infer quality and has a straightforward intuition
extensively used in the industrial organization literature: “conditional on price, [...] higher
market shares are assigned higher quality” (Khandelwal, p. 1451). The measure of export
quality is based here on the choice of ‘consumers’ (destinations) between alternative varieties
within an exported Greek product category, after controlling for differences in price. Hence, it
largely avoids the shortcomings of using unit values to proxy quality.1 I use disaggregated
trade data covering the period 1998-2012 to obtain the quality of Greek exports based on
estimated regressions for 71 manufacturing and 13 agricultural products. Export quality in
manufacturing is estimated to have fallen by 1% per year on average for the period 1998-
2010, but recovered in 2011 and 2012 when it displayed a cumulative rise of 25.7%, yielding
a cumulative rise of 9.2% for the entire period 1998-2012. An important finding is that export
quality at the sectoral level in manufacturing reveals substantial heterogeneity, which
indicates that there are differential dynamics among products. On the other hand, export
quality in agriculture displays a slightly upward trend with the average annual rise over the
period 1998-2012 amounting to 1.6%. The estimates show that substantial changes in export
quality have occurred over this period, both at the aggregated and disaggregated product levels.
To get then a sense of how closely the quality estimates of exports at the product level
are related to the characteristics of exporting firms, I examine how product quality in the
manufacturing sector is correlated with the key characteristics of exporting firms, like
employment, wages, R&D and other types of outlays. I find that firms with higher wage-bill
skill premia (higher wage bill ratios of skilled to unskilled labor) export higher-quality
products. When the wage-bill skill premia are decomposed into the skilled to unskilled
employment ratios and the wage-rate skill premia, I find that firms with more skilled relative
to unskilled labor export higher-quality products, whereas there is no correlation with skill
premium based on the wage rate. When I look at the interaction of these variables with
destinations characteristics, I find that the positive correlations between the wage bill ratio
and the ratio of skilled to unskilled workers with product quality are mainly driven by large
and rich destinations.
These findings are consistent with the idea that there is a ‘quality sorting’ of firms
across destinations based on the use of their labor inputs and expenses that are, directly or
indirectly, related to firm exporting. The estimated correlations could be largely explained by
1 See section 2 for a more detailed survey of related empirical literature.

5
unobservable differences in the quality of inputs, which are in turn reflected in output quality as
in Kugler and Verhoogen (2012). There are various reasons why quality in exporting may
demand relatively more skilled employment. For instance, international marketing and
commercialization, transportation and distribution, advertising require expertise in
international businesses, languages, foreign technologies, and in the social idiosyncrasies of
foreign markets. Verhoogen (2008) develops a model where exporting allows for quality
upgrading and skill-intensive services, a channel that might be particularly relevant if it
involves accessing high-income destinations with higher valuation for quality (Brambilla et
al., 2012). In a related vein, exporting may require varying levels of skills due to “skilled-bias
globalization”, in which international trade activities use skill-intensive resources
(Matsuyama, 2007). Consistent with the quality interpretation, Atkin et al. (2015) point out that
larger firms have greater costs primarily because they use higher-quality, more costly inputs,
which is also corroborated by the additional finding that older -and typically larger- Greek
firms with higher export intensity are associated with higher product quality.
The results also extend the well-known in the international trade literature that examines
how export unit values (prices) vary with destination characteristics, like size, income per
capita and distance. Schott (2004, 2008) has documented a large difference in product prices
within the most disaggregated level of product classification and that US consumers pay less
for similar goods that are “Made in China” than for those “Made in OECD”. Manova and
Zhang (2012) establish that Chinese export prices are higher in richer and larger destinations,
and support the empirical relevance of trade models with endogenous product quality. Bastos
and Silva (2010) and Baldwin and Harrigan (2011) find that export unit values within
products increase systematically with distance, tend to be higher in shipments to richer
nations and are negatively related to market size. In line with the findings presented here,
their estimated relationships also reflect a ‘quality sorting’ of heterogeneous firms across
markets: within product categories, higher-productivity firms tend to ship greater quantities at
higher prices to a given destination, consistent with higher quality. I stress that the estimated
correlations are identified across firms within products and the fact that highly productive,
skill-intensive firms export higher-quality products corroborates and extends the
aforementioned evidence in the micro-exporting literature on the important quality variations
across firms.
The rest of the study is structured as follows. Section 2 reviews the related empirical
literature on the quality of exports and derives the quality estimates of Greek exports. Section 3

6
links the quality estimates at the product level with key characteristics of exporting firms and
section 4 draws the main conclusions.
2. Estimating the quality of Greek exports
2.1. Related empirical literature
The importance of export quality in analyzing the determinants of trade flows sparked
an interest in estimating export quality. The main challenge faced by this literature is that
product quality is unobserved. Research in the international trade literature has attempted to
exploit the availability of trade data at a highly disaggregated level for many countries and
has used readily observable prices (or unit values), defined as the ratio of export value over
quantity for a given product category, as a proxy for export quality. However, this strategy is
not viable to study the relationship between quality and firm characteristics, because unit
values suffer from several shortcomings generated by differences in the composition of goods,
their production costs, or pricing strategies within a given product category across exporters. If,
for instance, exporters that use lower-cost inputs are systematically less productive than
competitors they will sell more expensive varieties, by measuring relative quality with
relative prices we may wrongly attribute to lower-cost inputs a positive effect on output
quality. Moreover, standard supply or demand shocks will affect equilibrium prices, and hence
unit values, without necessarily affecting product quality. Indeed, some recent papers, which have
developed strategies for quality estimation using explicit microeconomic foundations, have
established that observed unit values can be a poor approximation for export quality
(Khandelwal, 2010; Hallak and Schott, 2011; Henn et al., 2013; Feenstra and Romalis, 2014).
In the context of a cross-country setup, Hallak and Schott (2011) rely on trade balances
to identify quality: holding observed export prices constant, countries with trade surpluses are
inferred to offer higher quality than countries running trade deficits. Consumers are assumed
to care about price relative to quality in choosing among products and hence two countries
with the same export prices but different global trade balances must have products with
different levels of quality. Among countries with identical export prices, the country with the
higher trade balance is revealed to possess higher product quality. This procedure requires
extensive data on tariffs, which is unavailable even for many relatively large countries before
1989. Feenstra and Romalis (2014) exploit supply-side features of trade data to decompose
available unit values of internationally traded goods into quality and quality-adjusted price
7
components using an endogenous quality decision. Based on two different unit-value
observations for each product, derived from import and export data, they are able to aggregate
individual products to industry-level indexes of export quality and prices covering the period
1984-2011. Vandenbussche (2014) develops an export quality indicator based on Di Comité
et al. (2014), which disentangles quality from cost and taste effects, to generate quality ranks
of EU manufacturing products at the CN8 level over the period 2007-2011. His rankings
suggest that quality upgrading results in a higher willingness to pay by consumers and
therefore offers a way to escape cost competition.
In terms of country time-series estimates of export quality, Henn et al. (2013) use
reduced-form quality-augmented gravity equations based on Hallak (2006), to estimate export
quality indices for 178 countries covering the period 1962-2010 at the product and aggregate
levels. In a single-country setup Khandelwal (2010) exploits price and quantity information to
estimate the quality of US imports, where higher quality is assigned to products with higher
market shares conditional on price. He finds that the estimated qualities reveal substantial
heterogeneity in product markets’ scope for quality differentiation (“quality ladders”) and that
markets characterized by relatively short quality ladders are associated with larger
employment and output declines resulting from low-wage competition.
2.2. The empirical model for the quality of Greek exports
The empirical identification of export quality relies on the assumption that, conditional
on export price, pricehd, measured by the unit values of variety h (captured by their CN8
classification), shipped to destination d, varieties with higher shares in export markets at the
product level (captured by their Standard International Trade Classification; henceforth SITC)
are assigned higher quality. To assess product quality the following specification is estimated:
ln(Shdt) = a x ln(pricehdt) + β x ln(popdt) + γ x ln(NShdt) + λ1,h + λ2,t + λ3,ht (1)
where Shdt denotes the share of shipments of variety h to destination d in aggregate
shipments of product p (e.g. cotton shirts exported to Germany relative to total Greek
exports of shirts) at time t, and NShdt denotes the ‘nested’ share of variety’s h shipments to
destination d in aggregate shipments of variety h (e.g. cotton shirts exported to Germany
relative to total Greek exports of cotton shirts) at time t. Both Shd and NShd are measured in
terms of quantities. Notice that a larger market share of a product may reflect that exports
include more ‘hidden’ variables, due to the aggregation of more finely classified products that

8
are unobserved (Khandelwal, 2010). Suppose that exports to Germany and the Netherlands split
the market of Greek exports in shirts equally at a non-observed disaggregation level (e.g. colour
of shirts), yet exports to Germany are larger as they include more colours. Aggregation to the
observed level (shirts) would assign a larger market share at identical prices to Germany and
yield an upwards biased estimate of quality. To account for this potential caveat, destination
population popd, obtained from World Development Indicators, is also included in the estimated
regression to proxy for destination size.
The quality of variety h to destination d at time t, λht, is defined using the estimated
parameters λht ≡ λ1,h + λ2,t + λ3,ht. Since the trade data do not record detailed characteristics of
varieties, I exploit the panel dimension of the data by specifying a time-invariant component
of quality λ1,h with variety fixed effects (some products have a better quality than others) and
a common quality component λ2,t with year-fixed effects (quality might vary through time).
The third component of quality, λ3,ht, is unobservable (for instance, quality might change
because of some upgrading of plant and equipment) and plays the role of the estimation
error.2
Specification (1) allows for the plausible correlation structures among consumer
preferences through the nest share, NShd. Consider for instance two varieties, wool shirts
exported to France and cotton shirts to Italy. Suppose that they are identical in every
dimension (including price) and evenly split the market of Greek exports in shirts. We would
infer their qualities also to be equal. Now suppose a cotton shirt is exported to Germany: the
new market shares for both cotton shirts would ceteris paribus be one-fourth each and the
wool shirts exported to France would capture the remaining half. In other words, we might
expect the market share of cotton shirts exported to Italy to adjust more than the market share
of wool shirts exported to France, because shirts exported to Germany are also cotton.
However, we do not want the inferred quality of the existing varieties to fall simply because
varieties within nests are closer substitutes than varieties across nests. The nested
specification alleviates this concern preferences by placing varieties into appropriate nests,
with the nest share, NShd, adjusting to account for changes in market shares.3
2 The identification of coefficients relies on the assumption that prices are exogenous. Khandelwal (2010) points
out that this assumption may not hold if exporters choose prices and quality simultaneously, and instruments
prices with transportation costs (captured by the distance of the destination country) and the ‘nested’ share with
the number of destinations per variety. A similar identification strategy for Greek exports did not prove successful,
as both instruments contained little information for the variables of interest. 3 In addition, the nest share, NShd, accounts for trade redirection that is important for quality. Estimated export
quality will not change simply because exports to a certain destination are adjusted due e.g. to an external shock,
9
It should be stressed that a major difference with Khandelwal’s (2010) approach is that
he assesses the quality of US imports with the dependent variable being the market share of a
country’s imports to the US in total consumption of the product in the US (including domestic
versions of the product). In contrast, equation (1) looks at Greek exports with the dependent
variable being the share of Greek exports of product p to destination d in total Greek exports
of the product. The approach adopted here looks across destinations by assuming that Greek
exports of a product form a ‘market’ with destinations acting as ‘consumers’. Hence, it
neglects the concept of the market defined in terms of e.g. a German consumer who has a
choice of Greek versus domestic products, Italian products, etc. However, it avoids the pitfalls
associated with the spurious impact of domestic developments in the assessment of export
quality. For instance, the recession in Greece after 2010 has shifted Greek exports upwards
due to the lack of domestic demand, an outcome that would spuriously attribute higher shares
of Greek exports in world markets to higher quality.
Given these insights, an alternative interpretation of λht is that it represents a shift
parameter in the variety’s demand schedule: a variety’s quality will rise if its price in a market
(destination) can rise without losing market share (Sutton, 1991). Quality here represents any
attribute that encompasses consumers’ willingness to pay for a variety (valuation for quality
or ‘perceived quality’) and the technology of the variety (‘technical efficiency’). The
associated quality estimate does therefore not compare the quality of a single country’s
exports relative to competitors, which would require access and processing of disaggregated
global trade flows as in Henn et al. (2013) and Feenstra and Romalis (2014), but rather
assesses changes in market (destination) shares of a country’s products that cannot be
attributed to price changes.
2.3. Trade data
The empirical definition of an exported product follows the SITC classification system,
which is a product classification of the United Nations used for external trade statistics
(export and import values and volumes of goods), allowing for international comparisons of
commodities and manufactured goods. The groupings of SITC reflect the production
materials, the processing stage, market practices and uses of the products, the importance of
the goods in world trade, and technological changes. The main categories are food, drinks and
as the nest part will adjust as well. Thus the assessed impact can be considered as a proxy of ‘non-price’ effects.
10
tobacco (Sections 0 and 1 - including live animals), raw materials (Sections 2 and 4), energy
products (Section 3), chemicals (Section 5), machinery and transport equipment (Section 7),
other manufactured goods (Sections 6 and 8). Given the relatively large size of the
agricultural sector in Greece and its importance for Greek exports, I analyze two distinct
sectoral categories of goods: (i) manufacturing sector products (SITC Categories 5-8), (ii)
agricultural products (SITC Categories 0-1). I exclude the homogeneous goods defined by
Rauch (1999) since these products, by definition, exhibit no quality differentiation. Given the
noise in monthly exports, the data are trimmed along three dimensions. The first trim excludes
varieties (defined as CN8 classifications) that are exported for less than 6 months and also
those that are exported for less than 3 months to a single destination. Unit values are then
calculated as ratios of export value to quantity.4 The second trim removes varieties with
extreme unit values that exceed 10 times, or fall below 10% of, the median product (SITC)
price. The third trim allows for variation across nested shares (CN8) within a product
category; only products with three or more CN8 classifications per SITC are used in the
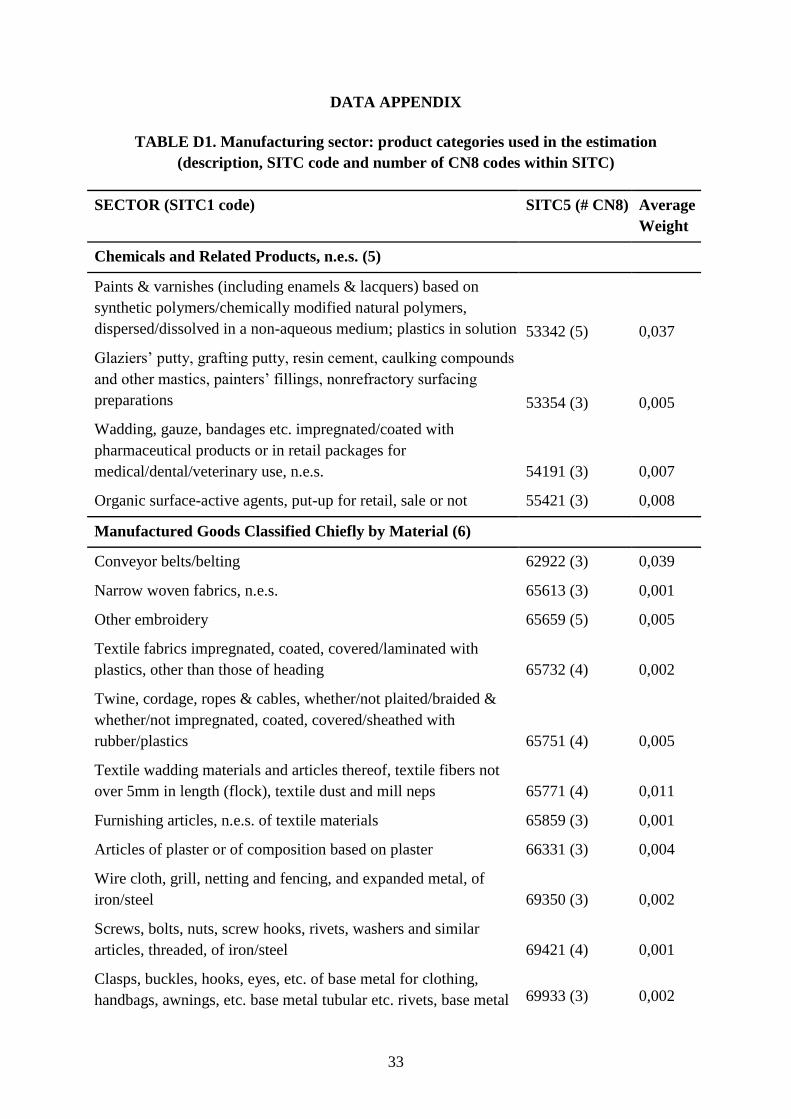
estimation.5 Tables D1 and D2 in the Data Appendix summarizes the products used in the
estimation process after excluding those values that are not exported for all data years over the
sample period considered here (1998-2012).
2.4. Quality estimates
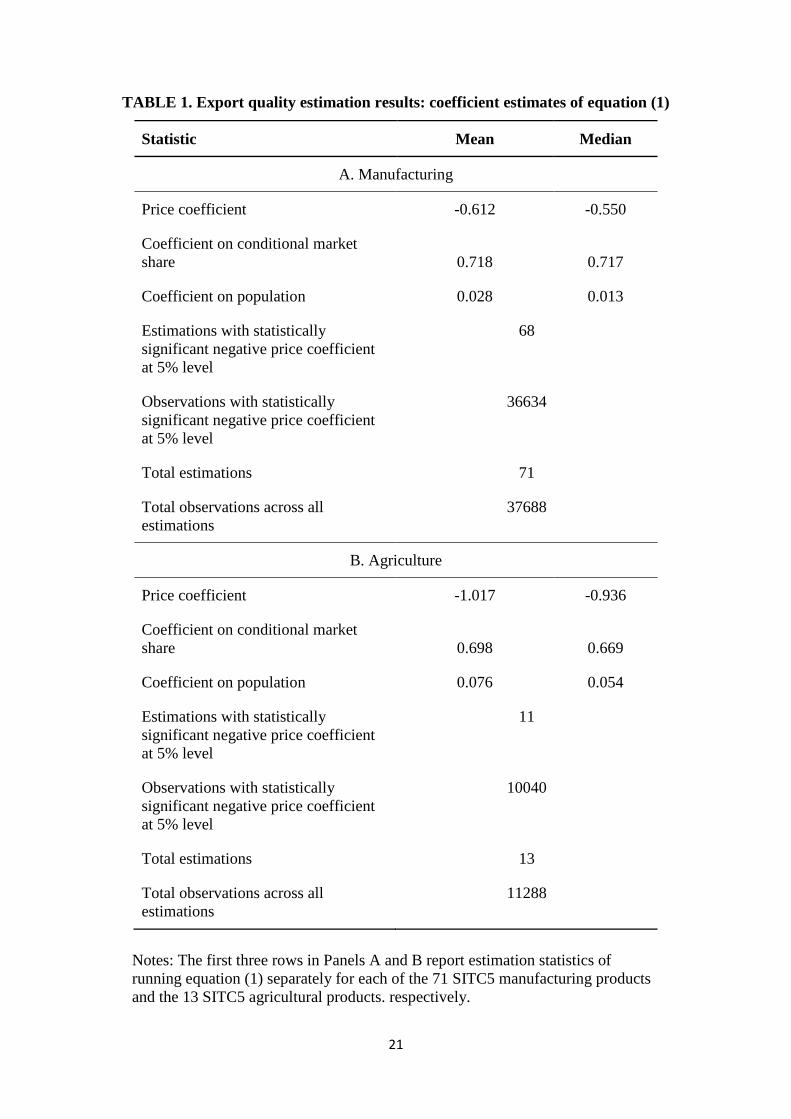
Equation (1) is run separately for 71 SITC categories in the manufacturing sector and 13
SITC categories in the agricultural sector, which fulfill the criteria described in the previous
section. The results of these regressions are summarized in Table 1 for manufacturing (Panel
A) and agriculture (Panel B). Panel A shows that 68 of the regressions, or 97% of the total
37.688 observations in the entire sample, have a negative and statistically significant price
coefficient. Row 1 in Panel A indicates that the average OLS price coefficient in
manufacturing amounts to -0.61. Rows 2 and 3 indicate that the average coefficients on the
conditional market share and the population also have the expected positive signs (and are
4 Notice that this approach implies that the observed unit values are averages across firms.
5 For instance, SITC code 84423 “Jackets and blazers of knitted or crocheted textile fabrics, women's or girls'”
comprises the following four CN8 classifications: 61043100 “women's or girls' jackets and blazers of wool or
fine animal hair, knitted or crocheted (excl. wind-jackets and similar articles), 61043200 “women's or girls'
jackets and blazers of cotton, knitted or crocheted (excl. windjackets and similar articles), 61043300 “women's
or girls' jackets and blazers of synthetic fibres, knitted or crocheted (excl. wind-jackets and similar articles),
61043900 “women's or girls' jackets and blazers of textile materials, knitted or crocheted, excl. of wool, fine
animal hair, cotton or synthetic fibres, wind-jackets and similar articles).
11
also statistically significant). In the agricultural sector (Panel B) the price coefficient
estimated for is slightly higher and, also, significant in 89% of the total 11.288 observations,
whereas the coefficients on market share and population are again positive.
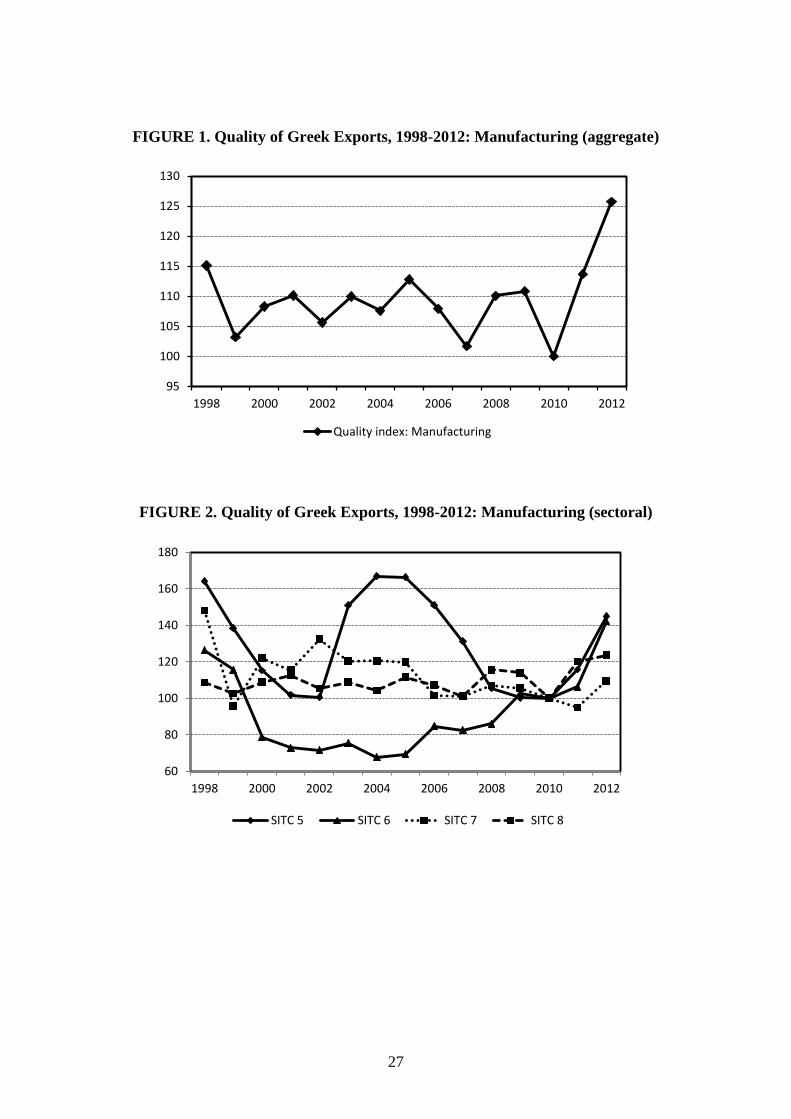
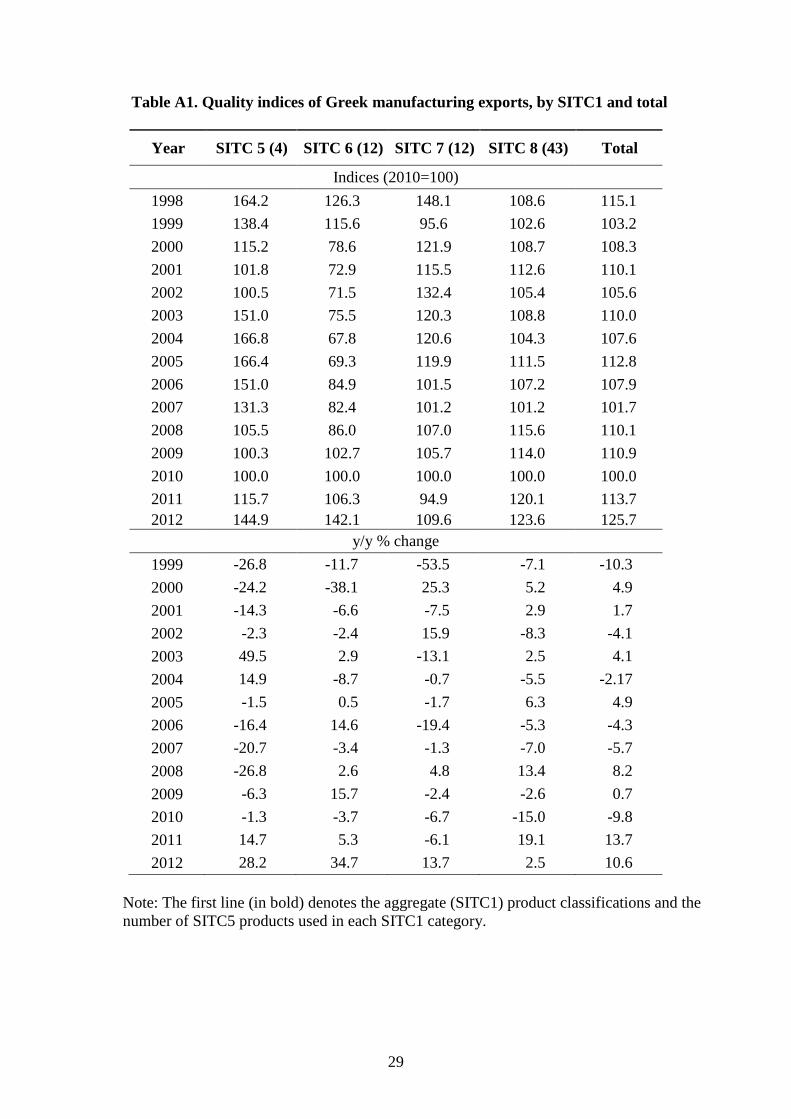
The patterns of the aggregate and sectoral export quality indices for manufacturing are
depicted in Figures 1 and 2 respectively, which display the aggregate quality estimates in
index form and the estimated export quality indices per SITC broad category (5-8), obtained
from the residuals of these regressions according to the definition of λht and weighted by the
shares of annual revenues for each product.6 Notably, average export quality, which had a
slight negative trend over the period 1998-2010 falling by 1% per annum, appears to follow a
sharp positive trajectory after 2010, climbing by 13.7% in 2011 and 10.6% in 2012, with the
rise mainly driven by SITC categories 5, 6 and 8. Export quality at the sectoral level reveals
substantial heterogeneity, with SITC industries 5 (Chemicals and Related Products) and 6
(Manufactured Goods Classified Chiefly by Material) displaying a drop in the estimated
export quality after 1998, although a sharp recovery period is observed in years 2003-2005 for
SITC 5 and after 2004 for SITC 6. In contrast, SITC industries 7 (Machinery and Transport
Equipment) and 8 (Miscellaneous Manufactured Articles) display a stagnant pattern for the
whole period. Figures 3 and 4 display the corresponding aggregate and sectoral indices,
respectively, for the agricultural sector. Overall, the aggregate index displays a highly cyclical
behavior with an upward trend: the average annual rise over the period 1998-2012 amounts to
1.6%. On the other hand, the sectoral indices display more stable patterns. It should be
stressed that the results for the agricultural sector should be interpreted with caution due to the
small number (13) of SITC product categories used in the estimations.7
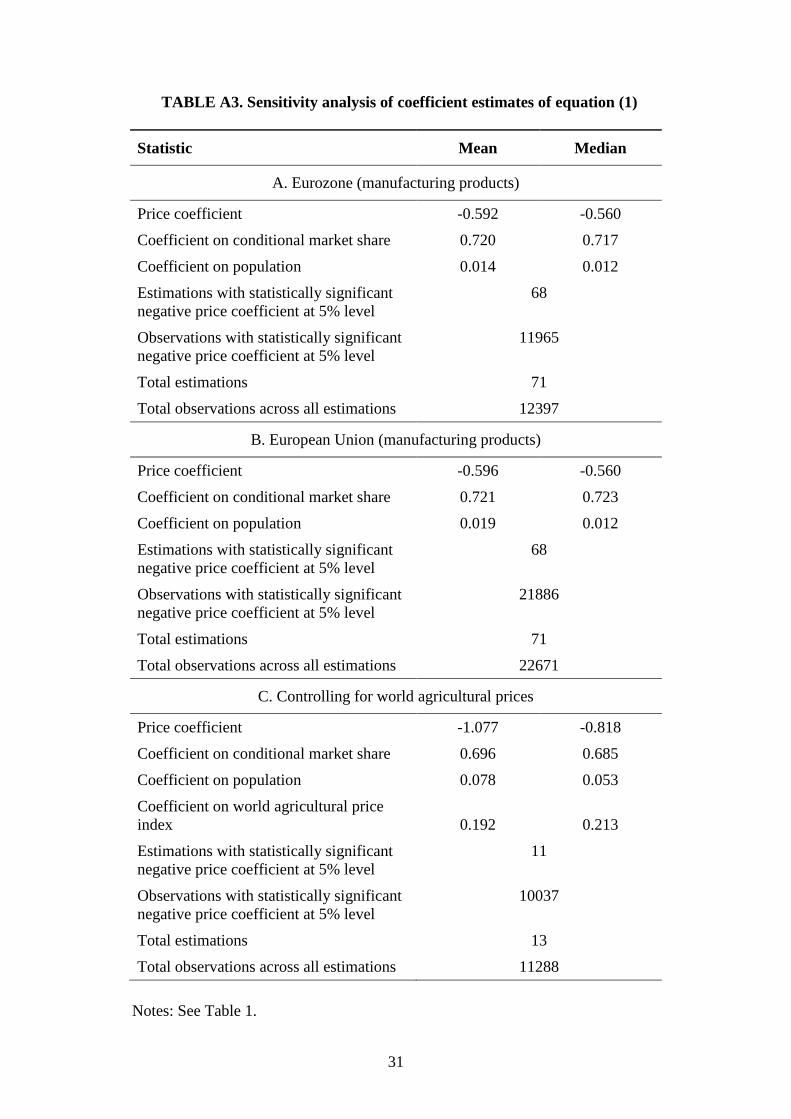
To assess the robustness of the quality estimates I perform two broad sensitivity tests.
First, I estimate the quality of manufacturing products exported to European Union (EU) and
Eurozone countries. This analysis is motivated by two main factors. First, intra-EU trade is
likely to be oriented to more expensive, and hence higher-quality, products given the higher -
and more homogeneous- per capita income levels of the trading partners. Second, the
adoption of the Euro eliminated a number of trade barriers in the form of transaction costs and
induced transparency in prices, which might have altered the structure of trade towards
exporting higher-quality goods to Eurozone countries. To this end, I perform the same
exercise by running equation (1) for EU and Eurozone destinations. The corresponding
6 The average shares over the period 1998-2012 are shown in the last column of Table D1 in the Data Appendix.
7 Tables A1 and A2 contain the detailed quality estimates per SITC category for the period under consideration.

12
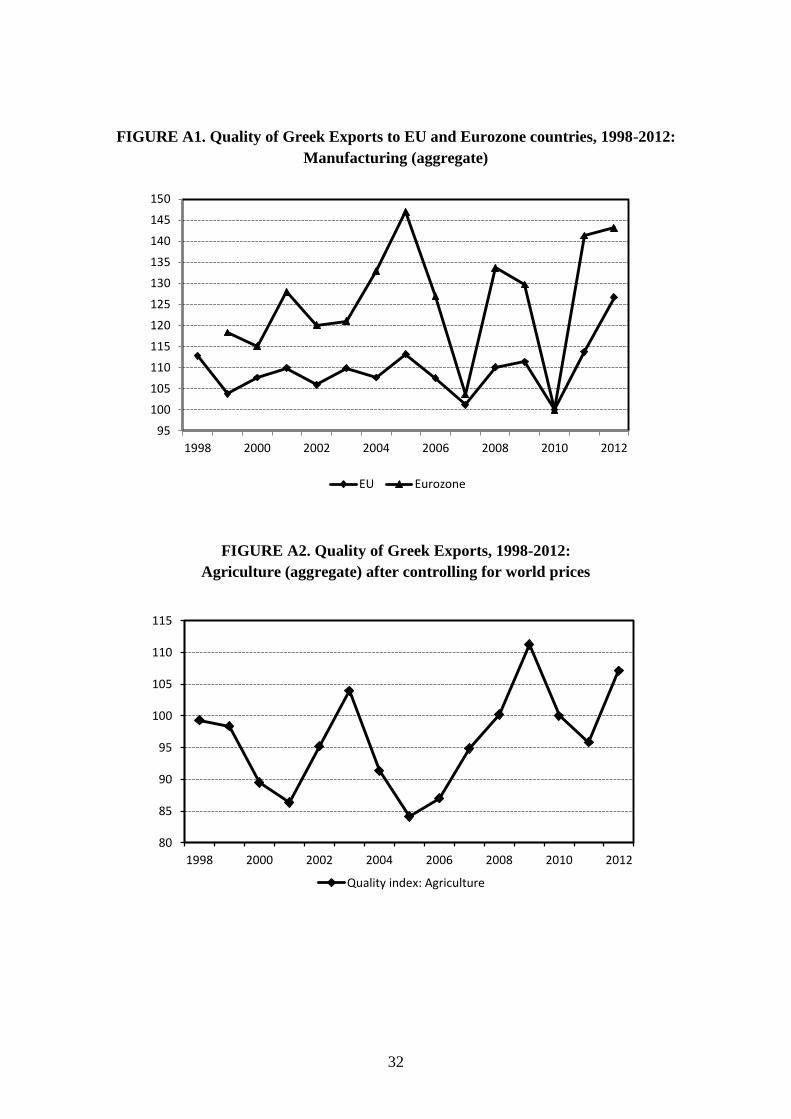
regression results are given in Panels A and B of Table A3 and the time profiles of the quality
estimates are depicted in Figure A1. The estimated quality of exports to EU countries is
relatively stable over the sample, whereas the corresponding quality to Eurozone countries
exhibits much larger variation. Interestingly, both indices confirm the sharp rise in export
quality for 2011 and 2012.
I also test the sensitivity of quality estimates for the agricultural sector by controlling
for world prices in agricultural products.8 More specifically, it is possible that an increase in
the quality of agricultural products hides a rise in global agricultural prices, as prices in
destination markets increased proportionately across export countries without affecting
relative prices and market shares. In other words, if the rise in world prices is not taken into
account, a rise in domestic agricultural prices would spuriously leave market shares
unaffected indicating higher quality. Panel C in Table A3 presents the estimates from an
augmented version of equation (1) that includes world agricultural prices as an additional
covariate. World prices enter with a positive sign as expected, whereas the rest of the
coefficients retains their signs and magnitudes. The overall picture is confirmed in Figure A2,
which plots the corresponding quality index for agricultural products and exhibits a similar
pattern with the one obtained in Figure 3, indicating an average annual rise of quality by 0.9%
for the period under consideration. This implies that the inclusion of world agricultural prices
indeed lowers somewhat the rise in the estimated quality of Greek agricultural products,
without however affecting the general trend.
3. Linking product quality with firm characteristics
In this section, I use the quality estimates to study (a) how product quality relates to key
aspects of firm characteristics and (b) the interplay between foreign market characteristics and
the relationship of product quality and firm characteristics.
3.1. Data and empirical specification
To address the questions posed in the Introduction, I use a newly compiled dataset on
Greek exporting firms that merges data from two sources. Trade data at the firm-product-
destination level are obtained from the Intrastat databank and firm-level variables are obtained
8 Source: Food and Agriculture Organization (http://www.fao.org/worldfoodsituation/foodpricesindex/en/).

13
from the Annual Manufacturing Survey (AMS), both available via the Greek Statistical
Agency (ELSTAT).
The Intrastat databank collects information and produces statistics on dispatches and
arrivals of goods in European Union countries and replaced customs declarations as the
source of trade statistics. In particular, the national authorities collect data on the
identification number allocated to the party responsible for providing information, the
reference period, the flow (arrival, dispatch), the value and quantity of the goods in net mass
(weight excluding packaging) and the supplementary unit (litre, m², number of items, etc.) if
relevant, and their destination. Firms whose annual trade amount is above a certain value are
responsible for providing information and this threshold value is re-defined so that a
minimum amount of data is collected for each trade flow. Each year, national authorities
define their thresholds, set in such a way so as to collect data relating to at least 97% of all
dispatches.
Export data at the firm level are combined with survey data available through the AMS,
which is carried out annually and contains data related to economic activity of medium-scale
and large-scale manufacturing firms. The firm survey is collected at the plant level, but export
and financial information is recorded at the firm level. Specifically, the survey provides
figures on types of expenses and labor force variables (like number of employees and
remuneration per type of worker).9 A key limitation of these data is therefore sample size in
some regressions, depending on the number of firms for which data via AMS are available.
Although the AMS data are available for the period 2001-2010, I focus on the
relationship between export quality at the product level and firm characteristics in a single
year in the panel, 2007. This strategy, also adopted by Manova and Zhang (2012), is
motivated by a number of considerations. First, the aim to establish stylized facts that obtain
in the cross-section of firms and not in export dynamics. Due to the structure of the survey,
there is no information on whether a firm is not included in one or more years because it has
exited from the export market, or because it was omitted from the sample. By focusing on a
single year I abstract from these issues and, also, concerns on nominal frictions, such as sticky
wages and prices, and related firm or sectoral dynamics. Second, I avoid to use data for years
2008 and 2009 due to the global trade crisis that might have affected the nature of exporting
in a small open economy like Greece (Behrens et al., 2013). Third, because data for one year
9 For a more detailed description of the external sector statistics and the Annual Industrial Survey, see
Theofilakou and Stournaras (2013) and Tsakanikas and Vassiliadis (2013).
14
denominated in Euros are examined, and given that as was established in the previous section,
the quality estimates of Greek exports remain unaffected when Eurozone destinations are
considered, the analysis is not sensitive to possible adjustments in the quality of exports by
Greek firms related to the adoption of the Euro in year 2001. Finally, from a technical point of
view, when I explore how the interaction of firm and destination market characteristics relates
with export quality, time-invariant (bilateral distance) or strongly persistent (GDP, GDP per
capita) variables are used. If the outcome variable were at the panel dimension, the standard
errors could be misleadingly low because the number of observations would be effectively
multiplied without necessarily introducing new information. Also, outliers are likely to be of
greater concern in a panel dataset extending over several years, as there is a lot of lumpiness
because many firms do not export a given product to a given market in every year.
Formally the estimating equation for year 2007 is given by (time index is omitted):
ln(λh) = c + δ1 x ln(firm_varf) + δ2 x [ln(firm_varf) x destd] + θ x ln(Wf) + εfhd (2)
The l.h.s. variable, λh, denotes quality at the product level obtained through equation (1).
On the r.h.s., firm_varf denotes the firm characteristic under consideration and parameter δ1
captures its conditional association with product quality. I consider a number of variables,
capturing labor (wage bill, number of persons employed and their wage rates), human capital
and innovation (training, R&D expenses and personell), various types of expenses
(advertising, export promotion, exhibition, royalties) and export subsidies.10
The term
ln(firm_varf) x destd interacts these firm characteristics with destination characteristics, like
size, income and distance, proxied by gdp, gdp per capita and bilateral distance respectively.11
The interaction term between the destination characteristics and the firm variable captures,
through parameter δ2, the extent to which the correlation between product quality and firm
characteristics is associated with these characteristics. I also take as regressors a vector of firm
characteristics, Wf, that proxy for the various conjectures to explain product quality at the firm
level through the parameter θ. In the empirical specification, Wf translates into the (logs of)
age and export intensity (measured as exports to total revenues), to account for size and
productivity performance, as more productive firms are expected to be more export oriented
(Melitz, 2003; Berman et al., 2012). Finally, the term εfhd denotes the firm-product (or firm-
product-destination depending on the specification used) error term.
10
The detailed description of the variables and their source codes is given in Table D3 of the Data Appendix. 11
Data on GDP and GDP per capita are obtained from the World Bank’s World Development Indicators and
bilateral distances is obtained from CEPII.
15
The primary interest is in the signs and significance levels of δ1 and δ2 in each
regression, which reflect the conditional correlations between export quality at the product
level and characteristics across firms that export the corresponding products. It should be
emphasized that δ1 and δ2 cannot be given a causal interpretation because product quality and
many firm attributes are both affected by unobserved firm characteristics. Moreover, in many
recent models of heterogeneous firms they are the joint outcome of firms’ profit maximization
and, hence, are simultaneously determined (Verhoogen, 2008; Feenstra and Romalis, 2014).
3.2. Results
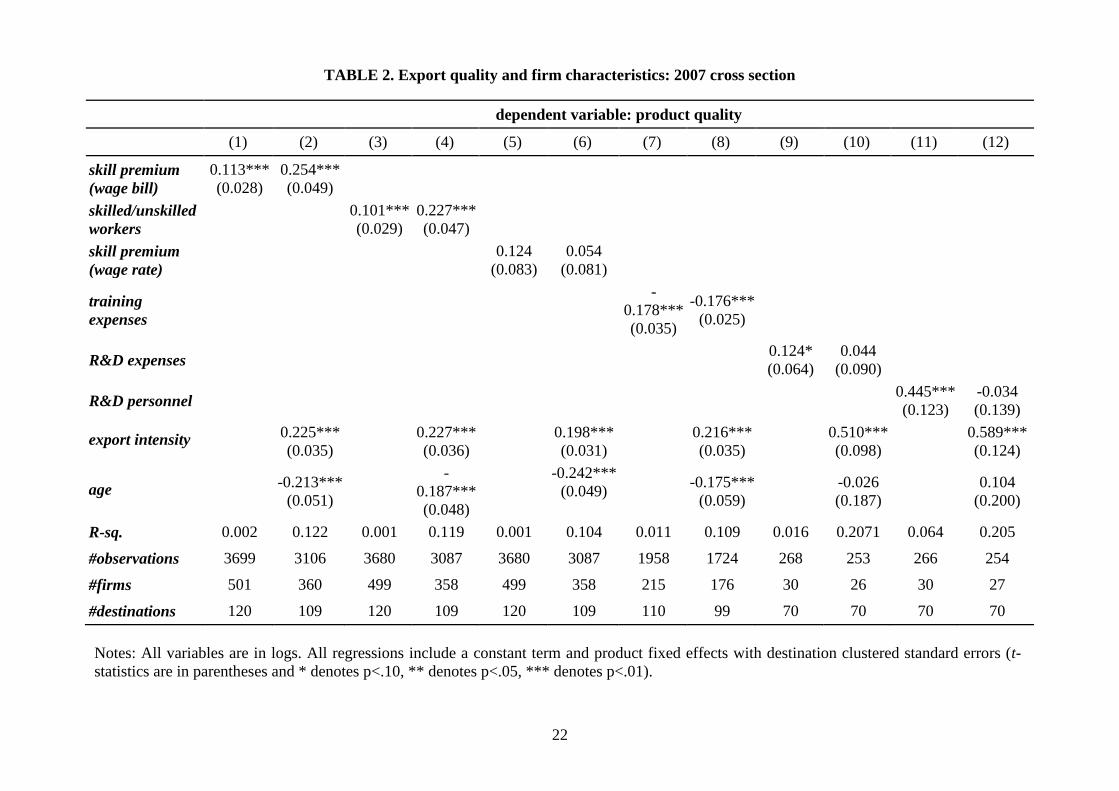
Table 2 presents the estimates of equation (2) with two regressions run for each firm
variable, namely without and with control variables. Turning first to the control variables,
they are almost always significant with robust signs: higher-product quality is associated with
larger and younger firms.
Concerning the variables of interest, columns (1) and (2) of Table 2 display the
coefficients for the wage skill premium, measured by the ratio of the wage bill for skilled to
unskilled employees. The former category comprises full and part-time employees on a
monthly payroll and the latter category comprises respectively full and part-time employees
paid on a daily salary. In both specifications the coefficient turns out positive and significant,
indicating that firms that spend relatively more on skilled labor export higher-quality
products. In the next four columns the wage bill is decomposed into the number of employees
and the wage rate.12
Specifically, columns (3) and (4) use the ratio of skilled to unskilled
workers as a r.h.s. variable and show that firms with relatively more skilled labor export
higher-quality products. Interestingly, the conditional correlations of product quality with the
wage-bill skill premium and the ratio of skilled to unskilled employees are larger when the
regressions control for export intensity and age, which implies that the outcomes do not hide a
spurious association of higher-productivity firms producing higher-quality products by
spending relatively more on skilled labor or employing relatively more skilled workers. In
contrast, the coefficients on the skill premium based on the wage rate do not show any
relation with product quality. I therefore conclude that the relative quantity (share) of skilled
employees is positively and significantly related to the product quality of exports, whereas the
12
The wage rate for skilled and unskilled workers is calculated by dividing the corresponding wage bills to the
numbers of employees. Denoting the wage bill, employment the wage rate by wb, n and w respectively, we get
that , where s and u denote skilled and unskilled labor.
16
relative price of skilled (relative to unskilled) labor is not.
In columns (7) to (12) of Table 2 product quality is regressed on measures related to
human capital, namely training expenses, R&D expenses and R&D personnel. I find that there
is a negative association of product quality with training expenses, a finding that might be
attributed to a negative correlation between the number of skilled to unskilled employees.
Indeed in the raw data there is a negative correlation between these variables amounting to -
0.19, indicating that firms with a lower share of skilled workers pay more on training
expenses and produce lower quality goods. On the other hand, there is a positive correlation
with both R&D measures, but survives only in the unconditioned regressions. In light of this
and the small number of firms included in this sample, this result should be interpreted as a
tentative one that requires further investigation.
In the second part of Table 2 the correlations with various share of expenses are
presented. The shares of advertising and promotion expenditures and exhibition expenditures
are negatively related to product quality, an effect that persists when the regressions control
for export intensity and age. The share of expenditures related to export promotion is
positively related to product quality, but the effect becomes insignificant when the
specifications includes export intensity and age, indicating that the unconditioned positive
relationship is likely to be driven by export-oriented, older firms that have established
networks in foreign markets. Finally, the share of expenses paid on royalties is not found to be
related to product quality, whereas the coefficient on export subsidies changes sign between
the two regressions and relies on a very small number of firms.
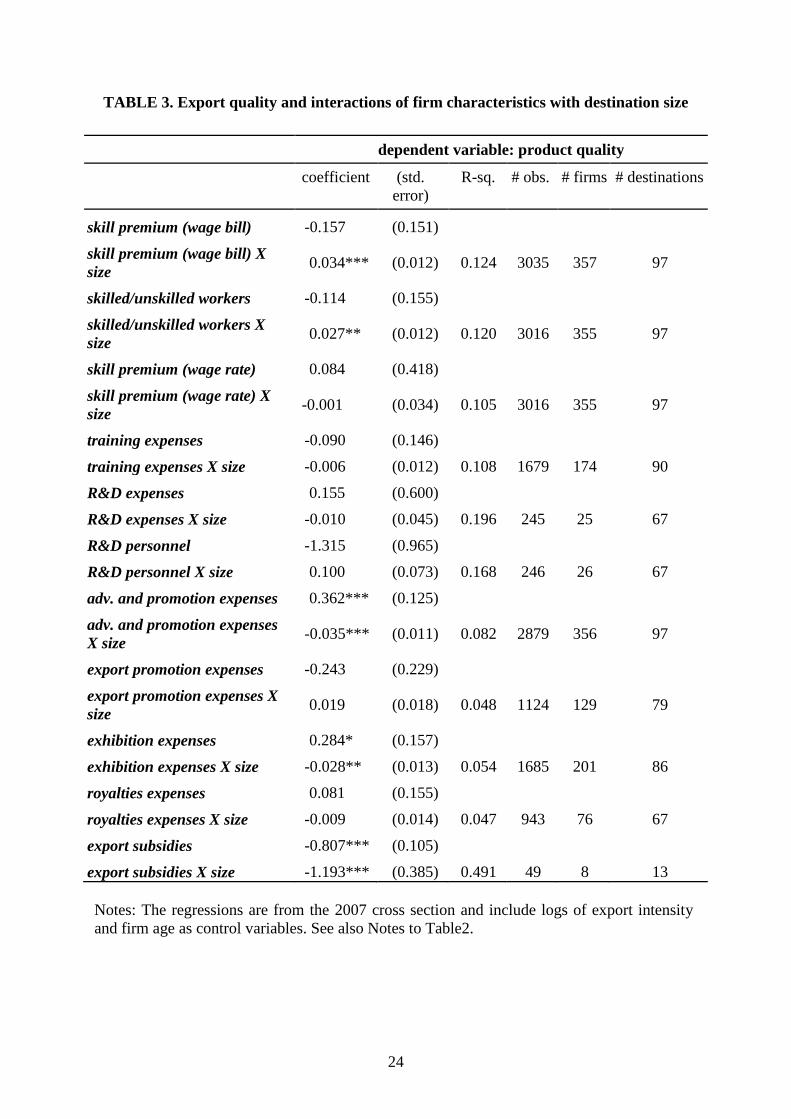
As a next step in the analysis of the association between firm characteristics with
product quality, Tables 3 to 5 summarize the results from including interaction terms of firm
characteristics with destination size, income and distance. Specifically, the first two rows in
Table 3 display the direct coefficient of the wage-bill skill premium and its interaction with
destination size (gdp). The coefficient on the wage-bill skill premium is now negative and
insignificant, whereas the interaction is positive and significant indicating that the positive
association with product quality increases for larger destinations. In the next two regressions
the effects are decomposed in the ratio of skilled to unskilled employees and the wage rate
skill premium. The correlation of the ratio of skilled to unskilled workers with product quality
is negative and insignificant, but is significantly positive for larger destinations. The
coefficient on the wage rate skill premium is positive and its interaction with size is negative,
but both effects are insignificant. The corresponding rows of Table 4, which contain the

17
specifications with the interactions with destination income (gdp per capita) show that the
coefficients on the wage bill skill premium and the ratio of skilled to unskilled workers are
negative and significant, whereas the corresponding interactions with destination income are
positive and significant. In contrast, these effects become insignificant when the interactions
with distance are considered. The wage rate skill premium is positive and its interactions with
income and distance are negative, but only marginally significant (see fifth and sixth rows of
Tables 4 and 5). The general picture that emerges therefore is that the positive correlations
found between product quality and (a) the wage bill ratio, (b) the ratio of skilled to unskilled
workers, are mainly driven by large and rich destinations.
Regarding the rest of the estimated correlations, it should be noted that in contrast to the
simple model of Table 2, the association of product quality with advertising-promotion and
exhibition related expenditures is now positive, whereas the interactions with destination size
and income are negative. This finding implies diminishing returns of product quality w.r.t.
marketing; higher spending for advertising and exhibitions is associated with higher-quality
products, which are presumably more expensive, but the association becomes weaker in larger
and richer markets. This conjecture is in line with the assumption put forward in Arkolakis
(2010) that the marginal cost of marketing in firm exporting increases with the market size, in
the form of number of consumers, reached. I find here a similar pattern for the interactions
with destination income, which would imply that the marginal cost of marketing also
increases with the income of consumers reached, a finding that provides a potentially fruitful
avenue for future research.13
4. Conclusions
Empirical research in trade models has consistently found that product quality
influences cross-border trade; richer countries consume and export higher quality products
than developing countries, with most studies using observable unit prices as proxies for
quality. This study estimated the quality of Greek exports based on the premise that a
product’s quality will rise if its price in a market can rise without losing market share. A
specification that relates market shares to prices and other determinants was estimated using
13
Table 5 also shows that the correlation of R&D expenditures as a share of total expenditures and product
quality is positive and significant, whereas the interaction term with distance is negative, which implies that the
this association becomes weaker for more distant destinations. However, given the small number of firms with
observations for R&D expenditures (25 firms), this result should be interpreted with caution.
18
Greek export data over the period 1998-2012. Export quality in manufacturing is estimated to
have fallen by 1% per year on average for the period 1998-2010, but recovered in 2011 and
2012 when export quality displayed a cumulative rise of 25.7%, yielding a cumulative rise of
9.2% for the entire period 1998-2012. Export quality in agriculture displays a slightly upward
trend with the average annual rise over the period 1998-2012 amounting to 1.6%. Linking the
quality estimates at the product level in the manufacturing sector with exporting firms shows
that skill-intensive firms export higher-quality products, an effect that is more pronounced in
large and rich destinations.
Looking ahead, the implications of the findings presented here are relevant from a
policy perspective. The promotion of quality as a dimension of international competitiveness
is an objective of high-income economies facing price competition from low-wage countries.
Given that the treatment of the product-quality related characteristics, like skilled
employment, is sensitive to policy parameters, the nexus between export quality and the
skilled to unskilled employment ratio should be considered when evaluating the implications
of policies that may affect a firm’s composition of employment.

19
References
Arkolakis C. (2010), ‘Market penetration costs and the new consumers margin in
international trade’, Journal of Political Economy, 118(6), 1151-1199.
Atkin D., A. Chaudhry, S. Chaudry, A. K. Khandelwal and E. Verhoogen (2015),
‘Mark-up and cost dispersion across firms: direct evidence from producer surveys in
Pakistan’, American Economic Review, 105(5), 537-544.
Baldwin R. and J. Harrigan (2011), ‘Zeros, quality, and space: trade theory and
trade evidence’, American Economic Journal: Microeconomics, 3(2), 60-88.
Bastos P. and J. Silva (2010), ‘The quality of a firm’s exports: where you export to
matters’, Journal of International Economics, 82(2), 99-111.
Behrens K., G. Corcos and G. Mion (2013), ‘Trade crisis? what trade crisis?’,
Review of Economics and Statistics, 95(2), 702-709.
Berman N., P. Martin and T. Mayer (2012), ‘How do different exporters react to
exchange rate changes?’, Quarterly Journal of Economics, 127(1), 437-492.
Brambilla I., D. Lederman, and G. Porto (2012), ‘Exports, export destinations, and
skills’, American Economic Review, 102(7), 3406-3438.
Crozet M., K. Head and T. Mayer (2012), ‘Quality sorting and trade: firm-level
evidence for French wine’, Review of Economic Studies, 79(2), 609-644.
Di Comité F., J. Thisse and H. Vandenbussche (2014), ‘Verti-zontal differentiation
in export markets’, Journal of International Economics, 93(1), 50-66.
Feenstra R. and J. Romalis (2014), ‘International prices and endogenous quality’,
Quarterly Journal of Economics, 129 (2), 477-527.
Fontagné L., G. Gaulier and S. Zignago (2008), ‘Specialization across varieties and
North-South competition’, Economic Policy, 23, 51-91.
Hallak J.C. (2006), ‘Product quality and the direction of trade’, Journal of
International Economics, 68(1), 238-265.
Hallak J.C. and P.K. Schott (2011), ‘Estimating cross-country differences in product
quality’, Quarterly Journal of Economics, 126(1), 417-474.
Harrigan J., X. Ma and and V. Shlychkov (2015), ‘Export prices of U.S. firms’,
Journal of International Economics, 97(1), 100-111.
Hausmann R., J. Hwang and D. Rodrik (2007), “What you export matters’, Journal of
Economic Growth, 12, 1-25.
Henn C., C. Papageorgiou and N. Spatafora (2013), ‘Export quality in developing
countries’, IMF Working Paper No. 13/108.
Hummels D. and P.J. Klenow (2005), ‘The variety and quality of a nation's

20
exports’, American Economic Review, 95(3), 704-723.
Johnson R.C. (2012), ‘Trade and prices with heterogeneous firms’, Journal of
International Economics, 86(1) 43-56.
Khandelwal A. (2010), ‘The long and short (of) quality ladders’, Review of
Economic Studies, 77(4), 1450-1476.
Kugler M. and E. Verhoogen (2012), ‘Prices, plant size, and product quality’, Review
of Economic Studies, 79(1), 307-339.
Manova K. and Z. Zhang (2012), ‘Export prices across firms and destinations’,
Quarterly Journal of Economics, 127(1), 379-436.
Matsuyama K. (2007), ‘Beyond icebergs: towards a theory of biased globalization’,
Review of Economic Studies, 74(1), 237-53.
Melitz M.J. (2003), ‘The impact of trade on intra-industry reallocations and
aggregate industry productivity’, Econometrica, 71(6), 1695-1725.
Rauch J. (1999), ‘Networks versus markets in international trade’, Journal of
International Economics, 48(1), 7-35.
Schott P.K. (2004), ‘Across-product versus within-product specialization in
international trade’, Quarterly Journal of Economics, 119(2), 647-678.
Schott P.K. (2008), ‘The relative sophistication of Chinese exports’, Economic
Policy, 53, 5-49.
Sutton J. (1991), Sunk Costs and Market Structure, Cambridge, MIT Press.
Sutton J. and D. Trefler (2011), ‘Deductions from the export basket: capabilities,
wealth and trade’, NBER Working Papers 16834.
Theofilakou N.K. and Y. Stournaras (2013), ‘An analysis of Greek external sector
statistics and their application in academic research and economic policy making’,
Journal of Economic and Social Measurement, 38(1), 41–56.
Tsakanikas A. and M. Vassiliadis (2013), ‘A methodological review of the Greek
Annual Industrial Survey’, Journal of Economic and Social Measurement, 38(1), 57–77.
Vandenbussche H. (2014), ‘Quality in exports’, European Economy, Economic
Papers 528.
Verhoogen E.A. (2008), ‘Trade, quality upgrading, and wage inequality in the
Mexican manufacturing sector’, Quarterly Journal of Economics, 123(2), 489-530.
21
TABLE 1. Export quality estimation results: coefficient estimates of equation (1)
Statistic Mean Median
A. Manufacturing
Price coefficient -0.612 -0.550
Coefficient on conditional market
share 0.718 0.717
Coefficient on population 0.028 0.013
Estimations with statistically
significant negative price coefficient
at 5% level
68
Observations with statistically
significant negative price coefficient
at 5% level
36634
Total estimations 71
Total observations across all
estimations
37688
B. Agriculture
Price coefficient -1.017 -0.936
Coefficient on conditional market
share 0.698 0.669
Coefficient on population 0.076 0.054
Estimations with statistically
significant negative price coefficient
at 5% level
11
Observations with statistically
significant negative price coefficient
at 5% level
10040
Total estimations 13
Total observations across all
estimations
11288
Notes: The first three rows in Panels A and B report estimation statistics of
running equation (1) separately for each of the 71 SITC5 manufacturing products
and the 13 SITC5 agricultural products. respectively.
22
TABLE 2. Export quality and firm characteristics: 2007 cross section
dependent variable: product quality
(1) (2) (3) (4) (5) (6) (7) (8) (9) (10) (11) (12)
skill premium
(wage bill)
0.113***
(0.028)
0.254***
(0.049)
skilled/unskilled
workers 0.101***
(0.029)
0.227***
(0.047)
skill premium
(wage rate) 0.124
(0.083)
0.054
(0.081)
training
expenses
-
0.178***
(0.035)
-0.176***
(0.025)
R&D expenses 0.124*
(0.064)
0.044
(0.090)
R&D personnel 0.445***
(0.123)
-0.034
(0.139)
export intensity 0.225***
(0.035) 0.227***
(0.036)
0.198***
(0.031) 0.216***
(0.035) 0.510***
(0.098) 0.589***
(0.124)
age -0.213***
(0.051)
-
0.187***
(0.048)
-0.242***
(0.049) -0.175***
(0.059) -0.026
(0.187) 0.104
(0.200)
R-sq. 0.002 0.122 0.001 0.119 0.001 0.104 0.011 0.109 0.016 0.2071 0.064 0.205
#observations 3699 3106 3680 3087 3680 3087 1958 1724 268 253 266 254
#firms 501 360 499 358 499 358 215 176 30 26 30 27
#destinations 120 109 120 109 120 109 110 99 70 70 70 70
Notes: All variables are in logs. All regressions include a constant term and product fixed effects with destination clustered standard errors (t-
statistics are in parentheses and * denotes p<.10, ** denotes p<.05, *** denotes p<.01).

23
TABLE 2. Export quality and firm characteristics: 2007 cross section (continued)
dependent variable: product quality
(1) (2) (3) (4) (5) (6) (7) (8) (9) (10)
advertising and
promotion
expenses
-0.142***
(0.030)
-0.063***
(0.018)
export promotion
expenses
0.089***
(0.032)
0.005
(0.035)
exhibition
expenses
-0.058***
(0.022)
-0.072***
(0.024)
royalties
expenses
-0.028
(0.028)
-0.028
(0.025)
export subsidies 0.208*
(0.117)
-0.823***
(0.184)
export intensity 0.160***
(0.029)
0.190***
(0.034)
0.177***
(0.033)
0.172***
(0.050)
1.025***
(0.165)
age -0.201***
(0.044)
-0.195***
(0.061)
-0.239***
(0.062)
-0.256***
(0.094)
0.667*
(0.352)
R-sq. 0.029 0.090 0.008 0.080 0.002 0.067 0.000 0.048 0.214 0.445
#observations 3583 2951 1198 1149 2145 1740 1129 955 55 49
#firms 501 359 145 129 263 203 102 77 11 8
#destinations 120 109 86 85 109 95 89 73 16 13
Notes: All variables are in logs. All regressions include a constant term and product fixed effects with destination clustered standard errors (t-
statistics are in parentheses and * denotes p<.10, ** denotes p<.05, *** denotes p<.01).
24
TABLE 3. Export quality and interactions of firm characteristics with destination size
dependent variable: product quality
coefficient (std.
error)
R-sq. # obs. # firms # destinations
skill premium (wage bill) -0.157 (0.151)
skill premium (wage bill) X
size 0.034*** (0.012) 0.124 3035 357 97
skilled/unskilled workers -0.114 (0.155)
skilled/unskilled workers X
size 0.027** (0.012) 0.120 3016 355 97
skill premium (wage rate) 0.084 (0.418)
skill premium (wage rate) X
size -0.001 (0.034) 0.105 3016 355 97
training expenses -0.090 (0.146)
training expenses X size -0.006 (0.012) 0.108 1679 174 90
R&D expenses 0.155 (0.600)
R&D expenses X size -0.010 (0.045) 0.196 245 25 67
R&D personnel -1.315 (0.965)
R&D personnel X size 0.100 (0.073) 0.168 246 26 67
adv. and promotion expenses 0.362*** (0.125)
adv. and promotion expenses
X size -0.035*** (0.011) 0.082 2879 356 97
export promotion expenses -0.243 (0.229)
export promotion expenses X
size 0.019 (0.018) 0.048 1124 129 79
exhibition expenses 0.284* (0.157)
exhibition expenses X size -0.028** (0.013) 0.054 1685 201 86
royalties expenses 0.081 (0.155)
royalties expenses X size -0.009 (0.014) 0.047 943 76 67
export subsidies -0.807*** (0.105)
export subsidies X size -1.193*** (0.385) 0.491 49 8 13
Notes: The regressions are from the 2007 cross section and include logs of export intensity
and firm age as control variables. See also Notes to Table2.

25
TABLE 4. Export quality and interactions of firm characteristics with destination
income
dependent variable: product quality
coefficient (std.
error)
R-sq. # obs. # firms # destinations
skill premium (wage bill) -0.738* (0.390)
skill premium (wage bill) X
income 0.100** (0.039) 0.124 3035 357 97
skilled/unskilled workers -0.782** (0.378)
skilled/unskilled workers X
income 0.102*** (0.037) 0.120 3016 355 97
skill premium (wage rate) 1.960* (1.054)
skill premium (wage rate) X
income -0.190* (0.108) 0.102 3016 355 97
training expenses 0.200 (0.308)
training expenses X income -0.037 (0.031) 0.096 1679 174 90
R&D expenses 0.137 (1.603)
R&D expenses X income -0.010 (0.160) 0.204 245 25 67
R&D personnel -2.509 (1.714)
R&D personnel X income 0.250 (0.172) 0.153 246 26 67
adv. and promotion expenses 0.962*** (0.243)
adv. and promotion expenses
X income -0.104*** (0.025) 0.079 2879 356 97
export promotion expenses 0.086 (0.403)
export promotion expenses X
income -0.008 (0.041) 0.083 1124 129 79
exhibition expenses 0.722** (0.289)
exhibition expenses X income -0.080*** (0.029) 0.046 1685 201 86
royalties expenses 1.128*** (0.411)
royalties expenses X income -0.117*** (0.042) 0.037 943 76 67
export subsidies -0.774*** (0.082)
export subsidies X income -2.129*** (0.392) 0.557 49 8 13
Notes: See Table3.

26
TABLE 5. Export quality and interactions of firm characteristics with destination
distance
dependent variable: product quality
coefficient (std.
error)
R-sq. # obs. # firms # destinations
skill premium (wage bill) -0.304 (0.441)
skill premium (wage bill) X
distance 0.076 (0.062) 0.126 3035 357 97
skilled/unskilled workers -0.384 (0.407)
skilled/unskilled workers X
distance 0.083 (0.057) 0.120 3016 355 97
skill premium (wage rate) 0.953* (0.492)
skill premium (wage rate) X
distance -0.120* (0.067) 0.100 3016 355 97
training expenses 0.237 (0.193)
training expenses X distance -0.056** (0.027) 0.115 1679 174 90
R&D expenses 1.759** (0.833)
R&D expenses X distance -0.243** (0.117) 0.077 245 25 67
R&D personnel -0.356 (1.567)
R&D personnel X distance 0.038 (0.222) 0.208 246 26 67
adv. and promotion expenses 0.344 (0.224)
adv. and promotion expenses
X distance -0.056* (0.033) 0.097 2879 356 97
export promotion expenses -0.815*** (0.170)
export promotion expenses X
distance 0.110*** (0.021) 0.010 1124 129 79
exhibition expenses 0.428** (0.182)
exhibition expenses X
distance -0.069*** (0.025) 0.072 1685 201 86
royalties expenses 0.075 (0.218)
royalties expenses X distance -0.014 (0.032) 0.051 943 76 67
export subsidies -0.852*** (0.107)
export subsidies X distance -2.584*** (0.716) 0.558 49 8 13
Notes: See Table3.
27
FIGURE 1. Quality of Greek Exports, 1998-2012: Manufacturing (aggregate)
FIGURE 2. Quality of Greek Exports, 1998-2012: Manufacturing (sectoral)
95
100
105
110
115
120
125
130
1998 2000 2002 2004 2006 2008 2010 2012
Quality index: Manufacturing
60
80
100
120
140
160
180
1998 2000 2002 2004 2006 2008 2010 2012
SITC 5 SITC 6 SITC 7 SITC 8

28
FIGURE 3. Quality of Greek Exports, 1998-2012: Agriculture (aggregate)
FIGURE 4. Quality of Greek Exports, 1998-2012: Agriculture (sectoral)
70
75
80
85
90
95
100
105
110
1998 2000 2002 2004 2006 2008 2010 2012
Quality index: Agriculture
30
50
70
90
110
130
1998 2000 2002 2004 2006 2008 2010 2012
SITC 04 SITC 05 SITC 07 SITC 09 SITC 11
29
Table A1. Quality indices of Greek manufacturing exports, by SITC1 and total
Year SITC 5 (4) SITC 6 (12) SITC 7 (12) SITC 8 (43) Total
Indices (2010=100)
1998 164.2 126.3 148.1 108.6 115.1
1999 138.4 115.6 95.6 102.6 103.2
2000 115.2 78.6 121.9 108.7 108.3
2001 101.8 72.9 115.5 112.6 110.1
2002 100.5 71.5 132.4 105.4 105.6
2003 151.0 75.5 120.3 108.8 110.0
2004 166.8 67.8 120.6 104.3 107.6
2005 166.4 69.3 119.9 111.5 112.8
2006 151.0 84.9 101.5 107.2 107.9
2007 131.3 82.4 101.2 101.2 101.7
2008 105.5 86.0 107.0 115.6 110.1
2009 100.3 102.7 105.7 114.0 110.9
2010 100.0 100.0 100.0 100.0 100.0
2011 115.7 106.3 94.9 120.1 113.7
2012 144.9 142.1 109.6 123.6 125.7
y/y % change
1999 -26.8 -11.7 -53.5 -7.1 -10.3
2000 -24.2 -38.1 25.3 5.2 4.9
2001 -14.3 -6.6 -7.5 2.9 1.7
2002 -2.3 -2.4 15.9 -8.3 -4.1
2003 49.5 2.9 -13.1 2.5 4.1
2004 14.9 -8.7 -0.7 -5.5 -2.17
2005 -1.5 0.5 -1.7 6.3 4.9
2006 -16.4 14.6 -19.4 -5.3 -4.3
2007 -20.7 -3.4 -1.3 -7.0 -5.7
2008 -26.8 2.6 4.8 13.4 8.2
2009 -6.3 15.7 -2.4 -2.6 0.7
2010 -1.3 -3.7 -6.7 -15.0 -9.8
2011 14.7 5.3 -6.1 19.1 13.7
2012 28.2 34.7 13.7 2.5 10.6
Note: The first line (in bold) denotes the aggregate (SITC1) product classifications and the
number of SITC5 products used in each SITC1 category.

30
Table A2. Quality indices of Greek agricultural exports, by SITC1 and total
Year SITC 04 (3) SITC 05 (5) SITC 07 (2) SITC 09 (2) SITC 11 (1) Total
Indices (2010=100)
1998 87.1 62.2 90.8 61.5 102.2 50.6
1999 82.1 40.4 87.1 57.0 102.4 46.6
2000 76.9 48.8 79.2 71.3 90.5 85.0
2001 76.9 54.3 78.4 60.0 101.6 72.2
2002 82.3 57.3 85.0 69.0 95.5 80.8
2003 89.2 69.0 93.4 81.8 97.5 67.4
2004 80.9 58.1 83.3 89.2 96.4 61.6
2005 78.4 65.1 77.5 89.5 96.5 52.2
2006 81.7 66.5 81.4 89.3 98.8 47.4
2007 93.3 80.6 92.7 84.5 111.8 48.6
2008 105.1 128.9 100.8 105.7 106.6 39.2
2009 106.2 106.7 107.3 116.1 99.6 97.2
2010 100.0 100.0 100.0 100.0 100.0 100.0
2011 100.3 108.5 98.7 110.0 100.9 69.5
2012 105.2 108.8 107.2 104.7 96.0 90.2
y/y % change
1999 -22.8 -4.7 -5.5 -0.8 -5.1 -5.7
2000 7.5 -8.9 13.2 -13.0 37.4 -6.4
2001 4.4 -1.8 -12.3 10.2 -13.8 0.0
2002 2.0 5.6 8.1 -7.2 7.6 7.0
2003 10.8 7.5 11.7 1.0 -14.4 8.3
2004 -12.0 -11.2 6.5 -2.1 -6.7 -9.3
2005 6.0 -6.8 -0.8 -0.9 -10.5 -3.0
2006 0.3 2.9 -1.2 1.3 -5.8 4.1
2007 13.2 10.3 -5.8 12.0 0.2 14.2
2008 47.2 7.1 20.3 -6.2 -10.5 12.7
2009 -23.1 5.5 9.3 -8.1 57.0 1.0
2010 -7.7 -8.3 -17.1 -0.6 1.8 -5.8
2011 7.5 -2.3 9.0 -0.1 -31.5 0.3
2012 -0.8 7.5 -6.2 -5.8 19.7 4.8
Note: The first line (in bold) denotes the aggregate (SITC1) product classifications and the
number of SITC5 products used in each SITC1 category.
31
TABLE A3. Sensitivity analysis of coefficient estimates of equation (1)
Statistic Mean Median
A. Eurozone (manufacturing products)
Price coefficient -0.592 -0.560
Coefficient on conditional market share 0.720 0.717
Coefficient on population 0.014 0.012
Estimations with statistically significant
negative price coefficient at 5% level
68
Observations with statistically significant
negative price coefficient at 5% level
11965
Total estimations 71
Total observations across all estimations 12397
B. European Union (manufacturing products)
Price coefficient -0.596 -0.560
Coefficient on conditional market share 0.721 0.723
Coefficient on population 0.019 0.012
Estimations with statistically significant
negative price coefficient at 5% level
68
Observations with statistically significant
negative price coefficient at 5% level
21886
Total estimations 71
Total observations across all estimations 22671
C. Controlling for world agricultural prices
Price coefficient -1.077 -0.818
Coefficient on conditional market share 0.696 0.685
Coefficient on population 0.078 0.053
Coefficient on world agricultural price
index 0.192 0.213
Estimations with statistically significant
negative price coefficient at 5% level
11
Observations with statistically significant
negative price coefficient at 5% level
10037
Total estimations 13
Total observations across all estimations 11288
Notes: See Table 1.
32
FIGURE A1. Quality of Greek Exports to EU and Eurozone countries, 1998-2012:
Manufacturing (aggregate)
FIGURE A2. Quality of Greek Exports, 1998-2012:
Agriculture (aggregate) after controlling for world prices
95
100
105
110
115
120
125
130
135
140
145
150
1998 2000 2002 2004 2006 2008 2010 2012
EU Eurozone
80
85
90
95
100
105
110
115
1998 2000 2002 2004 2006 2008 2010 2012
Quality index: Agriculture
33
DATA APPENDIX
TABLE D1. Manufacturing sector: product categories used in the estimation
(description, SITC code and number of CN8 codes within SITC)
SECTOR (SITC1 code) SITC5 (# CN8) Average
Weight
Chemicals and Related Products, n.e.s. (5)
Paints & varnishes (including enamels & lacquers) based on
synthetic polymers/chemically modified natural polymers,
dispersed/dissolved in a non-aqueous medium; plastics in solution 53342 (5) 0,037
Glaziers’ putty, grafting putty, resin cement, caulking compounds
and other mastics, painters’ fillings, nonrefractory surfacing
preparations 53354 (3) 0,005
Wadding, gauze, bandages etc. impregnated/coated with
pharmaceutical products or in retail packages for
medical/dental/veterinary use, n.e.s. 54191 (3) 0,007
Organic surface-active agents, put-up for retail, sale or not 55421 (3) 0,008
Manufactured Goods Classified Chiefly by Material (6)
Conveyor belts/belting 62922 (3) 0,039
Narrow woven fabrics, n.e.s. 65613 (3) 0,001
Other embroidery 65659 (5) 0,005
Textile fabrics impregnated, coated, covered/laminated with
plastics, other than those of heading 65732 (4) 0,002
Twine, cordage, ropes & cables, whether/not plaited/braided &
whether/not impregnated, coated, covered/sheathed with
rubber/plastics 65751 (4) 0,005
Textile wadding materials and articles thereof, textile fibers not
over 5mm in length (flock), textile dust and mill neps 65771 (4) 0,011
Furnishing articles, n.e.s. of textile materials 65859 (3) 0,001
Articles of plaster or of composition based on plaster 66331 (3) 0,004
Wire cloth, grill, netting and fencing, and expanded metal, of
iron/steel 69350 (3) 0,002
Screws, bolts, nuts, screw hooks, rivets, washers and similar
articles, threaded, of iron/steel 69421 (4) 0,001
Clasps, buckles, hooks, eyes, etc. of base metal for clothing,
handbags, awnings, etc. base metal tubular etc. rivets, base metal 69933 (3) 0,002

34
beds and spangles
Stoppers, caps, lids, etc., capsules for bottles, threaded bungs,
bung covers, seals, etc., of base metal 69953 (3) 0,020
Machinery and Transport Equipment (7)
Textile machinery for washing, wringing, pressing, dyeing,
coating etc., textile yarn, fabric/articles, textile machinery, n.e.s. 72474 (3) 0,008
Machinery, n.e.s., for the industrial preparation/manufacture of
food/drink 72722 (5) 0,008
Agricultural/horticultural appliances for projecting, dispersing, or
spraying liquids/powders 74564 (3) 0,017
Taps, cocks, valves and similar appliances, n.e.s. 74780 (8) 0,013
Apparatus for protecting electrical circuits, n.e.s., not exceeding
1.000 volts 77253 (3) 0,006
Switches for electrical apparatus, n.e.s., for voltages not
exceeding 1.000 volts 77255 (3) 0,002
Household/laundry type washing machines, each of a dry linen
capacity not exceeding 10kg 77511 (3) 0,005
Refrigerators, household-type (electric/other), whether/not
containing a deep-freeze compartment 77521 (3) 0,006
Electrics space heating and electrics soil heating apparatus 77582 (3) 0,002
Microwave ovens; other ovens; cookers, cooking plates, boiling
rings, grillers & roasters 77586 (5) 0,026
Motors vehicles for the transport of persons (other than public),
n.e.s. 78120 (4) 0,020
Motor vehicles for the transport of goods, n.e.s. 78219 (3) 0,004
Miscellaneous Manufactured Articles (8)
Electric lamps and lightning fittings, n.e.s. 81315 (3) 0,002
Furniture, n.e.s., of wood, of a kind used in offices 82151 (3) 0,002
Furniture, n.e.s., of wood, n.e.s. 82159 (3) 0,009
Articles of a kind normally carried in the pocket or handbag 83191 (3) 0,000
Other travel goods, handbags & similar containers 83199 (4) 0,002
Overcoats, raincoats, carcoats, capes and similar articles, of
woven textile materials other than wool or fine animal hair,
men’s/boys’ 84112 (5) 0,003
Anoraks, windbreakers and similar articles of woven textile 84119 (4) 0,003

35
materials, men’s/boys’
Suits of woven textile materials other than wool or fine animal
hair, men’s/boys’ 84122 (3) 0,002
Ensembles of woven textile materials, men’s/boys’ 84123 (3) 0,002
Jackets and blazers of woven textile materials, men’s/boys’ 84130 (4) 0,006
Trousers, bib & brace overalls, breeches & shorts, men's/boys', of
textile materials, not knitted/crocheted 84140 (10) 0,036
Overcoats, raincoats, capes, cloaks and similar articles of woven
textile fabrics, women’s/girls’ 84211 (6) 0,003
Anoraks, windbreakers and similar articles of woven textile
fabrics, women’s/girls’ 84219 (3) 0,001
Suits of woven textile fabrics, women’s/girls’ 84221 (4) 0,006
Ensembles of woven textile fabrics, women’s/girls’ 84222 (3) 0,007
Jackets of woven textile fabrics, women’s/girls’ 84230 (5) 0,007
Dresses, women's/girls', of textile materials, not knitted/crocheted 84240 (4) 0,012
Skirts & divided skirts, women's/girls', of textile materials, not
knitted/crocheted 84250 (5) 0,010
Trousers, bib & brace overalls, breeches & shorts, women's/girls',
of textile materials, not knitted/crocheted 84260 (9) 0,026
Blouses, shirts & shirt-blouses, women's/girls', of textile
materials, not knitted/crocheted 84270 (6) 0,042
Overcoats, carcoats, capes, anoraks, cloaks, etc., knitted/crocheted
fabric, women’s/girls’ 84410 (3) 0,001
Jackets & blazers, women's/girls', knitted/crocheted of textile
materials 84423 (4) 0,018
Dresses, women's/girls', knitted/crocheted of textile materials 84424 (4) 0,020
Skirts & divided skirts, women's/girls', knitted/crocheted of textile
materials 84425 (4) 0,007
Blouses, shirts & shirt-blouses, women's/girls', knitted/crocheted
of textile materials 84470 (4) 0,371
Jerseys, pullovers, cardigans, waistcoats & similar articles,
knitted/crocheted 84530 (7) 0,031
Griddles, corsets, braces, suspenders, garters and similar articles,
whether/not knitted/crocheted 84552 (3) 0,002
Articles of apparel, men's/boys', n.e.s., not knitted/crocheted 84587 (4) 0,001

36
Garments, knitted/crocheted, n.e.s. 84599 (3) 0,010
Shawls, scarves, mufflers, mantillas, vales and the like, not
knitted/crocheted 84612 (3) 0,000
Ties, bow ties and cravats, not knitted/crocheted 84613 (3) 0,000
Hosiery, n.e.s. 84692 (3) 0,000
Footwear, n.e.s., with outer soles and uppers of rubber/plastics,
n.e.s. 85132 (3) 0,004
Footwear, n.e.s., with outer soles of leather and uppers of
leather/composition leather 85148 (16) 0.016
Spectacles, goggles and the like, corrective, protective or other 88423 (3) 0.002
Paper/paperboard labels of all kinds, whether/not printed 89281 (4) 0,004
Sacks and bags of plastics 89311 (3) 0,010
Articles for the conveyance/packing of goods, n.e.s., of plastics,
stoppers, lids, caps and other closures, of plastics 89319 (6) 0,028
Baths, shower baths, washbasins, bidets, lavatory pans, seats and
covers, flushing cisterns and similar sanitary ware, of plastics 89321 (3) 0,003
Other builders' ware of plastics 89329 (5) 0,019
Brooms, brushes, mops and feather dusters, prepared knots and
tufts, paint pads etc. 89972 (5) 0,002
Press-fasteners, snap-fasteners and press-studs and parts thereof,
button 89983 (4) 0,006
Combs, hair-slides and the like, hairpins, curling pins, curling
grips, hair curlers and the like (except electric), and parts thereof 89989 (3) 0,000
Notes: Lines in bold denote the aggregate (SITC1) product classifications. The rest of the lines
denote disaggregated (SITC5) product classifications. The last column indicates the share of
revenues for the corresponding SITC code, averaged over the period 1998-2012.
37
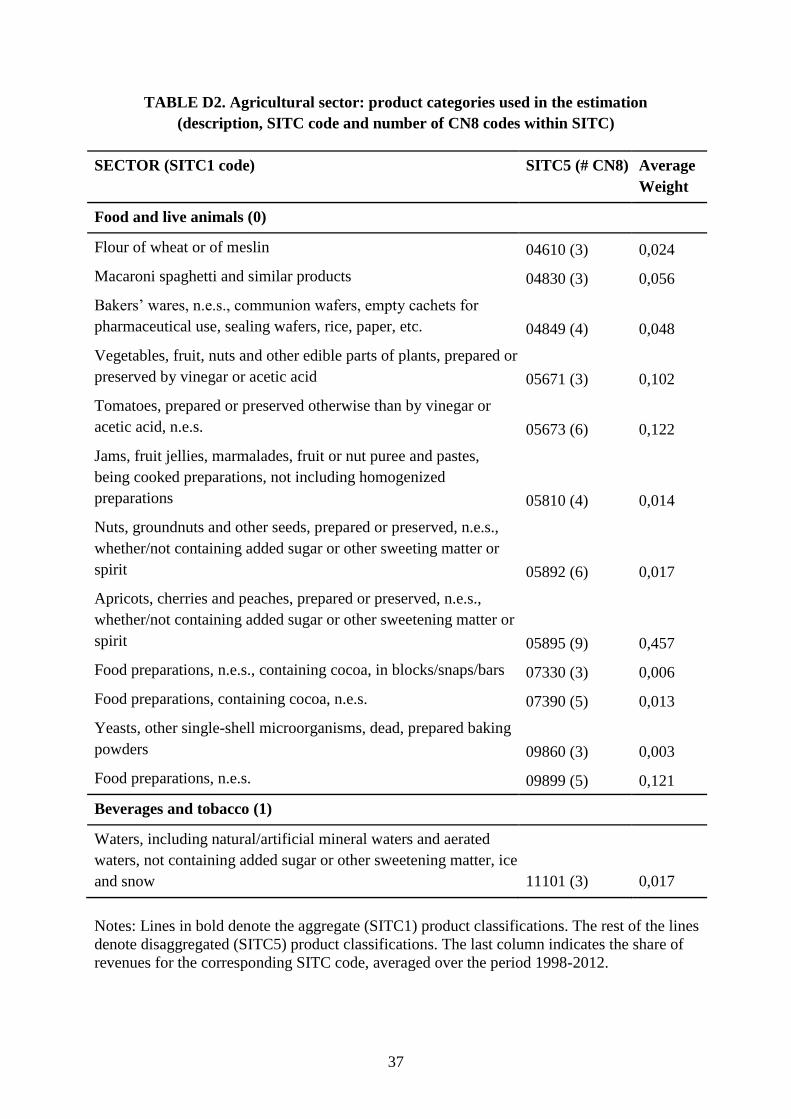
TABLE D2. Agricultural sector: product categories used in the estimation
(description, SITC code and number of CN8 codes within SITC)
SECTOR (SITC1 code) SITC5 (# CN8) Average
Weight
Food and live animals (0)
Flour of wheat or of meslin 04610 (3) 0,024
Macaroni spaghetti and similar products 04830 (3) 0,056
Bakers’ wares, n.e.s., communion wafers, empty cachets for
pharmaceutical use, sealing wafers, rice, paper, etc. 04849 (4) 0,048
Vegetables, fruit, nuts and other edible parts of plants, prepared or
preserved by vinegar or acetic acid 05671 (3) 0,102
Tomatoes, prepared or preserved otherwise than by vinegar or
acetic acid, n.e.s. 05673 (6) 0,122
Jams, fruit jellies, marmalades, fruit or nut puree and pastes,
being cooked preparations, not including homogenized
preparations 05810 (4) 0,014
Nuts, groundnuts and other seeds, prepared or preserved, n.e.s.,
whether/not containing added sugar or other sweeting matter or
spirit 05892 (6) 0,017
Apricots, cherries and peaches, prepared or preserved, n.e.s.,
whether/not containing added sugar or other sweetening matter or
spirit 05895 (9) 0,457
Food preparations, n.e.s., containing cocoa, in blocks/snaps/bars 07330 (3) 0,006
Food preparations, containing cocoa, n.e.s. 07390 (5) 0,013
Yeasts, other single-shell microorganisms, dead, prepared baking
powders 09860 (3) 0,003
Food preparations, n.e.s. 09899 (5) 0,121
Beverages and tobacco (1)
Waters, including natural/artificial mineral waters and aerated
waters, not containing added sugar or other sweetening matter, ice
and snow 11101 (3) 0,017
Notes: Lines in bold denote the aggregate (SITC1) product classifications. The rest of the lines
denote disaggregated (SITC5) product classifications. The last column indicates the share of
revenues for the corresponding SITC code, averaged over the period 1998-2012.

38
TABLE D3. Variables from Annual Manufacturing Survey used in Tables 2-5
Variable name Description Variable code in AMS
skill premium
(wage bill)
total wages paid to workers
on a monthly salary / total
wages paid to workers on a
daily salary
201/202
skilled/unskilled
workers
workers on a monthly
salary / workers on a daily
salary
(102+103)/(104+105)
skill premium
(wage rate)
wage per worker on a
monthly salary / wages per
worker on a daily salary
V201*(V104+V105)/V202*(V102+V103)
training expenses training expenses
(% of labor expenses)
206/(201+202+203+204+206
+207+208+209+211)
R&D expenses R&D expenses
(% of total expenses) 367/(Γ1_Γ10)
R&D personnel R&D personnel
(% of total personnel) 366/100
advertising and
promotion
expenses
advertising-promotion
expenses (% of total
expenses)
326/(Γ1_Γ10)
export promotion
expenses
expenses for export
promotion
(% of total expenses)
337/(Γ1_Γ10)
exhibition
expenses
exhibition expenses
(% of total expenses) 339/(Γ1_Γ10)
royalties
expenses
royalties expenses
(% of total expenses) 332/(Γ1_Γ10)
export subsidies export subsidies
(% of total revenues)
403/(401+402+403+404+405+406+407
+408+412+413+414+416+417+418+419)
export intensity exports
(% of total revenues)
621/(401+402+403+404+405+406+407
+408+412+413+414+416+417+418+419)

39
BANK OF GREECE WORKING PAPERS
185. Adam, A., and T., Moutos, “Industry-Level Labour Demand Elasticities Across the
Eurozone: Will There Be Any Gain After the Pain of Internal Devaluation?” July,
2014.
186. Tagkalakis, O.A., “Fiscal Policy, Net Exports, and the Sectoral Composition of Output
in Greece”, September 2014.
187. Hondroyiannis, G. and D., Papaoikonomou, “When Does it Pay To Tax? Evidence
from State-Dependent Fiscal Multipliers in the Euro Area”, October 2014.
188. Charalambakis, C. E., “On Corporate Financial Distress Prediction: What Can we
Learn From Private Firms in a Small Open Economy?, November 2014.
189. Pagratis, S., E., Karakatsani and E. Louri, “Bank Leverage and Return on Equity
Targeting: Intrinsic Procyclicality of Short-Term Choices”, November 2014.
190. Evgenidis, A. and C., Siriopoulos, “What are the International Channels Through
Which a US Policy Shock is Transmitted to the World Economies? Evidence from a
Time Varying Favar, January 2015.
191. Louzis, D. P., and A.T., Vouldis, “Profitability in the Greek Banking System: a Dual
Investigation of Net Interest and Non-Interest Income”, February 2015.
192. Papaspyrou, S.T, “EMU 2.0 - Drawing Lessons From the Crisis - a New Framework
For Stability and Growth”, March 2014.
193. Litina, A and T, Palivos, “Corruption and Tax Evasion: Reflections on Greek
Tragedy”, June 2015.
194. Balfoussia, H. and H.D. Gibson, “Financial Conditions and Economic Activity: The
Potential Impact of the Targeted Longer-Term Refinancing Operations (TLTROS)”,
July 2015.
195. Louzis, P. D., “Steady-State Priors and Bayesian Variable Selection in VAR
Forecasting”, July 2015.
196. Zografakis, S. and A., Sarris, “The Distributional Consequences of the Stabilization
and Adjustment Policies in Greece During the Crisis, with the Use of A Multisectoral
Computable General Equilibrium Model”, August 2015.
197. Papageorgiou, D. and E., Vourvachaki, “The Macroeconomic Impact of Structural
Reforms in Product and Labour Markets: Trade-Offs and Complementarities”,
October 2015.
198. Louri, H., and P., M., Migiakis, “Determinants of Euro-Area Bank Lending Margins:
Financial Fragmentation and ECB Policies”, October 2015.
199. Gibson, D. H, S.G. Hall, and G. S. Tavlas, “The effectiveness of the ECB’s asset
purchase programs of 2009 to 2012”, November 2015.
200. Balfoussia, H and D, Malliaropulos, “Credit-less recoveries: the role of investment-
savings imbalances”, November 2015.