whitney holding corp by check mark whether the registrant is a shell company (as defined in rule...
TRANSCRIPT

WHITNEY HOLDING CORP
FORM 10-Q(Quarterly Report)
Filed 11/10/08 for the Period Ending 09/30/08
Address 228 ST CHARLES AVE
NEW ORLEANS, LA 70130Telephone 5045867272
CIK 0000106926Symbol WTNY
SIC Code 6021 - National Commercial BanksIndustry Regional Banks
Sector FinancialFiscal Year 12/31
http://www.edgar-online.com© Copyright 2008, EDGAR Online, Inc. All Rights Reserved.
Distribution and use of this document restricted under EDGAR Online, Inc. Terms of Use.

UNITED STATES SECURITIES AND EXCHANGE COMMISSION
WASHINGTON, DC 20549
FORM 10-Q
QUARTERLY REPORT PURSUANT TO SECTION 13 OR 15 (d) OF THE SECURITIES EXCHANGE ACT OF 1934
For the quarterly period ended September 30, 2008
Commission file number 0-1026
228 St. Charles Avenue
New Orleans, Louisiana 70130 (Address of principal executive offices)
(504) 586-7272
(Registrant’s telephone number, including area code)
Indicate by check mark whether the registrant (1) has filed all reports required to be filed by Section 13 or 15(d) of the Securities Exchange Act of 1934 during the preceding 12 months (or for such shorter period that the registrant was required to file such reports), and (2) has been subject to such filing requirements for the past 90 days. Yes � � � � No __
Indicate by check mark whether the registrant is a large accelerated filer, an accelerated filer, a non-accelerated filer or a smaller reporting company. See the definitions of “large accelerated filer,” “accelerated filer” and “smaller reporting company” in Rule 12b-2 of the Exchange Act.
Indicate by check mark whether the registrant is a shell company (as defined in Rule 12b-2 of the Exchange
Act). Yes __ No � � � �
As of October 31, 2008, 64,013,683 shares of the registrant’s no par value common stock were outstanding.
WHITNEY HOLDING CORPORATION (Exact name of registrant as specified in its charter)
Louisiana 72-6017893
(State or other jurisdiction of incorporation or organization) ( I.R.S. Employer Identification No.)
Large accelerated filer � � � � Accelerated filer __ Non-accelerated filer __ Smaller reporting company __

WHITNEY HOLDING CORPORATION
TABLE OF CONTENTS
Page PART I. Financial Information Item 1. Financial Statements: Consolidated Balance Sheets 1 Consolidated Statements of Income 2 Consolidated Statements of Changes in Shareholders’ Equity 3 Consolidated Statements of Cash Flows 4 Notes to Consolidated Financial Statements 5 Selected Financial Data 18 Item 2. Management’s Discussion and Analysis of Financial Condition and Results of Operations 19 Item 3. Quantitative and Qualitative Disclosures about Market Risk 43 Item 4. Controls and Procedures 43
PART II. Other Information Item 1. Legal Proceedings 44 Item 1A. Risk Factors 44 Item 2. Unregistered Sales of Equity Securities and Use of Proceeds 45 Item 3. Defaults upon Senior Securities 45 Item 4. Submission of Matters to a Vote of Security Holders 46 Item 5. Other Information 46 Item 6. Exhibits 46 Signature 46 Exhibit Index 47

PART 1. FINANCIAL INFORMATION Item 1. FINANCIAL STATEMENTS
WHITNEY HOLDING CORPORATION AND SUBSIDIARIES CONSOLIDATED BALANCE SHEETS
September 30 December
31 (dollars in thousands) 2008 2007 (Unaudited) ASSETS Cash and due from financial institutions $ 296,143 $ 290,199 Federal funds sold and short-term investments 46,117 534,558 Loans held for sale 7,951 16,575 Investment securities Securities available for sale 1,565,459 1,698,795 Securities held to maturity, fair values of $245,471 and $288,444, respectively 246,566 286,442 Total investment securities 1,812,025 1,985,237 Loans, net of unearned income 8,077,775 7,585,701 Allowance for loan losses (125,370 ) (87,909 ) Net loans 7,952,405 7,497,792 Bank premises and equipment 183,669 190,095 Goodwill 331,295 331,295 Other intangible assets 11,626 17,103 Accrued interest receivable 37,592 44,860 Other assets 308,624 119,550 Total assets $ 10,987,447 $ 11,027,264 LIABILITIES Noninterest-bearing demand deposits $ 2,809,923 $ 2,740,019 Interest-bearing deposits 5,244,508 5,843,770 Total deposits 8,054,431 8,583,789 Short-term borrowings 1,465,857 910,019 Long-term debt 156,907 165,455 Accrued interest payable 18,457 27,079 Accrued expenses and other liabilities 108,794 112,186 Total liabilities 9,804,446 9,798,528 SHAREHOLDERS' EQUITY Common stock, no par value Authorized - 100,000,000 shares Issued - 67,713,296 shares 2,800 2,800 Capital surplus 412,163 408,266 Retained earnings 875,347 885,792 Accumulated other comprehensive loss (12,437 ) (18,803 ) Treasury stock at cost - 3,736,900 and 1,887,780 shares, respectively (94,872 ) (49,319 ) Total shareholders' equity 1,183,001 1,228,736 Total liabilities and shareholders' equity $ 10,987,447 $ 11,027,264 The accompanying notes are an integral part of these financial statements.

1
WHITNEY HOLDING CORPORATION AND SUBSIDIARIES CONSOLIDATED STATEMENTS OF INCOME
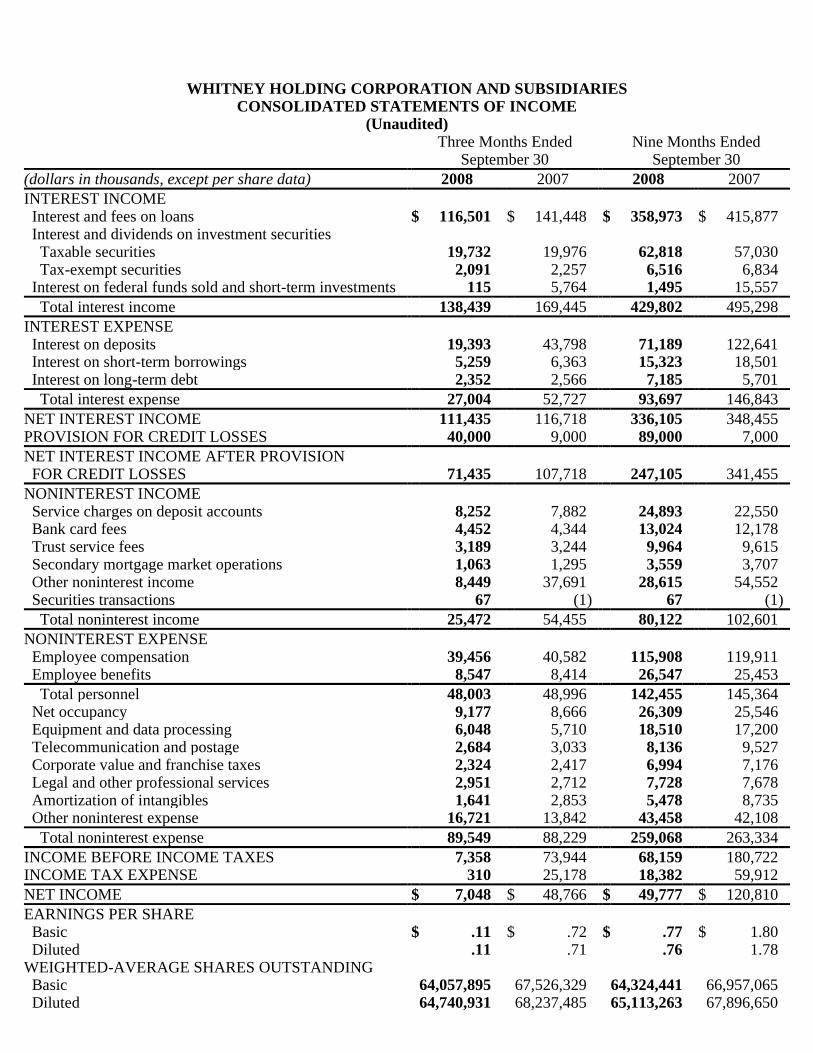
(Unaudited) Three Months Ended Nine Months Ended September 30 September 30 (dollars in thousands, except per share data) 2008 2007 2008 2007 INTEREST INCOME Interest and fees on loans $ 116,501 $ 141,448 $ 358,973 $ 415,877 Interest and dividends on investment securities Taxable securities 19,732 19,976 62,818 57,030 Tax-exempt securities 2,091 2,257 6,516 6,834 Interest on federal funds sold and short-term investments 115 5,764 1,495 15,557 Total interest income 138,439 169,445 429,802 495,298 INTEREST EXPENSE Interest on deposits 19,393 43,798 71,189 122,641 Interest on short-term borrowings 5,259 6,363 15,323 18,501 Interest on long-term debt 2,352 2,566 7,185 5,701 Total interest expense 27,004 52,727 93,697 146,843 NET INTEREST INCOME 111,435 116,718 336,105 348,455 PROVISION FOR CREDIT LOSSES 40,000 9,000 89,000 7,000 NET INTEREST INCOME AFTER PROVISION FOR CREDIT LOSSES 71,435 107,718 247,105 341,455 NONINTEREST INCOME Service charges on deposit accounts 8,252 7,882 24,893 22,550 Bank card fees 4,452 4,344 13,024 12,178 Trust service fees 3,189 3,244 9,964 9,615 Secondary mortgage market operations 1,063 1,295 3,559 3,707 Other noninterest income 8,449 37,691 28,615 54,552 Securities transactions 67 (1 ) 67 (1 ) Total noninterest income 25,472 54,455 80,122 102,601 NONINTEREST EXPENSE Employee compensation 39,456 40,582 115,908 119,911 Employee benefits 8,547 8,414 26,547 25,453 Total personnel 48,003 48,996 142,455 145,364 Net occupancy 9,177 8,666 26,309 25,546 Equipment and data processing 6,048 5,710 18,510 17,200 Telecommunication and postage 2,684 3,033 8,136 9,527 Corporate value and franchise taxes 2,324 2,417 6,994 7,176 Legal and other professional services 2,951 2,712 7,728 7,678 Amortization of intangibles 1,641 2,853 5,478 8,735 Other noninterest expense 16,721 13,842 43,458 42,108 Total noninterest expense 89,549 88,229 259,068 263,334 INCOME BEFORE INCOME TAXES 7,358 73,944 68,159 180,722 INCOME TAX EXPENSE 310 25,178 18,382 59,912 NET INCOME $ 7,048 $ 48,766 $ 49,777 $ 120,810 EARNINGS PER SHARE Basic $ .11 $ .72 $ .77 $ 1.80 Diluted .11 .71 .76 1.78 WEIGHTED-AVERAGE SHARES OUTSTANDING Basic 64,057,895 67,526,329 64,324,441 66,957,065 Diluted 64,740,931 68,237,485 65,113,263 67,896,650

CASH DIVIDENDS PER SHARE $ .31 $ .29 $ .93 $ .87 The accompanying notes are an integral part of these financial statements.
2

WHITNEY HOLDING CORPORATION AND SUBSIDIARIES CONSOLIDATED STATEMENTS OF CHANGES IN SHAREHOLDERS' EQUITY
(Unaudited) Accumulated Other
Common Capital Retained Comprehensive Treasury
(dollars in thousands, except per share data) Stock Surplus Earnings Income (Loss) Stock Total Balance at December 31, 2006 $ 2,800 $ 343,697 $ 812,644 $ (41,015 ) $ (5,164 ) $ 1,112,962 Adjustment on adoption of FIN 48 - - 721 - - 721 Adjusted balance at beginning of period 2,800 343,697 813,365 (41,015 ) (5,164 ) 1,113,683 Comprehensive income: Net income - - 120,810 - - 120,810 Other comprehensive income: Unrealized net holding gain on securities, net of reclassifications and tax - - - 8,024 - 8,024 Net change in prior service credit and net actuarial loss on retirement plans, net of tax - - - 5,450 - 5,450 Total comprehensive income - - 120,810 13,474 - 134,284 Cash dividends, $.87 per share - - (59,221 ) - - (59,221 ) Stock issued in business combination - 48,298 - - - 48,298 Stock issued to dividend reinvestment plan - 877 - - 1,443 2,320 Long-term incentive plan stock activity: Restricted stock & units - 7,575 - - (129 ) 7,446 Stock options - 615 - - 2,365 2,980 Directors' compensation plan stock activity - 2,604 - - 1,415 4,019 Balance at September 30, 2007 $ 2,800 $ 403,666 $ 874,954 $ (27,541 ) $ (70 ) $ 1,253,809
Balance at December 31, 2007 $ 2,800 $ 408,266 $ 885,792 $ (18,803 ) $ (49,319 ) $ 1,228,736 Comprehensive income: Net income - - 49,777 - - 49,777 Other comprehensive income: Unrealized net holding gain on securities, net of reclassifications and tax - - - 5,978 - 5,978 Net change in prior service credit and net actuarial loss on retirement plans, net of tax - - - 388 - 388 Total comprehensive income - - 49,777 6,366 - 56,143 Cash dividends, $.93 per share - - (60,222 ) - - (60,222 ) Stock acquired under repurchase program - - - - (50,484 ) (50,484 )

Stock issued to dividend reinvestment plan - (331 ) - - 2,827 2,496 Long-term incentive plan stock activity: Restricted stock & units - 3,921 - - 393 4,314 Stock options - 530 - - 800 1,330 Directors' compensation plan stock activity - (223 ) - - 911 688 Balance at September 30, 2008 $ 2,800 $ 412,163 $ 875,347 $ (12,437 ) $ (94,872 ) $ 1,183,001 The accompanying notes are an integral part of these financial statements.
3

WHITNEY HOLDING CORPORATION AND SUBSIDIARIES CONSOLIDATED STATEMENTS OF CASH FLOWS
(Unaudited) Nine Months Ended September 30 (dollars in thousands) 2008 2007 OPERATING ACTIVITIES Net income $ 49,777 $ 120,810 Adjustments to reconcile net income to net cash provided by operating activities: Depreciation and amortization of bank premises and equipment 13,888 13,038 Amortization of purchased intangibles 5,478 8,735 Share-based compensation earned 8,696 10,789 Premium amortization (discount accretion) on securities, net 819 744 Provision for credit losses and losses on foreclosed assets 89,530 7,088 Net gains on asset dispositions, including gain on insurance settlement in 2007 (1,975 ) (33,257 ) Deferred tax (benefit) expense (15,909 ) 9,582 Net decrease in loans originated and held for sale 8,624 8,281 Net (increase) decrease in interest and other income receivable and prepaid expenses 293 (5,162 ) Net increase (decrease) in interest payable and accrued income taxes and expenses (15,961 ) 18,289 Other, net (7,550 ) (563 ) Net cash provided by operating activities 135,710 158,374 INVESTING ACTIVITIES Proceeds from sales of investment securities available for sale 6,342 38,964 Proceeds from maturities of investment securities available for sale 502,965 292,338 Purchases of investment securities available for sale (367,197 ) (273,992 ) Proceeds from maturities of investment securities held to maturity 39,654 8,441 Purchases of investment securities held to maturity - (5,022 ) Net increase in loans (553,051 ) (182,048 ) Net (increase) decrease in federal funds sold and short-term investments 490,635 (78,613 ) Purchases under bank-owned life insurance program (150,000 ) - Proceeds from sales of foreclosed assets and surplus property 6,278 5,736 Proceeds from insurance settlement - 30,801 Purchases of bank premises and equipment (10,317 ) (16,595 ) Net cash paid in acquisition - (7,503 ) Other, net (3,666 ) (625 ) Net cash used in investing activities (38,357 ) (188,118 ) FINANCING ACTIVITIES Net decrease in transaction account and savings account deposits (177,227 ) (538,650 ) Net increase (decrease) in time deposits (351,937 ) 273,163 Net increase in short-term borrowings 555,838 129,340 Proceeds from issuance of long-term debt - 149,738 Repayment of long-term debt (8,371 ) (4,211 ) Proceeds from issuance of common stock 3,380 5,532 Purchases of common stock (52,576 ) (3,272 ) Cash dividends (59,315 ) (57,597 ) Other, net (1,201 ) 863 Net cash used in financing activities (91,409 ) (45,094 ) Increase (decrease) in cash and cash equivalents 5,944 (74,838 ) Cash and cash equivalents at beginning of period 290,199 318,165 Cash and cash equivalents at end of period $ 296,143 $ 243,327 Cash received during the period for:

Interest income $ 428,191 $ 486,601 Cash paid during the period for: Interest expense $ 102,589 $ 136,834 Income taxes 38,500 41,500 Noncash investing activities: Foreclosed assets received in settlement of loans $ 17,947 $ 2,678 The accompanying notes are an integral part of these financial statements.
4

WHITNEY HOLDING CORPORATION AND SUBSIDIARIES NOTES TO CONSOLIDATED FINANCIAL STATEMENTS (Unaudit ed) NOTE 1 BASIS OF PRESENTATION
The consolidated financial statements include the accounts of Whitney Holding Corporation and its subsidiaries (the Company or Whitney). The Company’s principal subsidiary is Whitney National Bank (the Bank), which represents virtually all of the Company’s operations and net income. All significant intercompany balances and transactions have been eliminated.
In preparing the consolidated financial statements, the Company is required to make estimates, judgments and assumptions that affect the amounts reported in the consolidated financial statements and accompanying notes. Actual results could differ from those estimates. The consolidated financial statements reflect all adjustments that are, in the opinion of management, necessary for a fair statement of Whitney’s financial condition, results of operations, changes in shareholders’ equity and cash flows for the interim periods presented. These adjustments are of a normal recurring nature and include appropriate estimated provisions.
Pursuant to the rules and regulations of the Securities and Exchange Commission (SEC), some financial information and disclosures have been condensed or omitted in preparing the consolidated financial statements presented in this quarterly report on Form 10-Q. These financial statements should be read in conjunction with the Company’s annual report on Form 10-K for the year ended December 31, 2007. Financial information reported in these financial statements is not necessarily indicative of the Company’s financial condition, results of operations or cash flows of any other interim or annual periods. NOTE 2 MERGERS AND ACQUISITIONS
On November 7, 2008, Whitney completed its acquisition of Parish National Corporation (Parish), the parent of Parish National Bank. Parish National Bank operates 16 banking centers, primarily on the north shore of Lake Pontchartrain and other parts of the metropolitan New Orleans area, and had $771 million in total assets, including a loan portfolio of $606 million, and $636 million in deposits at the acquisition date. The Company expects to merge Parish National Bank into Whitney National Bank before the end of 2008 upon the completion of systems-integration work and regulatory approval. The transaction was valued at approximately $158 million, with approximately $97 million paid to Parish’s shareholders in cash and the remainder in Whitney stock totaling approximately 3.33 million shares. The purchase price allocation for this transaction has not yet been completed.
On March 2, 2007, Whitney completed its acquisition of Signature Financial Holdings, Inc. (Signature), headquartered in St. Petersburg, Florida and the parent of Signature Bank. Signature Bank operated seven banking centers in the Tampa Bay metropolitan area and had approximately $270 million in total assets, including $220 million of loans, and $210 million in deposits at acquisition. The transaction was valued at approximately $61 million, with $13 million paid to Signature’s shareholders in cash and the remainder in Whitney common stock totaling approximately 1.49 million shares. Applying purchase accounting to this transaction, the Company recorded goodwill of $39 million and a $4 million intangible asset for the estimated value of deposit relationships with a weighted-average life of 2.4 years. Signature Bank has been merged into the Bank.
5

Whitney’s financial statements include the results from acquired operations since the acquisition dates.
NOTE 3 LOANS
The composition of the Company’s loan portfolio was as follows.
NOTE 4 ALLOWANCE FOR LOAN LOSSES AND RESERVE FOR LOSSES ON UNFUNDED CREDIT COMMITMENTS, IMPAIRED LOANS AND NONPERFORMING LOANS
A summary analysis of changes in the allowance for loan losses follows.
A summary analysis of changes in the reserve for losses on unfunded credit commitments follows. The
reserve is reported with accrued expenses and other liabilities in the consolidated balance sheets.
September 30 December 31 (in thousands) 2008 2007 Commercial, financial and agricultural $ 3,100,428 38 % $ 2,822,752 37 % Real estate – commercial, construction and other 3,612,038 45 3,477,558 46 Real estate – residential mortgage 1,003,009 12 933,797 12 Individuals 362,300 5 351,594 5 Total $ 8,077,775 100 % $ 7,585,701 100 %
Three Months Ended Nine Months Ended September 30 September 30 (in thousands) 2008 2007 2008 2007 Allowance at beginning of period $ 109,852 $ 75,099 $ 87,909 $ 75,927 Allowance of acquired bank - - - 2,791 Provision for credit losses 40,000 9,400 89,000 7,900 Loans charged off (27,325 ) (5,119 ) (56,659 ) (12,698 ) Recoveries 2,843 2,755 5,120 8,215 Net charge-offs (24,482 ) (2,364 ) (51,539 ) (4,483 ) Allowance at end of period $ 125,370 $ 82,135 $ 125,370 $ 82,135
Three Months Ended Nine Months Ended September 30 September 30 (in thousands) 2008 2007 2008 2007 Reserve at beginning of period $ 1,300 $ 1,400 $ 1,300 $ 1,900 Provision for credit losses - (400 ) - (900 ) Reserve at end of period $ 1,300 $ 1,000 $ 1,300 $ 1,000
6

Information on loans evaluated for possible impairment loss follows.
The following is a summary of nonperforming loans. Substantially all of the impaired loans summarized above
are included in the nonperforming loan totals.
NOTE 5 DEPOSITS
The composition of deposits was as follows.
Time deposits of $100,000 or more include balances in treasury-management deposit products for commercial
and certain other larger deposit customers. Balances maintained in such products totaled $447 million at September 30, 2008 and $705 million at December 31, 2007. Most of these deposits mature on a daily basis.
September 30 December 31 (in thousands) 2008 2007 Impaired loans Requiring a loss allowance $ 164,961 $ 86,920 Not requiring a loss allowance 48,177 22,412 Total recorded investment in impaired loans $ 213,138 $ 109,332 Impairment loss allowance required $ 31,619 $ 22,590
September 30 December 31 (in thousands) 2008 2007 Loans accounted for on a nonaccrual basis $ 235,136 $ 120,096 Restructured loans accruing - - Total nonperforming loans $ 235,136 $ 120,096
September 30 December 31 (in thousands) 2008 2007 Noninterest-bearing demand deposits $ 2,809,923 $ 2,740,019 Interest-bearing deposits: NOW account deposits 958,940 1,151,988 Money market deposits 1,158,507 1,229,715 Savings deposits 896,733 879,609 Other time deposits 714,650 823,884 Time deposits $100,000 and over 1,515,678 1,758,574 Total interest-bearing deposits 5,244,508 5,843,770 Total deposits $ 8,054,431 $ 8,583,789
7

NOTE 6 SHORT-TERM BORROWINGS
Short-term borrowings consisted of the following.
The Bank borrows funds on a secured basis by selling securities under agreements to repurchase, mainly in
connection with treasury-management services offered to its deposit customers. Repurchase agreements generally mature daily.
Advances from the Federal Home Loan Bank (FHLB) mature within one month and are secured by a blanket lien on Bank loans secured by real estate.
Federal funds purchased are unsecured borrowings from other banks, generally on an overnight basis. Under the Treasury Investment Program, excess U.S. Treasury receipts are loaned to participating financial
institutions at 25 basis points under the federal funds rate. Repayment of these borrowed funds can be demanded at any time. The Bank participates up to a maximum of $40 million and has pledged securities with a comparable value as collateral. NOTE 7 OTHER ASSETS AND ACCRUED EXPENSES AND OTHER LIABILI TIES
The more significant components of other assets and accrued expenses and other liabilities were as follows.
September 30 December 31 (in thousands) 2008 2007 Securities sold under agreements to repurchase $ 603,807 $ 771,717 Federal Home Loan Bank advances 500,000 - Federal funds purchased 322,057 98,302 Treasury Investment Program 39,993 40,000 Total short-term borrowings $ 1,465,857 $ 910,019
September 30 December 31 (in thousands) 2008 2007 Other Assets Cash surrender value of life insurance $ 164,858 $ 12,258 Net deferred income tax asset 64,078 51,718 Low-income housing tax credit fund investments 11,806 13,161 Foreclosed assets and surplus property 19,597 4,624 Prepaid expenses 9,721 7,736 Miscellaneous investments, receivables and other assets 38,564 30,053 Total other assets $ 308,624 $ 119,550 Accrued Expenses and Other Liabilities Accrued taxes and other expenses $ 25,316 $ 27,969 Dividend payable 16,748 15,913 Liability for pension benefits 30,272 33,956 Obligation for postretirement benefits other than pensions 14,198 15,196 Reserve for losses on unfunded credit commitments 1,300 1,300 Miscellaneous payables, deferred income and other liabilities 20,960 17,852 Total accrued expenses and other liabilities $ 108,794 $ 112,186
8

In late May 2008, Whitney paid premiums of $150 million to purchase life insurance policies under a newly-
adopted bank-owned life insurance program. The policies are carried at their cash surrender value, which represents the amount that could be realized as of the reporting date. Earnings on these policies are reported in noninterest income and are not taxable. NOTE 8 OTHER NONINTEREST INCOME
The components of other noninterest income were as follows.
In the first quarter of 2008, Whitney recognized a $2.3 million gain from the mandatory redemption of Visa Inc.
(Visa) shares as discussed in Note 13. This gain is reflected in year-to-date other operating income. During the third quarter of 2007, Whitney reached a final settlement on insurance claims primarily arising from
the hurricanes that struck portions of its market area in the late summer of 2005. With this settlement, the Company recognized a gain of $31.3 million, which is reported in other operating income. NOTE 9 OTHER NONINTEREST EXPENSE
The components of other noninterest expense were as follows.
Three Months Ended Nine Months Ended September 30 September 30 (in thousands) 2008 2007 2008 2007 Investment services income $ 1,458 $ 1,444 $ 4,663 $ 4,335 Credit-related fees 1,562 1,399 4,404 3,973 ATM fees 1,363 1,338 4,202 3,974 Other fees and charges 1,168 1,293 3,475 3,846 Earnings from bank-owned life insurance program 1,610 - 2,283 - Other operating income 949 32,035 5,882 34,042 Net gains on sales and other revenue from foreclosed assets 328 399 3,886 4,572 Net gains (losses) on disposals of surplus property 11 (217 ) (180 ) (190 ) Total $ 8,449 $ 37,691 $ 28,615 $ 54,552
Three Months Ended Nine Months Ended September 30 September 30 (in thousands) 2008 2007 2008 2007 Security and other outsourced services $ 3,802 $ 4,000 $ 11,736 $ 11,933 Deposit insurance and regulatory fees 1,661 610 3,484 1,851 Advertising and promotion 1,015 1,464 3,207 3,860 Bank card processing services 1,099 1,068 3,222 3,000 Operating supplies 1,002 1,049 2,951 3,234 Miscellaneous operating losses 2,482 751 2,479 2,632 Other operating expenses 5,660 4,900 16,379 15,598 Total $ 16,721 $ 13,842 $ 43,458 $ 42,108
9

Miscellaneous operating losses for the third quarter and first nine months of 2008 include $2.1 million of
casualty losses and expenses incurred during recent hurricanes. In the first quarter of 2008, Whitney reversed a $1.0 million liability related to an indemnification agreement with Visa as discussed in Note 13. The impact is also reflected in year-to-date miscellaneous operating losses. NOTE 10 EMPLOYEE RETIREMENT BENEFIT PLANS Retirement Income Plans
Whitney has maintained a noncontributory qualified defined-benefit pension plan covering substantially all of its employees, subject to minimum age and service-related requirements. Whitney also has an unfunded nonqualified defined-benefit pension plan that provides retirement benefits to designated executive officers.
Subsequent to September 30, 2008, Whitney’s Board of Directors approved amendments to the qualified plan (a) to limit eligibility to those employees who are employed on December 31, 2008 and (b) to freeze benefit accruals for all participants other than those who are fully vested and whose age and years of benefit service combined equal at least 50 as of December 31, 2008. The Company anticipates recognizing a curtailment gain before year end as a result of these amendments, but the amount of the gain is still being determined.
Concurrent with these defined-benefit plan amendments, the Board also approved amendments to Whitney’s employee savings plan. These amendments authorize the Company to make discretionary profit sharing contributions, beginning in 2009, on behalf of participants in the savings plan who are either (a) ineligible to participate in the qualified defined-benefit plan or (b) subject to the freeze in benefit accruals under the defined-benefit plan. The discretionary profit sharing contribution for a plan year is 4% of the participants’ eligible compensation for such year and is allocated only to participants who are employed at year end. Participants must complete three years of service to become vested in the Company’s contributions, subject to earlier vesting in the case of retirement, death or disability.
The Company made a $10 million contribution to the qualified plan during the third quarter of 2008. The performance of the pension trust fund through the end of the third quarter of 2008 was substantially below the long-term expected rate of return, reflecting conditions in the equity and corporate debt markets. Management is monitoring fund performance as it considers whether it would be desirable to make an additional contribution before year end. The components of net pension expense were as follows for the combined qualified and nonqualified plans.
Three Months Ended Nine Months Ended September 30 September 30 (in thousands) 2008 2007 2008 2007 Service cost for benefits in period $ 2,095 $ 2,066 $ 6,284 $ 6,215 Interest cost on benefit obligation 2,519 2,338 7,545 6,907 Expected return on plan assets (2,662 ) (2,672 ) (7,972 ) (8,023 ) Amortization of: Net actuarial loss 269 342 808 848 Prior service credit (21 ) (29 ) (64 ) (87 ) Net periodic pension expense $ 2,200 $ 2,045 $ 6,601 $ 5,860
10

The actuarial gains or losses and prior service costs or credits with respect to a retirement benefit plan that arise
in a period but are not immediately recognized as components of net periodic benefit expense are recognized, net of tax, as a component of other comprehensive income. The amounts included in accumulated other comprehensive income are adjusted as they are recognized as components of net periodic benefit expense in subsequent periods. Health and Welfare Plans
Whitney has offered health care and life insurance benefit plans for retirees and their eligible dependents. The Company funds its obligations under these plans as contractual payments come due to health care organizations and insurance companies. In the first quarter of 2007, Whitney amended these plans to eliminate postretirement health benefits for all participants other than retirees already receiving benefits and those active participants who were eligible to receive benefits by December 31, 2007 and to eliminate dental benefits for all participants. The amendment also froze the Company’s health care benefit subsidy level and eliminated the life insurance benefit for employees who retire after December 31, 2007. The amounts recognized as net periodic expense for postretirement benefits were insignificant in both 2008 and 2007. NOTE 11 SHARE-BASED COMPENSATION
Whitney maintains incentive compensation plans that incorporate share-based compensation. The plans for both employees and directors have been approved by the Company’s shareholders. Descriptions of these plans, including the terms of awards and the number of Whitney shares authorized for issuance, were included in Note 16 to the consolidated financial statements in the Company’s annual report on Form 10-K for the year ended December 31, 2007.
In June 2008, annual share-based compensation awards were made under the employee plan as follows.
Grant Date Fair Value Total Number of Option or Share-based (dollars in thousands, except per share data) Awarded Stock Unit Compensation Performance-based restricted stock units (a) (b) $ 4,221 (d) Tenure-based restricted stock units 137,958 $ 18.77 (c) 2,384 (d) Stock options 217,437 3.48 757
(a) A maximum of 434,874 shares could be issued under performance-based awards. Under certain levels of performance, no shares would be issued.
(b) Fair value of base award of 217,437 units was market price of Whitney common stock on the grant date, or $18.77. Fair value of potential performance units that do not participate in Whitney dividends during the restriction period was $15.13.
(c) Market price of Whitney common stock on the grant date. (d) Based on the grant date fair value and number of shares that are ultimately expected to be issued, taking into consideration expected
performance factors, if applicable, and forfeitures.
11

Employees forfeit their restricted stock units if they terminate employment within three years of the award date,
although they can retain a prorated number of units in the case of retirement, death, disability and, in limited circumstances, involuntary termination. During the three-year period, they cannot transfer or otherwise dispose of the units awarded. The performance-based restricted stock units that ultimately vest will be determined with reference to Whitney’s financial performance over a three-year period in relation to that of a designated peer group.
Employees can first exercise their stock options from the 2008 award three years from the grant date, provided they are still employed. A prorated number of options can vest and become immediately exercisable upon an employee’s retirement, death or disability within this three-year period. All employee options expire after ten years, although an earlier expiration applies in the case of retirement, death or disability. The exercise price for employee options is set at an amount not lower than the opening market price for Whitney’s stock on the grant date.
The Company recognized share-based compensation expense with respect to awards under the employee plan of $2.8 million ($1.8 million after-tax) in the third quarter of 2008 and $3.3 million ($2.2 million after-tax) in the third quarter of 2007. Share-based compensation expense for the employee plan was $8.5 million ($5.5 million after-tax) for the first nine months of 2008 and $10.8 million ($7.0 million after-tax) for the comparable period in 2007.
During June 2008, annual share-based compensation awards were made under the directors’ plan as follows.
Directors’ stock grants are fully vested upon award, and their stock options are immediately exercisable and
expire no later than ten years from the grant date. The exercise price for the directors’ options was set at $18.30, the closing market price for the Company’s stock on the grant date. NOTE 12 GOODWILL AND OTHER INTANGIBLE ASSETS
Goodwill is tested for impairment at least annually. No indication of goodwill impairment was identified in the annual assessment as of September 30, 2008. NOTE 13 CONTINGENCIES Legal Proceedings
The Company is party to various legal proceedings arising in the ordinary course of business. After reviewing pending and threatened actions with legal counsel, management believes that the ultimate resolution of these actions will not have a material effect on Whitney’s financial condition, results of operations or cash flows.
Grant Date Total Number Fair Value Share-based
(dollars in thousands, except per share data) Awarded of Option or
Stock Compensation Stock grant 6,750 $ 18.30 $ 124 Stock options 45,000 3.42 154
12

Indemnification Obligation
In October 2007, Visa completed restructuring transactions that modified the obligation of members of Visa USA, including Whitney, to indemnify Visa against pending and possible settlements of certain litigation matters. Whitney recorded a $1.0 million liability in the fourth quarter of 2007 for the estimated value of its obligations under the indemnification agreement. In the first quarter of 2008, Visa completed an initial public offering of its shares and used the proceeds to redeem a portion of Visa USA members’ equity interests and to establish an escrow account that will fund any settlement of the members’ obligations under the indemnification agreement. Whitney recognized a $2.3 million gain from the redemption proceeds and reversed the $1.0 million liability for its indemnification obligations. Although the Company remains obligated to indemnify Visa for losses in connection with certain litigation matters whose claims exceed amounts set aside in the escrow account, Whitney’s interest in the escrow balance approximates management’s current estimate of the value of the Company’s indemnification obligation.
The amount of offering proceeds escrowed for litigation settlements will reduce the number of shares of Visa stock to which Whitney will ultimately be entitled as a result of the restructuring. NOTE 14 STOCK REPURCHASE PROGRAM
During the first six months of 2008, Whitney repurchased 2,039,788 shares of its common stock at an average cost of $24.75 per share. This completed the repurchase program announced in November 2007. Under this program Whitney repurchased a total of 3,934,879 shares at an average cost of $25.41 per share. NOTE 15 EARNINGS PER SHARE
The components used to calculate basic and diluted earnings per share were as follows.
Three Months Ended Nine Months Ended September 30 September 30 (dollars in thousands, except per share data) 2008 2007 2008 2007 Numerator: Net income $ 7,048 $ 48,766 $ 49,777 $ 120,810 Effect of dilutive securities - - - - Numerator for diluted earnings per share $ 7,048 $ 48,766 $ 49,777 $ 120,810 Denominator: Weighted-average shares outstanding 64,057,895 67,526,329 64,324,441 66,957,065 Effect of potentially dilutive securities and contingently issuable shares 683,036 711,156 788,822 939,585 Denominator for diluted earnings per share 64,740,931 68,237,485 65,113,263 67,896,650 Earnings per share: Basic $ .11 $ .72 $ .77 $ 1.80 Diluted .11 .71 .76 1.78 Antidilutive stock options 3,129,524 1,562,080 2,200,076 892,962
13

NOTE 16 OFF-BALANCE-SHEET FINANCIAL INSTRUMENTS
To meet the financing needs of its customers, the Bank issues financial instruments which represent conditional obligations that are not recognized, wholly or in part, in the consolidated balance sheets. These financial instruments include commitments to extend credit under loan facilities and guarantees under standby and other letters of credit. Such instruments expose the Bank to varying degrees of credit and interest rate risk in much the same way as funded loans.
Revolving loan commitments are issued primarily to support commercial activities. The availability of funds under revolving loan commitments generally depends on whether the borrower continues to meet credit standards established in the underlying contract and has not violated other contractual conditions. A number of such commitments are used only partially or, in some cases, not at all before they expire. Nonrevolving loan commitments are issued mainly to provide financing for the acquisition and development or construction of real property, both commercial and residential, although many are not expected to lead to permanent financing by the Bank. Loan commitments generally have fixed expiration dates and may require payment of a fee. Credit card and personal credit lines are generally subject to cancellation if the borrower’s credit quality deteriorates, and many lines remain partly or wholly unused.
Substantially all of the letters of credit are standby agreements that obligate the Bank to fulfill a customer’s financial commitments to a third party if the customer is unable to perform. The Bank issues standby letters of credit primarily to provide credit enhancement to its customers’ other commercial or public financing arrangements and to help them demonstrate financial capacity to vendors of essential goods and services. A substantial majority of standby letters of credit outstanding at September 30, 2008 have a term of one year or less.
The Bank’s exposure to credit losses from these financial instruments is represented by their contractual amounts. The Bank follows its standard credit policies in approving loan facilities and financial guarantees and requires collateral support if warranted. The required collateral could include cash instruments, marketable securities, accounts receivable, inventory, property, plant and equipment, and income-producing commercial property. See Note 4 for a summary analysis of changes in the reserve for losses on unfunded credit commitments.
A summary of off-balance-sheet financial instruments follows.
NOTE 17 FAIR VALUE DISCLOSURES
As discussed in Note 18, Statement of Financial Accounting Standards (SFAS) No. 157, Fair Value Measurements , became effective for Whitney’s 2008 fiscal year. SFAS No. 157 redefines fair value as the exchange price that would be received to sell an asset or paid to transfer a liability in the principal or most advantageous market for the asset or liability in an orderly transaction between market participants on the measurement date. Although the exchange price concept is not new, the new definition focuses on the exit price as opposed to
September 30 December 31 (in thousands) 2008 2007 Loan commitments – revolving $ 2,527,502 $ 2,475,656 Loan commitments – nonrevolving 554,428 534,673 Credit card and personal credit lines 519,624 551,748 Standby and other letters of credit 467,966 391,922
14

the entry price, or the price that would be paid to acquire an asset or received to assume a liability. The standard also emphasizes that fair value is a market-based measurement and not an entity-specific measurement and establishes a hierarchy to prioritize the inputs that can be used in the fair value measurement process. The inputs in the three levels of this hierarchy are described as follows:
The material assets or liabilities measured at fair value by Whitney on a recurring basis are summarized
below. Securities available for sale primarily consist of U.S. government agency and agency mortgage-backed debt securities. The total excludes $50.8 million of nonmarketable equity securities (Federal Reserve Bank and Federal Home Loan Bank stock) that are carried at cost.
To measure the extent to which a loan is impaired, the relevant accounting principles permit or require the
Company to compare the recorded investment in the impaired loans with the fair value of the underlying collateral in certain circumstances. The fair value measurement process uses independent appraisals and other market-based information, but in many cases it also requires significant input based on management’s knowledge of and judgment about current market conditions, specific issues relating to the collateral, and other matters. As a result, substantially all of these fair value measurements fall within Level 3 of the hierarchy discussed above. The net carrying value of impaired loans which reflected a nonrecurring fair value measurement totaled $128 million at September 30, 2008. The portion of the allowance for loan losses allocated to these loans totaled $29 million at the end of the third quarter of 2008, and the recorded investment in such loans was written down by $19 million during the third quarter and $30 million over the first nine months of 2008 with a charge against the allowance for loan losses. The valuation allowance on impaired loans and charge-offs factor into the determination of the provision for credit losses.
Level 1 Quoted prices in active markets for identical assets or liabilities. An active market is one in which transactions occur with sufficient frequency and volume to provide pricing information on an ongoing basis.
Level 2 Observable inputs other than Level 1 prices. This would include quoted prices for similar assets or liabilities, quoted prices in markets that are not active, or other inputs that are observable or can be corroborated by observable market data.
Level 3 Unobservable inputs, to the extent that observable inputs are unavailable. This allows for situations in which there is little or no market activity for the asset or liability at the measurement date.
September 30, 2008 Fair Value Measurement Using (in thousands) Level 1 Level 2 Level 3 Investment securities available for sale - $ 1,514,459 -
15

NOTE 18 ACCOUNTING STANDARDS DEVELOPMENTS
The Financial Accounting Standards Board (FASB) issued SFAS No. 157, Fair Value Measurements , to increase consistency and comparability in fair value measurements and provide for expanded disclosures about the development of such measurements and their effect on earnings. The guidance in this statement was generally effective for Whitney’s 2008 fiscal year. The effective date has been deferred to 2009 for nonfinancial assets and liabilities, except those that are recognized or disclosed at fair value on at least an annual basis. The initial application of this standard did not have a material impact on Whitney’s financial condition or results of operations. Note 17 presents certain disclosures required by SFAS No. 157.
The FASB issued SFAS No. 159, The Fair Value Option for Financial Assets and Financial Liabilities , in February 2007. This statement permits entities to choose to measure many financial instruments and certain other items at fair value, thereby reducing the earnings volatility caused by measuring related assets and liabilities differently without having to apply complex hedge accounting provisions. This statement is effective for Whitney’s 2008 fiscal year. The Company has not elected the fair value option for any specific financial instrument or other items.
In December 2007, the FASB issued SFAS No. 141 (revised 2007), Business Combinations . This revised standard expands the types of transactions or other events that will qualify as business combinations and requires that all business combinations will result in all assets and liabilities of the acquired business being recorded at their fair values, with limited exceptions. The standard also requires, among other provisions, that certain contingent assets and liabilities will be recognized at their fair values on the acquisition date. An acquirer will also recognize contingent consideration at its fair value on the acquisition date and, for certain arrangements, changes in fair value will be recognized in earnings until the contingency is settled. Under SFAS No. 141R, acquisition-related transaction and restructuring costs will be expensed rather than treated as part of the cost of the acquisition and included in the amount recorded for assets acquired. These and the other provisions of SFAS No. 141R are first effective for Whitney’s business combinations with acquisition dates in 2009.
The FASB issued SFAS No. 161, Disclosures about Derivative Instruments and Hedging Activities (an amendment of SFAS No. 133) , in March 2008. This standard calls for enhanced disclosures to help users of financial statements better understand how and why an entity uses derivative instruments, how derivative instruments and related hedged items are accounted for, and how these instruments and hedged items affect the entity’s financial position, financial performance, and cash flows. To meet those objectives, SFAS No. 161 requires qualitative disclosures about objectives and strategies for using derivatives, disclosures about the fair value of and gains and losses on derivative instruments, and disclosures about credit-risk contingent features in derivative agreements. This statement is effective for Whitney’s 2009 fiscal year, with earlier application encouraged. The Company currently makes minimal use of derivative instruments.
16

FASB Staff Position (FSP) EITF 03-6-1, Determining Whether Instruments Granted in Share-Based Payment
Transactions Are Participating Securities , was issued in June 2008. This FSP concluded that unvested share-based payment awards that contain nonforfeitable rights to dividends or dividend equivalents are participating securities and must be included in the computation of earnings per share using the two-class method described in SFAS No. 128, Earnings per Share . Whitney has awarded share-based payments that are considered participating securities under this FSP. This guidance is effective for financial statements issued for the Company’s 2009 fiscal year and must be applied retrospectively to earnings per share data presented for all prior periods. The Company is currently evaluating the impact of this FSP on its reported earnings per share.
17

WHITNEY HOLDING CORPORATION AND SUBSIDIARIES SELECTED FINANCIAL DATA
(Unaudited)
Third
Quarter Second Quarter Third Quarter
Nine Months ended September 30
(dollars in thousands, except per share data) 2008 2008 2007 2008 2007 QUARTER-END BALANCE SHEET DATA Total assets $ 10,987,447 $ 11,016,323 $ 10,604,834 $ 10,987,447 $ 10,604,834 Earning assets 9,943,868 9,955,091 9,738,123 9,943,868 9,738,123 Loans 8,077,775 7,962,543 7,452,905 8,077,775 7,452,905 Investment securities 1,812,025 1,955,692 1,875,096 1,812,025 1,875,096 Noninterest-bearing deposits 2,809,923 2,773,086 2,639,020 2,809,923 2,639,020 Total deposits 8,054,431 8,266,880 8,387,235 8,054,431 8,387,235 Shareholders' equity 1,183,001 1,183,078 1,253,809 1,183,001 1,253,809 AVERAGE BALANCE SHEET DATA Total assets $ 10,902,329 $ 10,838,912 $ 10,633,674 $ 10,846,118 $ 10,443,686 Earning assets 9,892,165 9,929,683 9,746,184 9,922,077 9,562,005 Loans 8,007,507 7,866,942 7,362,491 7,853,872 7,278,450 Investment securities 1,853,581 2,025,397 1,916,927 1,997,942 1,865,161 Noninterest-bearing deposits 2,771,101 2,747,125 2,686,189 2,722,253 2,718,156 Total deposits 8,230,249 8,220,223 8,480,098 8,275,705 8,394,819 Shareholders' equity 1,192,535 1,213,461 1,224,940 1,211,902 1,193,984 INCOME STATEMENT DATA Interest income $ 138,439 $ 139,607 $ 169,445 $ 429,802 $ 495,298 Interest expense 27,004 28,482 52,727 93,697 146,843 Net interest income 111,435 111,125 116,718 336,105 348,455 Net interest income (TE) 112,601 112,344 118,245 339,760 353,086 Provision for credit losses 40,000 35,000 9,000 89,000 7,000 Noninterest income 25,472 26,174 54,455 80,122 102,601 Net securities gains in noninterest income 67 - (1 ) 67 (1 ) Noninterest expense 89,549 85,590 88,229 259,068 263,334 Net income 7,048 12,874 48,766 49,777 120,810 KEY RATIOS Return on average assets .26 % .48 % 1.82 % .61 % 1.55 % Return on average shareholders' equity 2.35 4.27 15.79 5.49 13.53 Net interest margin (TE) 4.53 4.54 4.82 4.57 4.93 Average loans to average deposits 97.29 95.70 86.82 94.90 86.70 Efficiency ratio 64.89 61.79 51.09 61.71 57.79 Allowance for loan losses to loans 1.55 1.38 1.10 1.55 1.10 Annualized net charge-offs to average loans 1.22 .86 .13 .87 .08 Nonperforming assets to loans plus foreclosed assets and surplus property 3.15 2.03 1.22 3.15 1.22 Average shareholders' equity to average assets 10.94 11.20 11.52 11.17 11.43 Shareholders' equity to total assets 10.77 10.74 11.82 10.77 11.82 Tangible common equity as a percentage of tangible assets, end of period 7.89 7.86 8.81 7.89 8.81 Leverage ratio 8.17 8.27 9.19 8.17 9.19 COMMON SHARE DATA Earnings Per Share

Basic $ .11 $ .20 $ .72 $ .77 $ 1.80 Diluted .11 .20 .71 .76 1.78 Dividends Cash dividends per share $ .31 $ .31 $ .29 $ .93 $ .87 Dividend payout ratio 285.63 % 155.49 % 40.70 % 120.98 % 49.02 % Book Value Per Share $ 18.49 $ 18.51 $ 18.53 $ 18.49 $ 18.53 Tangible Book Value Per Share $ 13.13 $ 13.12 $ 13.35 $ 13.13 $ 13.35 Trading Data High sales price $ 33.02 $ 26.32 $ 30.32 $ 33.02 $ 33.26 Low sales price 13.96 17.85 23.02 13.96 23.02 End-of-period closing price 24.25 18.30 26.38 24.25 26.38 Trading volume 72,540,716 53,522,061 28,674,777 171,546,268 57,966,204 Average Shares Outstanding Basic 64,057,895 63,957,445 67,526,329 64,324,441 66,957,065 Diluted 64,740,931 64,761,553 68,237,485 65,113,263 67,896,650 Tax-equivalent (TE) amounts are calculated using a marginal federal income tax rate of 35%. The efficiency ratio is noninterest expense to total net interest (TE) and noninterest income, excluding securities transactions.
18

The purpose of this discussion and analysis is to focus on significant changes in the financial condition of
Whitney Holding Corporation and its subsidiaries (the Company or Whitney) from December 31, 2007 to September 30, 2008 and on their results of operations during the third quarters of 2008 and 2007 and during the nine-month periods through September 30 in each year. Nearly all of the Company’s operations are contained in its banking subsidiary, Whitney National Bank (the Bank). This discussion and analysis is intended to highlight and supplement information presented elsewhere in this quarterly report on Form 10-Q, particularly the consolidated financial statements and related notes appearing in Item 1. This discussion and analysis should be read in conjunction with the Company’s annual report on Form 10-K for the year ended December 31, 2007. FORWARD-LOOKING STATEMENTS
This discussion contains “forward-looking statements” within the meaning of section 27A of the Securities Act of 1933, as amended, and section 21E of the Securities Exchange Act of 1934, as amended. Forward-looking statements provide projections of results of operations or of financial condition or state other forward-looking information, such as expectations about future conditions and descriptions of plans and strategies for the future. Forward-looking statements often contain words such as “anticipate,” “believe,” “could,” “continue,” “estimate,” “expect,” “forecast,” “goal,” “intend,” “plan,” “predict,” “project” or other words of similar meaning.
The forward-looking statements made in this discussion include, but may not be limited to, (a) the description of Whitney’s intended participation in the U.S. Treasury’s Capital Purchase Program; (b) comments on conditions impacting certain sectors of the loan portfolio; (c) information about changes in the duration of the investment portfolio with changes in market rates; (d) statements of the results of net interest income simulations run by the Company to measure interest rate sensitivity; (e) discussion of the performance of Whitney’s net interest income assuming certain conditions; (f) comments on the anticipated dividend capacity of the Bank and (g) comments on expected changes in expense levels for employee benefits.
Whitney’s ability to accurately project results or predict the effects of plans or strategies is inherently limited. Although Whitney believes that the expectations reflected in its forward-looking statements are based on reasonable assumptions, actual results and performance could differ materially from those set forth in the forward-looking statements.
Factors that could cause actual results to differ from those expressed in the Company’s forward-looking statements include, but are not limited to:
Item 2: MANAGEMENT ’S DISCUSSION AND ANALYSIS OF FINANCIAL CONDITION AND RESULTS OF OPERATIONS
• Whitney’s ability to effectively manage interest rate risk and other market risk, credit risk and operational risk;
• changes in interest rates that affect the pricing of Whitney’s financial products, the demand for its financial services and the valuation of its financial assets and liabilities;
• Whitney’s ability to manage fluctuations in the value of its assets and liabilities and off-balance sheet exposure so as to maintain sufficient capital and liquidity to support its business;
19

You are cautioned not to place undue reliance on these forward-looking statements. Whitney does not intend, and undertakes no obligation, to update or revise any forward-looking statements, whether as a result of differences in actual results, changes in assumptions or changes in other factors affecting such statements, except as required by law. OVERVIEW
Whitney earned $7.0 million in the quarter ended September 30, 2008, compared with net income of $48.8 million for the third quarter of 2007. Earnings were $.11 per diluted share in 2008’s third quarter, compared to $.71 for the year-earlier period. The results for the third quarter of 2008 include casualty losses and expenses from Hurricanes Gustav and Ike totaling $2.1 million ($1.3 million after-tax, or $.02 per diluted share for the quarter). During the third quarter of 2007, Whitney reached a settlement on insurance claims arising from the hurricanes that struck portions of its market area in the late summer of 2005. With this settlement, the Company recognized a gain of $31.3 million ($19.9 million after-tax, or $.29 per diluted share for the quarter). Loans and Earning Assets
Loans totaled $8.1 billion at the end of the third quarter of 2008, which was up 6%, or $492 million, from year-end 2007, and 8%, or $625 million, from September 30, 2007. Loan demand and customer development activity in Whitney’s Texas and Louisiana markets were the major contributors to the loan growth year over year, with demand from commercial customers serviced from the Houston area leading the growth during the third quarter of 2008. The
• changes in general economic and business conditions, including the real estate and financial markets, in the United States and in the region and communities Whitney serves;
• the occurrence of natural disasters or acts of war or terrorism that directly or indirectly affect the financial health of Whitney’s customer base;
• changes in laws and regulations that significantly affect the activities of the banking industry and its competitive position relative to other financial service providers;
• technological changes affecting the nature or delivery of financial products or services and the cost of providing them and Whitney’s ability to keep pace with such changes;
• Whitney’s ability to develop competitive new products and services in a timely manner and their acceptance by the Bank’s customers;
• Whitney’s ability to effectively and efficiently expand into new markets; • the cost and other effects of material contingencies, including litigation contingencies; • the failure to attract or retain key personnel; • the failure to capitalize on growth opportunities and to realize cost savings in connection with business
acquisitions; • management’s inability to develop and execute plans for Whitney to effectively respond to unexpected
changes; and • those other factors identified and discussed in Whitney’s public filings with the SEC.
20

Florida-based portfolio was essentially unchanged year over year, with market conditions continuing to restrain loan demand from the state.
Loans, including loans held for sale, comprised 81% of average earning assets in the third quarter of 2008, up from 79% in the second quarter of 2008 and 76% in the year-earlier period. Deposits and Funding
Total deposits at September 30, 2008 were 6% below the total at December 31, 2007 and 4% below the total at the end of 2007’s third quarter. These decreases were mainly from higher-cost time deposits, including deposits held in certain treasury-management products used mainly by commercial customers.
Average deposits in the third quarter of 2008 were stable compared to the second quarter of 2008, but down 3% from the year-earlier period. Noninterest-bearing demand deposits for the current quarter were up 1% on average from 2008’s second quarter and 3% from the third quarter of 2007, concentrated in commercial accounts. To replace the higher-cost time deposits and fund loan growth, Whitney increased its short-term borrowings in the third quarter of 2008. Higher-cost interest-bearing funds, which include time deposits as well as borrowings, funded 37% of average earning assets in 2008’s third quarter, up slightly from the second quarter of 2008 and the year-earlier period. Net Interest Income
Whitney’s net interest income (TE) for the third quarter of 2008 decreased 5%, or $5.6 million, compared to the third quarter of 2007. Average earning assets increased 1% between these periods, and the mix of assets shifted fairly strongly in favor of loans. The net interest margin (TE) of 4.53% for the third quarter of 2008 was down 29 basis points from the year-earlier period, mainly reflecting the steep reduction in benchmark rates for the large variable-rate segment of Whitney’s loan portfolio toward the end of 2007 that continued into 2008. The rates on approximately 31% of the loan portfolio at September 30, 2008 were tied to changes in Libor benchmarks, with another 25% tied to prime. A reduction in funding costs from declining market rates was partially offset by the impact of a shift toward higher-cost funding sources between these periods.
Net interest income (TE) for the third quarter of 2008 was essentially unchanged from the second quarter of 2008. Both average earning assets and the net interest margin (TE) were relatively stable between these periods. The funding mix shifted further toward higher-cost sources between these periods, mainly from additional short-term borrowings and public fund time deposits. Provision for Credit Losses and Credit Quality
Whitney provided $40.0 million for credit losses in the third quarter of 2008, compared to $35.0 million in 2008’s second quarter and a $9.0 million provision in the third quarter of 2007. Net loan charge-offs in 2008’s third quarter were $24.5 million or 1.22% of average loans on an annualized basis, compared to $16.9 million in the second quarter of 2008 and $2.4 million in the third quarter of 2007. The allowance for loan losses increased $15.5 million during the current quarter and represented 1.55% of total loans at September 30, 2008, up from 1.38% at the end of 2008’s second quarter and 1.10% a year earlier.
21

Continuing weaknesses in the residential real estate markets, primarily in Florida and coastal Alabama,
accounted for approximately $25 million of the provision and approximately $11 million of the gross charge-offs for the third quarter of 2008, mainly related to loans for residential development. Problem commercial and industrial credits added approximately $5 million to the provision for the third quarter of 2008 and accounted for approximately $10 million of charge-offs for the period. Management added approximately $4 million to the allowance and provision based on its regular assessment of current economic conditions and other qualitative factors.
The total of loans criticized through the Company’s credit risk-rating process was $586 million at September 30, 2008, which represented 7% of total loans and a net increase of $121 million from June 30, 2008. The increase was largely concentrated in loans for residential development, the majority of which were from the Florida and Alabama markets. Loans for residential development, investment or other residential purposes comprised approximately half of the criticized loan total at September 30, 2008, mainly concentrated in Florida. Noninterest Income
Excluding the insurance settlement gain in the third quarter of 2007 that was noted earlier, noninterest income for 2008’s third quarter increased 10%, or $2.3 million, from the year-earlier period. Deposit service charge income in the third quarter of 2008 was up 5%, or $.4 million, aided mainly by reduced earnings credits allowed on certain commercial deposit accounts. Fee income from Whitney’s secondary mortgage market operations decreased 18% reflecting difficult financial and housing market conditions. The categories comprising other noninterest income, excluding the insurance settlement gain, increased a combined $2.1 million compared to the third quarter of 2007, with positive contributions from most recurring revenue sources, including $1.6 million of earnings from a bank-owned life insurance program implemented in late May 2008.
Noninterest income decreased 3%, or $.7 million, compared to 2008’s second quarter. There were small declines in most recurring revenue sources, other than from the life insurance program, most of which can be at least partly attributed to recent financial and credit market conditions and overall economic conditions. Noninterest Expense
Noninterest expense in the third quarter of 2008 increased 1%, or $1.3 million, from 2007’s third quarter. The current year’s period included $2.1 million for uninsured casualty losses and expenses arising from Hurricanes Gustav and Ike that struck parts of the Company’s market area in September. Whitney’s personnel expense decreased 2%, or $1.0 million, between these periods, primarily due to a decrease in compensation associated with management incentive programs and the impact of a 3% reduction in the average full-time equivalent staff level.
Excluding storm-related items, noninterest expense for 2008’s third quarter was up 2%, or $1.9 million, compared to the second quarter of 2008. Personnel expense increased $.9 million, although this was mainly related to a reduction in share-based compensation in the second quarter of 2008 that resulted from a periodic reassessment of multi-year performance estimates. Comparative expense levels for the third quarter of 2008 were also impacted by increased loan collection efforts, higher deposit insurance premiums under the new assessment system and certain seasonal factors.
22

U.S. Treasury Department Capital Purchase Program
On October 14, 2008, the U.S. Department of Treasury (Treasury) announced a Capital Purchase Program (Program) as part of the actions to restore liquidity and stability to the financial system provided for under the Emergency Economic Stabilization Act of 2008 (EESA) that was signed into law on October 3, 2008. Under the Program, Treasury may invest in senior preferred stock of eligible financial institutions in an amount not less than 1% or more than 3% of an institution’s risk-weighted assets as of September 30, 2008. Whitney filed an application to participate in the Program on November 7, 2008 that requested an investment by Treasury of up to $301 million. Any capital raised through Treasury’s investment will qualify as Tier 1 regulatory capital and be used in calculating all of Whitney’s regulatory capital ratios.
Whitney will pay cumulative dividends on the senior preferred shares at an annual rate of 5% for the first five years and 9% thereafter, unless Whitney redeems the shares earlier. Redemptions will be at 100% of issue price plus accrued dividends and are subject to prior regulatory approval. No redemptions are allowed for the first three years, unless the Company uses the proceeds of a sale of common or preferred stock that qualifies as Tier 1 regulatory capital.
Treasury will also receive 10-year warrants to purchase a number of shares of Whitney’s common stock that have an aggregate market price equal to 15% of the amount of Treasury’s investment in the senior preferred stock. This aggregate market price would equal $45.2 million, assuming a maximum senior preferred issue, and the number of shares will be determined using a 20-day trailing average market price for the Company’s common stock on the day before Whitney’s application is approved by Treasury.
Whitney may not declare or pay dividends on its common stock or repurchase common stock without first having paid all accrued cumulative preferred dividends that are due. For three years after Treasury’s investment in the senior preferred shares, the Company also may not increase its per share common stock dividend rate or repurchase its common shares without Treasury’s consent, unless Treasury has transferred all the senior preferred shares to third parties.
To be eligible for the Program, Whitney must also comply with certain executive compensation and corporate governance requirements of the EESA, including a limit on the tax deductibility of executive compensation above $500,000. The rules covering these requirements are being developed by Treasury and other government agencies.
Whitney’s charter does not currently provide for the issuance of preferred stock. The Company has called a special shareholders’ meeting to vote on a charter amendment to authorize the issuance of up to 20 million shares of preferred stock. If the shareholders do not approve this amendment, Whitney will be unable to participate in the Program. Shareholders are also being asked to vote on an increase in the authorized shares of common stock to 200 million shares from the current 100 million shares. Mergers and Acquisitions
On November 7, 2008, Whitney completed its acquisition of Parish National Corporation (Parish), the parent of Parish National Bank. Parish National Bank operates 16 banking centers, primarily on the north shore of Lake Pontchartrain and other parts of the metropolitan New Orleans area, and had $771 million in total assets, including a loan portfolio of $606 million, and $636 million in deposits at the acquisition date. The Company expects to merge Parish National Bank into Whitney National Bank before the end of 2008. The transaction was valued at
23

approximately $158 million, with $97 million paid to Parish’s shareholders in cash and the remainder in Whitney stock totaling approximately 3.33 million shares. Parish’s operations since the acquisition date will be included in Whitney’s financial information beginning with the fourth quarter of 2008.
On March 2, 2007, Whitney completed its acquisition of Signature Financial Holdings, Inc. (Signature), the parent of Signature Bank. Signature Bank operated seven banking centers in the Tampa Bay metropolitan area with approximately $270 million in total assets, including $220 million of loans, and $210 million in deposits at acquisition. Whitney’s financial information includes the results from these acquired operations since the acquisition date. FINANCIAL CONDITION LOANS, CREDIT RISK MANAGEMENT, AND ALLOWANCE AND RE SERVE FOR CREDIT LOSSES Loan Portfolio Developments
Total loans at September 30, 2008 were up 6%, or $492 million, from year-end 2007, and 8%, or $625 million, from September 30, 2007. Loan demand and customer development activity in Whitney’s Texas and Louisiana markets were the major contributors to the loan growth year over year, with demand from commercial customers serviced from the Houston area leading the growth during the third quarter of 2008. Compared to September 30, 2007, loans serviced from Whitney’s operations in Houston, Texas grew by 35%, those serviced in Louisiana markets outside New Orleans were up 9%, and loans from the metropolitan New Orleans area grew 4%. The Florida-based portfolio was essentially unchanged year over year, with market conditions continuing to restrain loan demand from the state.
Table 1 shows loan balances by type of loan at September 30, 2008 and at the end of the four prior quarters. Table 2 distributes the loan portfolio as of September 30, 2008 by the geographic region from which the loans are serviced. The following discussion provides a brief overview of the composition of the different portfolio sectors and the customers served in each as well as recent changes.
The portfolio of commercial loans, other than those secured by real property, increased 10%, or $278 million,
between year-end 2007 and September 30, 2008, and this portfolio sector was up a comparable percentage and amount compared to the end of 2007’s third quarter. This growth was concentrated in Whitney’s Houston, Texas market and Louisiana markets, including
TABLE 1. LOANS 2008 2007 ( in millions) September 30 June 30 March 31 December 31 September 30 Commercial, financial and agricultural $ 3,101 $ 3,087 $ 2,897 $ 2,823 $ 2,837 Real estate – commercial, construction and other 3,612 3,537 3,533 3,477 3,345 Real estate – residential mortgage 1,003 983 950 934 924 Individuals 362 356 344 352 347 Total loans $ 8,078 $ 7,963 $ 7,724 $ 7,586 $ 7,453
24

strong growth from customers in the oil and gas industry. Overall, the commercial portfolio has remained diversified, with customers in a range of industries, including oil and gas exploration and production, wholesale and retail trade in various durable and nondurable products and the manufacture of such products, marine transportation and maritime construction, financial services, and professional services. The growth in market areas outside of metropolitan New Orleans in recent years has increased the geographic diversification of customers represented in the commercial portfolio.
Loans outstanding to oil and gas industry customers represented approximately 11% of total loans at September 30, 2008, up from approximately 10% at year-end 2007. The majority of Whitney’s customer base in this industry provides transportation and other services and products to support exploration and production activities. Loans outstanding to the exploration and production sector comprised close to one-third of the oil and gas industry portfolio at September 30, 2008. The prospect of a significant slowdown in global economic activity has led to a sharp reduction in commodity prices. Management monitors these prices and their impact on industry activity levels closely and makes appropriate adjustments to Whitney’s credit underwriting guidelines and the management of existing relationships.
Outstanding balances under participations in larger shared-credit loan commitments totaled $549 million at the end of 2008’s third quarter, compared to $444 million outstanding at year-end 2007. The total at September 30, 2008 included approximately $152 million related to the oil and gas industry. Substantially all such shared credits are with customers operating in Whitney’s market area.
The commercial real estate portfolio includes loans for construction and land development and investment, both commercial and residential, loans secured by multi-family residential properties and other income-producing properties, and loans secured by properties used by the owners in commercial or industrial operations. Table 2 presents information on the components and geographic distribution of the commercial real estate loan portfolio.
TABLE 2. GEOGRAPHIC DISTRIBUTION OF LOAN PORTFOLIO AT SEPTEMBER 30, 2008 Total Percent Total Percent Alabama/ Sept. 30 of Dec. 31 of (dollars in millions) Louisiana Texas Florida Mississippi 2008 total 2007 total Commercial, financial and agricultural $ 2,147 $ 583 $ 101 $ 270 $ 3,101 38 % $ 2,823 37 % Residential construction 74 89 57 45 265 3 316 4 Commercial construction, land & land development 377 367 433 241 1,418 18 1,454 19 Commercial – owner-user 488 89 180 65 822 10 741 10 Commercial – other 512 155 313 127 1,107 14 967 13 Real estate – commercial, construction and other 1,451 700 983 478 3,612 45 3,477 46 Real estate – residential mortgage 533 125 221 124 1,003 12 934 12 Individuals 244 16 64 38 362 5 352 5 Total $ 4,375 $ 1,424 $ 1,369 $ 910 $ 8,078 100 % $ 7,586 100 % Percent of total 54 % 18 % 17 % 11 % 100 %
25

Project financing is an important component of the activity in this portfolio sector, and sector growth is
impacted by the availability of new projects as well as the anticipated refinancing of seasoned income properties in the secondary market and payments on residential development loans as inventory is sold. This portfolio sector grew 4%, or $135 million, from December 31, 2007, and has increased 8%, or $267 million, since the end of the third quarter of 2007. The net growth was mainly in the Houston, Texas and Louisiana markets and involved a variety of retail, commercial and industrial facilities, as well as some multi-family and single-family residential development. A lack of growth in the Florida-based real estate portfolio reflected limited new project financing, particularly for residential development, coupled with gradual paydowns on existing project loans. The future pace of new real estate project financing in Whitney’s market areas will reflect the level of confidence by Whitney and its customers in the sustainability of economic conditions favorable to successful project completion.
The residential mortgage loan portfolio increased 7%, or $69 million, from the end of 2007 to September 30, 2008 and was up 9% from a year earlier. Growth in this category has mainly come from Whitney’s Louisiana and Texas markets and partly reflects the promotion of tailored home mortgage loan products generally targeted to the higher net worth customer base. The Bank continues to sell most conventional residential mortgage loan production in the secondary market. Whitney lending strategy has not included sub-prime home mortgage loans. Credit Risk Management and Allowance and Reserve for Credit Losses
General Discussion of Credit Risk Management and Determination of Credit Loss Allowance and Reserve Whitney manages credit risk mainly through adherence to underwriting and loan administration standards
established by the Bank’s Credit Policy Committee and through the efforts of the credit administration function to ensure consistent application and monitoring of standards throughout the Company. Lending officers are responsible for ongoing monitoring and the assignment of risk ratings to individual loans based on established guidelines. An independent credit review function reporting to the Audit Committee of the Board of Directors assesses the accuracy of officer ratings and the timeliness of rating changes and performs concurrent reviews of the underwriting processes.
Management’s evaluation of credit risk in the loan portfolio is reflected in the estimate of probable losses inherent in the portfolio that is reported in the Company’s financial statements as the allowance for loan losses. Changes in this evaluation over time are reflected in the provision for credit losses charged to expense. The methodology for determining the allowance involves significant judgment, and important factors that influence this judgment are re-evaluated quarterly to respond to changing conditions.
The recorded allowance encompasses three key elements: (1) allowances established for losses on criticized loans; (2) allowances based on historical loss experience for loans with acceptable credit quality and groups of homogeneous loans not individually rated; and (3) allowances based on general economic conditions and other qualitative risk factors internal and external to the Company. The allowance for criticized loans includes any specific allowances determined for loans that are deemed impaired under the definition in Statement of Financial Accounting Standards No. 114. The allowance for the remainder of criticized loans is calculated by applying loss factors to loan balances aggregated by severity of the internal risk rating.
26

The monitoring of credit risk also extends to unfunded credit commitments, such as unused commercial credit
lines and letters of credit, and management establishes reserves as needed for its estimate of probable losses on such commitments.
Credit Quality Statistics and Components of Credit Loss Allowance and Reserve The total of loans criticized through the Company’s credit risk-rating process was $586 million at September
30, 2008, which represented 7% of total loans and a net increase of $121 million from June 30, 2008. Table 3 shows the composition of criticized loans at September 30, 2008, distributed by the geographic region from which the loans are serviced.
The increase in criticized loans during the third quarter of 2008 was largely concentrated in loans for residential
development, the majority of which were from the Florida and Alabama markets. Loans for residential development, investment or other residential purposes comprised approximately one-half of the criticized loan total at September 30, 2008, mainly concentrated in Florida. Nonresidential real estate loans accounted for another one-third of the criticized total, with the largest concentration in loans on income-producing and investment properties in the Florida market. Approximately $70 million of the criticized nonresidential real estate loans were secured by properties used in the borrower’s business operations. Loans to commercial and industrial relationships made up most of the remaining criticized total at September 30, 2008, with no significant concentrations related to industries or markets. Although management has not identified any systemic portfolio credit issues apart from the real estate problems concentrated in Florida and coastal Alabama, it has taken careful note of the general weakening in the overall economy and is closely monitoring its impact on the performance of the tourism and energy industries given their importance to the economies in Whitney’s market.
Included in the total of criticized loans at September 30, 2008 was $235 million of nonperforming loans, up a net $88 million from June 30, 2008. Approximately two-thirds of the nonperforming loans at September 30, 2008 were residential-related real estate credits, heavily concentrated in Whitney’s Florida market and, to a lesser extent, Alabama. The Florida market
TABLE 3. CRITICIZED LOANS AT SEPTEMBER 30, 2008 Alabama/ Percent (dollars in millions) Louisiana Texas Florida Mississippi Total of loans Commercial, financial and agricultural $ 29 $ 38 $ 6 $ 26 $ 99 3 % Residential construction 8 10 20 3 41 15 % Commercial construction, land & land development 28 3 140 34 205 14 % Commercial – owner-user 35 2 17 12 66 8 % Commercial – other 36 - 49 18 103 9 % Real estate – commercial, construction and other 107 15 226 67 415 11 % Real estate – residential mortgage 24 2 31 6 63 6 % Individuals 5 - 2 2 9 2 % Total $ 165 $ 55 $ 265 $ 101 $ 586 7 % Percent of loans 4 % 4 % 19 % 11 % 7 %
27

accounted for 66% of total nonperforming loans at the end of the most recent quarter, followed by 14% from Alabama and 18% from Louisiana.
Table 4 provides information on nonperforming loans and other nonperforming assets at September 30, 2008 and at the end of the previous four quarters. Total foreclosed assets and surplus property increased to $19.6 million at September 30, 2008, up from $14.5 million at June 30, 2008, mainly related to residential development and investment properties as well as some surplus land originally intended for a branch site.
The overall allowance for loan losses increased $15.5 million during the third quarter of 2008. The component
of the allowance for criticized loans increased a net $10.2 million after charge-offs of approximately $24 million during the period. The allowance for loans with average or better quality ratings and loans not subject to individual rating increased $1.0 million from June 30, 2008, mainly from the impact of recent charge-off experience on historical loss factors. Management also added $4.3 million to the allowance based on its relative assessment of economic and other qualitative risk factors between these dates.
Continuing weaknesses in the residential real estate markets, primarily in Florida and coastal Alabama, accounted for approximately $25 million of the provision and approximately $11 million of the gross charge-offs for the third quarter of 2008, mainly related to loans for residential development. Until sufficient demand returns to these markets to establish a solid floor on real estate prices and stimulate renewed development, management cannot predict when the level of criticized loans will stabilize or retreat and its periodic estimate of inherent losses for this portfolio segment may be volatile. Problem commercial credits not secured by real estate added approximately $5 million to the provision for the third quarter of 2008 and accounted for approximately $10 million charge-offs for the period, substantially all of which had been anticipated in the valuation allowance for impaired loans at June 30, 2008.
Table 5 compares third quarter and year-to-date activity for 2008 in the allowance for loan losses and in the reserve for losses on unfunded credit commitments with the comparable periods of 2007.
TABLE 4. NONPERFORMING ASSETS 2008 2007 September June March December September (dollars in thousands) 30 30 31 31 30 Loans accounted for on a nonaccrual basis $ 235,136 $ 147,383 $ 139,371 $ 120,096 $ 88,580 Restructured loans accruing - - - - - Total nonperforming loans 235,136 147,383 139,371 120,096 88,580 Foreclosed assets and surplus property 19,597 14,524 11,980 4,624 2,628 Total nonperforming assets $ 254,733 $ 161,907 $ 151,351 $ 124,720 $ 91,208 Loans 90 days past due still accruing $ 6,145 $ 7,490 $ 3,059 $ 8,711 $ 2,967 Ratios: Nonperforming assets to loans plus foreclosed assets and surplus property 3.15 % 2.03 % 1.96 % 1.64 % 1.22 % Allowance for loan losses to nonperforming loans 53.32 74.54 65.80 73.20 92.72 Loans 90 days past due still accruing to loans .08 .09 .04 .11 .04
28

INVESTMENT SECURITIES
The investment securities portfolio balance decreased 9%, or $173 million, from year-end 2007 to September 30, 2008, and average investment securities in the current quarter were down a comparable percentage and amount from the second quarter of 2008. A portion of the funds from portfolio maturities and normal principal payments has been used to support loan growth during 2008. The composition of the average portfolio of investment securities and effective yields are shown in Table 9.
The mix of investments in the portfolio shifted further toward mortgage-backed securities issued or guaranteed by U.S. government agencies during the third quarter of 2008. The duration of the overall investment portfolio was 2.5 years at September 30, 2008 and would extend to 3.7 years assuming an immediate 300 basis point increase in market rates, according to the Company’s asset/liability management model. Duration provides a measure of the sensitivity
TABLE 5. SUMMARY OF ACTIVITY IN THE ALLOWANCE FOR L OAN LOSSES AND RESERVE FOR LOSSES ON UNFUNDED CREDIT COMMITMENTS Three Months Ended Nine Months Ended September 30 September 30 (dollars in thousands) 2008 2007 2008 2007 ALLOWANCE FOR LOAN LOSSES Allowance at beginning of period $ 109,852 $ 75,099 $ 87,909 $ 75,927 Allowance of acquired bank - - - 2,791 Provision for credit losses 40,000 9,400 89,000 7,900 Loans charged off: Commercial, financial and agricultural (11,821 ) (3,247 ) (27,859 ) (8,143 ) Real estate – commercial, construction and other (12,368 ) (542 ) (19,859 ) (1,881 ) Real estate – residential mortgage (2,470 ) (719 ) (6,378 ) (936 ) Individuals (666 ) (611 ) (2,563 ) (1,738 ) Total charge-offs (27,325 ) (5,119 ) (56,659 ) (12,698 ) Recoveries on loans previously charged off: Commercial, financial and agricultural 2,150 2,302 3,447 6,864 Real estate – commercial, construction and other 367 15 575 148 Real estate – residential mortgage 30 215 260 384 Individuals 296 223 838 819 Total recoveries 2,843 2,755 5,120 8,215 Net loans charged off (24,482 ) (2,364 ) (51,539 ) (4,483 ) Allowance at end of period $ 125,370 $ 82,135 $ 125,370 $ 82,135 Ratios: Allowance for loan losses to loans at period end 1.55 % 1.10 % 1.55 % 1.10 % Annualized net charge-offs to average loans 1.22 .13 .87 .08 Annualized gross charge-offs to average loans 1.36 .28 .96 .23 Recoveries to gross charge-offs 10.40 53.82 9.04 64.70 RESERVE FOR LOSSES ON UNFUNDED CREDIT COMMITMENTS Reserve at beginning of period $ 1,300 $ 1,400 $ 1,300 $ 1,900 Provision for credit losses - (400 ) - (900 ) Reserve at end of period $ 1,300 $ 1,000 $ 1,300 $ 1,000
29

of the portfolio’s fair value to changes in interest rates. At December 31, 2007, the portfolio’s estimated duration was 2.1 years.
Securities available for sale made up the bulk of the total investment portfolio at September 30, 2008. Available-for-sale securities are carried at fair value, and the balance reported at September 30, 2008 reflected gross unrealized gains of $14.5 million and gross unrealized losses of $5.9 million. The unrealized losses were mainly related to mortgage-backed securities and represented less than 1% of the total amortized cost of the underlying securities. Substantially all the unrealized losses at September 30, 2008 resulted from increases in market interest rates over the yields available on the underlying securities when they were purchased and other factors unrelated to credit quality. There were no securities in the investment portfolio tied to sub-prime home mortgage loans. In addition, management has the intent and ability to hold these securities until the market-based impairment is recovered; therefore, no value impairment was determined to be other than temporary.
The Company does not normally maintain a trading portfolio, other than holding trading account securities for short periods while buying and selling securities for customers. Such securities, if any, are included in other assets in the consolidated balance sheets. DEPOSITS AND BORROWINGS
Total deposits at September 30, 2008 were approximately 6%, or $530 million, below the total at December 31, 2007 and 4% below the total at the end of 2007’s third quarter. Table 6 shows the composition of deposits at September 30, 2008, and at the end of the previous four quarters. Table 9 presents the composition of average deposits and borrowings and the effective rates on interest-bearing funding sources for the third and second quarters of 2008 and the third quarter of 2007, as well as for the nine-month period in each year.
Noninterest-bearing demand deposits grew 3%, or $70 million, from year-end 2007 and 6% from September 30, 2007, mainly concentrated in commercial accounts. These demand deposits comprised 35% of total deposits at September 30, 2008 compared to 32% at the end of 2007. Total lower-cost interest-bearing deposits at September 30, 2008 were down 8%, or $248 million, from year-end 2007. The total for this deposit category declined 4% from the end of 2007’s third quarter.
TABLE 6. DEPOSIT COMPOSITION 2008 2007 (dollars in millions) September 30 June 30 March 31 December 31 September 30 Noninterest-bearing demand deposits $ 2,810 35 % $ 2,773 34 % $ 2,724 33 % $ 2,740 32 % $ 2,639 31 % Interest-bearing deposits: NOW account deposits 959 12 1,033 12 1,068 13 1,152 13 1,009 12 Money market deposits 1,158 14 1,204 15 1,242 15 1,230 14 1,236 15 Savings deposits 897 11 939 11 925 11 880 10 898 11 Other time deposits 714 9 729 9 773 9 824 10 866 10 Time deposits $100,000 and over 1,516 19 1,589 19 1,563 19 1,758 21 1,739 21 Total interest-bearing 5,244 65 5,494 66 5,571 67 5,844 68 5,748 69 Total $ 8,054 100 % $ 8,267 100 % $ 8,295 100 % $ 8,584 100 % $ 8,387 100 %
30

Higher-cost time deposits at September 30, 2008 were down 14%, or $352 million, compared to year-end
2007. Consumer time deposits, which have become less attractive relative to other deposit and investment products in the current low interest rate environment, declined 12%, or $149 million, between these dates. Customers held $447 million of funds in treasury-management deposit products at September 30 2008, down $258 million from the total held at December 31, 2007. These products are used mainly by commercial customers with excess liquidity pending redeployment for corporate or investment purposes, and, while they provide a recurring source of funds, the amounts available over time can be volatile. Competitively bid public funds time deposits totaled approximately $273 million at the end of the third quarter of 2008, which was up $66 million from year-end 2007. Treasury-management deposits and public funds deposits serve partly as an alternative to Whitney’s other short-term borrowings. To replace the higher-cost time deposits and fund loan growth, the Company increased its short-term borrowings. The balance of short-term borrowings at September 30, 2008, was up 61%, or $556 million, from year-end 2007. During 2008, Whitney obtained short-term Federal Home Loan Bank (FHLB) advances totaling $500 million and purchased additional federal funds, which were up $224 million at September 30, 2008 compared to year-end 2007. Total borrowings from customers under securities repurchase agreements decreased 22%, or $168 million, from December 31, 2007, partly reflecting temporary funds from certain large customer business transactions at year end. SHAREHOLDERS’ EQUITY AND CAPITAL ADEQUACY
Shareholders’ equity totaled $1.18 billion at September 30, 2008, which was a decrease of $46 million from the end of 2007. Whitney repurchased 2.04 million shares of its common stock during the first half of 2008 at a cost of $50 million. This completed the program announced in November 2007 under which the Company repurchased a total of 3.93 million shares. For the first nine months of 2008, Whitney recognized $6 million in additional equity from activity in share-based compensation plans for employees and directors, including option exercises. A net unrealized holding gain on securities available for sale during the first nine months of 2008 was the main factor behind the $6 million in other comprehensive income for the period.
The Company declared dividends at a rate of $.31 per share for each of the first three quarters of 2008. The total dividends declared exceeded earnings for the first nine months of 2008 by $10 million and represented a payout ratio of 121%. Management is prepared to reconsider the current quarterly dividend rate if credit problems continue to have a significant adverse impact on Whitney’s earnings performance. The dividend payout ratio was 52% for the full year in 2007.
The ratios in Table 7 show that the Company remained strongly capitalized at September 30, 2008. Tier 2 and total regulatory capital at both September 30, 2008 and December 31, 2007 include $150 million in subordinated notes payable issued by the Bank. The decline in Whitney’s capital-to-asset ratios since the end of 2007 mainly reflected the completion of the share repurchase program as discussed above and a dividend payout in excess of earnings for the period. The increase in risk-weighted assets from the end of 2007 mainly reflected the impact of loan growth, partly offset by the impact of a decrease in lower weighted short-term liquidity management investments during this period.
31

The minimum capital ratios for both the Company and the Bank are generally 4% leverage, 4% Tier 1 capital
and 8% total capital. Regulators may, however, set higher capital requirements for an individual institution when particular circumstances warrant. For a bank to qualify as well-capitalized under the regulatory framework for prompt corrective supervisory action, its leverage, Tier 1 and total capital ratios must be at least 5%, 6% and 10%, respectively. Bank holding companies must also have at least a 6% Tier 1 capital ratio and a 10% total capital ratio to be considered well-capitalized for various regulatory purposes. Both the Company and the Bank satisfied the capital criteria to be categorized as “well-capitalized” at September 30, 2008.
Under the Treasury Program, which is described in some detail in the earlier Overview section, the U.S. Treasury may invest in senior preferred stock of eligible financial institutions. Whitney filed an application to participate in the Program on November 7, 2008 that requested an investment by Treasury of up to $301 million. Any capital raised through Treasury’s investment will qualify as Tier 1 regulatory capital and be used in calculating all of Whitney’s regulatory capital ratios. LIQUIDITY MANAGEMENT AND CONTRACTUAL OBLIGATIONS Liquidity Management
The objective of liquidity management is to ensure that funds are available to meet cash flow requirements of depositors and borrowers, while at the same time meeting the operating, capital and strategic cash flow needs of the Company and the Bank. Whitney develops its liquidity management strategies and measures and monitors liquidity risk as part of its overall asset/liability management process.
Liquidity management on the asset side primarily addresses the composition and maturity structure of the loan portfolio and the portfolio of investment securities and their impact on the Company’s ability to generate cash flows from scheduled payments, contractual maturities, and prepayments, through use as collateral for borrowings, and through possible sale or securitization. At September 30, 2008, securities available for sale with a carrying value of $1.37 billion, out of a total portfolio of $1.57 billion, were sold under repurchase agreements, pledged to secure public deposits or pledged for other purposes.
TABLE 7. RISK-BASED CAPITAL AND CAPITAL RATIOS September 30 December 31 (dollars in thousands) 2008 2007 Tier 1 regulatory capital $ 861,983 $ 911,141 Tier 2 regulatory capital 267,313 238,967 Total regulatory capital $1,129,296 $1,150,108 Risk-weighted assets $9,393,666 $9,023,862 Ratios Leverage (Tier 1 capital to average assets) 8.17 % 8.79 % Tier 1 capital to risk-weighted assets 9.18 10.10 Total capital to risk-weighted assets 12.02 12.75 Shareholders’ equity to total assets 10.77 11.14
32

On the liability side, liquidity management focuses on growing the base of core deposits at competitive rates,
including the use of treasury-management products for commercial customers, while at the same time ensuring access to economical wholesale funding sources. In October 2008, the FDIC temporarily increased deposit insurance coverage limits for all deposit accounts from $100,000 to $250,000 per depositor through December 31, 2009 and offered to provide unlimited deposit insurance coverage for noninterest-bearing transaction accounts over the same period. These steps were taken as part of the government’s response to the recent severe disruption in the credit markets and were designed to support deposit retention and enhance the liquidity of the nation’s insured depository institutions and thereby assist in stabilizing the overall economy; however, there is no assurance these steps will be successful. Wholesale funding currently used by the Bank includes FHLB advances and federal funds purchased from upstream correspondents. The unused borrowing capacity from the FHLB at September 30, 2008 totaled approximately $1.0 billion and is secured by a blanket lien on loans secured by real estate. The Bank may also borrow from the Federal Reserve Discount Window and had a borrowing capacity at September 30, 2008 of approximately $1.0 billion, based on collateral available for pledge. In addition, both the Company and the Bank have access to external funding sources in the financial markets, and the Bank has developed the ability to gather deposits at a nationwide level, although it has not used this ability to date. The section above entitled “Deposits and Borrowings” discusses changes in these liability-funding sources in the first nine months of 2008.
Cash generated from operations is another important source of funds to meet liquidity needs. The consolidated statements of cash flows located in Item 1 of this report present operating cash flows and summarize all significant sources and uses of funds for the first nine months of 2008 and 2007.
At September 30, 2008, Whitney Holding Corporation had approximately $84 million in cash and demand notes from the Bank available to provide liquidity for acquisitions, dividend payments to shareholders, stock repurchases or other corporate uses, before consideration of any future dividends that may be received from the Bank. Approximately $97 million of cash will be needed to fund the acquisition of Parish National Corporation that was completed on November 7, 2008. The dividend capacity of the Bank is sufficient to provide any additional funds needed for the acquisition and the quarterly dividend that was payable on October 1, 2008.
Under the Treasury Program, which is described in some detail in the earlier Overview section, the U.S. Treasury may invest in senior preferred stock of eligible financial institutions. Whitney filed an application to participate in the Program on November 7, 2008 that requested an investment by Treasury of up to $301 million. Contractual Obligations
Payments due from the Company and the Bank under specified long-term and certain other binding contractual obligations, other than obligations under deposit contracts and short-term borrowings, were scheduled in Whitney’s annual report on Form 10-K for the year ended December 31, 2007. The most significant obligations included long-term debt service, operating leases for banking facilities and various multi-year contracts for outsourced services and software licenses. There have been no material changes in contractual obligations from year-end 2007 through the end of 2008’s third quarter.
33

The Company made a $10 million contribution to the qualified plan during the third quarter of 2008. The
performance of the pension trust fund through the end of the third quarter of 2008 was substantially below the long-term expected rate of return, reflecting conditions in the equity and corporate debt markets. Management is monitoring fund performance as it considers whether it would be desirable to make an additional contribution before year end. OFF-BALANCE-SHEET ARRANGEMENTS
As a normal part of its business, the Company enters into arrangements that create financial obligations that are not recognized, wholly or in part, in the consolidated financial statements. The most significant off-balance-sheet obligations are the Bank’s commitments under traditional credit-related financial instruments. Table 8 schedules these commitments as of September 30, 2008 by the periods in which they expire. Commitments under credit card and personal credit lines generally have no stated maturity.
Revolving loan commitments are issued primarily to support commercial activities. The availability of funds
under revolving loan commitments generally depends on whether the borrower continues to meet credit standards established in the underlying contract and has not violated other contractual conditions. A number of such commitments are used only partially or, in some cases, not at all before they expire. Credit card and personal credit lines are generally subject to cancellation if the borrower’s credit quality deteriorates, and many lines remain partly or wholly unused. Unfunded balances on revolving loan commitments and credit lines should not be used to project actual future liquidity requirements. Nonrevolving loan commitments are issued mainly to provide financing for the acquisition and development or construction of real property, both commercial and residential, although many are not expected to lead to permanent financing by the Bank. Expectations about the level of draws under all credit-related commitments, including the prospect of temporarily increased levels of draws on back-up commercial facilities during this period of disruption in the credit markets, are incorporated into the Company’s liquidity and asset/liability management models.
Substantially all of the letters of credit are standby agreements that obligate the Bank to fulfill a customer’s financial commitments to a third party if the customer is unable to perform. The Bank issues standby letters of credit primarily to provide credit enhancement to its customers’ other commercial or public financing arrangements and to help them demonstrate financial capacity to vendors. The Bank has historically had minimal calls to perform under standby agreements.
TABLE 8. CREDIT -RELATED COMMITMENTS Commitments expiring by period from September 30, 2008 Less than 1 - 3 3 - 5 More than (in thousands) Total 1 year years years 5 years Loan commitments – revolving $2,527,502 $1,808,464 $426,428 $254,751 $37,859 Loan commitments – nonrevolving 554,428 290,950 261,745 1,733 -Credit card and personal credit lines 519,624 519,624 - - -Standby and other letters of credit 467,966 328,854 46,394 92,718 - Total $4,069,520 $2,947,892 $734,567 $349,202 $37,859
34

ASSET/LIABILITY MANAGEMENT
The objective of the Company’s asset/liability management is to implement strategies for the funding and deployment of its financial resources that are expected to maximize soundness and profitability over time at acceptable levels of risk.
Interest rate sensitivity is the potential impact of changing rate environments on both net interest income and cash flows. The Company measures its interest rate sensitivity over the near term primarily by running net interest income simulations. The net interest income simulations run at September 30, 2008 indicated that Whitney was moderately asset sensitive over the near term, similar to its position at year-end 2007. Based on these simulations, annual net interest income (TE) would be expected to increase $22.4 million, or 4.5%, and decrease $17.4 million, or 3.5%, if interest rates instantaneously increased or decreased, respectively, from current rates by 100 basis points. These changes are measured against the results of a base simulation run that uses growth forecasts as of the measurement date and that assumes a stable rate environment and structure. The comparable simulation run at year-end 2007 produced results that ranged from a positive impact on net interest income (TE) of $24.3 million, or 5.2%, to a negative impact of $26.5 million, or 5.6%.
The actual impact that changes in interest rates have on net interest income will depend on many factors. These factors include Whitney’s ability to achieve expected growth in earning assets and maintain a desired mix of earning assets and interest-bearing liabilities, the actual timing when assets and liabilities reprice, the magnitude of interest rate changes and corresponding movement in interest rate spreads, and the level of success of asset/liability management strategies that are implemented.
35

RESULTS OF OPERATIONS NET INTEREST INCOME (TE)
Net interest income (TE) for the third quarter of 2008 was essentially unchanged from the second quarter of 2008. Both average earning assets and the net interest margin (TE) were relatively stable between these periods. The funding mix shifted further toward higher-cost sources between these periods, mainly from additional short-term borrowings and public funds time deposits. Whitney’s net interest income for the third quarter of 2008 decreased 5%, or $5.6 million, compared to the third quarter of 2007. Average earning assets increased 1% between these periods, and the mix of assets shifted fairly strongly in favor of loans. The net interest margin (TE) was 4.53% for the third quarter of 2008, down 29 basis points from the year-earlier period. Tables 9 and 10 provide details on the components of the Company’s net interest income (TE) and net interest margin (TE).
The overall yield on earning assets decreased 135 basis points from the third quarter of 2007, with this year-over-year decline mainly reflecting the steep reduction in benchmark rates for the large variable-rate segment of Whitney’s loan portfolio toward the end of 2007 that continued into 2008. The rates on approximately 31%, or $2.5 billion, of the loan portfolio at September 30, 2008 were tied to changes in Libor benchmarks, with another 25%, or $2.0 billion, tied to prime. The recent disruption in credit markets has been reflected in wider than normal spreads for Libor rates that have continued into the fourth quarter of 2008. The benefit of the wider spreads to Whitney’s net interest margin, which was estimated at 9 basis points for the third quarter of 2008, will be eliminated with the return of more normal historical relationships. The timing of this return is uncertain. Loans, which in Table 9 include loans held for sale, comprised 81% of average earning assets in the third quarter of 2008, up from 76% in the year-earlier period.
The cost of funds decreased 106 basis points from the third quarter of 2007 to 1.09% in 2008’s third quarter. The reduction in funding costs from declining market rates was partially offset by the impact of a shift toward higher-cost sources between these periods that mainly reflected the increased use of short-term borrowings to support earning asset growth. Average deposits in the third quarter of 2008 were down 3% compared to the third quarter of 2007. Noninterest-bearing deposits and other lower-cost interest-bearing deposits increased 1% on average between these periods, but the total for more rate-sensitive time deposits decreased 12% in the declining interest rate environment. Noninterest-bearing demand deposits funded approximately 28% of average earning assets for the period and the percentage of funding from all noninterest-bearing sources totaled 31% for the third quarter of 2008, which was down slightly from the third quarter of 2007. Higher-cost interest-bearing sources, including borrowings, funded 37% of average earning assets in 2008’s third quarter, up from 35% in the year-earlier period.
36

TABLE 9. SUMMARY OF AVERAGE BALANCE SHEETS, NET INT EREST INCOME(TE) (a) , YIELDS AND RATES (dollars in thousands) Third Quarter 2008 Second Quarter 2008 Third Quarter 2007 Average Yield/ Average Yield/ Average Yield/ Balance Interest Rate Balance Interest Rate Balance Interest Rate ASSETS EARNING ASSETS Loans (TE) (b) (c) $ 8,016,903 $ 116,541 5.79 % $ 7,884,193 $ 116,366 5.93 % $ 7,384,032 $ 141,760 7.62 % Mortgage-backed securities 1,421,397 17,380 4.89 1,525,745 18,031 4.73 1,246,234 14,970 4.80 U.S. agency securities 115,922 1,252 4.32 164,576 1,617 3.93 328,917 3,436 4.18 U.S. Treasury securities - - - - - - 24,973 307 4.88 Obligations of states and political subdivisions (TE) 261,419 3,808 5.83 288,098 4,248 5.90 281,615 4,188 5.95 Other securities 54,843 509 3.71 46,978 455 3.88 35,188 547 6.22 Total investment securities 1,853,581 22,949 4.95 2,025,397 24,351 4.81 1,916,927 23,448 4.89 Federal funds sold and short-term investments 21,681 115 2.13 20,093 109 2.18 445,225 5,764 5.14 Total earning assets 9,892,165 $ 139,605 5.62 % 9,929,683 $ 140,826 5.70 % 9,746,184 $ 170,972 6.97 % NONEARNING ASSETS Other assets 1,121,313 1,002,012 964,076 Allowance for loan losses (111,149 ) (92,783 ) (76,586 ) Total assets $ 10,902,329 $ 10,838,912 $ 10,633,674 LIABILITIES AND SHAREHOLDERS' EQUITY INTEREST-BEARING LIABILITIES NOW account deposits $ 1,013,472 $ 1,350 .53 % $ 1,071,995 $ 1,576 .59 % $ 1,000,496 $ 3,034 1.20 % Money market deposits 1,193,546 2,853 .95 1,216,436 2,974 .98 1,238,855 9,411 3.01 Savings deposits 932,454 928 .40 916,893 885 .39 910,828 2,321 1.01 Other time deposits 722,900 5,067 2.79 749,091 6,080 3.27 863,651 8,589 3.95 Time deposits $100,000 and over 1,596,776 9,195 2.29 1,518,683 9,872 2.61 1,780,079 20,443 4.56 Total interest-bearing deposits 5,459,148 19,393 1.41 5,473,098 21,387 1.57 5,793,909 43,798 3.00 Short-term borrowings 1,202,585 5,259 1.74 1,130,748 4,740 1.69 631,189 6,363 4.00 Long-term debt 156,962 2,352 6.00 157,387 2,355 5.99 168,754 2,566 6.08 Total interest-bearing liabilities 6,818,695 $ 27,004 1.58 % 6,761,233 $ 28,482 1.69 % 6,593,852 $ 52,727 3.17 % NONINTEREST-BEARING LIABILITIES AND SHAREHOLDERS' EQUITY Demand deposits 2,771,101 2,747,125 2,686,189 Other liabilities 119,998 117,093 128,693 Shareholders' equity 1,192,535 1,213,461 1,224,940 Total liabilities and shareholders' equity $ 10,902,329 $ 10,838,912 $ 10,633,674 Net interest income and margin (TE) $ 112,601 4.53 % $ 112,344 4.54 % $ 118,245 4.82 % Net earning assets and spread $ 3,073,470 4.04 % $ 3,168,450 4.01 % $ 3,152,332 3.80 % Interest cost of funding earning assets 1.09 % 1.16 % 2.15 % (a) Tax-equivalent (TE) amounts are calculated using a marginal federal income tax rate of 35%. (b) Includes loans held for sale. (c) Balance includes nonaccruing loans of $168,764, $135,515 and $62,598, respectively, in the third and second quarters of 2008 and the third quarter of 2007.
37

TABLE 9. SUMMARY OF AVERAGE BALANCE SHEETS, NET INT EREST INCOME(TE) (a) YIELDS AND RATES (continued)
Nine Months Ended Nine Months Ended (dollars in thousands) September 30, 2008 September 30, 2007 Average Yield/ Average Yield/ Balance Interest Rate Balance Interest Rate ASSETS EARNING ASSETS
Loans (TE) (b) (c) $ 7,867,859 $ 359,119 6.10 % $ 7,299,265 $ 416,829 7.63 % Mortgage-backed securities 1,480,897 53,210 4.79 1,213,479 42,883 4.71 U.S. agency securities 189,822 5,764 4.04 307,280 9,482 4.11 U.S. Treasury securities - - - 24,910 911 4.89 Obligations of states and political subdivisions (TE) 281,603 12,401 5.87 283,492 12,660 5.95 Other securities 45,620 1,468 4.30 36,000 1,607 5.95 Total investment securities 1,997,942 72,843 4.86 1,865,161 67,543 4.83 Federal funds sold and short-term investments 56,276 1,495 3.55 397,579 15,557 5.23 Total earning assets 9,922,077 $ 433,457 5.83 % 9,562,005 $ 499,929 6.99 % NONEARNING ASSETS Other assets 1,021,821 959,546 Allowance for loan losses (97,780 ) (77,865 )
Total assets $ 10,846,118 $ 10,443,686 LIABILITES AND SHAREHOLDERS' EQUITY INTEREST-BEARING LIABILITIES NOW account deposits $ 1,065,852 $ 5,302 .66 % $ 1,035,871 $ 9,143 1.18 % Money market deposits 1,221,660 10,821 1.18 1,219,333 27,110 2.97 Savings deposits 918,024 3,201 .47 929,899 6,806 .98 Other time deposits 754,403 18,540 3.28 821,240 23,234 3.78 Time deposits $100,000 and over 1,593,513 33,325 2.79 1,670,320 56,348 4.51 Total interest-bearing deposits 5,553,452 71,189 1.71 5,676,663 122,641 2.89 Short-term and other borrowings 1,072,588 15,323 1.91 606,161 18,501 4.08 Long-term debt 159,744 7,185 6.00 125,713 5,701 6.05 Total interest-bearing liabilities 6,785,784 $ 93,697 1.84 % 6,408,537 $ 146,843 3.06 % NONINTEREST-BEARING LIABILITIES AND SHAREHOLDERS' EQUITY Demand deposits 2,722,253 2,718,156 Other liabilities 126,179 123,009 Shareholders' equity 1,211,902 1,193,984
Total liabilities and shareholders' equity $ 10,846,118 $ 10,443,686 Net interest income and margin (TE) $ 339,760 4.57 % $ 353,086 4.93 % Net earning assets and spread $ 3,136,293 3.99 % $ 3,153,468 3.93 % Interest cost of funding earning assets 1.26 % 2.06 % (a) Tax-equivalent (TE) amounts are calculated using a marginal federal income tax rate of 35%. (b) Includes loans held for sale. (c) Balance includes nonaccruing loans of $145,259 in 2008 and $56,634 in 2007.

38

TABLE 10. SUMMARY OF CHANGES IN NET INTEREST INCOME (TE) (a) (b) Third Quarter 2008 Compared to: Nine Months Ended September 30, Second Quarter 2008 Third Quarter 2007 2008 Compared to 2007 Due to Total Due to Total Due to Total Change in Increase Change in Increase Change in Increase (dollars in thousands) Volume Yield/Rate (Decrease) Volume Yield/Rate (Decrease) Volume Yield/Rate (Decrease) INTEREST INCOME (TE) Loans (TE) $ 2,422 $ (2,247 ) $ 175 $ 11,110 $ (36,329 ) $ (25,219 ) $ 30,648 $ (88,358 ) $ (57,710 ) Mortgage-backed securities (1,259 ) 608 (651 ) 2,138 272 2,410 9,597 730 10,327 U.S. agency securities (513 ) 148 (365 ) (2,297 ) 113 (2,184 ) (3,569 ) (149 ) (3,718 ) U.S. Treasury securities - - - (153 ) (154 ) (307 ) (455 ) (456 ) (911 ) Obligations of states and political subdivisions (TE) (389 ) (51 ) (440 ) (295 ) (85 ) (380 ) (84 ) (175 ) (259 ) Other securities 74 (20 ) 54 234 (272 ) (38 ) 371 (510 ) (139 ) Total investment securities (2,087 ) 685 (1,402 ) (373 ) (126 ) (499 ) 5,860 (560 ) 5,300 Federal funds sold and short-term investments 9 (3 ) 6 (3,496 ) (2,153 ) (5,649 ) (10,234 ) (3,828 ) (14,062 ) Total interest income (TE) 344 (1,565 ) (1,221 ) 7,241 (38,608 ) (31,367 ) 26,274 (92,746 ) (66,472 ) INTEREST EXPENSE NOW account deposits (78 ) (148 ) (226 ) 38 (1,722 ) (1,684 ) 257 (4,098 ) (3,841 ) Money market deposits (44 ) (77 ) (121 ) (333 ) (6,225 ) (6,558 ) 52 (16,341 ) (16,289 ) Savings deposits 19 24 43 53 (1,446 ) (1,393 ) (86 ) (3,519 ) (3,605 ) Other time deposits (196 ) (817 ) (1,013 ) (1,258 ) (2,264 ) (3,522 ) (1,796 ) (2,898 ) (4,694 ) Time deposits $100,000 and over 520 (1,197 ) (677 ) (1,930 ) (9,318 ) (11,248 ) (2,485 ) (20,538 ) (23,023 ) Total interest-bearing deposits 221 (2,215 ) (1,994 ) (3,430 ) (20,975 ) (24,405 ) (4,058 ) (47,394 ) (51,452 ) Short-term borrowings 346 173 519 3,700 (4,804 ) (1,104 ) 9,759 (12,937 ) (3,178 ) Long-term debt (7 ) 4 (3 ) (178 ) (36 ) (214 ) 1,531 (47 ) 1,484 Total interest expense 560 (2,038 ) (1,478 ) 92 (25,815 ) (25,723 ) 7,232 (60,378 ) (53,146 ) Change in net interest income (TE) $ (216 ) $ 473 $ 257 $ 7,149 $ (12,793 ) $ (5,644 ) $ 19,042 $ (32,368 ) $ (13,326 ) (a) Tax-equivalent (TE) amounts are calculated using a marginal federal income tax rate of 35%. (b) The change in interest shown as due to changes in either volume or rate includes an allocation of the amount that reflects the interaction of volume and rate changes. This allocation is based on the absolute dollar amounts of change due solely to changes in volume or rate.
39

For the first nine months of 2008, net interest income (TE) decreased 4%, or $13.3 million, compared to the same period in 2007. Average earning assets increased 4% between these periods, while the net interest margin compressed by 36 basis points to 4.57% in 2008. Average loans represented 79% of average earning assets for the period, up from 76% for the year-to-date period in 2007, while short-term investments decreased to 1% in 2008 from 4% in 2007. The overall yield on earning assets for the first nine months of 2008 was down 116 basis points from the year-earlier period, and the overall cost of funds decreased 80 basis points between these periods. Noninterest-bearing sources funded 32% of earning assets on average in the first nine months of 2008, compared to 33% in 2007, while the percentage of earning assets funded by total higher-cost sources increased to 36% in 2008 from 34% in 2007. Substantially the same factors that affected the mix of and rates for earning assets and funding sources in the third quarter of 2008 were evident for the year-to-date period. PROVISION FOR CREDIT LOSSES
Whitney provided $40.0 million for credit losses in the third quarter of 2008, compared to $35.0 million in 2008’s second quarter and a $9.0 million provision in the third quarter of 2007. Net loan charge-offs in 2008’s third quarter were $24.5 million or 1.22% of average loans on an annualized basis, compared to $16.9 million in the second quarter of 2008 and $2.4 million in the third quarter of 2007. The allowance for loan losses increased $15.5 million during the current quarter and represented 1.55% of total loans at September 30, 2008, up from 1.38% at the end of 2008’s second quarter and 1.10% a year earlier.
Continuing weaknesses in the residential real estate markets, primarily in Florida and coastal Alabama, accounted for approximately $25 million of the provision and approximately $11 million of the gross charge-offs for the third quarter of 2008, mainly related to loans for residential development. Until sufficient demand returns to these markets to establish a solid floor on real estate prices and stimulate renewed development, management cannot predict when the level of criticized loans will stabilize or retreat and its periodic estimate of inherent losses for this portfolio segment may be volatile. Problem commercial and industrial credits added approximately $5 million to the provision for the third quarter of 2008 and accounted for approximately $10 million charge-offs for the period, substantially all of which had been anticipated in the valuation allowance for impaired loans at June 30, 2008. Management also added approximately $4 million to the allowance and provision based on its regular assessment of current economic conditions and other qualitative factors. The quarterly provision also included approximately $4 million related to charge-offs on consumer and other smaller credits and $1 million associated with changes in the mix of noncriticized credits and historical loss factors.
For a more detailed discussion of changes in the allowance for loan losses, the reserve for losses on unfunded credit commitments, nonperforming assets and general credit quality, see the earlier section entitled “Loans, Credit Risk Management, and Allowance and Reserve for Credit Losses.” The future level of the allowance and reserve and the provisions for credit losses will reflect management’s ongoing evaluation of credit risk, based on established internal policies and practices.
40

NONINTEREST INCOME
Excluding the insurance settlement gain in the third quarter of 2007 that was noted earlier, noninterest income increased 10%, or $2.3 million, from the year-earlier period to a total of $25.5 million in 2008’s third quarter.
Deposit service charge income in the third quarter of 2008 was up 5%, or $.4 million in total, aided mainly by reduced earnings credits allowed on certain commercial deposit accounts. Service charges include periodic account maintenance fees, for both business and personal customers, charges for specific transactions or services, such as processing return items or wire transfers, and other revenue associated with deposit accounts, such as commissions on check sales.
Bank card fees, both credit and debit cards, increased a combined 2%, or $.1 million, compared to the third quarter of 2007. Trust service fees were down slightly and fee income from Whitney’s secondary mortgage market operations decreased 18% under difficult financial and housing market conditions. The categories comprising other noninterest income, excluding the insurance settlement gain, increased a combined $2.1 million compared to the third quarter of 2007, with positive contributions from most recurring revenue sources, including $1.6 million of earnings on the $150 million used to purchase life insurance policies under a program implemented in late May 2008.
Noninterest income decreased 3%, or $.7 million, compared to 2008’s second quarter. There were small declines in most recurring revenue sources, other than from the life insurance program, most of which can be at least partly attributed to recent financial and credit market conditions and overall economic conditions. Net gains on sales and other revenue from grandfathered assets carried at a nominal value were down $.3 million from the $.6 million total recognized in the second quarter of 2008.
Noninterest income for the first nine months of 2008 was 12%, or $8.8 million, higher than in the comparable period of 2007, again excluding the insurance settlement gain. Year-to-date changes in individual income categories from the prior year were for the most part consistent with the quarterly changes discussed above and were driven by substantially the same factors. Net gains and other revenue from grandfathered property interests totaled $3.6 million for the first nine months of 2008, compared with $3.8 million from same period in 2007. NONINTEREST EXPENSE
Noninterest expense increased 1%, or $1.3 million, to a total of $89.5 million in the third quarter of 2008 compared to 2007’s third quarter. The current year’s period included $2.1 million for uninsured casualty losses and expenses arising from two hurricanes that struck parts of the Company’s market area in September.
Whitney’s personnel expense decreased 2%, or $1.0 million, between these periods, with employee compensation down 3%, or $1.1 million, and the cost of employee benefits up slightly. The compensation added for normal salary adjustments was more than offset by a decrease in the compensation associated with management incentive programs, largely as a result of tightened performance criteria coupled with the current difficult operating environment, and by the favorable impact of a 3% reduction in the average full-time equivalent staff level between these periods.
The major components of employee benefits expense, in addition to payroll taxes, are the cost of providing health benefits for active and retired employees and the cost of providing pension benefits through both the defined-benefit plans and a 401(k) employee savings plan. As
41
described more fully in Note 10 to the consolidated financial statements, subsequent to September 30, 2008, Whitney amended its qualified defined-benefit plan to limit future eligibility and freeze benefit accruals for certain current participants. At the same time, the employee savings plan was amended to authorize the Company to make discretionary profit sharing contributions, beginning in 2009, on behalf of participants in the savings plan who are ineligible to participate in the qualified defined-benefit plan or subject to the freeze in benefit accruals. No overall reduction in retirement benefit expense is anticipated for 2009 as a direct result of the amendments to these plans. The Company does anticipate recognizing a curtailment gain before the end of 2008 as a result of the qualified defined-benefit plan amendments, but the amount of the gain is still being determined.
The performance of the pension trust fund through the end of the third quarter of 2008 was substantially below the long-term expected rate of return, reflecting conditions in the equity and corporate debt markets. This level of fund performance, if it persists through the end of 2008, will lead to an increase in the actuarially-determined periodic expense for the defined-benefit pension plan in 2009, holding other variables constant. It could also result in an increase in the recorded liability for unfunded accumulated pension benefits and a corresponding charge to other comprehensive income as of year-end 2008.
Net occupancy expense increased 6%, or $.5 million, compared to the third quarter of 2007. Increased expenses related to de novo branch expansion, higher energy costs and nonrecurring or periodic facility repairs were partly offset by a reduction in the cost of insurance. Equipment and data processing expense increased 6%, or $.3 million, driven in part by the cost of new customer-oriented applications associated with strategic initiatives and by branch expansion. The $.3 million reduction in telecommunications and postage expense mainly reflected the elimination of some redundant communication services used during an upgrade project in 2007. Legal and other professional fees and other noninterest expense were impacted by higher costs associated with problem loan collection efforts. Other noninterest expense in the third quarter of 2008 also included the $2.1 million storm-related item mentioned earlier and increased deposit insurance expense with the change to the new assessment system in 2008.
Excluding storm-related items, noninterest expense for 2008’s third quarter was up 2%, or $1.9 million, compared to the second quarter of 2008. Personnel expense increased $.9 million, although this was mainly related to a reduction in share-based compensation in the second quarter of 2008 that resulted from a periodic reassessment of multi-year performance estimates. Net occupancy expense was up $.7 million on nonrecurring repair costs and seasonal increases in energy costs. Increased loan collection efforts impacted both legal and other professional services and the other noninterest expense categories. Deposit insurance expense increased $.6 million, to $1.3 million in the third quarter of 2008, after the one-time credit granted in connection with the new assessment system was fully utilized in the second quarter of 2008.
Recent bank failures and economic conditions have put pressure on deposit insurance reserve ratios and have led the FDIC to propose increased assessments beginning in 2009. Based on information as of September 30, 2008, the proposed assessments would approximately double the quarterly expense level from the amount recognized in the third quarter of 2008. The FDIC will update its reserve ratio projections before the proposed assessments become final and may adopt higher rates than those proposed. On October 3, 2008, the FDIC temporarily increased
42

deposit insurance limits for all deposit accounts from $100,000 to $250,000 per depositor through December 31, 2009.
Whitney has also elected to participate in the part of the FDIC’s Temporary Liquidity Guarantee Program that provides for full deposit insurance coverage for noninterest-bearing transaction accounts, regardless of the dollar amount. This program began October 14, 2008 and will end December 31, 2009. The Company will be charged a separate assessment for this expanded coverage that will cost an estimated $.8 million annually based on current deposit levels.
For the nine-month period ended September 30, 2008, noninterest expense was down 2%, or $4.3 million, compared to the same period in 2007. The changes in major noninterest expense categories between these periods were for the most part influenced by the same factors cited in the discussion of quarterly results above. INCOME TAXES
The Company provided for income tax expense at an effective rate of 4.2% in the third quarter of 2008 compared to 34.1% in the third quarter of 2007. Year-to-date, the rate was 27.0% in 2008 and 33.2% in 2007. Because of the reduced level of pre-tax income in 2008, tax-exempt income and tax credits had a more pronounced impact on the effective rate for the current year’s quarterly and year-to-date periods. Interest income from the financing of state and local governments has been the main component of Whitney’s tax-exempt income, although tax-exempt earnings from the bank-owned life insurance program also became a significant factor in 2008. The main source of tax credits has been investments in affordable housing projects and in projects that primarily benefit low-income communities or help the recovery and redevelopment of communities in the Gulf Opportunity Zone. Item 3. QUANTITATIVE AND QUALITATIVE DISCLOSURES ABOUT MARKET RISK
The information required for this item is included in the section entitled “Asset/Liability Management” in “Management’s Discussion and Analysis of Financial Condition and Results of Operations” that appears in Item 2 of this quarterly report on Form 10-Q and is incorporated here by reference. Item 4. CONTROLS AND PROCEDURES
The Company’s management, with the participation of the Chief Executive Officer (CEO) and Chief Financial Officer (CFO), has evaluated the effectiveness of the Company’s disclosure controls and procedures (as defined in Rules 13a-15(e) and 15d-15(e) under the Securities Exchange Act of 1934, as amended) as of the end of the period covered by this quarterly report on Form 10-Q. Based on that evaluation, the CEO and CFO have concluded that the disclosure controls and procedures as of the end of the period covered by this quarterly report are effective.
There were no changes in the Company’s internal control over financial reporting during the fiscal quarter covered by this quarterly report that have materially affected, or are reasonably likely to materially affect, the Company’s internal control over financial reporting.
43

PART II. OTHER INFORMATION Item 1. LEGAL PROCEEDINGS
None Item 1A. RISK FACTORS There has been no material change in the risk factors previously disclosed under Item 1A of Part I of the Company’s annual report on From 10-K for the year ended December 31, 2007, except as set forth below. In addition to the other information contained in or incorporated by reference into this quarterly report on Form 10-Q, these risk factors should be considered carefully in evaluating the Company’s overall risk profile. The risks described herein and in the Company’s annual report on Form 10-K are not the only risks facing the Company. Additional risks not presently known, or that the Company may currently deem to be immaterial, may also adversely affect Whitney’s business, financial condition or operating results. Unusually severe disruptions in the residential real estate market nationwide and in Whitney’s market area may cause continued higher provisions for credit losses and increase the uncertainty inherent in management’s estimate of credit losses as reflected in its financial condition and results of operations. The residential real estate market has been under severe stress in the Florida and coastal Alabama markets served by Whitney and throughout many other areas of the country. The underlying imbalance of supply and demand will likely take some time to resolve and has caused declines in the value of many residential-related properties, including occupied residences, investment properties, homebuilders’ inventories, developed lots and land for future development. These conditions increase the possibility of default on loans made by Whitney that are secured by residential-related properties as well as the probability that the realizable collateral value will not be sufficient to satisfy the debt, resulting in a loss. Whitney’s loans secured by residential-related real estate in Florida and coastal Alabama at September 30, 2008 comprised approximately 9% of the loan portfolio. In addition, the problems in the residential real estate market have direct and indirect negative impacts on the broader economy that may increase the credit risk inherent in Whitney’s loans to customers in these and other parts of Whitney’s market area unrelated to residential real estate. The broader economy, both nationally and internationally, may be entering a potentially long and deep recession that could have an adverse affect on Whitney’s financial condition, results of operations and cash flows. Recessionary conditions in the broader economy could adversely affect the financial capacity of businesses and individuals in Whitney’s market area. This could, among other consequences, increase the credit risk inherent in the current loan portfolio, restrain new loan demand from creditworthy borrowers and prompt Whitney to tighten its underwriting criteria, and reduce the liquidity in Whitney’s customer base and the level of deposits that they maintain.
44

These economic conditions could also delay the correction of the imbalance of supply and demand in certain residential real estate markets as discussed above.
The impact on Whitney’s financial results could include continued high levels of problem credits, provisions for credit losses and expenses associated with loan collection efforts, the need for Whitney to replace deposits with higher-cost sources of funds, and an inability to produce loan growth or overall growth in earning assets. Noninterest income from sources that are dependent on financial transactions and market valuations could also be reduced. Current levels of market volatility are unprecedented. The capital and credit markets have been experiencing extreme volatility and periods of severe disruption that in recent weeks have reached unprecedented levels. Among other factors, these conditions reflect extreme uncertainty on the part of market participants in response to the rapid evolution of the credit crisis among major entities in the financial services industry. In some cases, the markets have pressured stock prices and limited credit availability for certain issuers seemingly without regard to those issuers’ underlying business fundamentals. If current levels of market disruption and volatility continue or worsen, there can be no assurance that Whitney will not experience an adverse effect, which may be material, on our ability to access the capital markets. Item 2. UNREGISTERED SALES OF EQUITY SECURITIES AND USE OF PROCEEDS
The following table provides information with respect to purchases made by or on behalf of the Company or any “affiliated purchaser” (as defined in Rule 10b-18(a)(3) under the Securities Exchange Act of 1934, as amended) of the Company’s common stock during the three months ended September 30, 2008.
Item 3. DEFAULTS UPON SENIOR SECURITIES
None
Period
Total Number of Shares
Purchased
Average Price Paid per Share
Total Number of Shares Purchased as Part of Publicly
Announced Plans or Programs (1)
Maximum Number of Shares that May Yet Be Purchased under the Plans or Programs
(1) July 2008 - - - -
August 2008 - - - - September 2008 306 (2) $26.97 - -
Total 306 $26.97 - -
(1) No repurchase plans were in effect during the third quarter of 2008. (2) Represents shares tendered to the Company as consideration for the exercise price of employee stock options.
45

Item 4. SUBMISSION OF MATTERS TO A VOTE OF SECURITY HOLDERS
None Item 5. OTHER INFORMATION
None Item 6. EXHIBITS
The exhibits listed on the accompanying Exhibit Index, located on page 47, are filed (or furnished, as applicable) as part of this report. The Exhibit Index is incorporated herein by reference in response to this Item 6.
SIGNATURE
Pursuant to the requirements of the Securities Exchange Act of 1934, the registrant has duly caused this report to be signed on its behalf by the undersigned thereunto duly authorized.
WHITNEY HOLDING CORPORA TION (Registrant)
By: /s/ Thomas L. Callicutt, Jr.
Thomas L. Callicutt, Jr. Executive Vice President and Chief Financial Officer (in his capacities as a duly authorized officer of the registrant and as principal accounting officer)
November 10, 2008 Date
46

EXHIBIT INDEX
Exhibit Description
Exhibit 3.1 Copy of the Company’s Composite Charter (filed as Exhibit 3.1 to the Company’s quarterly report on Form 10-Q for the quarter ended September 30, 2000 (Commission file number 0-1026) and incorporated by reference).
Exhibit 3.2 Copy of the Company’s Bylaws (filed as Exhibit 3.01 to the Company’s current report on Form 8-K filed on October 2, 2006 (Commission file number 0-1026) and incorporated by reference).
Exhibit 10.1 Amendment to the Whitney Holding Corporation Amended and Restated 2001 Directors’ Compensation Plan.
Exhibit 31.1 Certification by the Company’s Chief Executive Officer pursuant to Rule 13a-14(a) or Rule 15d-14(a), as adopted pursuant to Section 302 of the Sarbanes-Oxley Act of 2002.
Exhibit 31.2 Certification by the Company’s Chief Financial Officer pursuant to Rule 13a-14(a) or Rule 15d-14(a), as adopted pursuant to Section 302 of the Sarbanes-Oxley Act of 2002.
Exhibit 32 Certification by the Company’s Chief Executive Officer and Chief Financial Officer pursuant to 18 U.S.C. Section 1350, as adopted pursuant to Section 906 of the Sarbanes-Oxley Act of 2002.
47

Exhibit 10.1 AMENDMENT TO THE
WHITNEY HOLDING CORPORATION AMENDED AND RESTATED 2001 DIRECTORS’ COMPENSATION P LAN
This amendment to the Whitney Holding Corporation Amended and Restated 2001 Directors’ Compensation
Plan (the “Plan”) is made and entered into this 23rd day of July 2008 by Whitney Holding Corporation (the “Company”).
Pursuant to a resolution of the Board of Directors of the Company, in accordance with Section 14.2 of the Plan, the Plan is hereby amended as follows:
“5.2 Number of Shares. The number of shares of Common Stock transferred by the Company to each Eligible Director for receipt or deferral hereunder as of each Stock Transfer Date shall be the number of whole shares of Common Stock equal to A divided by B, where:
A = the dollar value of $30,000; and B = the Fair Market Value per share of Common Stock on the Stock Transfer Date.
In determining the number of shares of Common Stock, any fraction of a share will be rounded up to the next whole number of shares. The amount of Common Stock shall be subject to adjustment, from time to time, as provided in Section 3.4 hereof.”
“6.2 Grant of Options. Effective as of August 1, 2008, the Plan is amended to eliminate automatic annual grants of Options to Eligible Directors.”
* * * * * * * * *
This amendment shall be construed in all respects in accordance with, and governed by, the laws of the State of
Louisiana. Except as specifically set forth herein, the terms of the Plan shall remain in full force and effect as prior to this Amendment.
IN WITNESS WHEREOF, the Company has caused this Amendment to be executed by its duly authorized officer as of the date first above written.
1. By deleting Section 5.2 in its entirety and replacing it with the following:
2. By deleting Section 6.2 in its entirety and replacing it with the following:
WHITNEY HOLDING CORPORATION By: ___________________________ Name: John C. Hope, III Title: Chairman of the Board & Chief Executive Officer

Exhibit 31.1
CERTIFICATION
I, John C. Hope, III, certify that:
1. I have reviewed this quarterly report on Form 10-Q for the period ended September 30, 2008 of Whitney Holding Corporation;
2. Based on my knowledge, this report does not contain any untrue statement of a material fact or omit to state a material fact necessary to make the statements made, in light of the circumstances under which such statements were made, not misleading with respect to the period covered by this report;
3. Based on my knowledge, the financial statements, and other financial information included in this report, fairly present in all material respects the financial condition, results of operations and cash flows of the registrant as of, and for, the periods presented in this report;
4. The registrant’s other certifying officer and I are responsible for establishing and maintaining disclosure controls and procedures (as defined in Exchange Act Rules 13a-15(e) and 15d-15(e)) and internal control over financial reporting (as defined in Exchange Act Rules 13a-15(f) and 15d-15(f)) for the registrant and have:
(a) designed such disclosure controls and procedures, or caused such disclosure controls and procedures to be designed under our supervision, to ensure that material information relating to the registrant, including its consolidated subsidiaries, is made known to us by others within those entities, particularly during the period in which this report is being prepared;
(b) designed such internal control over financial reporting, or caused such internal control over financial reporting to be designed under our supervision, to provide reasonable assurance regarding the reliability of financial reporting and the preparation of financial statements for external purposes in accordance with generally accepted accounting principles;
(c) evaluated the effectiveness of the registrant’s disclosure controls and procedures and presented in this report our conclusions about the effectiveness of the disclosure controls and procedures, as of the end of the period covered by this report based on such evaluation; and
(d) disclosed in this report any change in the registrant’s internal control over financial reporting that occurred during the registrant’s most recent fiscal quarter that has materially affected, or is reasonably likely to materially affect, the registrant’s internal control over financial reporting; and 5. The registrant’s other certifying officer and I have disclosed, based on our most recent evaluation of internal
control over financial reporting, to the registrant’s auditors and the audit committee of the registrant’s board of directors (or persons performing the equivalent functions):
(a) all significant deficiencies and material weaknesses in the design or operation of internal control over financial reporting which are reasonably likely to adversely affect the registrant’s ability to record, process, summarize and report financial information; and
(b) any fraud, whether or not material, that involves management or other employees who have a significant role in the registrant’s internal control over financial reporting.
/s/ John C. Hope, III John C. Hope, III Chief Executive Officer Date: November 10, 2008

Exhibit 31.2 CERTIFICATION
I, Thomas L. Callicutt, Jr., certify that:
1. I have reviewed this quarterly report on Form 10-Q for the period ended September 30, 2008 of Whitney
Holding Corporation; 2. Based on my knowledge, this report does not contain any untrue statement of a material fact or omit to state a
material fact necessary to make the statements made, in light of the circumstances under which such statements were made, not misleading with respect to the period covered by this report;
3. Based on my knowledge, the financial statements, and other financial information included in this report, fairly present in all material respects the financial condition, results of operations and cash flows of the registrant as of, and for, the periods presented in this report;
4. The registrant’s other certifying officer and I are responsible for establishing and maintaining disclosure controls and procedures (as defined in Exchange Act Rules 13a-15(e) and 15d-15(e)) and internal control over financial reporting (as defined in Exchange Act Rules 13a-15(f) and 15d-15(f)) for the registrant and have:
(a) designed such disclosure controls and procedures, or caused such disclosure controls and procedures to be designed under our supervision, to ensure that material information relating to the registrant, including its consolidated subsidiaries, is made known to us by others within those entities, particularly during the period in which this report is being prepared;
(b) designed such internal control over financial reporting, or caused such internal control over financial reporting to be designed under our supervision, to provide reasonable assurance regarding the reliability of financial reporting and the preparation of financial statements for external purposes in accordance with generally accepted accounting principles;
(c) evaluated the effectiveness of the registrant’s disclosure controls and procedures and presented in this report our conclusions about the effectiveness of the disclosure controls and procedures, as of the end of the period covered by this report based on such evaluation; and
(d) disclosed in this report any change in the registrant’s internal control over financial reporting that occurred during the registrant’s most recent fiscal quarter that has materially affected, or is reasonably likely to materially affect, the registrant’s internal control over financial reporting; and 5. The registrant’s other certifying officer and I have disclosed, based on our most recent evaluation of internal
control over financial reporting, to the registrant’s auditors and the audit committee of the registrant’s board of directors (or persons performing the equivalent functions):
(a) all significant deficiencies and material weaknesses in the design or operation of internal control over financial reporting which are reasonably likely to adversely affect the registrant’s ability to record, process, summarize and report financial information; and
(b) any fraud, whether or not material, that involves management or other employees who have a significant role in the registrant’s internal control over financial reporting.
/s/ Thomas L. Callicutt, Jr. Thomas L. Callicutt, Jr. Chief Financial Officer Date: November 10, 2008

Exhibit 32
CERTIFICATION PURSUANT TO 18 U.S.C SECTION 1350, AS ADOPTED PURSUANT TO SECTION 906 OF THE SARBANES-OXLEY ACT OF 2002
Each of the undersigned officers of Whitney Holding Corporation (the Company), in the capacities and on the
dates indicated below, hereby certify pursuant to Section 906 of the Sarbanes-Oxley Act of 2002, based on their knowledge, that:
(1) the Company’s Quarterly Report on Form 10-Q for the period ended September 30, 2008 (the Report) fully complies with the requirements of Section 13(a) or 15(d) of the Securities Exchange Act of 1934, as amended; and
(2) the information contained in the Report fairly presents, in all material respects, the financial condition and results of operations of the Company.
Dated: November 10, 2008 By: /s/ John C. Hope, III John C. Hope, III Chairman of the Board and Chief Executive Officer Dated: November 10, 2008 By: /s/ Thomas L. Callicutt, Jr. Thomas L. Callicutt, Jr. Executive Vice President and Chief Financial Officer