white/ethnic minority earnings and employment …...this method assigns to the kth characteristic a...
TRANSCRIPT

1
White/Ethnic Minority Earnings and Employment Differentialsin Britain : Evidence from the LFS
D.H. Blackaby*D.G. Leslie**P.D. Murphy*N.C. O'Leary*
Revised December 2000
Abstract
It is twenty years since Britain passed legislation to combat racial discrimination. Despite this,evidence presented in this paper suggests that Britain’s non-white ethnic minorities still do notappear to face a level playing field in the UK labour market and their relative position does notappear to have improved since the 1970s. Native ethnic minorities also appear to be faring littlebetter than their parents. It is in gaining employment that the situation is particularly acute.
Keywords : Discrimination; Earnings; UnemploymentJEL classification : J71
* Economics Department ** Economics DepartmentUniversity of Wales Swansea Manchester Metropolitan UniversitySwansea ManchesterSA2 8PP M15 6BGUK UK
Acknowledgements
We are grateful to those taking part at the April 1998 European Science Foundation Conferenceon Migration and Development, Espinho, Portugal and to Stephen Wheatley Price for commentson an earlier copy of this paper. Helpful suggestions and comments have also been receivedfrom referees. All remaining errors are naturally our own. Material from the QLFS is CrownCopyright : has been made available by the Office for National Statistics in the UK through TheData Archive and has been used by permission. Neither the ONS nor the Data Archive bear anyresponsibility for the analysis or interpretation of the data reported here.
2
I Introduction
In 1998 6.3 percent of the population of working age identified themselves as members of an
ethnic minority. This group represents a growing fraction of the workforce, according to the
1971 Census of Population the figure was approximately 2 percent, yet research on the labour
market experience of this group is relatively limited. Research into racial labour market
discrimination in the UK falls into two groups: that which has tended to be largely descriptive
of which the four Policy Studies Institute surveys (Daniel 1968, Smith 1977, Brown 1984 and
Modood et al 1997) are important contributors, and that which has used econometric techniques
in an attempt to directly measure labour market discrimination . Most of this latter research has
analysed racial wage differentials (see for example, Chiswick 1980, Stewart 1983, Dex 1986,
McNabb and Pascharopoulos 1981, and McCormick 1986). More recent research, however, has
attempted to measure both wage and employment discrimination and Blackaby, Clark, Leslie and
Murphy (BCLM 1994) using data pooled over two economic cycles in the 1970s and 1980s find
that insufficient employment opportunities appeared to be more of a problem than earnings
disadvantage. The ethnic wage gap increased from 7.3 percent in the 1970s to 12.1 percent in
the 1980s, whilst the unemployment differential grew from 2.6 percentage points to 10.9
percentage points.
A number of problems exist with the earlier econometric work analysing racial
discrimination, which the current paper seeks to address. Britain’s ethnic minority is a highly
diverse group, distinguished by a number of cultural differences such as nationality, language and
religion. Previous studies, because of small sample sizes, have tended to focus on ethnic
minorities as a broad aggregate.

3
Secondly, studies attempting to measure discrimination have not always drawn a
distinction between domestic schooling and experience and foreign schooling and experience.
This has probably led to an over-estimation of the degree of labour market discrimination.
Thirdly, previous work has analysed nominal rather than real wage differentials. The fact
that a higher proportion of the ethnic minorities live in the relatively prosperous South-East of
the country, where the cost of living is generally higher, means that an analysis of nominal wage
differentials may under estimate the degree of labour market discrimination.
Finally, the paper analyses the labour market experiences of members of the ethnic
minority population who were born in the UK. One explanation for the lower earnings and
higher unemployment experienced by Britain's ethnic minorities relative to whites is that they
may be less familiar with customs and institutions which may disadvantage them in the labour
market. It follows that as the proportion born in the UK increases, so their labour market position
should improve.
This suggests an inter-generation model with immigrants and their children facing different
advantages and disadvantages within the labour market. Although immigrants may have been
faced with disadvantages in the labour market as a result of discrimination, poor command of the
language, cultural isolation and overseas schooling, they may also have possessed a number of
advantages. Studies have consistently shown that immigrants are more highly motivated and are
of higher relative ability.1 Also, compared with the second generation, the majority of
immigrants arrived in this country when the demand for labour was relatively high. Second
1 See for example Kain and Persky (1967), Chiswick (1978) and Carliner (1980) and for a recent survey
Borjas (1994).
4
generation ethnic minorities, however, being more integrated culturally within society, may have
benefitted from domestic schooling and from government anti-discrimination legislation.
Disadvantages relative to their parents may be faced by this group, in that they will have
regressed towards the mean in terms of ability and motivation. They may also not have derived
the full benefits of a domestic education in that they are more likely than whites to be found in
run-down areas where school facilities are poorest i.e. inner city education priority areas.
II Methodology
As is conventional in research on wage discrimination, a human capital approach is adopted and
separate earnings functions are estimated for each ethnic group. Given that the wage structure
is likely to be influenced by factors affecting whether individuals are working, a 'Heckman
correction' is undertaken to control for selectivity bias. Blinder (1973) and Oaxaca (1973)
initially set out the methodology by which earnings equations could be used to determine how
much of any wage differential is due to characteristic differences and how much is due to
coefficient differences. The latter difference is often attributed to discrimination. Subsequent
research has attempted to relate the empirical measure of discrimination more closely to that
proposed in the theoretical literature of Becker (1957) and Arrow (1972). The approach adopted
by Neumark (1988) and Oaxaca and Ransom (1994) is an attempt to estimate the competitive
wage structure that would exist in the absence of discrimination and use these as weights in the
decomposition of the wage gap. This approach leads to an unique solution and so avoids the
index number problem associated with the methodology of Blinder and Oaxaca as well as

5
relating the empirical measure of discrimination more closely to that proposed in the theoretical
literature.2
More formally the wage offer gap can be decomposed as:
)]-(x-)-(x[+)]x-x([=)c-c(-E-E*ee*wwew*eewwew βββββλλ ˆˆˆˆˆlnln (1)
where E is real hourly earnings, e and w refer to ethnic minorities and whites respectively, x is
a row vector of characteristics, β is a vector of estimated coefficients, λ is the inverse Mills
ratio which controls for selectivity into employment and c its coefficient, and a bar signifies
a mean value. β* is an estimate of the non-discriminatory wage structure and is derived by using
the cross product matrices as weights from the earnings equation such that
βββ ˆˆˆ ew* )-(1+= ΩΩ (2)
where xx )xx +xx(= ww-1eeww ′′′Ω is the Oaxaca-Ransom weighting matrix.
2 Alternative approaches to the index number problem include Cotton (1988) who proposed a weighting
matrix based on employment shares and Reimers (1983), who suggested decomposing at the midpoint of thecoefficient and characteristics from the black and white equations.
The first term on the right-hand side of equation (1) represents the difference in wage
offers that is attributed to worker endowments of earnings related characteristics, proxying for
productivity. The second term represents that part of the wage offer differential due to
6
differences in returns to these endowments usually ascribed to discrimination. Since the model
is linear and the least squares regression line goes through the sample means of the data, the
characteristic component can be further decomposed into its individual components. For
example, how much of the wage offer gap is due to differences in years of schooling. The
coefficient component cannot be further divided in this way as such individual decompositions
are arbitrary, being influenced by transformations of the data and choice of omitted categories
when using dummy variables (see Jones, 1983).
In order to examine the employment of different ethnic groups and to estimate selection
effects in the earnings equations, employment probits are first estimated. Using the same
methodology to decompose the earnings function, it is possible to decompose the employment
probits into an explained characteristic effect and an unexplained coefficient effect.3
Formally, the employment difference can be decomposed as follows:
)]x(P-)x(P[-)]x(P-)x(P[+)]x(P-)x(P[ = I-I e*eew*wwe*w*ew αααααα ˆˆˆˆˆˆˆˆ (3)
where Iwˆ and I
eˆ are the respective averages of the predicted employment probabilities for whites
and the comparison ethnic group, α* is the estimated non-discriminatory employment structure
and )x(P wwα is the average across the sample of the predicted probabilities when using the
white groups coefficients and characteristics and so on. The first term in square brackets
represents the portion of the difference in mean employment probabilities due to differences in
3 The specification of the employment equations used in the decomposition analysis follow the form
suggested by Nickell (1980). Although Nickell does not formally set out a structural model of the employmentdecision in this paper, nonetheless the specification adopted can be interpreted as a reduced form that wouldnormally be expected to arise from such a model.
7
the characteristics that are included to predict employment. The remaining terms represent the
difference arising from the size of estimated coefficients associated with these characteristics.
Due to the non-linear property of a probit equation, it is not possible to unpack the
contribution of individual characteristics by simply multiplying coefficients by the difference in
characteristics, across ethnic groups, as was the case with the earnings function. However, Even
and Macpherson (1993), propose a linear decomposition of the probit model. The contribution
of any individual characteristic, k, explaining differences in employment across ethnic groups is
given by:
ααααˆˆˆˆ *ew
*kekwk*e*w
)x-x()x-x()]x(P-)x(P[ (4)
This method assigns to the kth characteristic a portion of the explained difference in
employment equal to that characteristic’s share of the overall difference in expected employment
propensities between white and ethnic minority workers, as estimated at the means of the data
and the non-discriminatory employment structure, α* .
III The Data
The data used are taken from the Office for National Statistics Labour Force Survey (LFS). It
is a survey of households living at private addresses in the UK. In 1992 the survey was
undertaken on a quarterly basis and the introduction of a question on earnings significantly
enhanced its usefulness. In this paper fourteen quarters of the LFS, 1993Q3 to 1996Q4, are used
8
to analyse the relative labour market performance of ethnic minorities in Britain.4 Each
observation refers to a different individual.
The sample means for the micro data used in the subequent analysis are presented in
Table 1. The sample of those in employment is restricted to males who did not work in
agriculture, forestry or fishing.5 The self-employed are also excluded because there is no earning
information for this group. The final column presents information for those ethnic minorities
born in the UK. These native ethnic minorities are on average much younger than whites and so
in columns nine and ten data are presented for an adjusted random sample of native whites with
the same age structure as the native ethnic minorities.
The Table reveals a wide diversity in employment rates across ethnic groups. The black
and Pakistani groups experience substantially lower employment rates than other groups, at 62.7
and 63.8 percent respectively. The white group has the highest employment rate (80.5 percent),
which is marginally higher than the Indian group (78.2 percent). Native ethnic minorities are
also found to be twice as likely to be not working than a comparable sample of whites with a
similar age structure.
Not only is the employment rate of ethnic minority groups lower than whites, but their
earnings are also lower. White hourly earnings (in 1997 prices) over the period 1993 to 1996 are
4 The survey samples approximately 60,000 households every quarter and is significantly larger than the
General Household Survey which samples approximately 10,000 households annually and has been used in themajority of the earlier studies analysing racial discrimination in Britain.
5 Obviously it would have been of interest to have analysed female differentials, but the relatively lowparticipation rates for a number of ethnic groups results in very small samples. Blackaby, Drinkwater, Leslie andMurphy (1997), however, do analyse gender white/ethnic minority unemployment differentials using the much larger1991 Population Census. Unfortunately, however, this data set does not contain information on earnings.
9
£9.08 which is substantially higher than that found for Pakistanis (£7.00) and blacks (£7.89).6
Indians, as in the case of employment, do better than other ethnic groups, but at £8.23 per hour
earnings are still significantly below those of whites. For native whites and native ethnic
minorities hourly earnings are similar, with only a 9 pence advantage in favour of whites.
It is important, however, to compare like with like. Table 1 shows that ethnic groups are
overly represented in the South-East and London where the cost-of-living is considerably higher.
For example, 34 percent of the black sample live in Inner London, whilst for the white sample
it is only 3 percent. Of the Indian sample 31 per cent live in Outer London, whilst for whites it
is only 6 percent.7 To make equivalent comparisons, hourly earnings need to be adjusted by a
regional cost of living index. Official estimates of the differences in living costs across regions
are unavailable in the UK. We have used, therefore, data published by Regional Reward Surveys
Ltd. (1997). By sampling prices in approximately 100 British towns, this organization estimates
the change of income required to hold constant the standard of living of individuals when moving
across regions. Table 1 shows that using this variable to deflate hourly earnings substantially
increases the size of white/ethnic group wage differentials. For example, failure to control for
cost-of-living differences would suggest a negligible earning difference (9 pence) between whites
and ethnic minorities born in the UK, whilst the real hourly earnings differential is relatively
large at 57 pence or 8 percent.8 The biggest increase in the differential is found between whites
6 We have followed the recommendation of Laux and Marshall (1994) and defined hourly earnings as
actual gross weekly earnings divided by total usual paid hours per week worked for the reasons given in theirpaper.
7 The settlement patterns of the ethnic minority population reflect the state of the labour market at the timeof their arrival. Ethnic minorities are under-represented in the Celtic fringe (defined here as Wales, Scotland, theSouth West and the North) where unemployment rates have traditionally been high and overly represented in theSouth-East where unemployment rates have been lower and earnings higher.
8 The deflator is the deviation of the region from the national cost of living index.

10
and blacks (hourly earnings differential increases from £1.19 to £1.83), as blacks have the highest
proportion of employees living in the London area.
One possible reason why ethnic minorities experience lower employment and earnings
may be that they have fewer years of schooling and few qualifications. The Table reveals,
however, that whites, whether employed or out of work, have fewer years of formal schooling
than any other ethnic minority group. The labour market return to schooling, however, may be
lower if it is gained abroad.9 For blacks, approximately half of all formal schooling was gained
abroad, whilst for Indians and Pakistanis the majority of their education was gained in a foreign
country. In the case of qualifications, the percentage of those with degrees, (for those in
employment), is similar for whites, blacks and Pakistanis, but higher for Indians. However,
given that those out of work are significantly less likely to hold degrees and that blacks and
Pakistanis are overly represented in this group, a lower proportion of the black and Pakistani
populations have degrees. When it comes to having no qualifications the Pakistanis are found
to be overly represented in this group.
9 The LFS does not report the number of years educated in the UK and those gained abroad. The total
number of years spent in school is calculated as age left full time education minus 5. To gain estimates of the totalyears spent in education in the UK and those spent abroad for immigrants, we utilise information given on their yearof arrival into the UK, total years spent in education and their current age.
In the case of native whites and native ethnic minorities, the Table reveals that, for both
those in work and those out of work, that native ethnic minorities have spent more years in
school and have higher qualifications. This is consistent with the evidence of Gillborn and Gipps
(1996), Modood et al (1997) and Leslie and Drinkwater (1998), who all find that participation
in higher education is greater for all major ethnic groups than it is for whites. A number of
11
factors may explain this finding, such as the motivational drive for betterment that migrants tend
to have for themselves and their families. The higher levels of unemployment found amongst
ethnic minorities is also likely to be an important factor in raising their demand for education.
The longer time spent in school is reflected in native ethnic minorities having a slightly higher
proportion with degrees and A-levels. However, the Higher Educational Statistics Agency
(HESA 1996) reported that generally ethnic minorities have lower A-level grades and lower class
degrees from less prestigious universities. Modood et al (1997), Berthand (1999) and Drew
(1995) also find that ethnic minorities are more likely to resit their exams and take longer to
achieve a given qualification. This may be explained by them beginning school at a later age,
being held back in classes due to poor English, or simply because they attended inferior schools.
The skill profiles of ethnic groups have also led them to seek employment in particular
industries. Ballard (1996) has shown, for example, that Pakistanis were attracted to the textile
industry. The early Caribbean immigrants, however, were overly represented in transport, where
relatively low wages at a time of relatively high employment made the industry unattractive to
whites (see Brooks 1981). Table 1 reveals that all minority ethnic groups are overly represented
in 'distribution, hotels and catering' and blacks and Indians in 'other manufacturing' which
includes textiles.
Diversity is also revealed in the propensity to marry and divorce and obviously cultural
and religious beliefs play an important role here. Traditionally, Asians marry at an earlier age.
Whilst under specific situations divorce is permitted under Islamic law and within Hindu and
Sikh culture, it is clearly discouraged (see Berrington 1996). These influences are clearly
reflected in the data on family formation presented in Table 1. Indians and Pakistanis have

12
higher marriage and lower divorce rates and larger families than whites whilst the reverse is the
case for blacks.
Ethnic minority groups are also more likely to work part-time and have shorter job
tenure.10 Both of these are factors that are likely to lead to relatively lower earnings, although
Indians again appear to be an exception in these two respects. It is unlikely that the higher
propensity to work part-time arises from choice or tradition, but is rather a function of the more
restricted job opportunities. For example, Modood et al (1997) finds that for women, where part-
time employment may be chosen to fit in with family responsibilities, part-time work is much
lower amongst minority ethnic groups than whites.
10 Shorter tenure may also reflect disrupted labour market experience. As the work experience variable
is measured as age minus age left school, such disruptions will not be picked up.
Diversity is also revealed in the level of public sector attachment across ethnic groups.
Twenty four percent of whites are found to work in the public sector whilst the figure for blacks
is substantially higher at 37 percent. However, Indians and Pakistanis are less likely to be
working in the public sector than whites. A similar pattern is also revealed in the case of union
membership. For whites 40 percent are union members, whilst for blacks, Indians and Pakistanis
the figures are 48, 39 and 34 percent respectively. Hirsch and Addison (1986) report that the
majority of studies find that ethnic minorities are more likely to be union members or vote for
union recognition, which may arise from the perception that unions attempt to reduce labour
market discrimination. Indeed the union/non-union markup is generally found to be larger for
ethnic minorities than for whites. When it comes to plant-size, Pakistanis are found to work in
larger plants than whites, whilst the opposite is the case for Indians. Table 1, therefore, reveals
13
wide diversity across ethnic groups in the characteristics which have been found to be important
in predicting both the probability of employment and the level of earnings.
IV Employment
Probit equations of employment for whites and the major ethnic minority groups shown in Table1
found are presented in Table 2.11 A number of personal characteristics are found to be important
in predicting employment. For whites, having controlled for qualifications, time spent in
education, whether it is gained in the UK or abroad, significantly increases the probability of
employment. The effects of schooling, having controlled for qualifications, are weaker for
minority ethnic groups. Whilst all of the coefficients except one are positive, none are significant
at the 5 percent level. The presence of qualifications, however, is found to be significant in
increasing the probability of employment for all groups.
The probability of being in work is also clearly related to an individuals age, being
lower for the young and old. Marital status is also found to be an important predictor of
employment. Being single, widowed or divorced significantly increases the probability of
whites and Indians being out of work, though for Pakistanis being single and for blacks being
widowed or divorced is not found to be important in predicting employment. The presence of
three or more children also increases the probability of being out of work for whites. This is
usually attributed to the work disincentive effects induced by the benefit system that links benefit
entitlement to family size, though this effect is not found to be present for the minority ethnic
groups. As in other studies (see Nickell 1980 and Hughes and McCormick 1987), housing tenure
11 A likelihood ratio test rejects the null hypothesis of parameter equally across equations. The pooling
of whites with all ethnic groups is rejected 269[55] = )39(2χ . The pooling of all ethnic minorities is rejected
119[55] = )39(2χ as is the pooling of native whites with native ethnic minorities 151[50] = )35(2χ .

14
is found to be important in predicting whether an individual is out of work. For all groups, living
in a council house or privately renting accommodation significantly increases the probability of
not working. The only other variable found to be as significant is an assessment made by the
individual of their health. Those in bad health are universally less likely to be in employment.
Table 2 indicates substantial regional diversity in the probability of employment across
ethnic groups. As shown by Bradley and Taylor (1994), the well established North/South divide
in unemployment practically disappeared in the 1990-1992 recession and has only slowly begun
to reappear. For whites, after controlling for characteristics, only Inner London and the North
West have lower probabilities of employment than individuals living in the Celtic Fringe and
these are relatively small. For the minority ethnic groups, the reverse is generally the case, as the
probability of being in employment is higher in the Celtic Fringe. The higher probability of
employment amongst ethnic minorities in the Celtic Fringe may arise because those who moved
to these areas may have had employment to go to. They will also be moving to a region where
the ethnic minority population is small and are likely to be living outside of an ethnic community.
To do this they are unlikely to have English language problems which Modood et al (1997) have
shown increases the probability of unemployment. In addition, recent immigrants, who have a
higher probability of unemployment, are found to be attracted to those areas and communities
which have a strong ethnic presence. As shown in Table 1, ethnic minority populations are
overly concentrated in the Greater London area and the Metropolitan Counties in the North and
Midlands, with more than half living in Greater London and the South-East. An increasing

15
concentration in the larger cities and inner urban areas may be important in explaining the lower
rates of employment experienced by ethnic minority groups.12
12 Obviously standard regions are a less than ideal geographical unit of measurement to analyse labour
markets. Much important information is obviously lost in this degree of aggregation. However, the included housingtenure may also act as a proxy for local market conditions.
For whites, being an immigrant who arrived after 1970 is associated with a significantly lower
probability of employment. For the ethnic minority groups no clear picture emerges - the
majority of the year of arrival dummies are not significant.
When comparing a sample of ethnic minorities born in the UK with a sample of native
whites with a similar age structure, a number of differences and similarities arise. First, having
controlled for qualifications, the length of time spent in education for native ethnic minorities is
negatively associated with employment, while the reverse is true for whites. If schooling
provides characteristics other than qualifications which are valued in the labour market then a
positive relationship between time spent in education and the probability of employment would
be expected. If, however, qualifications are used primarily in the labour market as a screening
device for worker quality, then taking a longer time to get a given qualification one would expect
to be negatively associated with employment. Thus, this variable may be proxying other aspects
of worker quality. Earlier it was noted that individuals from the ethnic minority populations
generally take longer to obtain a given qualification. The effect of qualifications (having
controlled for years of schooling) in reducing the probability of being out of work is stronger for
this group than for whites. This result shows the importance of qualifications rather than years
of schooling in enabling ethnic minorities to gain employment. However, Connor et al (1996)
16
find evidence that native ethnic minority graduates are discriminated against by employers and
this results in lower levels of employment. There is, however, much less divergence in
employment probabilities for a number of the other variables included within the analysis, such
as marital status and general health.
Given the relatively small sample of ethnic minorities born in the UK, separate equations
for each individual ethnic group have not been estimated. However, to shed light on whether
ethnic differences exist, separate ethnic intercept dummies are introduced into the employment
probit estimated on a sample of native whites and ethnic minorities. This reveals that blacks,
Indians and Pakistanis are still significantly more likely to be out of work. Relative to a baseline
white, being Indian decreases an individuals employment probability by 10 percentage points,
being black decreases it by 12 percentage points and being Pakistani decreases it by 24
percentage points.
V Employment Decompositions
Taken together Tables 1 and 2 show that both characteristics and the coefficients associated with
these characteristics vary across ethnic groups. To examine the importance of characteristics and
coefficients differences in explaining employment differences across ethnic groups, Table 3
presents the results of probit decompositions using the methodology described in Section II.
Column 1 reveals that the employment rate for ethnic minorities is 11 percentage points lower
than that for whites. Half of this difference is explained by differences in characteristics across
the two groups. The characteristic difference found to be most important is immigrant status.
The fact that across the sample immigrants are much more likely to be out of work and that the
ethnic minorities are much more likely to be immigrants explains 30 percent of the difference in
employment rates. The housing tenure variable is also found to be important in explaining the
17
employment difference.13 The model predicts that if the housing tenure of the ethnic minorities
were similar to those of whites their employment rate would rise by over one percentage point.
Subsequent columns analyse the employment difference from whites for individual ethnic
groups. Blacks seem to have the lowest employment rate of all the ethnic groups, 18 percentage
points lower than for whites. Just over a half of this difference is explained by the diversity in
characteristics across the two groups. Given that blacks tended to arrive earlier than other groups
and that a lower proportion are immigrants, it follows that immigrant status will be less important
in explaining the difference in employment rates.14 For blacks, the most important factor is found
to be housing tenure. This factor explains a quarter of the difference in employment rates. In the
case of Indians, the employment difference is much lower, only two percentage points, and none
of this difference is explained by characteristics. The contribution of individual characteristics
is not very informative here as the overall employment difference is relatively small. This is
most definitely not the case with Pakistanis, where the employment rate is 17 percentage points
lower than for whites. Again half of this difference is explained by characteristics. Education,
family size, health and immigrant status are all found to make an important contribution.
The final column reveals that native ethnic minorities have made no progress in closing
the employment gap. When making a comparison of a native white sample with the same age
structure it is found that their employment rate is 16 percentage points lower. In this instance,
only approximately a third of this difference is explained by the characteristics. By construction,
immigrant status is ruled out as an explanation. The most important explanatory variables are
housing tenure and region of residence. However, the vast majority of the significant difference
13 Housing tenure picks up unmeasured worker quality effects as well as acting (as noted earlier) as a
proxy local labour market indicator.

18
in employment rates is not explained by the model and therefore labour market discrimination
against this group cannot be ruled out.
VI Earnings
Table 4 presents the selectivity adjusted earnings equations for different ethnic groups. The
negative and significant selectivity term for all groups suggests that if those out of work were to
find work they would have higher earnings than individuals with similar characteristics already
in jobs. This result is compatible with such individuals setting higher reservation wages and is
consistent with their lower employment probability.
For whites, earnings are found to be positively associated with job tenure, working in
large plants, being in good health, married and having arrived in the UK after 1960. These
findings are fairly well established in the literature, but Table 4 reveals that a number of these
relationships cannot be confirmed for individual ethnic minorities. For example, being married
is not found to be associated with higher earnings for any ethnic group, whilst higher earnings
for the most recent immigrants are only found to be significant for Pakistanis. Pakistanis, are the
only group who do not appear to gain significant benefits from longer job tenure. All groups,
however, are found to have higher earnings when working in larger plants and being in good
health, although the magnitude differs across ethnic groups. Consistent with the evidence cited
by Lewis (1990) for the US, ethnic minorities experience a larger mark-up when working in the
public sector than whites. Whites working in the public sector are found to have 2 percent mark-
up over those in the private sector. For blacks, Indians and Pakistanis the figure is 8, 6 and 39
percent respectively, although only in the latter case is the figure significant. Being a union
14 See Hatton and Wheatley Price (1998) for a comprehensive discussion of immigration trends and
policies in the UK.
19
member and covered by a collective agreement is also found to be more important in raising the
earnings of ethnic minorities than for whites, ranging from 7 percent for Pakistanis to 13 percent
for blacks, although only in the latter case is the mark-up significant.15
For whites, the rate of return to education is positive whether it is gained in the UK or
abroad. Given that educational qualifications are also included in the equation, this suggests that
education increases earnings potential through means other than providing an individual solely
with qualifications. For blacks and Pakistanis, UK education is again positively related to an
individuals earnings, although the coefficient is insignificantly different from zero for Indians,
and for native ethnic minorities, so the negative effect of additional schooling, given
qualifications, seen with employment for native ethnic minorities does not apply to earnings.
To analyse in more detail the rates of return to schooling and qualification we turn to
Table 5. This Table shows the returns to schooling and educational qualifications when they are
entered separately into an earnings equation, in contrast to Table 4. This enables us to draw
comparisons with the earlier literature. Row 1 of the Table shows that the rate of return to
schooling is 7.4 percent for whites which is double that of blacks and nearly double that of
Indians.16 Earlier studies have consistently shown a lower return to education for the ethnic
minorities. For example, McNabb and Psacharopoulos (1981) find a rate of return of 8.5 percent
for whites and only 6.1 percent for the ethnic minorities using data from 1972. Using the same
15 Again this is consistent with the results found in the US. Lewis (1986), in his extensive survey finds
the union/non-union wage gap to be generally between 5 and 10 percentage points larger for blacks than for whites.16 Pakistanis are found to have the highest rate of return to schooling of all groups. Caution is required
in interpreting these results as the Pakistani estimates are based on a relatively small sample of 167 observations.Also Blackaby, Leslie, Murphy and O’Leary (1998) find using the LFS over a slightly earlier period 1992Q4 to1995Q4 a lower rate of return to Pakistanis than Whites but still higher than Indians and blacks. The finding ofhigher returns to Asians than blacks, however, is consistent with the work of Chevalier and Walker (1999) using datafrom the Family Resources Survey.
20
data set but a different specification, Chiswick (1980) finds a 7.5 percent return for whites and
a 4.6 percent return for the ethnic minorities. Blackaby (1986), using data from 1975 finds a 5.7
percent return for whites and only a 3 percent return for ethnic minorities. BCLM (1994), using
data pooled from the 1970s and 1980s and controlling for selectivity into employment, finds a
5.4 percent return for whites in the earlier period falling slightly to 5.2 percent in the later period.
For the ethnic minorities the figure rises from 2.3 percent in the 1970s to 2.7 percent in the
1980s.
Obviously, the lumping together of foreign and domestic schooling is likely to be
inappropriate.17 For example, if immigrants are primarily from agricultural countries, the content
of their schooling and curriculum followed will mean that any given level of schooling will be
valued less in the labour market than a similar amount gained by natives. In addition, employers
may find it difficult to evaluate an immigrant's education, qualifications and previous labour
market experience. Thus the perceived quality of education and past experience may differ by
race and as a result continue to exert an impact on current earnings even in a non-discriminatory
setting. Support for these hypotheses are found in Table 5. For blacks and Pakistanis the rate
of return on domestic schooling ( rUK ) is higher than that gained on foreign schooling ( rFor ).
This would suggest that the finding of lower rates of return to education for ethnic minorities
reported in earlier studies may not be the result of discrimination but may be due to the use of
inappropriate measures of human capital. However, when comparing native whites with native
ethnic minorities, where these problems are eliminated, the differences in return to schooling for
whites and ethnic minorities are generally reduced but still evident at 8.3 percent and 6.2percent
17 Chiswick (1980) noted the problem in his study but had too few observations to deal with it adequately.

21
respectively. 18 In the case of qualifications, all groups generally appear to gain substantial
benefits, especially from higher level qualifications. For example, having a degree rather than
no qualifications raises the earnings of native whites by 82 percent (calculated as [100*(e0.60-1)]),
the earnings of native ethnic minorities by 103 percent.
The lower return to labour market experience found for native ethnic minorities is
consistent with the work of Shields and Wheatley Price (1999a) who find that equal opportunities
legislation has not been successful in enabling ethnic minorities to gain equal access to employer-
funded training. The finding of a lower return to labour market experience for ethnic minorities
is also consistent with that found by Lazear (1976) in his work on the reaction of firms in the US
to government affirmative action legislation. He finds that the ethnic wage differentials did
decline following the introduction of the legislation, but the amount of on-the-job training given
to young ethnic minorities fell, which he predicted would lead to an increase in wage differentials
later in life. Shields and Wheatley Price (1999a) note that both the 1976 Race Relation Act and
the 1984 Commission for Racial Equality Code of Practice in Employment, in Britain, outlawed
discriminatory practices in the provision of training opportunities, yet very few firms had a plan
by which this was to be achieved or monitored.
18 This figure is similar to that found by Shields and Wheatley Price (1998) when estimating an earnings
equation for native ethnic minorities using the same data set and a similar estimation technique but over the shorterperiod 1992Q4 to 1994Q3.

22
VII Earnings Decompositions
To analyse in detail whether it is differences in mean characteristics or differences in rewards to
these characteristics that determine differences in earnings across ethnic groups, ethnic earnings
decompositions are presented in Table 6 using the framework outlined in Section II. Column 1
reveals that the nominal wage differential between whites and all ethnic groups is 10 percent.
Correcting for selectivity bias results in a wage offer differential of 11 percent. The
decomposition shows that the characteristics of ethnic minorities in no way explain the lower
earnings of this group. The characteristic endowment of ethnic minorities actually suggests their
earnings should be higher than whites.19 The most important individual component in
contributing to the wage differential is region of residence. This characteristic alone suggests that
ethnic minorities earnings should be 7 percent higher than whites as they are overly represented
in the relatively prosperous South-East. Column 2 reveals that deflating nominal earnings by a
regional cost-of-living index increases the offered wage differential from 11 to 17 percent, with
characteristic differences now explaining 15 percent of the wage differential.
19 This was also the finding of McNabb and Psacharopoulos (1981), Blackaby (1986) and BCLM (1994).
The Table shows wide diversity in the white/ethnic minorities geometric mean and
offered wage differential across the individual ethnic groups. In the case of the geometric mean
wage differential, the white/Pakistani differential is largest at 31 percent followed by the
white/black (17 percent) with the white/Indian differential being the smallest at 15 percent. The
effect of correcting for selectivity bias on the wage differentials depends on the mean values of
λ and the size of its coefficient. The mean values of λ are found to be inversely related to the
sample unemployment rates. For whites, blacks, Indians and Pakistanis the figures are 0.55,
1.03, 0.73 and 1.33 respectively. The difference in the mean value of λ between whites and
23
individual ethnic minority groups is larger than the difference in the selectivity effect and
explains why the predicted wage offer differential for individual ethnic minority groups decreases
relative to whites. This suggests that in terms of unobservable traits the sample of ethnic
minorities not working are less similar to ethnic minorities in employment than is the case for
whites.
This finding may arise from the fact that we have not been able to measure proficiency
in English. Carliner (1995) for example states that immigrants into the US who speak little or
no English find it more difficult to get jobs and especially well paid jobs outside of immigrant
enclaves. Shields and Price (1999b) show that English language fluency is an important
determinant of occupational success within the UK. Modood et al. (1997) note that it is Pakistani
and Bangladeshis amongst the larger ethnic minority groups who are least likely to be fluent in
English. This appears to arise from the fact that they are more recent immigrants and are more
likely to live in ethnic enclaves. Lazear (1995) has shown, again for the US, that the size and
cohesion of ethnic enclaves influences progress in language development after entry.

Decomposing the offered wage differential for individual ethnic groups reveals that for
blacks and Indians coefficient differences explain the majority of the offered wage differential.
Indeed for Indians, coefficient differences account for the 92 percent of the difference in the wage
offer differential and would suggest substantial discrimination against this group. In the case of
Pakistanis, characteristics explain over 62 percent of the wage offer differential but
discrimination is still found to reduce their wages by 7.6 percent. When looking at the
contribution of individual characteristics in explaining differences in wage offers across ethnic
groups, some uniformity is revealed. Job tenure, employment status, potential experience20,
education21 and qualifications are all factors which would point to whites having higher earnings
than blacks, Indians and Pakistanis.
The only characteristic that consistently favours the ethnic minorities is the year of arrival
variable. This variable predicts that earnings should be higher for ethnic minorities than whites.
This effect arises from the fact that for whites, who dominate the sample, immigrants usually
earn more than natives (this effect is not consistently observed for the ethnic minority group) and
a higher proportion of the ethnic minority population are immigrants.
It is possible, however, that white immigrants and ethnic minority immigrants may differ
in ways that may not be captured by the controls included in the model – English language
fluency for example. If this is the case the contribution of coefficients in explaining the earnings
differentials is increased and may lead to the degree of measured labour market discrimination
20 It is important to appreciate that potential experience is likely to be an over-estimate for ethnic minoritieswhen compared to whites because of their increased propensity to be unemployed. This will lead to a decreasein the amount of the earnings gap attributed to characteristics and increase that due to discrimination.
21 The positive role of education in explaining the higher wages of Whites over ethnic minorities is insharp contrast to the findings of McNabb and Psacharopoulos (1981), Blackaby, Leslie, Murphy and O’Leary (1998)and arises from the failure of those earlier studies to distinguish between education gained in the UK and that gainedabroad.

being exaggerated. The problem of unmeasured differences of this type should be smaller for
the native groups. Limiting a comparison between these two groups gives greater robustness to
any conclusion concerning discrimination. The last two columns of Table 6 make this
comparison. The age adjusted native ethnic/white minority real earnings differential is 6
percent.22 Again the effect of selectivity correction increases the size of the offer wage
differential relative to the geometric mean wage differential. The decomposition reveals that
characteristic differences again explain only a small proportion of the offered wage differential
between these two groups. Obviously, in this case immigrant status is not playing a role and the
fact that native ethnic minorities have more years of schooling and are shown on the whole to be
better qualified would suggest that their earnings should be higher. These positive factors are
offset particularly by whites having been in their jobs longer and a more favourable industry
afilliation.23 Overall, however, the results suggest that 97 percent of the 7 percent offer wage
differential that is found to exist between native whites and native ethnic minorities cannot be
explained by factors included in our model and may be due to discriminatory practices.
The unexplained component of the wage differential (at 6.8 percentage points), however,
is smaller than that faced by blacks, Indians and Pakistanis. Does this suggest that discrimination
faced by native ethnic minorities is less than that faced by their parents? This proposition should
be considered with caution given that the native ethnic minority population is relatively young.
If discrimination on the basis of colour takes place because whites do not wish to be in a
subservient position to ‘non-whites’, then even though ethnic minorities may be in occupations
with favourable earnings profiles they may not get promoted as quickly and so fully benefit from
the earnings profiles found in these occupations
22 The nominal wage differential is actually zero and this shows the importance of controlling for cost-of-
living influences when analysing white/ethnic minorities wage differentials.
23 The fact that this may arise from discriminating behaviour is not an issue that is addressed in this paper.

The finding of a smaller white/ethnic minority wage differential for younger workers is
consistent with earlier research. When Greenhalgh (1980) included an ethnic minority dummy
in an earnings equation using a sample of single men and women under 30, she finds it is
insignificant and concludes that discrimination against this group has now abated. Dex (1986)
compares the progress of a matched sample of whites and West Indians six years after leaving
school and finds that the earnings functions are not significantly different and that the long term
prospects of West Indians looks bright. Chiswick (1980), using data from 1972, concludes that
because the native-born male earnings disadvantage is smaller than the foreign-born earnings
disadvantage for ethnic minorities, earnings differences will narrow and may even disappear as
an increasing proportion of the ‘non-white’ population is native-born. There is little evidence,
though, to support this proposition. BCLM (1994) finds that the nominal white/ethnic minorities
earnings differential increased from 7.3 percent in the 1970s to 12.1 percent in the 1980s. In this
paper we find that the differential has fallen slightly in the 1990s to 10 percent, which is exactly
the same figure found by Blackaby (1986) for 1975. This work suggests a more sanguine attitude
towards the earnings prospects of native ethnic minorities may be necessary.
As with the probit equations, due to relatively small samples it is not possible to estimate
native earnings equations for each minority ethnic group. However, it is possible to shed light
on the relative performance of individual ethnic groups by including ethnic intercept dummies
in a pooled earnings equation containing the native ethnic minorities and the age adjusted sample
of native whites. This again reveals diversity in earnings across ethnic groups. Pakistanis are
found to have the lowest earnings, being 13 percent below those of whites, whilst the figure for
blacks and Indians is 5 percent and 8 percent respectively. A fairly consistent picture appears to
follow from the analysis of both the earnings and employment. Pakistanis appear the most
disadvantaged group in the labour market and native ethnic minorities are consistently doing

worse than native whites. These observations appear to support the finding of Borjas (1992) who
stated for the US that 'ethnicity matters and it matters for a very long time'. This arises from the
fact that the way in which an individual is raised affects an individual's behaviour and
opportunities and therefore their future labour market success.

Conclusions
Evidence presented in this paper suggests that ethnic minorities do not appear to face a level
playing field in the UK labour market and their relative position does not appear to have
improved since the 1970s. Native ethnic minorities also appear to be faring little better than their
parents. Our findings imply that ethnic differences in labour market remuneration cannot be
explained as a characteristic problem - such as poor qualifications, and an unfavourable regional
and industrial distribution. Such generalizations about attributes of the ethnic minority
populations can reinforce stereotyping, which may result in these populations being excluded
from the most remunerative jobs and excuse government from taking appropriate policy
initiatives in this area.24 At the beginning of the twenty first century discrimination should have
no place in restricting an individuals opportunities. Discrimination undermines those beliefs
that are central to a fair and democratic society and places a high penalty on those ethnic
minorities whose life chances are limited.
24 Darity and Mason (1998) have shown that in the US anti-discrimination laws have played an important
role in reducing discriminatory practices.

BIBLIOGRAPHY
Arrow K (1972), Some Mathematical Models of Race Discrimination in the Labour Market, inRace Discrimination in Economic Life, ed. Pascal A, Lexington, D C Heath, pp.187-203.
Ballard R (1996), The Pakistanis : Stability and Introspection in - Ethnicity in the 1991 census,Volume 2.
Becker G S (1957), The Economics of Discrimination, Chicago, University of Chicago Press.
Berrington A (1996), Marriage Patterns and Inter-ethnic Unions, Chapter 7 in Ethnicity in the1991 census, ed. by Coleman D and Salt J, OPCS London.
Berthoud R (1999) Young Carribean Men and the Labour Market : A comparison with otherethnic groups. mimeo.
Blackaby D H (1986), 'An Analysis of the Male Racial Earnings Differential in the UK, Usingthe General Household Survey', Applied Economics, Vol.18, pp.1233-1242.
Blackaby D H, Clark K, Leslie D G and Murphy P D (1994), 'Black-White Male Earnings andEmployment Prospects in the 1970s and 1980s : Evidence for Britain', Economics Letters,Vol.46, pp.273-279.
Blackaby D, Drinkwater S, Leslie D and Murphy P (1997), 'A Picture of Male and FemaleUnemployment among Britain's Ethnic Minorities', Scottish Journal of Political Economy,Vol.44, pp.182-197.
Blackaby D H, Leslie D G, Murphy P D and O’Leary N C (1998), 'The Ethnic Wage Gap andEmployment Differentials in the 1990s: Evidence for Britain', Economic Letters, Vol.58, 1998,pp.97-103.
Blinder A S (1973), 'Wage Discrimination : Reduced Form and Structural Estimates', Journalof Human Resources, Vol.8, pp.436-55.
Borjas G J (1992), 'Ethnic Capital and Intergenerational Mobility', The Quarterly Journal ofEconomics, Vol.107, pp.123-50.
Borjas G (1994), 'Long-run Convergence of Ethnic Skill Differentials : The Children andGrandchildren of the Great Migration', Industrial and Labour Relations Review, Vol.47, pp.553-73.
Bradley S and Taylor J (1994), 'Spatial Disparities in the Impact of the 1990-92 Recession :An Analysis of UK Counties', Oxford Bulletin of Economics and Statistics, Vol.56, pp.367-82.
Brooks D (1981), Race and Labour in London Transport : Some Conclusions, Chapter 2-3 inDiscrimination and Disadvantage in Employment, ed. by Braham P, Rhodes E and Pearn M,Harper and Row, London.
Brown C (1984), Black and White Britain, Heinemann.
Card D and Krueger A B (1992), 'School Quality and Black-White Relative Earnings : A DirectAssessment', The Quarterly Journal of Economics, Vol. 107, pp.151-200.
Carliner G (1980), 'Wages, Earnings and Hours of First, Second and Third Generation AmericanMales', Economic Enquiry, Vol.XVIII, pp.87-102.
Carliner G (1995), The Language Ability of US Immigrants : Assimilation and Cohort Effects,NBER Working Paper Series, No.5222.
Chevalier A and Walker I (1999), 'Further Results on the Returns to Education in the UK',mimeo.
Chiswick B R (1978), 'The Effect of Americanisation on the Earnings of Foreign-Born Men',Journal of Political Economy, Vol.86, pp.897-921.
Chiswick B R and Millar P W (1995), 'The Endogeneity Between Language and Earnings :International Analyses', Journal of Labour Economics, Vol.13, pp.246-88.
Chiswick B R (1980), 'The Earnings of White and Coloured Male Immigrants in Britain',Economica, Vol.47, pp.81-87.
Connor H, La Valle I, Tackey N D and Perryman S (1996), 'Ethnic Minority Graduates:Difference by Degree', Labour Market Trends, September, pp.395-396.
Cotton J (1988), 'On the Decomposition of Wage Differentials', The Review of Economics andStatistics, Vol.LXX, pp.236-243.
Daniel W W (1968), Racial Discrimination in England, Penguin.
Darity W A and Mason P L (1998), 'Evidence on Discrimination in Employment: Codes ofColor, Codes of Gender', Journal of Economic Perspectives, Vol.12, pp.63-90.
Dex S (1986), 'Earnings Differentials of Second Generation West Indian and White SchoolLeavers in Britain', Manchester School, Vol.54, pp.162-79.
Drew D (1995), Race, Education and Work: The Statistics of Inequality. Aveburg Press,Aldershot.
Even E W and Macpherson D A (1993), 'The Decline of Private-Sector Unionism and theGender Wage Gap', The Journal of Human Resources, Vol.XXVIII, pp.279-296.
Gillborn D and Gipps C (1996), Recent Research on the Achievements of Ethnic MinorityPupils, Ofsted Reports, HMSO.
Greenhalgh C (1980), 'Male-Female Wage Differentials in Great Britain : Is Marriage an EqualOpportunity', Economic Journal, Vol.90, pp.751-775.

Hatton T J and Wheatley Price S (1998), 'Migration, Migrants and Policy in the UnitedKingdom', unpublished manuscript, July.
HESA (1996), Course Results in Higher Education, Research Datapack, Higher EducationalStatistics Agency.
Hirsch B T and Addison J T (1986), The Economic Analysis of Unions : New Approaches andEvidence, Allen and Unwin, Boston.
Hughes G A and McCormick B (1987), 'Housing Markets, Unemployment and Labour MarketFlexibility in the UK', European Economic Review, Vol.31, pp.615-645.
Jones F L (1983), 'On Decomposing the Wage Gap : A Critical Comment on Blinder's Method',Journal of Human Resources, Vol.18, pp.126-30.
Kain J C and Persky J (1967), 'The North's Stake in Southern Rural Poverty' in Rural Povertyin the United States, Washington, pp.288-310.
Laux R and Marshall N (1994), Income and Earnings Data from the LFS, Employment Gazette,December, pp.461-471.
Lazear E (1976), 'Age, Experience and Wage Growth', American Economic Review, Vol.66,pp.548-58.
Lazear E (1995), Culture and Language, NBER Working Paper No.5249.
Leslie D G and Drinkwater S (1998), 'Staying on in full time education: Reasons for higherparticipation rates among ethnic minority males and females', forthcoming Economica.
Lewis H G (1986), 'The Union Relative Wage Effects: A Survey', The University of Chicagopress, Chicago.
Lewis H G (1990), 'Union/non-union wage gaps in the public sector', Journal of LaborEconomics, Vol.8, pp.S260-S328.
McCormick B (1986), 'Evidence about the Comparative Earnings of Asian and West IndianWorkers in Great Britain', Scottish Journal of Political Economy, Vol.33, pp.97-110.
McNabb R and Psacharopoulos G (1981), 'Racial Earnings Differentials in the UK', OxfordEconomic Papers, Vol.33, pp.413-425.
Modood T et al (1997), Ethnic Minorities in Britain : Diversity and Disadvantage; Policy StudiesInstitute, London.
Neumark D (1988), 'Employers Discriminatory Behaviour and the Estimation of WageDiscrimination', Journal of Political Economy, Vol.23, pp.279-95.
Nickell, S J (1980), 'A Picture of Male Unemployment in Britain', Economic Journal, Vol.90,pp.776-94.

Oaxaca R (1973), 'Male-Female Wage Differentials in Urban Labour Markets', InternationalEconomic Review, Vol.9, pp.693-709.
Oaxaca R and Ransom M R (1994), 'On Discrimination and the Decomposition of WageDifferentials', Journal of Econometrics, Vol.61, pp.5-21.
Reimers C W (1983), 'Labour Market Discrimination Against Hispanic and Black Men', Reviewof Economics and Statistics, Vol.65, pp.570-79.
Reward Regional Surveys Ltd (1997), Cost of Living Report; Regional Comparisons, March,Stone, Staffordshire.
Shields M A and Wheatley Price S (1998), The Earnings of Male Immigrants in England :Evidence from the quarterly LFS, Applied Economics, Vol.30, pp.1157-1168.
Shields M A and Wheatley Price S (1999a), 'Ethnic differences in the incidence anddeterminants of employer-funded training in Britain', forthcoming, Scottish Journal of PoliticalEconomy.
Shields M A and Wheatley Price S (1999b), 'The English language fluency and occupationalsuccess of ethnic minority immigrants now living in English metropolitan areas', paper presentedat conference, Marginal Labour Markets in Metropolitan Area held in Dublin, October 10-12.
Smith D J (1977), Racial Disadvantage in Britain, Penguin.
Stewart M B (1983), 'Racial Discrimination and Occupational Attainment in Britain', EconomicJournal, Vol.93, pp.521-541.

Table 1Means Values of Dependent and Explanatory Variables for Different Ethnic Groups
White Black Indian Pakistani White NativeNative
Eth.MinVariableNW Em NW Em NW Em NW Em NW Em NW Em
Employment Status 19.5 80.5 37.3 62.7 21.8 78.2 36.2 63.8 16.5 83.5 33.0 67.0Nominal hourly earn.(1997 prices) 9.08 7.89 8.23 7.00 7.49 7.40Real hourly earnings(1997 prices) 9.03 7.20 7.73 6.74 7.45 6.88Years Educ. UK 11.6 12.8 6.0 7.4 4.3 6.6 5.0 6.1 12.6 13.4 13.6 14.1Years Educ. For. 0.4 0.3 7.6 6.8 9.8 8.7 8.3 8.2 0 0 0 0Years Exper. UK 28.7 22.0 16.2 17.7 18.3 16.4 16.4 14.4 9.8 10.9 8.1 10.7Years Exper. For. 0.2 0.1 3.7 2.1 6.1 2.3 4.5 1.7 0 0 0 0Degree 7 18 6 17 10 22 7 16 6 16 9 19HND or equivalent 5 9 5 10 3 10 1 6 3 9 5 8OND or equivalent 12 17 13 14 7 9 4 7 13 17 14 17A levels or equivalent 4 6 4 6 5 4 3 4 7 9 7 10O levels or equivalent 16 23 15 20 11 14 11 20 31 34 28 30Other qualification 19 13 26 18 29 26 30 22 12 8 11 8No qualification 37 14 31 15 35 15 44 25 28 7 26 8Work limiting illness 46 6 29 3 39 5 43 5 26 5 22 2Scotland, Wales,S.West, North 34 29 3 5 4 4 8 7 33 30 6 7York/Humberside 9 9 4 3 4 4 19 15 9 10 9 5East Midlands 7 8 2 5 14 10 2 3 6 8 5 5East Anglia 3 4 1 2 1 1 1 4 3 4 2 1Inner London 4 3 41 30 14 6 10 8 4 2 27 20Outer London 6 6 23 26 24 33 12 16 5 6 16 22South East 15 21 7 14 8 16 11 15 15 20 6 15West Midlands 9 9 12 12 23 17 19 20 9 9 18 17North West 14 11 6 3 9 8 19 12 14 11 10 8Born in UK 96 97 38 41 20 18 22 19 100 100 100 100Arr. Before 60 2 1 9 7 8 4 4 1 0 0 0 0Arr. Between 1960-69 1 1 24 27 32 33 34 35 0 0 0 0Arr. After 1970-79 1 1 7 11 23 31 15 20 0 0 0 0Arr. After 1980 1 1 22 15 16 13 24 25 0 0 0 0Married 59 75 40 62 71 83 72 82 32 56 24 50Single 29 20 50 29 23 15 21 14 64 41 74 48Divorced/Widowed 12 5 11 9 6 2 6 4 4 2 2 2Job ten. < 1 year 18 21 22 27 27 34Job ten. ≥≥≥≥1 & ≤≤≤≤ 5 yrs 25 35 29 31 34 35Job ten. > 5 years 56 44 49 42 39 30Plant Size ≤≤≤≤ 25 empl. 25 25 23 28 28 30Part-time 3 8 4 8 3 8

Industry 1 3 1 1 1 2 1Industry 2 5 2 2 3 4 1Industry 3 16 15 22 20 15 16Industry 4 11 6 12 18 11 6Industry 5 7 3 3 3 7 6Industry 6 14 16 18 20 19 21Industry 7 10 17 15 7 9 15Industry 8 12 8 11 14 14 11Industry 9 23 32 17 14 18 23Public Sector 24 37 20 14 19 26Non mem – notcovered
48 44 52 55 56 54
Mem – not covered 4 5 5 5 3 7Non mem – covered 12 8 10 11 12 10Mem – covered 36 43 34 29 28 29Age ≤≤≤≤ 24 14 10 20 8 15 7 24 14 49 30 50 25Age ≥≥≥≥ 25 & ≤≤≤≤ 39 23 42 44 57 29 51 30 54 46 65 46 71Age ≥≥≥≥ 40 & ≤≤≤≤ 49 16 27 10 17 18 28 19 25 2 3 2 2Age > 49 47 21 26 18 39 13 27 7 4 2 1 2Mortgaged Property 30 72 21 55 42 74 40 67 31 72 30 57House owned outright 25 12 7 8 30 17 23 17 11 8 13 14Council housing 33 9 49 23 13 3 16 7 39 10 35 17Private rented 12 7 23 14 14 6 20 8 18 10 22 12No children 74 56 71 53 52 37 32 22 61 60 60 59One child 11 18 11 23 17 20 14 17 17 19 15 20Two children 9 20 9 18 16 29 19 29 12 16 12 14Three or more child. 6 7 10 6 15 14 34 32 9 5 12 7Child under 4 years 10 17 15 21 18 25 31 41 19 23 19 22Sample Size 20048 44985 473 392 323 489 279 167 4733 13079 384 361
Notes : NW refers to ‘those not working’, Em ‘in employment’, means for the year dummies are not presented.The sample of native whites is drawn so as to have the same age structure as native ethnic minorities.
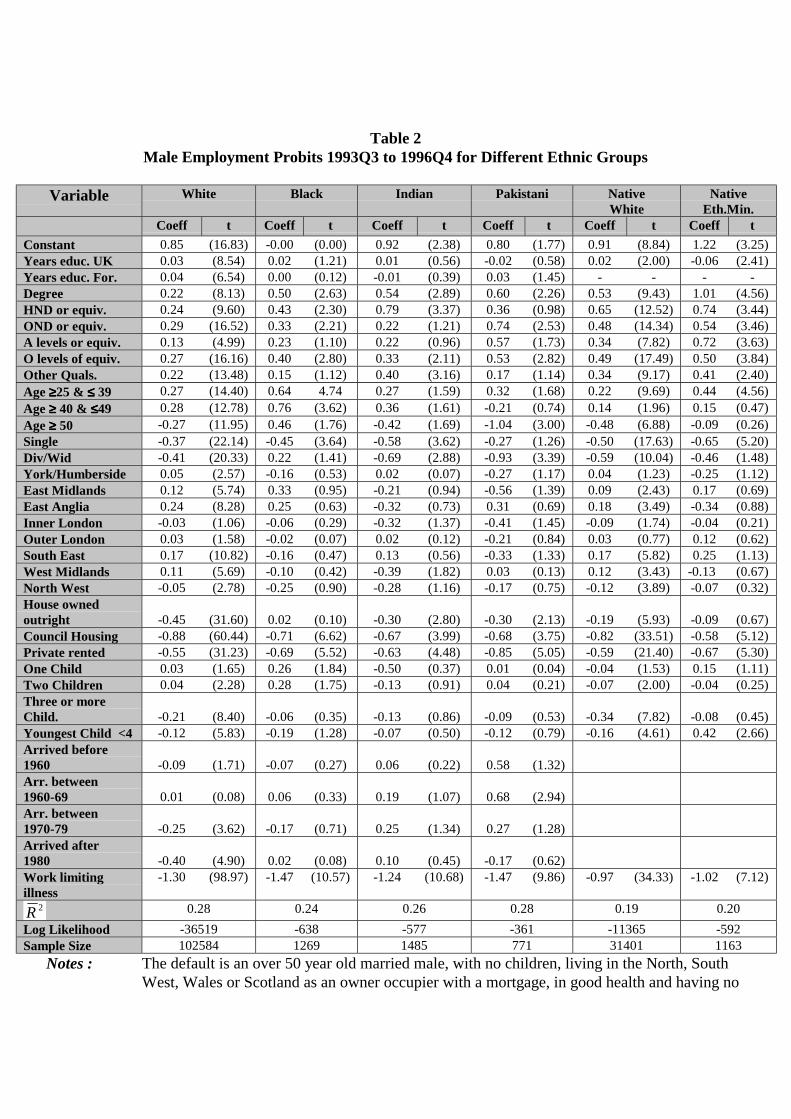
Table 2Male Employment Probits 1993Q3 to 1996Q4 for Different Ethnic Groups
Variable White Black Indian Pakistani NativeWhite
NativeEth.Min.
Coeff t Coeff t Coeff t Coeff t Coeff t Coeff tConstant 0.85 (16.83) -0.00 (0.00) 0.92 (2.38) 0.80 (1.77) 0.91 (8.84) 1.22 (3.25)Years educ. UK 0.03 (8.54) 0.02 (1.21) 0.01 (0.56) -0.02 (0.58) 0.02 (2.00) -0.06 (2.41)Years educ. For. 0.04 (6.54) 0.00 (0.12) -0.01 (0.39) 0.03 (1.45) - - - -Degree 0.22 (8.13) 0.50 (2.63) 0.54 (2.89) 0.60 (2.26) 0.53 (9.43) 1.01 (4.56)HND or equiv. 0.24 (9.60) 0.43 (2.30) 0.79 (3.37) 0.36 (0.98) 0.65 (12.52) 0.74 (3.44)OND or equiv. 0.29 (16.52) 0.33 (2.21) 0.22 (1.21) 0.74 (2.53) 0.48 (14.34) 0.54 (3.46)A levels or equiv. 0.13 (4.99) 0.23 (1.10) 0.22 (0.96) 0.57 (1.73) 0.34 (7.82) 0.72 (3.63)O levels of equiv. 0.27 (16.16) 0.40 (2.80) 0.33 (2.11) 0.53 (2.82) 0.49 (17.49) 0.50 (3.84)Other Quals. 0.22 (13.48) 0.15 (1.12) 0.40 (3.16) 0.17 (1.14) 0.34 (9.17) 0.41 (2.40)Age ≥≥≥≥25 & ≤≤≤≤ 39 0.27 (14.40) 0.64 4.74 0.27 (1.59) 0.32 (1.68) 0.22 (9.69) 0.44 (4.56)Age ≥≥≥≥ 40 & ≤≤≤≤49 0.28 (12.78) 0.76 (3.62) 0.36 (1.61) -0.21 (0.74) 0.14 (1.96) 0.15 (0.47)Age ≥≥≥≥ 50 -0.27 (11.95) 0.46 (1.76) -0.42 (1.69) -1.04 (3.00) -0.48 (6.88) -0.09 (0.26)Single -0.37 (22.14) -0.45 (3.64) -0.58 (3.62) -0.27 (1.26) -0.50 (17.63) -0.65 (5.20)Div/Wid -0.41 (20.33) 0.22 (1.41) -0.69 (2.88) -0.93 (3.39) -0.59 (10.04) -0.46 (1.48)York/Humberside 0.05 (2.57) -0.16 (0.53) 0.02 (0.07) -0.27 (1.17) 0.04 (1.23) -0.25 (1.12)East Midlands 0.12 (5.74) 0.33 (0.95) -0.21 (0.94) -0.56 (1.39) 0.09 (2.43) 0.17 (0.69)East Anglia 0.24 (8.28) 0.25 (0.63) -0.32 (0.73) 0.31 (0.69) 0.18 (3.49) -0.34 (0.88)Inner London -0.03 (1.06) -0.06 (0.29) -0.32 (1.37) -0.41 (1.45) -0.09 (1.74) -0.04 (0.21)Outer London 0.03 (1.58) -0.02 (0.07) 0.02 (0.12) -0.21 (0.84) 0.03 (0.77) 0.12 (0.62)South East 0.17 (10.82) -0.16 (0.47) 0.13 (0.56) -0.33 (1.33) 0.17 (5.82) 0.25 (1.13)West Midlands 0.11 (5.69) -0.10 (0.42) -0.39 (1.82) 0.03 (0.13) 0.12 (3.43) -0.13 (0.67)North West -0.05 (2.78) -0.25 (0.90) -0.28 (1.16) -0.17 (0.75) -0.12 (3.89) -0.07 (0.32)House ownedoutright -0.45 (31.60) 0.02 (0.10) -0.30 (2.80) -0.30 (2.13) -0.19 (5.93) -0.09 (0.67)Council Housing -0.88 (60.44) -0.71 (6.62) -0.67 (3.99) -0.68 (3.75) -0.82 (33.51) -0.58 (5.12)Private rented -0.55 (31.23) -0.69 (5.52) -0.63 (4.48) -0.85 (5.05) -0.59 (21.40) -0.67 (5.30)One Child 0.03 (1.65) 0.26 (1.84) -0.50 (0.37) 0.01 (0.04) -0.04 (1.53) 0.15 (1.11)Two Children 0.04 (2.28) 0.28 (1.75) -0.13 (0.91) 0.04 (0.21) -0.07 (2.00) -0.04 (0.25)Three or moreChild. -0.21 (8.40) -0.06 (0.35) -0.13 (0.86) -0.09 (0.53) -0.34 (7.82) -0.08 (0.45)Youngest Child <4 -0.12 (5.83) -0.19 (1.28) -0.07 (0.50) -0.12 (0.79) -0.16 (4.61) 0.42 (2.66)Arrived before1960 -0.09 (1.71) -0.07 (0.27) 0.06 (0.22) 0.58 (1.32)Arr. between1960-69 0.01 (0.08) 0.06 (0.33) 0.19 (1.07) 0.68 (2.94)Arr. between1970-79 -0.25 (3.62) -0.17 (0.71) 0.25 (1.34) 0.27 (1.28)Arrived after1980 -0.40 (4.90) 0.02 (0.08) 0.10 (0.45) -0.17 (0.62)Work limitingillness
-1.30 (98.97) -1.47 (10.57) -1.24 (10.68) -1.47 (9.86) -0.97 (34.33) -1.02 (7.12)
2R 0.28 0.24 0.26 0.28 0.19 0.20Log Likelihood -36519 -638 -577 -361 -11365 -592Sample Size 102584 1269 1485 771 31401 1163
Notes : The default is an over 50 year old married male, with no children, living in the North, SouthWest, Wales or Scotland as an owner occupier with a mortgage, in good health and having no

qualifications in 1992. t statistics are in parentheses. Years dummy coefficients are notpresented.
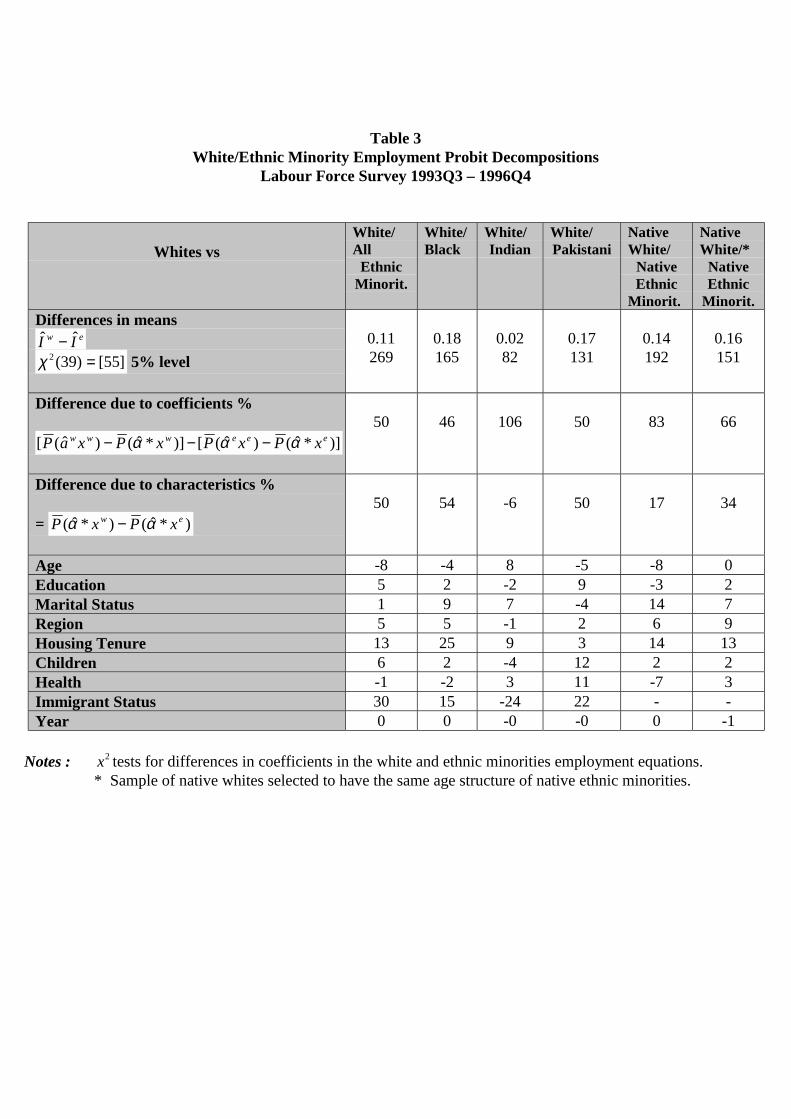
Table 3White/Ethnic Minority Employment Probit Decompositions
Labour Force Survey 1993Q3 – 1996Q4
Whites vsWhite/All
EthnicMinorit.
White/Black
White/Indian
White/Pakistani
NativeWhite/
NativeEthnic
Minorit.
NativeWhite/*
NativeEthnic
Minorit.Differences in means
ew II ˆˆ −]55[)39(2 =χ 5% level
0.11269
0.18165
0.0282
0.17131
0.14192
0.16151
Difference due to coefficients %
)]*ˆ()ˆ([)]*ˆ()ˆ([ eeewww xPxPxPxaP ααα −−−50 46 106 50 83 66
Difference due to characteristics %
= )*ˆ()*ˆ( ew xPxP αα −50 54 -6 50 17 34
Age -8 -4 8 -5 -8 0Education 5 2 -2 9 -3 2Marital Status 1 9 7 -4 14 7Region 5 5 -1 2 6 9Housing Tenure 13 25 9 3 14 13Children 6 2 -4 12 2 2Health -1 -2 3 11 -7 3Immigrant Status 30 15 -24 22 - -Year 0 0 -0 -0 0 -1
Notes : 2x tests for differences in coefficients in the white and ethnic minorities employment equations. * Sample of native whites selected to have the same age structure of native ethnic minorities.

Table 4Male Employee Earnings Function : LFS 1993Q3 – 1996Q4
Variable White Black Indian Pakistani Native*White
NativeEth.Min.
Coeff t Coeff t Coeff t Coeff t Coeff t Coeff tConstant 1.08 (42.89) 1.40 (4.70) 1.55 (4.74) 0.46 (0.68) 0.91 (18.13) 1.27 (3.73)Educ. UK x10 0.34 (26.89) 0.27 (2.57) 0.03 (0.30) 0.76 (3.41) 0.42 (16.68) 0.16 (1.12)Educ. For.x10 0.27 (11.83) 0.12 (1.35) 0.14 (1.58) 0.42 (2.15)Exper. UK x10 0.34 (43.99) 0.40 (4.11) 0.21 (1.66) 0.53 (2.64) 0.53 (34.30) 0.35 (2.96)Exper.2 UK x 100 -0.05 (32.79) -0.07 (2.86) -0.05 (1.77) -0.02 (0.30) -0.10 (23.98) -0.05 (1.56)Exper. For. x10 0.24 (4.52) 0.15 (0.90) -0.04 (0.33) 0.32 (0.89)Exper.2 For. x100 -0.03 (1.30) -0.05 (0.49) -0.05 (0.12) -0.13 (0.47)Degree 0.49 (47.21) 0.36 (3.73) 0.55 (5.22) 0.40 (2.35) 0.40 (18.14) 0.63 (4.34)HND or equiv. 0.35 (36.78) 0.18 (1.95) 0.07 (0.60) 0.22 (1.10) 0.28 (14.02) 0.28 (2.23)OND or equiv. 0.16 (19.30) 0.11 (1.33) 0.07 (0.74) -0.28 (1.63) 0.12 (6.94) 0.11 (1.11)A Level or equiv. 0.33 (30.88) 0.17 (1.66) 0.19 (1.42) 0.05 (0.25) 0.24 (12.46) 0.30 (2.47)O Level or equiv. 0.16 (20.07) 0.05 (0.62) 0.08 (0.92) -0.23 (1.89) 0.08 (4.83) 0.11 (1.08)Other qualification 0.05 (5.93) 0.07 (0.96) 0.12 (1.48) -0.07 (0.57) 0.03 (1.72) 0.23 (1.97)Single -0.09 (14.76) -0.03 (0.51) -0.05 (0.56) 0.31 (1.90) -0.06 (6.42) -0.04 (0.68)Divorced/Widowed -0.01 (1.13) -0.17 (2.27) 0.17 (1.11) 0.15 (0.66) 0.00 (0.16) -0.12 (0.66)Work Limitingillness
0.12 (9.97) 0.01 (0.54) -0.02 (0.14) 0.46 (2.36) 0.00 (0.10) 0.10 (0.63)
Part-Time -0.14 (12.09) -0.04 (0.51) -0.05 0.43 -0.19 (1.20) -0.07 (3.50) -0.10 (1.12)Job ten. ≥≥≥≥ 1 & ≤≤≤≤5Years 0.10 (16.81) 0.08 (1.39) 0.16 (2.64) 0.06 (0.55) 0.11 (12.85) 0.13 (2.43)Job ten. >5 years 0.22 (36.68) 0.14 (2.35) 0.25 (4.02) -0.02 (0.20) 0.17 (17.35) 0.16 (2.29)Plant Size ≤≤≤≤ 25 -0.14 (29.24) -0.11 (2.16) -0.26 (4.74) -0.35 (3.54) -0.12 (15.51) -0.14 (2.67)Public Sector 0.02 (2.89) 0.08 (1.35) 0.06 (0.75) 0.39 (2.47) 0.02 (1.33) 0.00 (0.05)coveredMem – not covered -0.00 (0.46) 0.07 (0.81) 0.10 (0.93) 0.22 (1.08) 0.04 (1.85) 0.15 (1.54)Non mem –covered 0.01 (1.51) 0.04 (0.56) 0.10 (1.26) -0.10 (0.68) 0.02 (1.50) 0.08 (1.03)Mem – covered 0.01 (2.70) 0.12 (2.19) 0.08 (1.35) 0.07 (0.64) 0.05 (5.46) 0.05 (0.70)Arrived before1960 0.01 (0.35) -0.11 (0.91) 0.15 (0.94) -0.57 (1.49)Arr. between1960-69 -0.01 (0.29) -0.03 (0.44) -0.11 (1.30) -0.19 (1.16)Arr. between1970-79 0.05 (1.90) 0.00 (0.03) -0.15 (1.67) 0.23 (1.51)Arrived after 1980 0.34 (8.88) 0.16 (1.10) -0.07 (0.50) 0.47 (2.04)Selectivity -0.31 (26.99) -0.19 (2.25) -0.26 (1.98) -0.34 (2.49) -0.25 (12.79) -0.14 (1.35)
2R 0.46 0.38 0.41 0.59 0.50 0.46Sample Size 44985 392 489 167 13079 317
Notes : The default is a married male born in UK, living in the Celtic fringe, in good health, working full-timefor less than 1 year in a plant in the public sector employing more than 25 workers in the energy and watersupply industry, having no formal qualifications in 1992 and not a member of a union or covered by acollective agreement. t-statistics in parentheses are derived using heteroscedastic-consistent estimatesof the standard errors. Industry, regional and year dummy coefficients are not presented. (The Celticfringe is defined as: Scotland, Wales, the North and South West.)

Table 5Rates of Return to Education and Qualifications Across Ethnic Groups
White EthnicMin.
Black Indian Pakistani NativeEthnic min.
NativeWhites +
r 0.074 0.050 0.036 0.039 0.079 0.062 0.083rUK 0.076 0.056 0.052 0.036 0.102rFor 0.059 0.047 0.028 0.040 0.076Degree 0.65 0.62 0.47 0.63 0.57 0.71 0.60HND orequivalent
0.41 0.32 0.23 0.14* 0.39 0.30 0.33
OND orequivalent
0.17 0.16 0.12* 0.10* -0.21* 0.14* 0.14
A Levels 0.39 0.27 0.22 0.22 0.12* 0.33 0.31O Levels 0.16 0.11 0.05* 0.10* -0.20* 0.11* 0.08Otherqualification
0.05 0.19 0.06* 0.18 -0.00* 0.24 0.04
Notes : r is the rate of return to schooling.+ signifies that the sample has been adjusted to have the same age structure as the native ethnic minorities sample (see Table 3)* signifies that the coefficients are not significant at the 5% level.
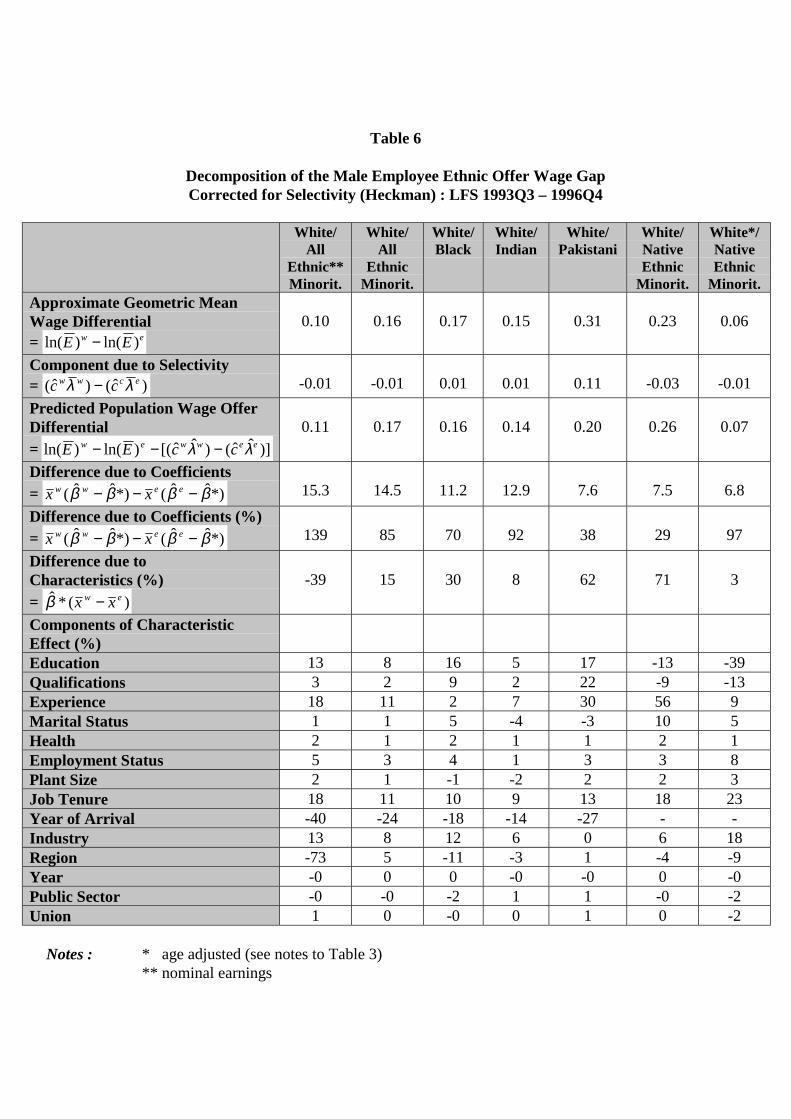
Table 6
Decomposition of the Male Employee Ethnic Offer Wage GapCorrected for Selectivity (Heckman) : LFS 1993Q3 – 1996Q4
White/All
Ethnic**Minorit.
White/All
EthnicMinorit.
White/Black
White/Indian
White/Pakistani
White/NativeEthnic
Minorit.
White*/NativeEthnic
Minorit.Approximate Geometric MeanWage Differential= ew EE )ln()ln( −
0.10 0.16 0.17 0.15 0.31 0.23 0.06
Component due to Selectivity= )ˆ()ˆ( ecww cc λλ − -0.01 -0.01 0.01 0.01 0.11 -0.03 -0.01Predicted Population Wage OfferDifferential= )]ˆˆ()ˆˆ[()ln()ln( eewwew ccEE λλ −−−
0.11 0.17 0.16 0.14 0.20 0.26 0.07
Difference due to Coefficients= *)ˆˆ(*)ˆˆ( ββββ −−− eeww xx 15.3 14.5 11.2 12.9 7.6 7.5 6.8
Difference due to Coefficients (%)= *)ˆˆ(*)ˆˆ( ββββ −−− eeww xx 139 85 70 92 38 29 97
Difference due toCharacteristics (%)= )(*ˆ ew xx −β
-39 15 30 8 62 71 3
Components of CharacteristicEffect (%)Education 13 8 16 5 17 -13 -39Qualifications 3 2 9 2 22 -9 -13Experience 18 11 2 7 30 56 9Marital Status 1 1 5 -4 -3 10 5Health 2 1 2 1 1 2 1Employment Status 5 3 4 1 3 3 8Plant Size 2 1 -1 -2 2 2 3Job Tenure 18 11 10 9 13 18 23Year of Arrival -40 -24 -18 -14 -27 - -Industry 13 8 12 6 0 6 18Region -73 5 -11 -3 1 -4 -9Year -0 0 0 -0 -0 0 -0Public Sector -0 -0 -2 1 1 -0 -2Union 1 0 -0 0 1 0 -2
Notes : * age adjusted (see notes to Table 3)** nominal earnings