white paper report development of a waste-to-energy ... to... · white paper report development of...
TRANSCRIPT

WHITE PAPER REPORT
Development of a Waste-to-Energy Projectfor the Municipality of Anchorage, Alaska
Solid Waste Services1111 E 56th Avenue
Anchorage, Alaska 99518
StreamlineAM, LLC
Prepared for:Prepared by:
Geosyntec Consultants 4101 Arctic Boulevard, Suite 206Anchorage, Alaska 99503United States of America
Geosyntec Project Number: ME178425 September 2019

Prepared for:
Solid Waste Services 1111 E 56th Avenue
Anchorage, Alaska 99518
White Paper Report:
Development of a Waste-to-Energy Project for the Municipality of Anchorage,
Alaska
Prepared by:
4101 Arctic Boulevard, Suite 206
Anchorage, Alaska 99503 United States of America
Prepared for:
StreamlineAM, LLC
Geosyntec Project Number: ME1784 25 September 2019
White Paper Report 2 September 2019
TABLE OF CONTENTS
ABBREVIATIONS AND ACRONYMS ........................................................................................5
DISCLAIMER .................................................................................................................................7
EXECUTIVE SUMMARY .............................................................................................................8
1. INTRODUCTION ..................................................................................................................10 1.1 Terms of Reference .......................................................................................................10 1.2 Project Understanding ...................................................................................................10 1.3 Background and Motivation ..........................................................................................10
2. WASTE-TO-ENERGY TECHNOLOGY ASSESSMENT ...................................................11 2.1 The Status of the WTE Industry Worldwide .................................................................11
2.1.1 United States and Canada ..................................................................................11
2.1.2 Europe ...............................................................................................................14
2.1.3 China .................................................................................................................16
2.2 Criteria and Assumptions for Technology Selection ....................................................17 2.3 Mass Burn WTE Technology ........................................................................................18 2.4 Refuse Derived Fuel (RDF) Systems ............................................................................21
2.4.1 Processing Systems ...........................................................................................21
2.5 Emerging Waste Conversion Technologies ..................................................................23 2.5.1 Summary of Technologies .................................................................................24
2.5.2 Microwaves .......................................................................................................29
2.6 Evaluation ......................................................................................................................29
3. ENVIRONMENTAL AND PERMITTING CONSIDERATIONS .......................................31 3.1 Environmental Benefits .................................................................................................31 3.2 Odor and Dust Management ..........................................................................................33 3.3 Air Emissions Control and Monitoring .........................................................................33 3.4 Ash Management ...........................................................................................................34 3.5 Wastewater ....................................................................................................................34 3.6 Permitting Requirements ...............................................................................................35
3.6.1 Compliance Monitoring ....................................................................................38
3.6.2 Operating Standards ..........................................................................................39
3.6.3 Overview of Permitting Process ........................................................................40
3.7 Other Plans ....................................................................................................................41 3.7.1 Solid Waste Master Plan ...................................................................................41
3.7.2 Climate Action Plan ..........................................................................................42

White Paper Report 3 September 2019
4. WASTE STREAM AND WASTESHED ANALYSIS ..........................................................43 4.1 Wasteshed ......................................................................................................................43 4.2 Population in Market Area ............................................................................................44 4.3 Waste Generation ..........................................................................................................45
4.3.1 Solid Waste ........................................................................................................45
4.3.2 Biosolids ............................................................................................................46
4.4 Solid Waste Composition ..............................................................................................47 4.5 WTE Plant Sizing ..........................................................................................................48 4.6 Heating Value ................................................................................................................49 4.7 Existing Waste Management System ............................................................................50
4.7.1 Collection ..........................................................................................................50
4.7.2 Recycling ...........................................................................................................51
4.7.3 Transfer .............................................................................................................52
4.7.4 Landfill Disposal ...............................................................................................53
5. ENERGY AND MATERIAL MARKETS .............................................................................54 5.1 Establishing Boundary Conditions for Analysis ...........................................................54 5.2 Status of the Electricity Market .....................................................................................55
5.2.1 Renewable Energy .............................................................................................55
5.3 Potential Feed in Tariffs for a Proposed WTE Facility .................................................56 5.4 Electrical Interconnect Requirements ...........................................................................57 5.5 Preliminary Estimate of Energy Production ..................................................................57
6. COST AND PERFORMANCE ESTIMATES .......................................................................59 6.1 Input Assumptions and Elements ..................................................................................59
6.1.1 Operating Revenues ..........................................................................................59
6.1.2 Waste Flow ........................................................................................................60
6.1.3 Waste Composition and Btu Value of Incoming Waste Stream .......................60
6.1.4 Capital Costs ......................................................................................................60
6.1.5 Cost of Debt .......................................................................................................60
6.1.6 Inflation Rate .....................................................................................................61
6.1.7 Gross Electrical Generation ...............................................................................61
6.1.8 Internal Use of Electricity .................................................................................61
6.1.9 Net Electrical Energy Generation ......................................................................61
6.1.10 Average Electrical Energy Sales Price ..............................................................61
6.1.11 Ferrous Metal Recovery Rate ............................................................................61
6.1.12 Non-Ferrous Metal Recovery Rate ....................................................................61
6.1.13 Potable Water Cost ............................................................................................62
6.1.14 Wastewater Disposal/Treatment Cost ...............................................................62

White Paper Report 4 September 2019
6.1.15 Bottom Ash Recycling Rate ..............................................................................62
6.1.16 WTE Operation and Management Cost (Year 1) ..............................................63
6.1.17 Electrical Interconnection Costs ........................................................................63
6.1.18 Site Acquisition Cost .........................................................................................63
6.1.19 MOA Project Management Cost .......................................................................63
6.1.20 Municipality’s Administration Cost ..................................................................63
6.1.21 Alternate Financing Mechanisms ......................................................................64
6.2 Model Results ................................................................................................................64
7. FINDINGS AND RECOMMENDATIONS ..........................................................................66 7.1 Summary of Main Findings ...........................................................................................66 7.2 Roadmap to Implementation .........................................................................................66
7.2.1 Feasibility Study ................................................................................................66
7.2.2 Implementation ..................................................................................................67
7.3 Recommendations for Future Steps and Action Items ..................................................67 7.3.1 Securing Waste Flow Control ...........................................................................67
7.3.2 Conducting a Waste Composition Study ...........................................................68
7.3.3 Developing the Project Team ............................................................................68
7.3.4 Negotiating a Power Purchase Agreement ........................................................68
7.3.5 Select Facility Site and Path to Permitting ........................................................69
7.3.6 Permitting Discussions ......................................................................................69
7.3.7 Deciding on Facility Construction Procurement ...............................................69
7.3.8 Facility Financing ..............................................................................................70
8. REFERENCES .......................................................................................................................71
LIST OF TABLES Table 1: General Overview of Conversion Technologies Table 2: WTE Evaluation Matrix Table 3: Current US EPA Emission Limits for WTE Plants in the U.S. Table 4: Population Projections Table 5: Waste Projections Table 6: Actual Tonnage of Biosolids Produced at the Asplund WWTF (2012-2019) Table 7: Waste Composition Survey Results, Mat-Su Borough, 2019 Table 8: Average Heating Value of Solid Waste Components Table 9: Utility-Filed Avoided Energy Table 10: Project Energy Production Estimates Table 11: Model Results, 1000 tpd Plant, Base Case

White Paper Report 5 September 2019
LIST OF FIGURES Figure 1: Projected Year 1 Tipping Fees By Scenario (Low to High) Figure 2: WTE Facilities in Europe Figure 3: Example of a Mass-Burn WTE Facilty Figure 4: Cross-section of Typical RDF System Figure 5: Typical Hydrolysis Process Figure 6: Typical Gasification System for Power Generation or Chemical Production Figure 7: Typical MSW Anaerobic Digestion Process System Figure 8: Typical Plasma Gasification System Figure 9: Wasteshed Vicinity Map Figure 10: Overview of the MOA Solid Waste System Figure 11: Aerial View of the Central Transfer Station Figure 12: Projected Year 1 Tipping Fee (Low to High)
ABBREVIATIONS AND ACRONYMS
AD Anaerobic Digestion
ARL Anchorage Regional Landfill
AWWU Anchorage Water and Wastewater Utility
ARL Anchorage Regional Landfill
Btu British Thermal Unit
CAA Clean Air Act
Census Bureau U.S. Census Bureau
CO Carbon Monoxide
CO2 Carbon Dioxide
CTS Central Transfer Station
DOE United States Department of Energy
EPA United States Environmental Protection Agency
ESIA Environmental and Social Impact Assessment
ESP Electrostatic Precipitators
GHG Greenhouse Gas
HCl Hydrogen chloride

White Paper Report 6 September 2019
HHV Higher Heating Value
IPP Independent Power Producer
JBER Joint Base Elmendorf-Richardson
kw Kilowatts
kWh Kilowatt Hour
LFG Landfill Gas
Mat-Su Matanuska-Susitna Borough
MOA Municipality of Anchorage
MSW Municipal Solid Waste
MW Megawatt
NOx Nitrous Oxides
O&M Operation and Maintenance
PIC Products of Incomplete Combustion
PM Particulate Matter
PPA Power Purchase Agreement
PPP/P3 Public Private Partnership
PTC Permit to Construct
PTO Permit to Operate
RDF Refuse-Derived Fuel
SOx Sulphur Oxides
SWS Solid Waste Services
tpd Tons Per Day
WTE Waste to Energy
WWTF Wastewater Treatment Facility

White Paper Report 7 September 2019
DISCLAIMER
This Pre-Feasibility Report (Report) was prepared for the Municipality of Anchorage (MOA), Department of Solid Waste Service (SWS) by Geosyntec Consultants, Inc. (Geosyntec) of Anchorage, Alaska, USA to provide a pre-feasibility assessment for development of a waste-to-energy (WTE) project to serve the MOA. This Report was completed in accordance with the scope of work for the Project outlined in the executed agreement between StreamlineAM, LLC and Geosyntec, dated 1 May 2019.

White Paper Report 8 September 2019
EXECUTIVE SUMMARY
In 2018, the Municipality of Anchorage ( MOA) and the Department of Solid Waste Services (SWS) authorized development of an integrated solid waste master plan (ISWMP) in order to optimize its system and assets through improved operational efficiencies, capital improvements and new practices/programs that increase landfill life, improve safety and customer service, protect the environment and increase waste reduction, improve reuse and recycling of materials that are currently disposed of as waste.
As a community of almost 300,000 people, Anchorage generates a large quantity of waste each year (approximately 330,000 tons in 2016). SWS provides refuse collection services within its certificated service area, which services approximately 20% of the population of the MOA, and the remainder is serviced by the private sector. SWS services also include the disposal of solid waste, collection of household hazardous waste, drop off recycling at the Anchorage Regional Landfill (ARL), curbside organics collection within its service area and seasonal food scraps collection programs at both the ARL and the Central Transfer Station (CTS). ARL is the only operating landfill within the MOA and accepts more tonnage than any other landfill in the state.
The purpose of this pre-feasibility study is to implement the recommendations of the ISWMP to evaluate alternative technologies to landfill disposal for addressing SWS and potentially Anchorage Water Wastewater Utility (AWWU) and neighboring solid waste utility’s needs. These include: the appropriate capacity of the Waste-to-Energy (WTE) plant, the reliability and composition of the available waste stream, the scope of the energy and materials use agreements and other fee structures that would be required, and other risks to the financial sustainability of the facility’s operation.
In this Report, Geosyntec presents the criteria and assumptions for recommending the most appropriate biological or thermochemical technology to be considered by the MOA for this project. Mass-burn incineration is recommended, which is the most well-established and reliable WTE technology in the marketplace today. Overall, this Report assumes the development of a 1,000 to 1,200 ton per day WTE facility with associated air emission controls, plus the development of a controlled landfill cell for management of generated ash. It is further assumed that pre- and post-incineration recovery of non-ferrous and ferrous metals, as well as co-incineration of biosolids, will take place, from which additional revenues from sale of secondary materials and tipping fees can be earned. Recycling also helps promote the project’s environmental credentials.
As described within the analyses within this Report, the feasibility of the project is highly dependent upon the ability of the MOA to reliably collect revenue from tipping fees and electricity sales at the facility, with secondary dependence on revenues from ferrous and non-ferrous metals recovered. Therefore, obtaining secure and reliable contracts for both tipping fees and the sale of electricity are foundational to the project in order to generate the revenue needed to pay for financing and operation of the WTE facility.
The readers should be forewarned that it is not within the scope of this White Paper to address all environmental issues related to WTE technology. For example, the character/type of per- and polyfluoroalkyl (PFAS) substances present in the waste stream in MOA is unknown/unquantified at this time and is something that should be studied when SWS is ready to fully characterize

White Paper Report 9 September 2019
waste streams that would be used as municipal solid waste (MSW) feedstock in a WTE facility. As emerging contaminant research evolves, our collective understanding of how WTE technology performs in destroying such compounds will evolve too – and should be part of the detailed evaluations once a WTE technology is settled upon.
Overall, developing a WTE project in the MOA appears a practical goal of the ISWMP and should be desirable by the municipal government, and potentially neighboring Boroughs. A Microsoft Excel™-based, pro forma model (Model) was constructed to help guide the MOA with the implementation steps of the proposed WTE facility project. Various scenarios (36) were constructed using Excel’s Scenario Manager, which will enable the MOA to understand the projected tipping fee impacts of additional tonnage from the neighboring Boroughs, inclusion of biosolids in the incoming waste tonnage to the WTE plant, and potential fee-in tariffs from avoided energy sales to the local electric power utilities.
As shown on Figure 1 below the required tipping fees ranged from $58.04 - $85.67 depending on the scenario assumptions. Scenario 5 (1,000 tpd WTE facility) reveals the lowest projected average tipping fee of $58.04 a ton for the first year of operation (2025).
Figure 1: Projected Year 1 Tipping Fees by Scenario (Low to High)

White Paper Report 10 September 2019
1. INTRODUCTION
1.1 Terms of Reference Geosyntec Consultants, Inc. (Geosyntec) has prepared this Pre-Feasibility Report (Report) for completion of a pre-feasibility assessment and feasibility study for development of a waste-to-energy (WTE) project to serve the MOA. This report was prepared for StreamlineAM, LLC as the client.
The purpose for completing a pre-feasibility study is to reveal potential fatal flaws and identify fundamental questions that must be addressed for the project to continue forward. These include the appropriate capacity of the WTE plant, the reliability and composition of the available waste stream, the scope of the power purchase agreement and other fee structures that would be required, and other risks to the financial sustainability of the facility’s operation.
1.2 Project Understanding The primary purpose of this Report is to provide the MOA with a preliminary understanding of the potential opportunity and challenges associated with implementing a WTE project in the Municipality the near future. Geosyntec understands that the Municipality intends to invest in developing the WTE project subject to resolving several issues, including obtaining a satisfactory power purchase agreement (PPA) and waste delivery contract with refuse collection services within the MOA and neighboring Boroughs.
As a pre-feasibility study that is focused on review of broad economic and demographic factors, an evaluation of specific candidate sites has not been performed at this stage.
1.3 Background and Motivation In 2018, the MOA and the SWS authorized development of an integrated solid waste master plan (ISWMP) in order to optimize its system and assets through improved operational efficiencies, capital improvements and new practices/programs that increase landfill life, improve safety and customer service, protect the environment and increase waste reduction, improve reuse and recycling of materials that are currently disposed of as waste. Within that plan, a recommendation was made to conduct a feasibility study of technology alternatives including biological or thermal treatment for addressing SWS and potentially Anchorage Water Wastewater Utility (AWWU) needs. This pre-feasibility study is the first step in executing upon that recommendation.
Against this backdrop, WTE presents an opportunity to improve solid waste management within the MOA as well as to reduce dependence on fossil fuels for energy. For example, producing and utilizing energy from the combustion of solid waste is a mature technology. Over 2,200 operational WTE facilities exist worldwide, mostly in European and East Asian countries. Much of the motivation behind these WTE projects has been the same concerns that exist in the Municipality regarding improving management of solid waste and developing renewable energy capacity to reduce dependence on fossil fuels. The WTE process can produce about 700 kWh per ton of solid waste, prevent one ton of fossil fuel carbon dioxide release for every ton of waste incinerated, and reduce the community’s landfilling needs by up to 90%.

White Paper Report 11 September 2019
2. WASTE-TO-ENERGY TECHNOLOGY ASSESSMENT
In this section, a brief overview of current commercially available WTE technology is presented along with Geosyntec’s assumptions regarding the most appropriate WTE technology to be considered by MOA for this project.
2.1 The Status of the WTE Industry Worldwide Producing and utilizing energy from the combustion of solid waste is a concept which has been practiced in Europe since the turn of the last century. Prompted by a concern for groundwater quality and the scarcity of land for landfilling, many European countries and Japan embarked on massive construction programs for WTE programs in the 1960’s.
Based on data available from 2018, there are about 2,179 WTE facilities worldwide (Deltaway, 2018). Asian countries (Japan, Taiwan, Singapore, and China) have the largest number of WTE facilities, followed by European and North American countries. Many countries that have aggressively pursued WTE face issues with having limited open space for the siting of landfills and large urban populations. For example, Japan currently manages about 70% of its solid waste in WTE facilities.
2.1.1 United States and Canada Transfer of this technology to North America first began in the late 1960’s and early 1970’s. In addition, many other projects utilizing American technology in shredded and prepared fuels were constructed. Most of these projects were problematic, however, because they were unable to overcome materials handling and boiler operations problems. It was these failures that made local government leaders initially cautious in funding construction of WTE projects.
Nevertheless, several WTE projects were developed in the U.S. in the mid to late 1970’s in communities such as Saugus, Massachusetts; Pinellas County, Florida; and Ames, Iowa which were experiencing severe landfill problems. These three WTE facilities are still processing MSW today. Success of these projects helped the WTE industry gain acceptance by local government leaders, and the financial community. Tax incentives made available by the federal government for WTE projects attracted private capital investment in such projects assisting in the maturing of this industry in the United States and sparked the development of many new projects.
During the 1990s, the WTE industry in the U.S. experienced several setbacks, which resulted in no new WTE facilities being constructed from 1995 through 2014. Expiration of tax incentives, significant public opposition in facility siting, and the U.S. Supreme Court decision in Carbone dealing with solid waste flow control forced many communities in the United States to opt for long-haul transport of their solid waste to less costly regional landfills. A more recent Supreme Court decision on flow control has restored the ability of communities to enact flow control ordinances and enable them to direct their wastes to WTE facilities. As a result, some WTE facilities have recently begun to expand by adding new processing lines to their existing operations. These facilities are basing their requests for financing and permitting on their successful records of operation and environmental compliance.
In 2014, the first new WTE facility since 1995 was constructed by the Solid Waste Authority (SWA) of Palm Beach County, Florida. The SWA's Renewable Energy Facility 2 (REF2) is a

White Paper Report 12 September 2019
$672,000,000, state-of-the-art WTE facility. The REF2 project is the first of its kind in more than 15 years and the most advanced and cleanest WTE power plant in North America.
Recent expansions and additions in the U.S. and Canada include the following installations:
• A retrofit (1,000 tpd unit Tampa, FL in 2000);
• Three expansions (636 tpd WTE unit in Lee County, FL in 2006; 600 tpd WTE fourth unit in Hillsborough County, FL in 2007; and 200 tpd unit in Olmsted, MN in 2010);
• Two new WTE facilities (1,000 tpd unit in Honolulu, HI in 2013, and 3,000 tpd WTE in Palm Beach County, FL in 2015); and
• One new WTE facility was added in Canada (436 metric tpd (480 tpd) WTE in Durham York, Ontario in 2015).
As of this writing, there are currently 77 WTE plants operating in 25 U.S. states managing about seven percent of the nation’s MSW, or about 90,000 tons per day. This is the equivalent of a baseload electrical generation capacity of approximately 2,700 megawatts to meet the power needs of more than two million homes, while servicing the waste disposal needs of more than 35 million people. Three general combustion technologies are utilized in North America for reliable and proven processing of MSW: massburn, RDF (refuse derived fuel), and modular massburn. Massburn is the most commonly implemented combustion technology, with 64 installations (60 in US, 4 in Canada), followed by RDF (12), and lastly, modular (7). Two facilities have a combination of massburn and one other combustion technology (Honolulu and Tulsa). Recent expansions and additions in the U.S. include one retrofit, three expansions, and two new WTE facilities. One new WTE facility was added in Canada (2015).
Confirmed facility ownership arrangements are about half, divided between public (40) and private (42) entities. WTE facilities are typically operated by private (69) entities, while operation by public entities (13) has been gaining traction. It should be noted that the facilities operated by public entities typically have smaller throughput, with the largest publicly operated WTE facility being 800 tpd (Spokane, WA). In the case of the Spokane WTE facility, the City assumed operations from Wheelabrator after the initial 23 years’ operating contract expired. The City essentially hired the Wheelabrator staff and has continued to operate the facility. The capacity of WTE facilities do range widely, from 12 tpd to 3,300 tpd.
Currently, operating WTE facilities located on the west coast of North America include the following:
• Vancouver, British Columbia (850 tpd massburn)
• Spokane, Washington (800 tpd massburn)
• Portland, Oregon (Marion County, 550 tpd massburn)
• Stanislaus, California (800 tpd massburn)
• Long Beach, California (1,380 tpd massburn)

White Paper Report 13 September 2019
Eleven major trends in the North American WTE market include the following:
1. In the US, the higher heating value (HHV) of municipal solid waste appears to be holding steady, or slightly increasing, with many WTE communities processing MSW at greater than 5,000 Btu/lb. This may be primarily related to the growing presence of plastics and other high BTU fuels present in MSW (used tires, asphalt shingles, and rigid plastics).
2. Those communities with WTE exhibit the highest curbside recycling rates suggesting that there WTE is compatible with recycling.
3. Advanced combustion controls for the plants which result in reduced combustion air, improved combustion and burnout of waste, and reduced emissions which require downstream treatments.
4. Addition and upgrade of existing metal recovery systems with advanced ferrous and nonferrous metal recovery systems using high strength magnets and eddy current separator technology. In conjunction with greater recovery of metals from WTE bottom ash, the opportunity for beneficial bottom ash reuse includes aggregates for road base and construction products, along with the partial inclusion as feedstock in the production of Portland cement.
5. Advanced air pollution control systems for reduced use of reagents and chemicals used in treatment processes for reduction of emissions of acid gasses, nitrogen oxides, dioxins, heavy metals, and particulates. WTE facilities have also demonstrated the ability to operate in full compliance with more stringent regulatory emission limits. The new WTE facility in Palm Beach County, Florida is the first WTE facility in the U.S. to employ Selective Catalytic Reduction (SCR) technology for reduced emissions of NOx compounds.
6. Improved operation and maintenance techniques (non-destructive testing for predictive and preventive maintenance such as monthly vibration tests, quarterly oil sampling, infrared thermography, ultrasonic testing for metal thickness, acoustic data, and motor electrical signature tests).
7. Use of reclaimed water for cooling systems, when available, or in many cases, use of air-cooled condensers to minimize need for makeup water and eliminate visible plumes from wet cooling towers.
8. Increase in energy and cost efficiencies by the synergistic usage of the energy (both heat and power) of publicly owned WTE facilities for the community’s own utilities (water, wastewater) and public works and institutional facilities. Hillsborough County, Florida is currently operating one of its waste water treatment and water treatment plants with electricity generated by its 1,800 tpd WTE facility. They are also currently evaluating additional “behind the meter” uses for their internal use of power to include an adjacent Public Works campus.
9. Additionally, the concept for the integration of ISWM with recycling and manufacturing industries in an eco-park have been proposed in number of locations in North America. The new WTE facility in Palm Beach County, FL is located on a 1,320-acre campus which has two WTE facilities, two landfills, a biosolids drying facility powered by landfill gas, and a material recovery facility for processing single stream recyclables.

White Paper Report 14 September 2019
10. Greater attention to plant aesthetics and Leadership in Energy and Environmental Design (LEED)™ standards.
11. Use of special wastes, tires, out-of-date pharmaceuticals and biosolids. For example, the new H-Power WTE facility in Honolulu, Hawaii includes the co-combustion of 80,000 wet tpy of sewage sludge biosolids from wastewater plants on the island. Several other WTE facilities in Florida are permitted to co-combust up to five percent of their incoming wastes as biosolids.
2.1.2 Europe Large numbers of WTE plants (Figure 2) are in Europe, primarily because of regulations that require a 65% reduction in the landfilling of biodegradable MSW by 2030 with a binding landfill target to reduce landfill to a maximum of 10 % of MSW. Nonetheless, a large part of the EU’s waste stream (40%) is still landfilled. These WTE plants converted about 69 million metric tons of MSW (or about 20% of the EU waste stream) generating 30 TWh of electricity and 55 TWh of heat. This is roughly equivalent to supplying the annual needs of 13 million inhabitants with electricity and 12 million inhabitants with heat in these countries. Given the EU’s directive on landfilling, estimates of new WTE facility construction range from 60 to 80 new plants by 2020. Scandinavian counties (Denmark and Sweden) have historically been significant proponents of WTE.

White Paper Report 15 September 2019
Source: Rogoff, 2019.
Figure 2: WTE Facilities in Europe

White Paper Report 16 September 2019
Recent trends in the European WTE industry include the following:
1. Most of the new WTE facilities utilize massburn technology. 2. Dramatic increase in WTE facilities to allow countries to meet very strict landfill reduction
requirements (Landfill Directive, more formally Council Directive 1999/31/EC of 26 April 1999). These reduce raw landfilling of MSW to a maximum of 10%.
3. Implementation of numerous advanced systems for on-line cleaning and operation and maintenance practices for optimization of annual availability.
4. Extensive innovative technologies for maximizing recovery rates of metals, minerals, glass from bottom ash.
5. Incorporation of extensive air emissions control technology, some far more rigorous than the regulatory requirements.
6. Expansion and additions to WTE facilities have also been completed, like the experience in the U.S.
7. Production of refuse derived fuel (RDF) and combustion of the RDF in fluidized bed combustion units, cement kilns and grate fired boilers to allow for more flexibility in waste composition, with the realization that the requirements for fluidized bed combustion are more stringent regarding impurities (metals, C&D waste).
8. Widespread use of distributed heating, including use of hot water for community benefits, such as heating community centers, pools, greenhouses, and adding community specific unique architectural features that offer new economic opportunities, such as the slope/hiking trail feature which has been constructed over much of a new WTE facility in Copenhagen, Denmark.
2.1.3 China Economic development and rapid urbanization in China over the past few decades have resulted in a rapid generation of 200 million tons MSW requiring disposal in 2016. Currently, one of the largest markets for WTE plant construction is in China. According to the World Bank, China surpassed the United States as the largest generator of MSW in 2004. This has produced an unprecedented trash crisis in many of its cities. Due to a deficiency of land for continued landfilling of MSW, China has embarked on a major construction program of WTE facilities.
The Chinese WTE capacity has increased steadily from 14 million tons in 2007 to nearly 75 million tons by 2016, although landfilling remains the dominant means of waste disposal in China. Since the beginning of the 21st century, China has become the fourth largest user of waste-to-energy (WTE), after the EU, Japan, and the US, with most plants (259) located in the heavily industrialized cities in southeastern China. China is building an average of 50 new WTE facilities every year. Almost all these new WTE facilities utilize massburn technology. The world’s largest WTE facility is currently being designed for the city of Shenzhen and will include six processing lines with a total capacity of 5,600 tpd. This plant is essentially two plants located side by side and under a common roof. It will also provide electricity to produce 125 mgd of desalinated potable water.

White Paper Report 17 September 2019
2.2 Criteria and Assumptions for Technology Selection One of the first questions an agency must answer is what technology will be chosen to convert its solid waste into energy. Each agency or developer must identify and evaluate the various WTE technologies that are available and make its own selection based upon the requirements specific to its project. This includes consideration of factors (which will be discussed later) such as: available energy and materials markets; the size of the community’s waste flow; capital and operating costs; ownership and financing considerations; and the level of risk to be assumed by the community or the facility owner.
In evaluating whether one technology better suits its needs than another, a community may often discover that one or more of their goals established for the project may conflict with others. A technology, for example, may produce the greatest amount of energy for the MOA’s waste, albeit at the highest projected capital and operating costs. The selection of a technology, therefore, is not a simple one, but one which can require tradeoffs between one agency’s goal with others. Since the risks associated with WTE technology can be substantial, it is critical that MOA attempt to minimize these risks at best it can. The following criteria can be utilized to assess the relative risk of a WTE technology:
• State of Technology – This addresses the documented track record of the vendor(s) with both pilot and commercial facilities. Some technologies only have been proven in pilot or laboratory operations, or with raw materials other than municipal solid waste. Other technologies have only been commercially operated in small facilities and the scale up to larger sized plants may result in unforeseen problems. The operational history of all process steps, from waste receipt through energy conversion to management of material side streams and residuals are considered under the state of the technology. Specific factors assessed include waste types and quantities processed, demonstrated operational reliability, predictable electricity generation.
• Technical Performance - This criterion addresses the ability of the WTE technology to address the full spectrum of the potential needs of the users and rate payers of the solid waste management system. Also addressed is whether the proposed process can safely and efficiently process the types of wastes which are generated by the MOA solid waste system users, the need for source separation and/or pre-treatment (removal of items, sorting, and size reduction). The percentage of waste by-passed to the landfill or other waste disposal options is also of importance.
• Technical Resources – This criterion addresses whether vendors are available to bid on the project and can provide continuing local resources. Typically, emerging technologies often will have one project leader. The preferred case would be for the vendor to have a broader pool of resources that can sustain the project in case these project technical leaders move on.
Based on these criteria, there are currently only two widely used and commercially available WTE technologies that should be considered by the Municipality – mass-burn and refuse-derived fuel (RDF). It is noted that there are several other “next generation” technologies (e.g., fluidized bed and gasification) that are used in a limited number of WTE facilities in advanced economies, often at relatively small scale. However, because the vast majority of WTE facilities currently

White Paper Report 18 September 2019
operating throughout the world are either mass burn or RDF plants, these are considered the two technologies that could meet the above criteria for further consideration by the MOA.
2.3 Mass Burn WTE Technology Mass-burn refers to WTE technology that incinerates minimally processed solid waste. An illustration of a typical mass-burn WTE facility is shown in Figure 3 overleaf. Major components of a mass-burn facility include:
• A structure to house the furnace and its appurtenances;
• A tipping floor where the solid waste from collection and transfer vehicles is unloaded;
• A large storage pit that is sized to allow two to three days storage or stockpiling of refuse so that plant operations can continue over weekends and holidays when deliveries will not occur (WTE plants operate on a seven-day per week, twenty-four hour per day basis; storage space is provided to enable this continuous operation);
• A charging system (normally overhead cranes, but could also be a front-end loader and conveyor combination), which mixes the various solid wastes received to develop a somewhat uniform material and then moves it from the storage pit or floor to feed (charge) the furnace;
• One or more furnace systems (sometimes referred to as combustion trains or units) that burn the solid waste to heat the boilers, generating steam to power electricity generating turbines;
• A stoker unit to move the solid waste through the furnaces; the most common stoker designs being: o Reciprocating grates: This grate design resembles stairs with moving grate sections
which push the solid waste through the furnace; o Rocking grates: This grate design has pivoted or rocking grate sections which
produce an upward and/or forward motion to move the solid waste through the furnace; or
o Roller grates: This grate design has a series of rotating steep drums or rollers which agitate and move the solid waste through the furnace;
• Air pollution control subsystems to treat combustion gases; and
• An ash handling subsystem to manage the fly ash and bottom ash produced from the combustion of solid waste.

White Paper Report 19 September 2019
Figure 3: Example of a Mass-Burn WTE Facilty
Notes: 1. Inbound truck scales; 2. Tipping floor; 3. Waste storage pit; 4. Cranes; 5. Feed chute; 6. Feed table; 7. Incineration grates; 8. Furnace; 9. Secondary air injection; 10. First path; 11. Boiler; 12. Electrostatic precipitators; 13. Flue gas cooling tower; 14. Scrubber; 15. Lime injection; 16. Activated carbon metering bin; 17. Baghouse; 18. Blower; 19. Stack; 20. Sludge filter press; 21. Sludge dryer; 22. Dryer gas exhaust; 23. Ash extractor; 24. Bottom ash pit; 25. Wastewater tank; 26. Wastewater treatment; 27. Boiler feedwater purification; 28. Maintenance workshop; 29. Dry sludge loading; 30. Spare parts storage. Source: Deltaway Energy, Inc. The only waste pre-processing that occurs as part of the mass-burn WTE operation is the removal of large or unusual objects from the waste stream that would otherwise be a problem or cause damage if fed into the furnace. Examples include very large metal or concrete objects, appliances, telephone poles, or compressed gas cylinders. The operator that charges the furnace is also responsible to visually monitor the nature of the incoming waste so that materials with different moisture contents (e.g., food and plant wastes are relatively wet, while paper and plastics are usually dry) are gradually mixed to achieve a relatively uniform moisture content.
In modern waterwall incinerators, proper combustion of the waste is achieved through the introduction of air at two locations in the furnace. One location introduces air underneath the grate system (underfire air), the second location introduces air above the burning waste (overfire air). During the combustion process, flue gases, which are heated to temperatures as high as 1,800 degrees F, move from the furnace through the boiler tube section, where the contained water is heated to form saturated steam and dry steam. The flue gases continue through the economizer section to the air pollution control device, such as an electrostatic precipitator, baghouse, or acid gas scrubber, where the flue gases are cleaned before being released into the atmosphere through a stack.
After the combustion process is completed, the grate system or rotary combustor gradually moves the waste onto the burnout grate where it is discharged into a wet or dry ash handling system that cools the residue and prevents dust from being created. The bottom ash that is produced from the combustion process in the furnace, and the fly ash or other materials produced in the air pollution control device, are transported to landfills by truck or to a temporary onsite

White Paper Report 20 September 2019
ash storage pit for later transport. The bottom and fly ash may be combined or handled separately.
Mass burn incineration produces ash residues amounting to 15 to 30% by weight and 5 to 10% by volume of the incoming solid waste. The amount of ash is dependent of the composition of the waste being incinerated. Generally, recovery of ferrous metals from the ash residue is possible in mass-burn WTE by using magnetic separators (with or without trommels). Some systems recover the remaining non-magnetic fraction in the ash, such as aluminum and glass, using various trommels, screens, jigs and fluid separators.
Mass burning incinerators have been used in Europe and Japan for municipal solid waste disposal for nearly 70 years where their acceptance has been rapid and widespread. With over thousands of facilities in operation worldwide in sizes ranging from 18 to 4,200 tons per day, mass fired incineration is the most thoroughly demonstrated technology in the WTE field at this time.
This technology was introduced into the United States in 1967 at the U.S. Naval Station in Norfolk, Virginia with the construction of a 360 ton per day waterwall plant to produce process energy for the Naval Shipyard. This plant was designed in America and equipped with American equipment. Later plants, which were constructed, were almost entirely designed using state-of-the-art European mass incineration technology.
The introduction of European technology into the United States has not been without difficulties and several of the earlier constructed plants encountered some mechanical problems. These highly reliable and rugged European systems had been designed to burn solid waste that was somewhat different in composition than American wastes. Consequently, systems that had been designed for European conditions required designers to adjust in the grate areas and furnace heat release rates of American plants. In addition, the higher chloride corrosion of the superheaters in American plants meant that designers needed to change the metallurgy of these boiler tubes, as well as limiting the upper stream pressures and temperatures to minimize tube corrosion. Scale-up problems also had to be overcome since many of the European units were designed for the 300 to 500 tons per day range. These problems have been corrected, and most mass-burn systems that have been constructed are still in operation today.

White Paper Report 21 September 2019
2.4 Refuse Derived Fuel (RDF) Systems Several American corporations have developed technologies that pre-process solid waste to varying degrees to separate the non-combustibles from the waste stream. By undergoing processing steps of hammering, shredding, or hydropulping, the combustible fraction of the waste is transformed into a fuel, which can then be fired in a boiler unit specifically dedicated for this type of refuse-derived fuel, or co-fired with another fuel, such as coal, shredded tires, or wood chips. The fuel produced can thus be utilized in equipment that can have higher efficiencies than mass-fired units resulting in greater electricity or steam output. However, the front-end processing of the solid waste into a fuel has been one of the problem areas of this type of refuse disposal technology.
2.4.1 Processing Systems The processing of solid waste into a refuse-derived fuel has been approached using dry processing systems, and more recently organic processing system.
Since the early 1970's, there have been several dozen facilities which have been constructed in the United States to process solid waste into a refuse-derived fuel using dry processing systems. Such dry processing systems are classified according to the type of products that can be produced: fluff RDF, densified RDF, and powdered RDF. A cross-section of a typical RDF system is illustrated in Figure 4.
Given the number of potential products, the type of specific technology used to process the solid waste into a refuse derived fuel can vary from one location to another. Typically, however, solid waste delivered to an RDF facility is unloaded onto the receiving floor, or at some locations into a refuse storage pit. The waste is then transported with the use of a feed conveyor system to a size reduction unit, which reduces the particle size of the waste. At many facilities, machinery such as flail mills, trommels, and magnetic separators, are used to pre-sort the waste prior to its being fed into a hammermill or shredder for size reduction. Depending on the particular type of RDF fuel required, further processing equipment is utilized after shredding, such as air classifiers, densifiers, and trammel screens. The end result of the dry processing system is a refuse-derived fuel which can be combusted in either existing utility boilers, or in boilers specifically designed for the type of RDF produced (dedicated boilers).

White Paper Report 22 September 2019
Figure 4: Cross-Section of Typical RDF System
For many years, the plan of burning RDF in existing electric utility boilers seemed an obvious solution for communities which needed a good way to dispose of garbage. It was hoped that existing boilers and air pollution control equipment could be utilized thus saving these communities considerable capital expense. Since the early 1970s, RDF has been tried, however, as a supplemental utility fuel with mixed success. Since 1970, utilities in the United States have co-fired RDF in their system boilers; only three are still burning RDF.
Shortly after the beginning of the first demonstration project in St. Louis in 1972, it became apparent that burning RDF in utility boilers resulted in a lowering of their normal efficiency and reliability. When RDF was fired in the high temperature, utility boilers, the non-combustible materials in solid waste, such as glass and metals, melted into slag that fouled the boiler tubes, heat exchangers, and furnace walls. Burning of the plastic compounds in the solid waste, which released chlorine, also resulted in increased corrosion of boiler parts. In addition to these problems, ash handling, air pollution control, and materials handling systems soon became overloaded and were subject to frequent outages. In short, what had seemed to be a good way to dispose of solid waste resulted in an unexpected headache for utilities. The initial optimism of this technological fix to solve an emerging garbage disposal problem has consequently not been realized.
The recent emphasis on burning RDF has focused on systems using "dedicated" industrial type boilers. The term "dedicated" refers to a boiler system that is specifically designed and

White Paper Report 23 September 2019
constructed to burn RDF as its primary, not supplemental, fuel. There are a variety of different types of technologies which had been used in such boilers: suspension-fired; semi-suspension fired (spreader stoker); pyrolysis; and fluidized bed.
The semi-suspension fired or spreader-stoker, furnace boiler is perhaps today's most commonly utilized technology. Spreader-stoker technology has been utilized successfully for decades for incineration of a variety of different solid fuels. With this system, RDF, which has been previously prepared to specific size characteristics, is introduced at a controlled rate to pneumatic RDF distributors located at the front wall of the furnace. High-pressure air is delivered to these distributors to assure that the RDF is fed evenly.
The RDF, so introduced, ignites over the grate area and burns partially in suspension. Materials, which are left unburned, fall to the traveling stoker where they are combusted before the ash is discharged.
The experience with these RDF systems has varied. It appears that most installations have had problems with RDF feeder equipment resulting in extensive retrofits and technical modifications. However, where high quality RDF has been introduced with most metals and glass removed, the RDF burning experience has generally been good. On the other hand, the experience of co-firing of RDF with coal has been generally poor. The combination of coal and RDF appears to increase problems with ash clinker and slagging and wear of the lower furnace walls.
In summary, RDF with waste shredding was supposed to be smart move to be able to burn garbage in a “cheaper” biomass or coal designed boiler. However, the cost of shredding and the safety risk involved is not optimal. Feeding is a major headache and “biomass” boiler with only one combustion empty path is generally cost prohibitive to maintain, is costlier and requires a huge site footprint.
In recent years, a “second generation” RDF facility design has evolved to best process waste with low energy content where incoming waste Low Heating Value (LHV) is lower than 5,800 kJ/kg. The facility treats the waste into RDF, where recyclables and organic matters have been removed to raise LHV of the RDF above 5,800 kJ/kg. It combined a simple front-end processing with a mass burn unit on the back. The front-end processing unit does not shred the waste, but is used only to open bags, sort, recycle, remove most of organic content, and increase waste LHV. The organic fraction is either sent to the landfill or to an anaerobic digester to produce biogas. This is the new wave of WTE plant that is adapted for emerging countries where waste contains a high percentage of putrescible that is greater than 40%.
2.5 Emerging Waste Conversion Technologies Since 2004, several municipalities commissioned reports in order to evaluate new and emerging waste management technologies and approaches. New York City, the City of Los Angeles, Los Angeles County, and King County, WA are among the municipalities that commissioned studies in waste conversion technology. There are many technologies currently being proposed for the treatment and disposal of MSW throughout the world. Most of these involve thermal processing, but some others comprise biological or chemical decomposition of the organic fraction of the waste to produce useful products like compost, chemical feedstocks,

White Paper Report 24 September 2019
or energy products. Technologies include the following: pyrolysis, gasification, anaerobic digestion, mixed waste composting, plasma arc, and chemical decomposition.
2.5.1 Summary of Technologies Table 1 provides a very general comparative overview of these technologies. Throughout this section, we use the terms conversion technologies and alternative technologies interchangeably to describe technologies that are being considered for MSW processing and conversion to energy and other products.
Table 1: General Overview of Conversion Technologies
Technology Amenable Feedstock
Feedstock Requirements Emissions/Residues
Acid or Enzyme Hydrolysis
Cellulosic material Cellulosic feedstock Wastewater, CO2
Gasification Biomass, MSW Drier feedstock, high carbon
Ammonia, NOx, tars, oil
Anaerobic Digestion Manure, Biosolids Wet material, High nitrogen
Wastewater, CH4, CO2, H2S
Plasma Arc MSW High carbon, high hydrogen content
Slag, scrubber water
Hydrolysis is a chemical decomposition process that uses water to split chemical bonds of substances. There are two types of hydrolysis, acid and enzymatic. Feedstock that may be appropriate for acid or enzymatic hydrolysis typically is plant-based materials containing cellulose. These include forest material and sawmill residue, agricultural residue, urban waste, and waste paper.
Ethanol facilities could be co-located at MRFs (Material Recovery Facilities) where existing materials are already collected, and the existing solid waste transportation infrastructure could be utilized. Ethanol facilities co-located at MRFs could take advantage of the existing solid waste collection and transportation infrastructure. Figure 5 includes a typical hydrolysis process.

White Paper Report 25 September 2019
Figure 5: Typical Hydrolysis Process
2.5.1.1 Gasification Gasification is a process that uses heat, pressure, and steam to convert materials directly into a gas composed primarily of carbon monoxide and hydrogen. Gasification technologies differ in many aspects but rely on four key engineering factors:
• Gasification reactor atmosphere (level of oxygen or air content).
• Reactor design.
• Internal and external heating.
• Operating temperature.
Typical raw materials used in gasification are coal, petroleum-based materials, and organic materials. The feedstock is prepared and fed, in either dry or slurried form, into a sealed reactor chamber called a gasifier. The feedstock is subjected to high heat, pressure, and either an oxygen-rich or oxygen-starved environment within the gasifier. Most commercial gasification technologies do not use oxygen. All require an energy source to generate heat and begin processing.
There are three primary products from gasification:
• Hydrocarbon gases (also called syngas)
• Hydrocarbon liquids (oils)
• Char (carbon black and ash)

White Paper Report 26 September 2019
Syngas is primarily carbon monoxide and hydrogen (more than 85 percent by volume) and smaller quantities of carbon dioxide and methane. Syngas can be used as a fuel to generate electricity or steam, or as a basic chemical building block for a multitude of uses. When mixed with air, syngas can be used in gasoline or diesel engines with few modifications to the engine.
As in the case of ethanol conversion facilities, gasification facilities could be co-located at MRFs to take advantage of the current solid waste transportation infrastructure. In addition, co-location at MRFs would ensure that recyclable materials would be removed beforehand and only residuals would be sent to a gasifier. If a gasification facility is co-located at a landfill that accepts MRF residuals, the gasification facility could utilize landfill gas in the gasification process or could work in tandem with a landfill gas-to-electricity project. Figure 6 shows a typical gasification system.
Figure 6: Typical Gasification System for Power Generation or Chemical Production
Seven plants with this technology are currently operating in Japan, with at least two of them firing MSW. The largest of these plants in Kurashibi has a reported boiler size of 185 tpd, with three units of this size. Another gasifier marketed for MSW is built by EnTech of Devon, England. They have constructed approximately 20 of these facilities, which are in operation on MSW in Europe and Asia. Most of them are relatively small (less than 10 tons per day), with none designed for more than 70 tons per day throughput.
2.5.1.2 Anaerobic Digestion Anaerobic digestion is the bacterial breakdown of organic materials in the absence of oxygen. This biological process produces a gas, sometimes called biogas, principally composed of methane and carbon dioxide. This gas is produced from feedstock such as biosolids, livestock manure, and wet organic materials.
White Paper Report 27 September 2019
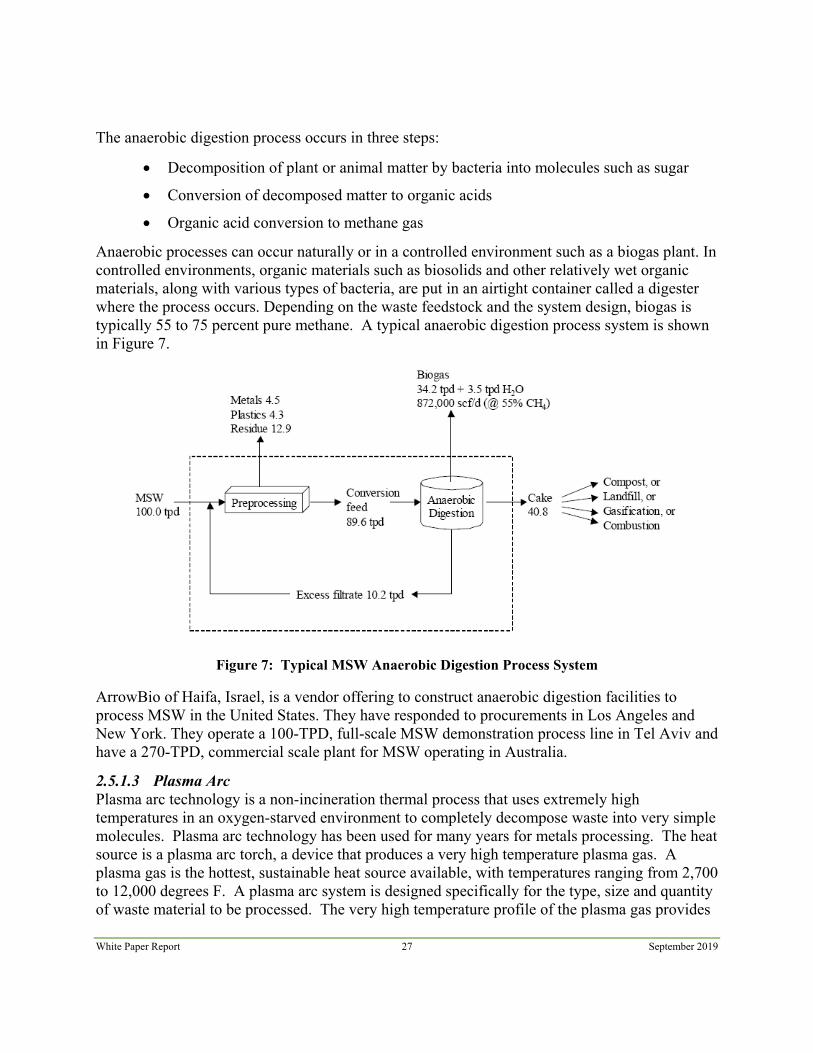
The anaerobic digestion process occurs in three steps:
• Decomposition of plant or animal matter by bacteria into molecules such as sugar
• Conversion of decomposed matter to organic acids
• Organic acid conversion to methane gas
Anaerobic processes can occur naturally or in a controlled environment such as a biogas plant. In controlled environments, organic materials such as biosolids and other relatively wet organic materials, along with various types of bacteria, are put in an airtight container called a digester where the process occurs. Depending on the waste feedstock and the system design, biogas is typically 55 to 75 percent pure methane. A typical anaerobic digestion process system is shown in Figure 7.
Figure 7: Typical MSW Anaerobic Digestion Process System
ArrowBio of Haifa, Israel, is a vendor offering to construct anaerobic digestion facilities to process MSW in the United States. They have responded to procurements in Los Angeles and New York. They operate a 100-TPD, full-scale MSW demonstration process line in Tel Aviv and have a 270-TPD, commercial scale plant for MSW operating in Australia.
2.5.1.3 Plasma Arc Plasma arc technology is a non-incineration thermal process that uses extremely high temperatures in an oxygen-starved environment to completely decompose waste into very simple molecules. Plasma arc technology has been used for many years for metals processing. The heat source is a plasma arc torch, a device that produces a very high temperature plasma gas. A plasma gas is the hottest, sustainable heat source available, with temperatures ranging from 2,700 to 12,000 degrees F. A plasma arc system is designed specifically for the type, size and quantity of waste material to be processed. The very high temperature profile of the plasma gas provides

White Paper Report 28 September 2019
an optimal processing zone with the reactor vessel through which all input material is forced to pass. The reactor vessel operates at atmospheric pressure.
The feedstock can be almost completely gasified, while non-combustible material, including glass and metal, is reduced to an inert slag. The product gas typically has a heating value approximately 1/4 to 1/3 the heating value of natural gas (natural gas has a value of approximately 1,040 Btu/standard cubic foot); therefore, it may be used as an efficient fuel source for industrial processes, including the generation of electricity, and the production of methanol and ethanol. The slag can be used in the construction industry or for road paving. All other byproducts, such as scrubber water and cyclone catch material, can be recycled into the process for reprocessing to alleviate disposal requirements. A typical plasma gasification system is shown in Figure 8.
Figure 8: Typical Plasma Gasification System
There are no commercial-scale plasma arc facilities processing MSW in the U.S., although several companies are marketing some form of this technology and proposing facilities. There are three small plasma arc facilities processing MSW and/or auto-shredder residue in Japan reportedly using the Westinghouse plasma reactor. Few, if any of the plasma arc pilot facilities have been able to generate a fuel gas, and air emissions have been found to be no better than conventional incineration systems.
Two Canadian firms offer advanced gasification. Enerkem, headquartered in Montreal, Quebec, had an operating pilot gasification facility in Sherbrooke, Quebec, and built a commercial facility in Edmonton, Alberta, which processes 100,000 tpy which produce ethanol from the gas using a thermal/chemical process. The Plasco Energy Group, which had a 5 tpd research facility in Spain and operated a 400 tpd plant in Ottawa, Ontario. Both facilities have since closed due to mechanical issues.

White Paper Report 29 September 2019
2.5.2 Microwaves Microwaves can be used as the external heat source for chemical decomposition or depolymerization. Microwave systems have been built to decompose some special wastes, particularly tires. Goodyear obtained a patent to “de-vulcanize” tires and built a facility in Lincoln, NE to process in-plant scrap in the late 1970s. Several small units have been operated on tires. The application of microwaves to drying and decomposition of various wastes, including medical waste and nuclear waste, is proven, but its application to municipal solid waste has not been proven.
2.6 Evaluation The main difference between mass-burn and RDF technologies is that RDF requires pre-processing of the incoming solid waste to separate some of the non-combustibles and then shredding the remaining material to create a pelletized fuel that can be fired in a dedicated boiler unit. This additional front-end processing effort is performed in order to achieve higher energy efficiencies than mass-fired units. However, experience has shown that the front-end processing of raw solid waste into RDF is expensive and operationally intensive, with the shredders and pelletizers requiring significant routine and non-routine maintenance. Although touted as a step forward from mass-burn in the 1980s and 1990s, as a result of these additional challenges, RDF has not become as widespread a technology for WTE as mass-burn. RDF remains a distant second to mass-burn in the number of facilities in operation worldwide. The newer waste conversion technologies, which were discussed in the previous section, have emerged as potential waste processing technologies in the future. Experience to date has been spotty at best with a few plants closing due to technical design challenges that could not overcome even with significant infusions of capital.
In assessing the applicability of waste processing technologies for the MOA, one must consider the overall track record of each, including the operational/commercial experience of the technology, the size and scale of the successful facilities, their environmental performance and impacts, their overall economics, their reliability over time, and the availability of financially strong companies to offer them under full service arrangements.
Table 2 is a matrix summarizing the overall performance of the technologies reviewed in this white paper. Several columns address the technology, whether it has been employed commercially at the scale required for handling MOA’s (1,000 to 1,200 tpd) and its expected reliability. Based on the need to minimize risk and operational costs, Geosyntec considers mass-burn WTE technology to be the preferred and only option for further consideration by the MOA for this project.

White Paper Report 30 September 2019
Table 2: WTE Evaluation Matrix
Description of Criteria
TECHNOLOGY
Comments Massburn RDF Waste Conversion
State of Technology
Degree to which system has been proven on a commercial scale
Commercially proven over the past 50 years Commercially proven over the past 25 years at numerous plants
Few facilities have long term proven operating experience
Identify status of technology: Bench Scale, Pilot, Demonstration (0-3 years), or Commercially Proven (+3 years)
Operating History Yes, well proven >80 plants and over 1,000+ plants worldwide
5 RDF processing and WTE plants in U.S. Several facilities in Japan and Canada How many operational plants and years of successful operation have been shown?
Freedom from high risk failure modes Yes, mature industry addressing high risks with design codes and operational procedures
High potential for shredder explosions has been experienced
A few very key projects have failed after major developer investment to correct major design and operational issues
Are there identified design problem areas with mitigation measures implemented to prevent high risk situations?
Demonstrated reliability of entire system Yes, >92-96% plant availability, many facilities have life spans exceeding 20-30 years
Yes, high reliability (87%) has been demonstrated Uncertain reliability at the current time at the size range anticipated by the MOA
What is the capacity and throughput and the historical annual plant availability?
Technical Performance
Compatibility with the full spectrum of MOA waste stream
Yes, for the typical MSW waste stream, limited percentage of tires, HHW, treated lumber, mercury containing devices, limited percentage of tires, some co-combustion of biosolids
Yes, except non-processible materials removed prior to combustion
Requires significant pre-processing of the waste stream with current technology
Is the process compatible with the full spectrum of MOA potential needs (residential, commercial, HHW, C&D, medical wastes, E-waste, special wastes
Ability to produce marketable byproducts Yes, gross electricity (>600 kwh per ton, hot water, steam, ferrous and non-ferrous metals, aggregates for landfill cover
Yes, electricity, hot water, steam, ferrous and non-ferrous metals, aggregates for landfill cover
Unknown due to the lack of commercially proven facilities
Does the technology produce a viable commodity that can be sold to a large local or regional market? What type of marketable by-products are produced?
Need for pre-processing No, other than removal of a small percentage of bulky items (<1%) of waste delivered
Yes, the RDF process extracts metals, glass, and inert materials to create an RDF fuel for combustion
Requires significant pre-process to an engineered fuel for further processing
Does the process require source separation, sorting, or sizing
Technical Resources
Proven contractor experience with technology Yes Yes Uncertain Are there vendors who have direct and applicable experience in the receipt, storage, handling, and processing of MSW
Proximity of technical support U.S. based vendors U.S. based vendors Uncertain, vendors based in Europe or Asia Do vendors have local resources to provide on-going technical support for the process, or will the support be based in the U.S. or offshore?
Availability to provide support on continuing basis U.S. based vendors with significant pool of experienced professionals
U.S. based vendors with significant pool of experienced professionals
Uncertain, vendors based in Europe or Asia Is there a key project leader without whom the project may fail, or does a broader industry team if a project leader becomes unavailable?

White Paper Report 31 September 2019
3. ENVIRONMENTAL AND PERMITTING CONSIDERATIONS
The environmental permitting process for WTE facilities can be potentially the most time-consuming and controversial step on the road to project implementation. This is due in large part to the extensive data needed for such projects, which often must be submitted to lenders and governmental agencies in the form of detailed permit applications and environmental impact statements. Section 3.6 provides a general overview of the major environmental permitting steps that should be expected. Prior to that, however, Section 3.1 provides a general review of the main environmental benefits of WTE over other solid waste management options such as landfills, while Sections 3.2 to 3.5 discuss operational aspects of mass burn WTE plants that may impact permitting and facility development decisions. When discussing permitting issues with governmental officials and the general public it is often beneficial to reiterate the environmental benefits of a WTE facility. Focusing on these benefits can help ease the decision-making process during the multiple steps involved in permit review and approval.
The readers should be forewarned that it is not within the scope of this White Paper to resolve all environmental issues related to WTE technology. For example, the character/type of per- and polyfluoroalkyl (PFAS) substances present in the waste stream in MOA is unknown/unquantified at this time and is something that should be studied when SWS is ready to fully characterize waste streams that would be used as MSW feedstock in a WTE facility. As emerging contaminant research evolves, our collective understanding of how WTE technology performs in destroying such compounds will evolve too – and should be part of the detailed evaluations once a WTE technology is settled upon.
3.1 Environmental Benefits WTE facilities have several environmental benefits over other solid waste management solutions as outlined below.
WTE is Renewable Energy: Solid waste is typically comprised of over 50% biogenic materials, which are derived from biological processes. Combusting the biogenic fraction of solid waste in a WTE process is considered renewable energy generation by the U.S. Department of Energy (DOE). Similarly, European Council Directive 2000/76/EC considers biomass combustion a renewable energy source and defines biomass as including the biodegradable fraction of solid waste.
Reduces Greenhouse Gas (GHG) Emissions: Although WTE plants emit carbon dioxide (CO2), which is the primary greenhouse gas accumulating in the atmosphere, a portion of these CO2 emissions is considered to be part of the Earth's natural carbon cycle. The plants and trees that make up the paper and food waste (i.e., biogenic materials) in solid waste removed CO2 from the atmosphere while they were growing, and this biogenic CO2 is returned to the atmosphere when this material is burned. In contrast, when fossil fuels are burned to produce energy, they release fossil CO2 that has not been part of the Earth's carbon cycle for a long time (i.e., within a human timescale).

White Paper Report 32 September 2019
Reduces Use of Fossil Fuel for Electricity Production: Every ton of solid waste processed in a WTE facility avoids consumption of about one barrel of oil (or an equivalent quantity of natural gas) for electricity production. Combusting waste in WTE facilities can also eliminate the environmental impacts associated with the drilling and processing of oil or other conventional, non-renewable fossil fuels. Fossil fuels such as coal, oil, and natural gas not only generate emissions of CO2, sulfur dioxide, and nitrogen oxides during combustion but also emit methane, a potent GHG, during their processes of mining, transportation, and combustion.
Reduces Truck Traffic and Related Emissions: Assuming the WTE facility is developed close to where the generated is generated, only local transportation is required. Assuming construction of a WTE facility within the Anchorage Bowl will reduce truck traffic to the Anchorage Regional Landfill. This will reduce fuel consumption and CO2 and other emissions from waste collection and transfer trucks.
Produces Clean, Reliable Energy: WTE technology is advanced and results in limited emissions. The U.S. Environmental Protection Agency (EPA) has concluded that modern WTE facilities produce electricity with less environmental impact than almost any other source. WTE facilities operate continuously and help reduce base load fossil fuel generation. Further, WTE facilities can be in proximity to urban areas where the power is needed the most. In these locations, the fuel feedstock for the facility – solid waste – is reliably generated by the urban population.
Reduces Reliance on Landfills: WTE facilities reduce the need for landfills and preserves natural resources that can otherwise be impacted by a landfill. The incoming solid waste is reduced to ash, which is only about 10% of the original volume. The potential environmental impact to groundwater and air quality of disposing of WTE ash in a landfill is generally much lower than that of a solid waste landfill.
Superior Performance to Landfills: WTE reduces GHG emissions, mainly by avoiding methane emissions at landfills. This is because WTE facilities recover the energy in waste much more efficiently than a landfill equipped with landfill gas (LFG) recovery. Methane is produced at landfills when the buried waste decomposes anaerobically. This methane can be captured in LFG collection systems. Data from these systems suggests that capture rates vary dramatically based on design and local conditions. As a result, large percentage of methane produced gets emitted as a GHG. A WTE plant that generates 100 MW will emit 38 tons of CO2 per hour. Over a 20-year period, the WTE facility would emit 6.7 million tons of CO2. Using the LFG generation model developed by the United Nations Intergovernmental Panel on Climate Change (IPCC), if the same amount of solid waste used to power a 100 MW WTE facility was instead disposed of at a landfill, the total methane emissions over a 20-year period would be equivalent to 28.7 million tons of CO2. By this measure, WTE is over four times more efficient than landfills at managing methane emissions from solid waste disposal.
Complements Recycling: WTE facilities recover and recycle ferrous and other metals that pass through the combustion process and end up in the bottom ash. This reduce future reliance on mining operations.
White Paper Report 33 September 2019
3.2 Odor and Dust Management Odor is not a significant problem as mass burn WTE plants are enclosed structures. WTE plants are typically designed such that odors from the tipping floor, waste storage pit, and ash storage areas are controlled by operating these areas under negative air pressure (i.e., air being drawn in from the outside) and exhausting the air from these areas to the furnace, where the air is used to aid combustion. Hence, any odorous compounds in the incoming municipal solid wastes are thermally destroyed during the plant’s operation. Operating under negative pressure also minimizes the release of fugitive dust from the areas of the plant where ash is released from the combustion area.
3.3 Air Emissions Control and Monitoring Air emissions control at mass burn WTE facilities may include the removal of particulate matter (PM) as well as scrubbing the flue gas of gaseous pollutants. For PM control, baghouses are the most commonly used means for WTE facilities to manage these emissions. Compared with other PM control technologies, baghouses have many decades of proven operating experience as highly cost effective, reliable, and easily serviceable PM control technologies that is robust to the high temperature of the WTE flue gas that would impair the effectiveness of many other control devices. With proper maintenance, baghouses can maintain PM removal efficiencies of 99% or more.
In addition to PM removal, many WTE facilities also employ emissions control equipment to remove gaseous pollutants such as hydrogen chloride (HCl), sulfur oxides (SOx), nitrous oxides (NOx), heavy metals such as cadmium, mercury, and lead, and products of incomplete combustion (PIC), including carbon monoxide (CO) and organics such as dioxins, furans, and PFAS. Polyfluoroalkyl substances (PFAS) are a class of chemicals used in a variety of products for the past 80 years. Despite their many beneficial uses, these chemicals have been dispersed around the world because of their use in thousands of industrial, food and textile applications. These compounds are found in biosolids. While there is limited research data in the solid waste industry, it appears that high-temperature incineration in a WTE facility is the best management strategy. More research in this area needs to be done.
Several technologies are available and in operation at multiple WTE facilities around the world to control emissions of these pollutants. These include wet or dry scrubbers, activated carbon or baghouse filters, and catalytic or non-catalytic reaction vessels. The specific technology and size of the air emission control equipment to be used for scrubbing non-particulate matter from WTE emissions varies depending on the regulatory limits placed on the air emissions to be permitted from the WTE facility.
Most WTE facilities are required to perform continuous and/or routine monitoring to demonstrate compliance with emission limits under the facility operating permit. Compliance monitoring typically includes continuous monitoring of oxygen levels at each stack flue along with routine monitoring of CO, SOx, and NOx. Stack tests for PM, opacity, heavy metals, HCl, and dioxins/furans are also required.

White Paper Report 34 September 2019
3.4 Ash Management Combustion residue from mass burn WTE facilities is composed of fly ash, which is the fine airborne particles of ash entrained in flue gas and collected by air pollution control devices, and bottom ash, which is the non-airborne combustion ash discharged from the furnace at the end of the grates.
The characteristics of these two ash streams are significantly different. Fly ash contains PIC, including HCl, vaporized and volatilized heavy metals, and other complex organic and inorganic compounds. Bottom ash is essentially inert (incombustible) material discharged from the grates. Ash management practices can involve combining these two ash streams within the facility to form a single ash stream or managing them separately. Outside of Europe, the most common management method is to combine the bottom and fly ash into a single ash stream for disposal, which simplifies overall handling, transportation, and disposal into a single management strategy. For this pre-feasibility study, Geosyntec has assumed the proposed WTE facility will dispose of a combined ash stream.
Proper ash management from the WTE facility will require the development of an engineered landfill, which is defined as having at least the following characteristics:
• An engineered development plan and design;
• Site security and access control to prevent unauthorized dumping;
• A means to collect liquids (leachate) generated at the bottom of the landfill; and
• A systematic operation that places the ash in a controlled manner and covers filled areas with soil on a daily basis.
The landfill can be co-located with the WTE facility or located at a separate property. There are several benefits to co-locating the ash landfill with the WTE facility. These include eliminating offsite hauling costs, providing better security to prevent unauthorized dumping, the ability to use liquids collected from the landfill as recycled process water within the WTE facility, and support for landfill operations (which would generally be part-time) by WTE facility personnel. The primary disadvantage of co-locating the ash landfill would be that the landfill requires a substantial area of property that may not be available at the location that is most advantageous for siting the WTE facility.
Given that provision of an ash landfill is fundamental to WTE residuals management, the costs for developing a landfill are included in the pro forma developed in Section 6 of this Report.
3.5 Wastewater Water is used in the WTE combustion process for several purposes, including as scrubber effluent for acid gas cleaning, cooling and quench water from bottom ash management, other air pollution control devices, and boiler feedwater production. Sources of wastewater from WTE plant operation thus include “operational” water from cooling towers, boilers, air pollution control devices, and ash management, as well as general facility cleanup waters and domestic

White Paper Report 35 September 2019
wastewater from workers’ sanitary facilities. Depending on stormwater management systems in place, runoff from the surface areas of the property may also end up as wastewater, although this can be minimized through best practices for stormwater management.
The wastewaters from the various uses at WTE facilities can contain high concentrations of solids, heavy metals, and soluble contaminants. Anticorrosion and antifouling agents (e.g., sodium bi- and triphosphates) and biocides (e.g., chlorine) are typically used in boilers and cooling towers. Onsite wastewater treatment methods include neutralization, removal of solids, precipitation, and sludge settling, filter pressing, and drying (see Figure 2-1). To avoid landfill disposal of sludge, most facilities dry the sludge and blend it back into the solid waste as it is burned in the boilers. When possible, wastewaters are treated and recycled for additional use; however, some offsite discharge is unavoidable.
In this pre-feasibility study, it is assumed that direct discharge to a municipal sewer will be possible, for which discharge criteria will be established by the municipal wastewater treatment company. Costs for sewer discharge are assumed to be equivalent to those charged to other industrial/commercial facilities.
3.6 Permitting Requirements There are four main categories of emissions from WTE plants -acid-gases, particulate matter, heavy metals, and products of in-complete combustion (PICs). Within these three categories, there are many products of combustion, many of which are regulated under the international and national emissions regulations. In the United States, these WTE regulations are titled, "New Source Performance Standards" (NSPS) for new WTE sources and "Emission Guidelines" (EGs) for existing WTE facilities (Table 3). In this report, the discussions are limited to the following WTE air emissions:
• Particulate matter (PM),
• Cadmium (Cd), mercury (Hg) and lead (Pb),
• Hydrochloric acid (HCI) and sulfur oxides (SO),
• Nitrogen oxides (NOx),
• Carbon monoxide (CO), and
• Organics (dioxins and furans).
The hourly, daily, monthly, and yearly emissions concentrations from solid waste combustors vary. However, in general, the relative concentration and toxicity of any of the above contaminants in solid waste combustor gas will be affected by the following factors:
• Solid waste composition,
• Combustion temperature and residence time,
• Flow patterns and amounts of excess air, and

White Paper Report 36 September 2019
• Furnace design.
Particulate Matter. Particulate matter (PM) is any liquid or solid which is so finely divided as to be capable of becoming windblown or suspended in air or gas. Particle sizes for particulate matter from solid waste combustors usually range from 0.01 to 300 microns (micron -one millionth part of a meter) in diameters; 20 to 40 percent is less than 10 microns in diameter; and up to 10 percent is less than 2 microns in diameter. Particulate matter from solid waste combustors is usually composed of the following materials: carbon particles, water particles, and particles of incomplete combustion.
Heavy Metals. At the end of the 1990s, three heavy metals emissions were regulated, mercury (Hg), lead (Pb), and cadmium (Cd).
Although heavy metals are their own class of toxic emission, they are sometimes grouped with particulates. This may be attributed to the way they are collected. Heavy metal can be “trapped” with injection of activated carbon, or in scrubbers, then collected by the baghouse.
Acid Gas. Acid gases such as sulfur dioxide (SO2) and hydrogen chloride (HCI) are formed during combustion. Sulfur oxide (SOx) compounds are formed form the oxidation of elemental sulfur, and HCI is formed when chlorine in the solid waste combines with free hydrogen atoms (Licata et al. 1994).
Spray dryers, sometimes called dry scrubbers, are the most common acid gas control technology. Spray dryers inject a fine alkaline slurry (i.e., lime) into the flue gas stream. This slurry reacts with SOx and HCI to form chlorine and sulfur salt precipitates, which are then collected by the electrostatic precipitators or fabric filters. Chlorine is more reactive than sulfur and reacts first with slurry. The USEPA regulations identify fabric filters as the best control technology (BCT) to combine with spray dryers for controlling acid gas emissions (USEPA 1997). The use of a spray dryer with a fabric filter can produce removal efficiencies of >95% for HCI and >85% for SOx. When acid removal requirements are stringent, usage of double stage wet scrubbers may be required to further reduce emissions.

White Paper Report 37 September 2019
Table 3: Current US EPA Emission Limits for WTE Plants in the U.S.
Concentration units Pollutant Incinerators casea
Incinerators caseb
Energy recovery unitsc
Waste burning kilnsd
Small remote incineratorse
ppm ppm ppm ppm mg/Nm3
7% O2 dry 7% O2 dry 7% O2 dry 7% O2 dry 7% O2 dry
SOx (ppm at 7% O2) HCl (ppm at 7% O2) NOx (ppm at 7% O2) CO (ppm at 7% O2)
Particulate matters/dust (mg/Nm3 at 7% O2)
Dioxins (TEQ ng/Nm3 at 7% O2)
Cadmium (µg/Nm3 at 7% O2)
Mercury (µg/Nm3
at 7% O2)
11 0.091 23 17 18
20 62 388 157 70
720 14 76 35 110
28 3 200 90/190 4.9
1.2 200 170 13 270
TEQ ng/Nm3 7% O2 dry 0.13 0.41 0.093 0.075 31
µg/Nm3 7% O2 dry 2.3 4 23 1.4 670
µg/Nm3 7% O2 dry 0.84 470 0.56 3.7 3.5
aEmission limitations for incinerators that commenced construction after June 4, 2010, or that commenced reconstruction or modification after August 7, 2014.
bEmission limitations for incinerators for which construction is commenced after November 30, 1999, but no later than June 4, 2010, or for which modification or reconstruction is commenced on or after June 1, 2001, but no later than August 7, 2014.
cEmission limitations for energy recovery units that commenced construction after June 4, 2010, or that commenced reconstruction or modification after August 7, 2014.
dEmission limitations for waste-burning kilns that commenced construction after June 4, 2010, August 7, 2013 or reconstruction or modification after August 7, 2014.
eEmission limitations for small, remote incinerators that commenced construction after June 4, 2010, or that commenced reconstruction or modification after August 7, 2014.
Products of Incomplete Combustion. Products of incomplete combustion (PICs) are of concern because carbon monoxide (CO) and organics such as dioxin or furan are formed by incomplete combustion. CO and organics emissions are regulated by the EPA.
Most organics and CO are destroyed when complete combustion occurs. This destruction requires ample amounts of oxygen. the EPA regulation of PICs from solid waste combustors has brought about the injection of excess oxygen to ensure that complete combustion will occur. In some cases, as much as 200% of what would be stoichiometrically needed for complete combustion is added. Even with high excess air, CO and organics are still formed. Most of the PICs combine with particles in the cooling flue gas produced by dry sprayers. the particles are then collected by electrostatic precipitators or fabric filters. This process alone can produce removal efficiencies as high as 99% for organics.

White Paper Report 38 September 2019
Nitrogen Oxides. Nitrogen oxides (NOx) are produced during combustion. the two most important nitrogen oxides are nitric oxide (NO) and nitrogen dioxide (NO2); these are collectively known as NOx. Nitrogen oxides are formed from the organic nitrogen present in solid waste and from the nitrogen present in the air used for combustion. NO, emissions are of concern due to their contributions to the formation of ozone and the photochemical oxidants known as smog.
3.6.1 Compliance Monitoring The USEPA monitoring requirements under the NSPS and EGs require major sources of air pollution (WTE plants are a major source) to provide enhanced air emissions monitoring in order to demonstrate compliance with the CAA. Compliance monitoring is discussed below.
Oxygen. Municipal solid waste combustors must conduct continuous emissions monitoring (CEMS) to measure oxygen at each stack flue within a municipal solid waste combustor where CO, SOx, or NOx emissions are monitored.
Particulate Matter and Opacity. The initial compliance tests for particulate matter emissions and opacity mud will be conducted within 60 days after a municipal solid waste combustor has achieved maximum operating capacity, but not later than 180 days after startup. Following initial compliance testing, performance tests for particulate matter and opacity are typically con- ducted annually.
Samples for particulate matter compliance are collected from the air emissions in the municipal solid waste combustor stack. Sampling equipment (sampling trains) with probes and filters traverse the interior diameter of the stack to collect samples of the air emissions leaving the stack. Temperature conditions, sampling sites, the number of traverses and the length of the sampling runs are dictated by EPA regulations. Other pollutant samples, e.g. metals and HCI, can be collected during the same sampling runs.
Municipal solid waste combustors are required to install a continuous opacity monitoring system (COMS) to measure opacity. Initial compliance with this USEPA requirement must occur within 180 days of startup. Opacity is defined as the apparent obscuration of an observer's vision to a degree equal to the apparent obscuration of smoke given on the Ringlemann Chart. The Ringlemann Chart is a well-established standard for measuring opacity and photographically reproduces illustrations of four shades of gray that an observer can use to estimate the density of smoke. A clear stack is recorded as 0 and a 100 percent black smoke as 5.
Metals. The initial tests for compliance with emission limits for cadmium (Cd), lead (Pb), and mercury (Hg) must be conducted within 60 days after a municipal solid waste combustor has achieved maximum operating capacity, but no later than 180 days after startup. Samples to determine compliance of these metals are collected from the air emissions in the municipal solid waste combustor stack (see Section on Particulate Matter and Opacity for stack sampling details).

White Paper Report 39 September 2019
Sulfur Dioxide. Municipal solid waste combustors are also required to install a GEM system to measure sulfur dioxide (SO2) emissions. Compliance with SO2 emission limits are determined by calculating a 24-hour daily geometric mean emission concentration. At a minimum, valid paired CEM hourly averages (i.e., SO2 and 02) have to be obtained for 75% of the hours per day for 90% of the days per calendar quarter of operation. The initial performance test has to be completed within 180 days after startup.
Nitrogen Oxides. Municipal solid waste combustors are required to install a continuous emissions monitoring (CEM) system to measure nitrogen oxide (NOx) emissions. Compliance with NOx emission limits are determined by calculating a 24-hour daily geometric mean emission concentration. At a minimum, valid paired CEM hourly emissions (NOx and 02) have to be obtained for 75 %of the hours per day, for 90% of the days per calendar quarter of operations.
Hydrogen Chloride. The initial tests for compliance with HCI emission limits must be conducted within 60 days after a municipal solid waste combustor has achieved maximum operating capacity, but no later than 180 days after startup. Following initial compliance testing, HCI compliance is determined by annual stack tests.
Samples for HCI compliance are collected from the air emissions in the municipal solid waste combustor stack (see Section on Particulate Matter and Opacity for stack sampling details).
Dioxin/Furans. The initial tests for compliance with emission limits for dioxin and furans must be conducted within 60 days after achieving maximum operating capacity, but no later than 180 days after startup. After initial compliance testing, dioxin/furan compliance is determined by annual stack tests. Compliance is based on either the total emitted or the Toxic Equivalency Factor for dioxins and furans.
3.6.2 Operating Standards The EPA NSPS and EG requirements also require municipal solid waste combustors to demonstrate that the operations are being conducted at rated capacity and that the emissions comply at the tested and rated capacity of the facility. The EPA has established operating standards for several operational characteristics to ensure that the facility is operating at the tested and rated capacity. These standards address:
• Carbon monoxide - The amount of carbon monoxide in the emission gases is an indication of the degree of combustion; high carbon monoxide levels indicate insufficient air for complete combustion.
• Load level - A municipal solid waste combustor is tested for emission compliance at a rated capacity; defined by the steam load delivered. Therefore, the load level of steam being delivered is an indication how well the facility is meeting the rated capacity and its emission level limits;
• Particulate matter control device temperature - For maximum efficiency, particulate matter control devices must operate at their appropriate temperatures. Measuring the

White Paper Report 40 September 2019
temperature at the inlet of the device demonstrates that it is ready to provide the intended particulate matter removal.
• Municipal solid waste unit capacity - Each combustion train (unit) is rated at a certain capacity during compliance testing; measuring the 24-hour operating capacity demonstrates satisfaction of this requirement.
• Fly ash and bottom ash fugitive emissions - Municipal solid waste combustors must include means to prevent fugitive emissions from their ash handling system. Measuring the extent of fugitive emissions during the transfer of ash from a combustion unit to the ash storage facility determines compliance with this requirement.
3.6.3 Overview of Permitting Process It is expected that several state and local agencies will have a role in the permitting of a new WTE plant in the MOA. At this pre-feasibility stage, the specific agencies that would be responsible for approving the construction and operation of the WTE plant were not identified, nor the directly relevant laws and regulations they administer. Rather, this section broadly identifies the components of permit applications that MOA should expect will be submitted, based on Geosyntec’s experience with similar WTE projects in the U.S.
The level of effort required to prepare the required permit submittals, estimated costs for preparation of permit applications, and an estimated timeline for regulatory approval will be developed later, assuming MOA elects to proceed with development of a WTE project. However, it should be tentatively expected that the permitting process will take at least two to three years.
Permit requirements for solid waste management facilities generally include solid waste, air, and water discharge permits.
Solid Waste Permit: The solid waste permit can be considered a Permit to Construct (PTC) for the facility. The permit application typically includes:
• Preparation of engineering plans, reports, and specifications that comprehensively address the project in its environmental setting and comply with the required environmental and social impact assessments (ESIA);
• A location map with the site marked;
• Proof of property ownership and certified surveys of property boundaries;
• Plan of operations and maintenance, including contingency plans for waste control;
• Detailed decommissioning/closure plans for the facility;
• Information on the landfill that will receive the ash from the facility;
• Public notice and review requirements; and

White Paper Report 41 September 2019
• Payment of regulatory fees.
Air Permit: The air permit can be considered a Permit to Operate (PTO) for the facility. The permit application typically requires:
• Preparation of an air pollution control program that comprehensively addresses the project in its environmental setting and complies with imposed limits on air emissions and demonstrates use of best available control technology (BACT) and air quality monitoring to meet air quality standards;
• Identifying information, including owner/operator and plant name and address;
• A list of all emission units at the facility and description of all emission units’ processes and byproducts;
• A list of all regulated air pollutants expected to be emitted from the facility;
• The type, rate, and quantity of expected emissions in sufficient detail to determine what requirements and emission limits are applicable to the facility;
• Demonstrated compliance with the ESIA and other required environmental assessments; and
• Payment of regulatory fees.
Water Discharge Permit: Water discharge permit conditions will vary depending on whether discharge will be to natural receiving waters or to a sewer system. Provision of onsite pre-treatment or full treatment prior to discharge also affects permit conditions. At this pre-feasibility stage, it is assumed that wastewater from the WTE facility will be discharged into the MOA sewer system. Wastewater treatment will be limited to that required to meet discharge permit conditions imposed by AWWU, which Geosyntec assumes will be broadly equivalent to those imposed on other industrial/commercial facilities in the MOA.
3.7 Other Plans Two MOA planning documents potentially influence development of a WTE facility.
3.7.1 Solid Waste Master Plan In 2017, the MOA authorized development of an integrated solid waste master plan (ISWMP) in order to optimize its system and assets through improved operational efficiencies, capital improvements and new practices/programs that increase landfill life, improve safety and customer service, protect the environment and increase waste reduction, improve reuse and recycling of materials that are currently disposed of as waste. As part of the ISWMP, a preliminary assessment of alternative waste conversion technologies was performed.

White Paper Report 42 September 2019
3.7.2 Climate Action Plan The Climate Action Plan (CAP) for the MOA was adopted by the Anchorage Assembly on May 21, 2019. The Plan puts Anchorage on a path to reduce greenhouse gas emissions by 80 percent by 2050 with an interim goal of 40 percent by 2030. The CAP focuses on seven sectors including: Buildings and Energy, Land Use and Transportation, Consumption and Solid Waste, Health and Emergency Preparedness, Food Systems, urban Forest and Watersheds, and Outreach and Education.
Some specific objectives for solid waste management include the following:
• Develop anaerobic digestion or mass burn waste-to-energy facilities are other options that could reduce landfill dependence and provide additional benefits like compost, bio gas and electricity.
• Identify and implement additional means of energy collection from solid waste (e.g., organics digestion, mass burn).
• Explore internal operational and savings opportunities such as those outlined in the 2017 Anchorage Energy Landscape and Opportunities Analysis, including heat recovery, waste to energy, landfill methane recovery, and combined heat and power.
• Over-reliance on one energy source leaves Anchorage vulnerable to price volatility and supply interruptions. Adding renewable energy like WTE will diversify MOA’s energy supply, improve air quality, and save money on fuel costs.

White Paper Report 43 September 2019
4. WASTE STREAM AND WASTESHED ANALYSIS
This section contains preliminary estimates of waste quantities currently generated in the projected wasteshed and expectations for growth in waste generation over the life of the plant, as well as a review of expected waste composition in the MOA. In preparing this section, Geosyntec reviewed existing data on the available waste streams, which included published sources as well as data provided by neighboring communities.
It is reiterated that this section only provides a preliminary analysis in support of the pre-feasibility study. Because waste quantity and composition are critical inputs to an investment analysis, Geosyntec recommends that a comprehensive assessment of waste generation and a detailed waste composition study are conducted as part of the next stage of the project.
4.1 Wasteshed A "wasteshed" is typically defined by solid waste professionals as being an area that shares a common solid waste disposal system, or an appropriate area in which to develop a common disposal or recycling system. Solid waste agency staff and political leaders (Mayors and Chiefs of Staff) within the MOA have discussed, in the recent past, the feasibility of siting a regional WTE facility, which would dispose of solid waste generated within a wasteshed consisting of the Boroughs of MOA, Mat-Su, and the Kenai Peninsula. Figure 9 is a vicinity map, which shows locations of key facilities (landfills and transfer stations) and distances between these facilities. All three Boroughs are operating State permitted landfill facilities. Siting a joint WTE facility might have potential economies of scale and provide long-term solid waste disposal capacity for all three communities.

White Paper Report 44 September 2019
Source: Geosyntec Consultants, 2019
Figure 9: Wasteshed Vicinity Map
4.2 Population in Market Area Waste generation is strongly correlated to population size and growth. To define the market area to be served by this project, Geosyntec began by evaluating population data and expected growth rates for the wasteshed, as defined in the paragraphs above.
In 2017, the Anchorage/Mat-Su/Kenai Peninsula Boroughs had an estimated population of 459,673, approximately 62.4% of the State’s population. As shown in Table 5, the Alaska Department of Labor and Workforce Development produces population projections for Alaska for 2017-2045. As shown in this table, population increases in these three boroughs are dramatic, so that by 2045 they represent over two-thirds of the State’s entire population.
These projections are based on the current population and historical birth, death, and migration trends in Alaska. Population projections are distinct from population estimates in that estimates use current and historical data to make statements about the present and past
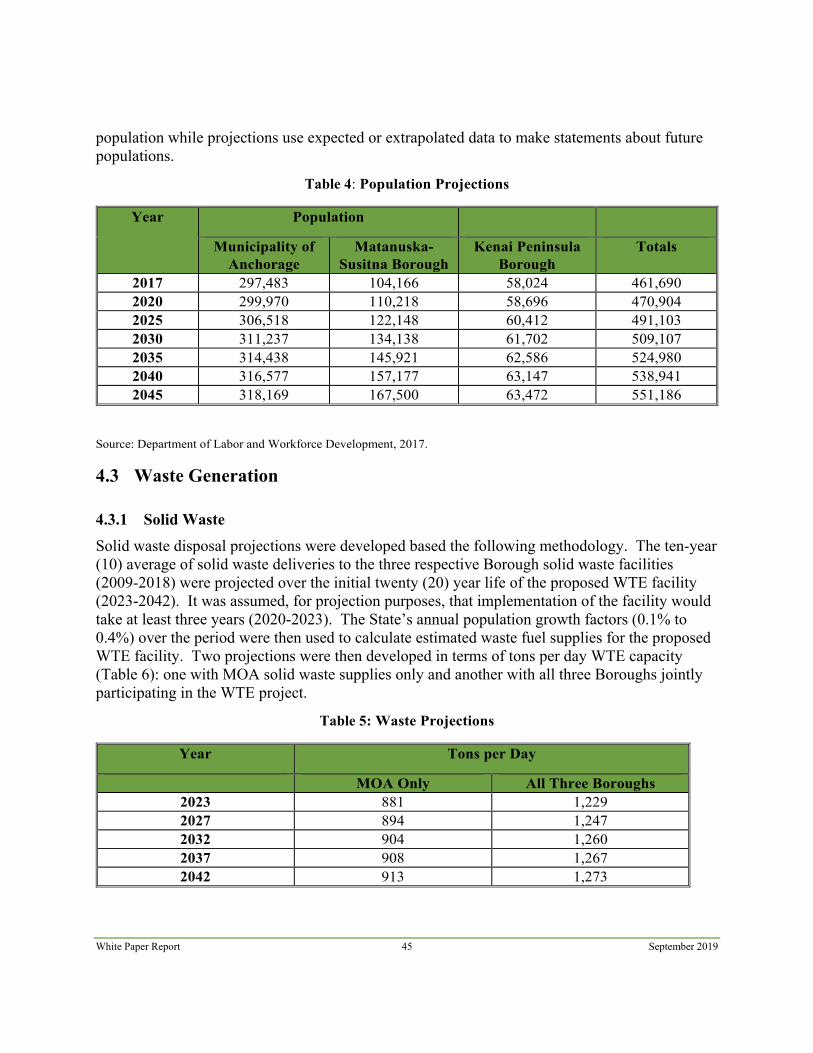
White Paper Report 45 September 2019
population while projections use expected or extrapolated data to make statements about future populations.
Table 4: Population Projections
Year Population
Municipality of Anchorage
Matanuska-Susitna Borough
Kenai Peninsula Borough
Totals
2017 297,483 104,166 58,024 461,690 2020 299,970 110,218 58,696 470,904 2025 306,518 122,148 60,412 491,103 2030 311,237 134,138 61,702 509,107 2035 314,438 145,921 62,586 524,980 2040 316,577 157,177 63,147 538,941 2045 318,169 167,500 63,472 551,186
Source: Department of Labor and Workforce Development, 2017.
4.3 Waste Generation
4.3.1 Solid Waste Solid waste disposal projections were developed based the following methodology. The ten-year (10) average of solid waste deliveries to the three respective Borough solid waste facilities (2009-2018) were projected over the initial twenty (20) year life of the proposed WTE facility (2023-2042). It was assumed, for projection purposes, that implementation of the facility would take at least three years (2020-2023). The State’s annual population growth factors (0.1% to 0.4%) over the period were then used to calculate estimated waste fuel supplies for the proposed WTE facility. Two projections were then developed in terms of tons per day WTE capacity (Table 6): one with MOA solid waste supplies only and another with all three Boroughs jointly participating in the WTE project.
Table 5: Waste Projections
Year Tons per Day
MOA Only All Three Boroughs 2023 881 1,229 2027 894 1,247 2032 904 1,260 2037 908 1,267 2042 913 1,273

White Paper Report 46 September 2019
4.3.2 Biosolids The Anchorage Water and Wastewater Utility (AWWU) is the largest water and wastewater utility in Alaska. AWWU currently serves the Municipality of Anchorage extending from Eklutna to as far south as Girdwood. To provide water and sewer services, AWWU owns and operates five Treatment Facilities (2 water and 3 wastewater), over 1,600 miles of pipe, and over 325,000 square feet of facility space distributed throughout the Municipality. ASU operates three wastewater treatment facilities to treat wastewater collected in three geographically separate but commonly managed sewer systems.
The largest of these is the John M. Asplund (Asplund) Wastewater Treatment Facility (WWTF) located at Point Woronzof. The Asplund WWTF was constructed in the early 1970’s when Anchorage eliminated direct ocean discharges. It services the wastewater treatment needs of the Anchorage Bowl. The Asplund facility has received silver, gold, and platinum awards from the National Association of Clean Water Agencies for efficiency and environmental compliance.
Belt filter presses enable conversion of the wet sludge to dryer product (30 to 32 percent solids). An onsite biosolids incinerator is located at the Asplund WWTF with the ash and bypass biosolids disposed of at the SWS Landfill (ARL) when the incinerator is down for scheduled maintenance and/or unplanned repairs. Currently, roughly 2,032 tons of these materials were landfilled in 2018 at a cost of $58 per ton. Table 6 shows the actual tonnage of biosolids incinerated at the Asplund WWTF for 2012 through June 2019. AWWU staff indicate that about 20 tpd of biosolids are processed by the biosolids incinerator (Table 6). Their projections suggest that these quantities would increase to an estimated 28 tpd over 20 years.
The incinerator is nearing the end of its useful life and plans and estimated replacement costs were developed as part of a facility planning study in 2014.
Table 6: Actual Tonnage of Biosolids Produced at the Asplund WWTF (2012-2019)
Months 2012 2013 2014 2015 2016 2017 2018 2019 AVG
Jan 1,459.58 2,221.61 1,786.50 1,712.40 1,822.55 1,800.46 1,736.94 1,926.16 1,808.28
Feb 1,380.52 1,994.02 1,571.04 1,512.40 1,718.77 1,643.39 1,636.41 1,797.80 1,656.79
Mar 1,551.59 2,206.61 1,806.22 1,741.76 2,022.29 1,822.01 1,913.30 689.88 1,719.21
Apr 1,782.65 2,276.10 1,740.55 1,729.29 1,893.67 908.94 2,027.73 1,760.54 1,764.93
May 1,610.52 2,030.22 1,823.60 1,910.39 1,969.85 2,017.72 2,294.43 2,216.32 1,984.13
Jun 1,690.65 1,988.07 1,818.44 1,861.31 2,079.07 2,099.64 2,413.81 2,119.62 2,008.83
Jul 1,960.77 2,155.15 1,993.84 2,023.94 2,126.14 2,252.65 2,480.28 2,141.82
Aug 1,979.20 2,257.91 2,077.06 2,061.13 2,237.70 2,347.08 2,552.04 2,216.02
Sep 1,888.85 2,201.33 1,843.90 1,923.54 2,072.16 2,129.47 1,938.26 1,999.64
Oct 2,068.16 2,086.21 1,959.08 2,124.28 2,022.98 2,161.31 2,310.19 2,104.60
Nov 1,845.92 1,154.11 1,728.32 1,881.61 1,489.48 1,866.48 2,037.04 1,714.71
Dec 2,240.88 1,728.65 1,648.26 1,783.67 1,858.65 1,898.61 2,016.96 1,882.24
Total 21,459.29 24,299.99 21,796.81 22,265.72 23,313.31 22,947.76 25,357.39 23,062.90

White Paper Report 47 September 2019
4.4 Solid Waste Composition There are thousands of published solid waste composition studies across the United States. The results vary by climatic region, socioeconomics, level of recycling in the community, and the type of survey (e.g., grab sampling versus scientific sorting of the waste stream). The results from a waste composition survey undertaken in one community may not reflect the characteristics of the waste stream in another community. Should the SWS move forward on construction of a WTE facility, it is recommended that a detailed waste composition study be undertaken to fully delineate the community’s waste stream. That being said, a few waste composition studies undertaken by the SWS and the neighboring Mat-Su Borough are presented in the following paragraphs.
In October 2017, HDR Inc. conducted a limited waste composition study for SWS at the ARL. The study consisted of two spot assessments of 2,000 lbs. of waste from a randomly selected truck dumping at the active landfill face. The waste was sorted into 13 categories and weighed to determine a by-weight composition. Results across the two assessments found that the sorted waste was primarily composed of food scraps (18%), wood and yard waste (17%), inert material (16%), paper (10%), and plastics #3-7 (10%). Further grouping of the sorted categories into material groups illustrates that compostable organics (food scraps, yard waste, and other organics), paper (including cardboard), wood and construction waste, and plastics comprise most of the waste stream.
In 2018, Mat-Su Borough performed an initial waste composition analysis of both residential and commercial materials. Table 7 presents the data from an initial waste composition study performed in September through December 2018. Data was collected from 13 rear-load trucks during the sampling period. Nine trucks containing residential waste were analyzed between October and November 2018, and four trucks containing commercial and institutional waste were analyzed between December 11 and 15, 2018. The main components for commercial MSW in the “other’ category include fines and super mix. As of this report, Mat-Su Borough indicates that it is continuing to perform waste sampling and more data will be available in the near future. No waste composition studies have been completed for the Kenai Borough.

White Paper Report 48 September 2019
Table 7: Waste Composition Survey Results, Mat-Su Borough, 2019
Residential Commercial
Material Composition (% of Total by Weight)
Component Composition (% of Total by Weight)
Paper 17.1 Paper 28.0 Durables 16.7 Other 22.3 Plastics 16.1 Plastics 14.4 Metals 11.4 HHW 7.6 C&D 8.2 Glass 7.5 Other 6.8 Food 6.1 Rubber, Leather and Textiles
6.5 Rubber, Leather and Textiles
4.4
Food 5.9 Durables 2.8 Wood 5.5 Wood 2.1 Glass 4.5 Metals 2.8 HHW 1.4 C&D 2.0 Yard Waste 0.0 Yard Waste 0.0
Source: Mat-Su Borough, 2019
4.5 WTE Plant Sizing The proper size of a proposed WTE facility is oftentimes a balance among initially designing the plant to minimize landfilling of bypass waste, maximize available capacity in its initial year, provide excess capacity to accept MSW from other municipalities to fill unused capacity, and the additional capital costs incurred to allow this to happen.
WTE facility annual availability is assumed to be in the range of 92 to 96 percent of design capacity for annual MSW processed. Many of the private operators of “first generation” WTE facilities were bound by contract to maintain an annual availability guarantee of 85 percent. However, the percent of time in which newer generation WTE facilities are available to process MSW has increased over the last two decades of plant operations. This is due to advancements in the industry such as use of higher alloy overlay on boiler tubes, better refractory coverage, more through plant inspections to minimize introduction of unacceptable wastes (tree stumps and engine blocks), and optimized and automated combustion controls.
WTE combustion technology has demonstrated the ability to be scaled to meet the needs of the host community (city, county, or several counties), depending on the legal entities that want to build and operate (or have somebody build or operate) such a facility.

White Paper Report 49 September 2019
A review of the waste projections noted in Table 5 and the factors above suggests that the MOA should consider development of a 1,000 WTE facility, sized at two boiler units of 500 TPD, if it is to be the only project participant. If the two other Boroughs participate in the WTE project, then the sizing should be 1,200 TPD, with three 400 TPD boiler units.
4.6 Heating Value Since the sale of energy plays an important role in the economic feasibility of a WTE project, the heating value of the waste stream is a key design factor. The heating value of the waste steam can be estimated based on waste composition data. The heating value of solid waste is typically measured in British thermal units (BTUs) per pound in the U.S., or KJ/kg elsewhere (1 BTU is approximately equal to 1055 J). The higher heating value (HHV) content of the various components of solid waste discussed in Section 4.3 is well documented as presented in Table 8 below.
Table 8: Average Heating Value of Solid Waste Components
Component BTU/lb. KJ/kg Component BTU/lb. KJ/kg
Food waste 2,000 5,700 Glass 60 170 Paper/Cardboard 7,200 20,400 Ferrous Metals 300 850 Plastics 14,000 39,600 Non-Ferrous Metals 0 - Textiles/Leather 7,500 21,200 Dirt, Ash, Bricks,
etc. 3,000 8,500
Rubber 10,000 28,300 Mixed Solid Waste 4,500 12,700 Garden Trimmings 2,800 7,900 Waste Oil 21,000 59,400 Wood 8,000 22,600 Tires 13,500 38,200
Source: Rogoff, 2019
Typically, municipal solid waste exhibits a range of 2,500 to 8,500 BTU/lb. (7,100 to 24,000 KJ/kg). The range is dependent on the definition of solid waste, with higher values reported for waste that are defined as “highly combustible waste, paper, wood, cardboard, including up to 10% treated papers, plastic or rubber scraps; commercial and industrial sources” and lower values reported for waste that is defined as “wet animal and vegetable wastes from restaurants, hotels, markets and other similar sources. As would be expected, the higher the moisture and inert content of a solid waste stream, the lower the heating value.
The removal of organic waste (food and vegetation) typically results in driving up the HHV of the remaining waste. If the HHV increases beyond the design HHV value, it would result in lowering the waste processing capability for the WTE facility, which is designed based upon a specific HHV and throughput for total heat input. If plastics were also targeted in future waste diversion goals, along with organic materials, the two would tend to offset each other. However, if only plastics were targeted, the HHV would likely be reduced. If the reduction in HHV is less than the design HHV value, the WTE facility would be able to process more waste, up to its

White Paper Report 50 September 2019
theoretical design heat input. Complicating this issue, the HHV of a community’s waste typically varies on a daily basis (depending upon weather) and seasonal basis.
Based on the waste composition in Table 7 and the typical heating value for the components of solid waste described in Table 8, Geosyntec estimated the average expected heating value for waste in the wasteshed to be approximately 5,000 BTU/lb.
4.7 Existing Waste Management System Management of solid waste in the MOA is provided through public (SWS) and private service providers. Figure 10 illustrates the solid waste management system in the MOA and the flow of solid waste through the System. The SWS is composed of two utilities, the Refuse Collection Utility (RCU) and the Solid Waste Disposal Utility (SWDU).
Source: Integrated Solid Waste Master Plan, 2018
Figure 10: Overview of the MOA Solid Waste System
4.7.1 Collection Waste collection in the Anchorage area is a combination of public utilities, private haulers and self-haulers.
SWS is the public hauler. Its service area is limited by the Anchorage Municipal Code and Regulatory Commission of Alaska (RCA) to an area that encompasses the boundaries of the original City of Anchorage, which covers approximately 20% of the population in MOA. Garbage service within these boundaries is mandatory by municipal code. SWS provides

White Paper Report 51 September 2019
commercial dumpster service, up to 8 CY cans served by front load truck. Rolloff and compactor service in the service area is provided by private haulers but the property owner must obtain an exemption from municipal code demonstrating that their service needs cannot be met by SWS prior to spotting the can. SWS also provides residential collection to approximately 12,000 residential customers using automated side load trucks and 32 gal to 96 gal rollcarts. Residential collection is weekly. As part of the service, comingled recycle (excluding glass and film) are collected on a bi-weekly basis. SWS is currently piloting curbside organics collection in some areas of the service area. Note that collection of recycled materials is not regulated by the RCA.
There are numerous private haulers, the largest of which is Alaska Waste (a subsidiary of Waste Connections). Alaska Waste provides commercial rolloff, compactor and dumpster service. They also provide residential garbage collection and residential comingled curbside recycling. Alaska Waste provides service in all areas of the municipality from Girdwood to Eklutna and are also the primary commercial hauler in populated areas of the Mat-Su Valley and Kenai Peninsula Borough. There are also several smaller operators (e.g., Ramsey, Red Box, Blue Arctic, Northern Waste, Bin There Dumped That) that come and go. These operators provide primarily commercial dumpster and rolloff service although Blue Arctic (and others) are making inroads into residential collection as well. Residential collection outside of the SWS service area is not mandatory and residents are free to contract with any service or self-haul. Alaska Waste residential service is by subscription and collected primarily by automated sideloader cans varying from 32 to 96 gallons. Rates are commensurate with size. Curbside comingled recycle is also available by subscription from Alaska Waste for a separate fee.
In addition to commercial and public waste collection utilities there is a fairly large contingent of self-haulers. There are public dropoff walls at the Central and Girdwood Transfer Stations as well as at ARL that are geared toward automobiles, pickup trucks and small trailers. Residential self-haul represents only a small portion of waste tonnage but contributes heavily to vehicle traffic. Servicing over 1,000 customers at CTS on a Saturday in the summer is a common occurrence. Many construction contractors (flooring, roofing, HVAC, and general contractors) as well as other commercial entities (tire shops, moving companies, beverage distributors, government entities, etc.) also haul directly to Central and ARL and space is provided for hand-unloading of larger trailers and vehicles.
Self-haul is much more prevalent in the Mat-Su and Kenai Boroughs as there are many residents and businesses in unincorporated areas. Both boroughs operate numerous satellite transfer stations which are basically rolloff containers spotted at a secure location at various points on the road system.
4.7.2 Recycling The majority of recycled materials in the MOA is self-hauled to 21 drop-off locations, largely managed by the private sector. These include the Anchorage Recycling Center (ARC), operated by WestRock, as well as grocery stores, high schools, and other locations. Transportation of recyclables from the drop-off centers to the ARC recycling facility is conducted under contract between the recycler and Alaska Waste. Consolidation and bailing of these recyclable materials
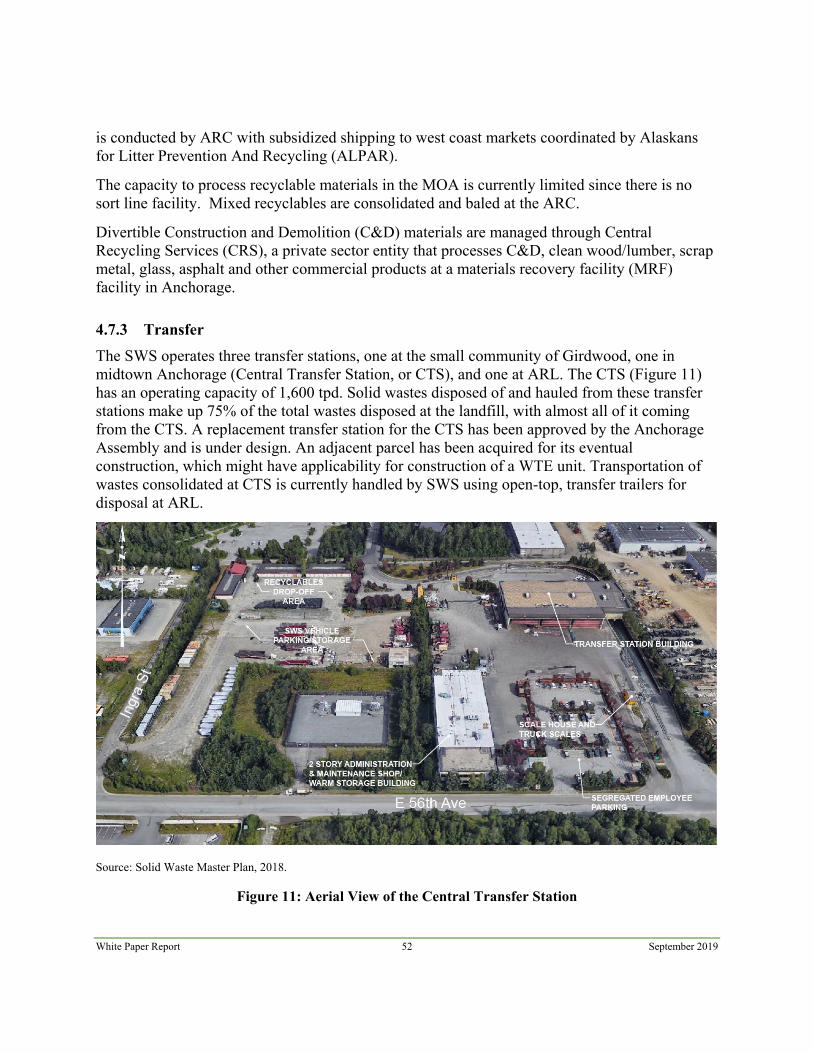
White Paper Report 52 September 2019
is conducted by ARC with subsidized shipping to west coast markets coordinated by Alaskans for Litter Prevention And Recycling (ALPAR).
The capacity to process recyclable materials in the MOA is currently limited since there is no sort line facility. Mixed recyclables are consolidated and baled at the ARC.
Divertible Construction and Demolition (C&D) materials are managed through Central Recycling Services (CRS), a private sector entity that processes C&D, clean wood/lumber, scrap metal, glass, asphalt and other commercial products at a materials recovery facility (MRF) facility in Anchorage.
4.7.3 Transfer The SWS operates three transfer stations, one at the small community of Girdwood, one in midtown Anchorage (Central Transfer Station, or CTS), and one at ARL. The CTS (Figure 11) has an operating capacity of 1,600 tpd. Solid wastes disposed of and hauled from these transfer stations make up 75% of the total wastes disposed at the landfill, with almost all of it coming from the CTS. A replacement transfer station for the CTS has been approved by the Anchorage Assembly and is under design. An adjacent parcel has been acquired for its eventual construction, which might have applicability for construction of a WTE unit. Transportation of wastes consolidated at CTS is currently handled by SWS using open-top, transfer trailers for disposal at ARL.
Source: Solid Waste Master Plan, 2018.
Figure 11: Aerial View of the Central Transfer Station

White Paper Report 53 September 2019
4.7.4 Landfill Disposal Disposal is provided through the ARL, a lined landfill, owned and operated by the SWS, near the community of Eagle River. It is the only operating landfill within the MOA and accepts more tonnage than any other landfill in the state. The next nearest landfill in Mat-Su Borough, is in Palmer, Alaska, about 27 miles north of the ARL. The ARL has a total land area of approximately 275 acres and is being developed in phases or cells. The last remaining cells are anticipated to begin development in 2020.
The ARL has both an active landfill gas (LFG) collection and control system and leachate collection and recovery installed. The ARL has an agreement with Doyon to supply LFG as fuel for their electrical generation facility which includes five Jenbacher generators (1.5 MW output each for a total of 7 MW). There are a number of LFG expansion opportunities at the ARL, including increasing the number of generation units, development of medium or high btu gas pipeline projects, or compressed natural gas vehicle fuel production.
Current tipping fees are set at $60.00 per ton for waste generated within the MOA and $120.00 per ton for wastes generated outside the MOA at ARL. Disposal fees at CTS are $70.00 per ton. No disposal fees are assessed for wastes generated at Fort Richardson.

White Paper Report 54 September 2019
5. ENERGY AND MATERIAL MARKETS
The primary objective of a WTE project is to dispose of solid waste in an economically efficient and environmentally acceptable manner. However, the energy derived from the combustion of solid waste in a WTE project is a secondary benefit. Revenues gained through the sale of electricity, steam, or recovered materials help offset the cost of WTE plant operation and enable WTE projects to compete against other waste disposal options, such as landfills, that are much less capital intensive. The financial viability of a WTE facility is, therefore, largely dependent upon its ability to realize these additional revenues.
5.1 Establishing Boundary Conditions for Analysis Section 5 focuses on forecasting the amount of energy in the form of electricity that could be produced by a mass burn WTE project under certain assumptions for waste intake based on data from Section 4, and to estimate the revenues that could be realized. For this, Geosyntec reviewed the current power production market, legal framework, and potential power purchase agreements (PPAs). Other potential sources of revenues are ignored in this pre-feasibility study as discussed below.
• Steam: Revenues from direct sales of steam are also key economic drivers for many WTE projects. Steam can be the most desirable form of energy for a WTE facility to generate when it is able to meet a customer’s steam needs on a continuous basis. This is because the generation of steam avoids the cost, complexity, and loss of efficiency require to convert the steam to electricity. Typically, however, this is only economically feasible when steam can be piped to end users within a 5 km radius of the WTE plant, in order to minimize energy losses and capital investment on the steam distribution network. Although Geosyntec conservatively elected to assess the viability of a WTE project neglecting potential revenues from steam sales, such revenues can be examined later if more detailed future analyses suggest that end user for steam may exist.
• Materials: Purchase agreements may also be available for recovery of materials. Materials in solid waste generally targeted for recycling as part of WTE operations include glass and ferrous/non-ferrous metals. Ferrous metals can be removed following combustion in the facility. If non-ferrous metals or glass are to be recovered, this must take place prior to combustion. Recovery of materials is highly dependent on the existing domestic scrap market for these materials. These were not investigated at this pre-feasibility stage as they do not significantly affect the economics of a WTE project.
• Ash: The WTE ash typically does not have value and is landfilled at a cost although, again, these costs are not investigated at this pre-feasibility stage.

White Paper Report 55 September 2019
5.2 Status of the Electricity Market Chugach Electric Association Inc. (Chugach) is the largest cooperative utility in Alaska. Based in Anchorage, the utility provides wholesale and retail power to customers in southcentral Alaska, from the Kenai Peninsula to the south and as far north as Fairbanks. Anchorage Municipal Light & Power (ML&P) currently provides service to commercial and industrial customers in downtown Anchorage and to the north toward the Matanuska Valley. Platforms and drill sites located in and around the Cook Inlet produce the natural gas used to fuel their power plants. However, in 2018, Anchorage voters approved a proposition to sell ML&P to Chugach, subject to the RCA’s approval. A rate filing has been submitted to the RCA by Chugach to review and approve this transaction.
Natural gas is the primary fuel for electricity production in southcentral Alaska. The most pressing concern for utilities in the region is an assured supply of natural gas. Well depletion in the Cook Inlet and the limited interest of large gas companies to invest in new wells only increases the risk of dwindling supplies in the future. Also, upstream outages have caused disruption of natural gas deliveries in the past.
5.2.1 Renewable Energy
A Renewable Portfolio Standard (RPS), also known as a renewable electricity standard, is a mandate intended to increase the amount of renewable energy production and use. Under these standards, a utility company can be required by a state to have a certain percentage of its electricity come from certain renewable energy resources. In addition, states may give tax credits to utility companies to fulfill these requirements. In the 2009-2010 legislative session, the Alaska legislature enacted House Bill 306 with the goal that “the state receive 50 percent of its electrical generation from renewable energy sources by 2025”.
Alaskans produce about 650,000 tons of garbage annually and have seven class I landfills (landfills that accept 20 tons or more solid waste daily) throughout the state. From 1997-2007, Eielson Air Force Base near Fairbanks used 600-3,000 tons of densified paper from the Fairbanks landfill annually to co-burn with coal, producing up to 1.5% of the base’s heat and power. Chena Power is developing a 400-kW biomass powerplant at the Fairbanks North Star Borough landfill that would run off 4,300 tons of waste paper, cardboard, and land waste annually.
The Anchorage Landfill Gas-to-Energy Project is a partnership between the Municipality and Doyon Utilities. The project uses landfill gas LFG), a byproduct of waste decomposition in the landfill to produce 7 Megawatts of electricity. The electricity is delivered to the Fort Richardson side of Joint Base Elmendorf Richardson (JBER). The plant output meets the off-peak power demand for the Fort Richardson side and approximately 25% of the JBER-wide electrical demand. As the largest green energy project in the U.S. Air Force Pacific Theater of Operations, the project far exceeds renewable energy requirements for federal facilities as required by the Energy Policy Act of 2005.

White Paper Report 56 September 2019
Chugach Electric purchases all the power generated by the Fire Island Wind Project, which is located west of the Ted Stevens International Airport. Fire Island Wind is comprised of 11, 1.6 MW wind turbines, which provide up to 17.6 MW of electric power. The Regulatory Commission of Alaska (RCA) approved in 2011 a 25-year power purchase agreement. Over the term of the agreement, Chugach pays a fixed price of $97 per megawatt hour or $0.097 per kwh. The agreement was justified to enable in order to protect the utility against significant fluctuations in the price of natural gas, which provides the bulk of Chugach’s electric energy.
In accordance with Section 203 of the Energy Policy Act of 2005 (42 U.S.C. § 15852), each fiscal year the federal government must consume at least 7.5 percent of its total electricity from renewable sources, referred to as the renewable electricity requirement. As defined in 42 U.S.C. § 15852(b), renewable electricity is electric energy generated from solar, wind, biomass, landfill gas, ocean (including tidal, wave, current, and thermal), geothermal, municipal solid waste, or new hydroelectric generation capacity achieved from increased efficiency or additions of new capacity at an existing hydroelectric project.
5.3 Potential Feed in Tariffs for a Proposed WTE Facility The conversion of MSW into electricity should be evaluated as an option for a MOA WTE facility. The electricity generated by the facility can be utilized for internal needs of the project with surplus power being available for sale to utilities, transferred (wheeled) over the transmission of one utility to another, or made available for use by other governmental operations. In some locations, WTE plants sell their whole power production and buy electricity for their own use under a separate contract.
Typically, utilities base their purchase price for the electricity upon the concept of “avoided costs”. Avoided costs are the incremental costs of electric energy and/or capacity above a certain baseline that the utility would incur from self-generating or purchasing from another source in response to increasing demand.
Pursuant to the RCA, utilities are required to file their avoided cost projections with the RCA and update them on a regular basis. Avoided cost filings through 2021 for each utility serving Anchorage are presented in Table 9.

White Paper Report 57 September 2019
Table 9: Utility-Filed Avoided Energy
Calendar Year Anchorage ML&P Chugach Electric Association
Matanuska Electric Association
2016 3.56 3.8 – 4.4 8.365
2017 3.56 5.1 – 5.9 8.825
2018 3.56 5.0 – 5.7 9.176
2019 3.56 4.9 – 5.7 9.568
2020 3.56 5.0 - 5.8 9.764
2021 3.56 5.1 – 5.9 9.965
5.4 Electrical Interconnect Requirements Chugach has established a set of guidelines containing the general requirements and technical operating parameters for interconnecting a co-generation facility like a WTE plant with the Chugach system. These can be found in the utility’s Interconnection and Operating Guidelines for Non-Utility Generation. Prior to connection, the WTE facility would have pay for the cost of an Interconnection Study by Chugach which would detail interconnection requirements as well as the following other factors:
• The ability to dispatch the projected WTE facility.
• Reliability of the WTE facility.
• Terms of any contract.
• The ability of the WTE facility to be scheduled in a way which allow Chugach to avoid costs.
• Usefulness of the WTE facility during emergencies.
• The individual and aggregate value of energy and capacity from other qualifying facilities on Chugach’s system.
• Impacts, if any, of capacity increments and lead times for construction of the WTE facility.
5.5 Preliminary Estimate of Energy Production To calculate potential levels of electricity generation at a proposed WTE facility, it is necessary to make general assumptions regarding the heating value of the waste, thermal efficiency of the boiler, efficiency of the turbine generator, and energy requirements of the air pollution control system, and any other in-house energy use. There are a variety of turbine types and boiler

White Paper Report 58 September 2019
designs that could be used for the proposed WTE facility with ramifications on overall capital costs for the facility and energy production efficiency.
Besides plant size and assumed heating value of waste feedstock, the design choices for a WTE facility that most impact its power production efficiency are:
• The pressure of the steam produced by boilers (standard at 40b/600psi or high pressure at 65b/950psi or higher)
• The type of condensing device (air cooled or water cooled)
• The heat source to pre-heat combustion air (if pre-heating is necessary): steam or energy recovered on flue gases.
• The number of boilers and turbines
Design assumptions, as well as estimated energy sales rates, have been made in the following section to help develop a Pro Forma Model for the proposed facility.
Table 10: Project Energy Production Estimates
Parameter Value
LHV of Waste 5,000 BTU/lb.
Annual Capacity / Availability Factors, % 90/90
Power Produced per ton of waste combusted 700 kWh/ton
MSW consumed annually 328,500 (based on 1,000 tpd)
Annual power Produced for Sale to Grid 193,388 MWh (based on 1,000 tpd)
The lower heating value (LHV) of the waste was calculated based on waste composition and assumed moisture level. This figure is reasonable and comparable to values we observed in Pacific Northwest communities. A waste characterization study in the next phase will either validate or modify the LHV of the fuel, requiring an update to the cost and performance information provided in this section. Note that the LHV, with the amount of MSW to be processed per year, are key factors that affect the sizing, capital cost and performance parameters of the plant turbine generator, boilers and grates, as well as other plant auxiliary equipment.
Based on the capacity/availability factors of 90% and an assumed daily throughout of 1,000 tons, the average annual throughput to the WTE plant is estimated at 328,500 tons. These factors are reasonable estimates for a well operated and maintained mass burn WTE facility.
The amount of electricity produced and provided to the grid for sale, based on the above assumptions for annual MSW processed and a net power production factor of 609 kWh per ton, is estimated at 193,388 MWh annually.

White Paper Report 59 September 2019
6. COST AND PERFORMANCE ESTIMATES
Geosyntec developed a pro forma model specifically for this pre-feasibility study to provide preliminary, planning-level cost estimates that can be used to evaluate alternative strategies for financing the proposed WTE project. The model is intended to serve as the basis for comparing and evaluating future strategies should assumptions change as progress is made on the project.
The model is a Microsoft Excel™ spreadsheet program that projects annual costs to construct, operate, administer, and maintain the WTE facility. The model addresses major capital and operational costs under various scenarios, as described in more detail below. Several conservative assumptions were made regarding annual solid waste quantities, demographic information, escalation factors for waste growth and costs, administration costs, and WTE development costs.
Sensitivity analyses were developed using Excel’s Scenario Manager to discern differences within the scenarios evaluated. The costs of various programs and disposal options were estimated using published information on the MOA’s existing solid waste system and neighboring Boroughs, Geosyntec’s experience on other similar projects, input from the private solid waste industry, and other published information. The scenarios evaluated and key assumptions made are described in the subsections below. A copy the pro forma including input assumptions, and cash flow calculations is provided in Attachment A to this Report.
6.1 Input Assumptions and Elements To calculate potential levels of electricity generation at a proposed WTE facility, it is necessary to make general assumptions regarding the plant size (i.e., throughput capacity); lower heating value (LHV) of the solid waste feedstock; the overall efficiency of the boiler, turbine generator, and other WTE equipment and systems to covert thermal energy into electricity; and parasitic energy consumption from plant operation (e.g., to operate the air pollution control system). These factors all have ramifications on overall capital costs for the facility and energy production efficiency.
It is noted that all cost and performance estimates for the pre-feasibility study are an order-of-magnitude estimate only. Many different factors may cause costs to be higher or lower than shown. Examples include changes in plant configuration and/or actual systems and equipment; seasonal and long-term changes in solid waste generation and composition; cost of commodities due to market variability; labor rates for salaries and benefits, and the fabrication location of major plant components.
6.1.1 Operating Revenues
For modelling purposes, we have assumed annual operating revenues of about $3.1 million for biosolids incineration (roughly equal to $484 per ton), electric energy revenues to Chugach, and revenues for the sale of recovered metals from the ash stream. These are more fully discussed in the paragraphs below.

White Paper Report 60 September 2019
6.1.2 Waste Flow
To calculate annual throughput for the proposed WTE facility, an average MSW incoming stream of 1,000 tpd was assumed for the Base Case (Scenario #1) along with 20 tpd of biosolids.
6.1.3 Waste Composition and Btu Value of Incoming Waste Stream
The typical waste stream composition has changed over time. Yard waste, metals, and construction and demolition materials in MSW have been reduced by local recycling programs and waste segregation, while plastic containers have become more prevalent, driving up the energy value in MSW. Based on recent waste composition data nationwide, we have assumed a Btu value of 5,500 Btus per pound for preliminary feasibility analysis. A MOA-based waste composition and fuel analysis would be needed to confirm this calculation.
6.1.4 Capital Costs
Capital costs include the plant components, infrastructure construction, engineering design, procurement, and construction/commissioning costs. Planning-level estimates of the capital required for a mass-burn WTE facility with the components and configuration assumptions listed above were developed. As is typical for WTE projects, costs are assessed as a function of the size of the facility. Note that these costs should be considered to provide an order of magnitude expectation with a margin of error on each input assumption of +/- 20%. The cost model is based on Geosyntec’s internal database of over ten projects in the U.S. ranging in size from about 900 to 3,000 tpd as well as up-to-date plant component cost data.
The pre-feasibility total capital cost (CAPEX) is estimated at $322,679 per daily ton capacity or $322,679,000, This assumes a 17% increase in WTE costs from the lower 48 U.S., and a 5% increase in rates to account for anticipated seismic conditions in Alaska. Given the Municipality’s location to Asian manufacturers, the CAPEX may be significantly less if major parts are procured in Asia rather than North America. However, due to trade issues at the current time, it is unknown if this could occur in the foreseeable future.
The CAPEX also includes Municipality implementation costs during multi-year construction and start-up periods. The balance accounts for fixed equipment shipping/delivery, engineering, procurement, administration, vehicles and non-fixed equipment (e.g., bulldozers, loaders, and trucks), civil construction for the facility (including roadways, building enclosure with administration offices, tipping floor, pit, air emission control equipment, wastewater treatment system, and ash handling system. We have assumed that the SWS will include the cost of an ash monofill in its operating budget for the landfill.
6.1.5 Cost of Debt
It is assumed that the cost of bond debt for the MOA to fund construction of the facility could range from 3.5 and 5.0%. These ranges have been experienced by Alaska communities and agencies over the last few years.

White Paper Report 61 September 2019
6.1.6 Inflation Rate
The inflation rate since the Great Recession (2007-2019) has been relatively low, somewhere in the 2.0% range. We have used this rate over the five-year planning (2019 – 2024) and operating periods (2025-2055).
6.1.7 Gross Electrical Generation
The gross electrical generation rate has been assumed at 700 kWh/ton of MSW processed. The industry wide trend has been toward greater electrical output as boiler operating conditions (pressure / temperatures) have increased over the past years to result in higher gross electrical generation.
6.1.8 Internal Use of Electricity
The internal use of electricity for WTE plant operations has been conservatively assumed at 13 percent of gross electrical generation. Often referred to as parasitic load, this portion of the electric generation is used to power the motors and electrical systems which are necessary to operate the WTE process equipment and supporting facilities. Typical parasitic loads range from 11 – 15 percent, depending upon the processes employed at the WTE facility.
6.1.9 Net Electrical Energy Generation
The net electrical energy generation rate for a modern WTE facility in the MOA has been calculated at 609 kWh/ton of MSW processed based upon the above two assumed parameters (700 kWh/ton gross electric generation less a 13 percent parasitic load).
6.1.10 Average Electrical Energy Sales Price
Several sources of electrical prices were reviewed. For modelling purposes, we utilized avoided cost projections made by Chugach for the planning period. Various scenarios were constructed increasing and decreasing these tariffs by 10 percent.
6.1.11 Ferrous Metal Recovery Rate
The ferrous metal recovery rate has been assumed at 3.2 percent of processed MSW based upon the use of an advanced European style metal recovery system which recovers both the course and fine fraction of ferrous metals. In order to maximize the recovery of non-ferrous metals, a through removal of ferrous metals is required. The presence of ferrous metals affects the efficiency of the non-ferrous metal recovery system. As a result, there are typically multiple magnets employed in the advanced metal recovery systems, thereby maximizing the recovery of ferrous metals.
6.1.12 Non-Ferrous Metal Recovery Rate
The non-ferrous metal recovery rate has been assumed at 0.30 percent of processed MSW based upon an advanced European style metal recovery system. Non-ferrous metal recovery systems have been adopted by more and more WTE facilities in response to reliable eddy-current separation technology which has evolved over the past decade, primarily in the scrap automobile

White Paper Report 62 September 2019
metal recovery industry. Nonferrous metals in the MSW stream originate from a wide variety of sources, many of which are not collected as a part of curbside recycling programs. These sources include: home appliances, automobile parts, patio furniture, and household items. Assuming 1 percent of the processed MSW is nonferrous metals (equal to 20 percent of all metals, which is typical of European composition of residual wastes) and assuming 80 percent efficiency of modern non-ferrous separators, the non-ferrous metal recovery rate is estimated at 0.8 percent. The advanced non-ferrous metal recovery systems typically employ multiple eddy current separators for each of the range of material sizes which are screened to optimize the recovery of the valuable non-ferrous metals.
6.1.13 Potable Water Cost
Potable water cost of $5.58/1,000 gallons has been estimated for this analysis (AWWU rate). The trend within the WTE industry has been to reduce potable water by using lower quality waters for plant cooling needs. In many cases, where locally available, reclaimed water could be used as makeup water for cooling towers, fire water storage tanks, and plant irrigation. The most recent WTE project in Palm Beach County, FL (2015) used an air -cooled condenser in lieu of an evaporative cooling tower to minimize the use of local water supplies. This can be further reduced by using rain water using underground cisterns at a capacity of several thousand cubic meters for storage, which has been built for relatively low cost in Germany in the area of the waste pit (below the parking areas of the waste cranes).
6.1.14 Wastewater Disposal/Treatment Cost
The wastewater disposal / treatment rate has been estimated at a cost of $7.89/1,000 gallons for treatment by AWWU. The wastewater treatment system would be designed with a cascading system with internal wastewater flows treated so that they can be used as process water with lower quality requirements in several stages, with the last stage being used for quenching of the bottom ash, and/or evaporation of the wastewater in the flue gas treatment system, if required. In Europe, it has been a common practice or all residues of the wastewater treatment system to be returned to the waste pit to be thermally treated.
6.1.15 Bottom Ash Recycling Rate
Bottom ash recycling rate will be assumed to be zero for the base analysis. There are viable options for recycling ash residue as an alternate daily cover on existing lined landfills, along with other technologies for beneficial use of ash residue as construction aggregates, and/or feedstock for production of Portland cement. The four primary ingredients used to manufacture Portland cement (Alumina (Al2O3), Ferric Oxide (Fe2O3), Lime (CaO), and Silica (SiO2) have been found to be ideally matched in some WTE bottom ash sources. The opportunity to recycle a certain size fraction of bottom ash in local cement kilns could be explored with a local Seattle based recycling firm. The quality of bottom ash is improved by the removal of ferrous and non-ferrous metals and can be used in the manufacturing of Portland cement with the proper environmental approvals.

White Paper Report 63 September 2019
6.1.16 WTE Operation and Management Cost (Year 1)
The O&M fee for massburn WTE facilities depends upon many variables, ranging from size of plant, risks shared between owner and operator, pass-through costs for utilities, chemical and reagents, sharing of revenues associated with the sale of electricity, steam, and recovered metals. We have assumed that a private operator will be procured by the SWS due to the specialized nature of the WTE project. This year 1 O&M contractor service fee has been estimated at $30.00/ton of MSW processed for the 1,000 tpd plant, considering higher Alaska labor rates. Annual escalation of O&M service contract is typically based upon agreed upon inflation rates, which have been applied to this analysis.
6.1.17 Electrical Interconnection Costs
Typically, purchasing electric utilities charge up to $100,000 to perform a feasibility and reliability study to determine how the non-utility's distributed generation may affect their electric system. If the study reveals that there will not be any significant adverse impacts to the grid, a second investigation will be necessary to determine the specific design, hardware and electrical protection systems for the associated interconnect.
The cost of the second study along with purchasing and installing the associated hardware can be approximately $250,000. Ownership, operation and maintenance responsibilities for the newly installed interconnect equipment will reside with the incoming electric generating entity.
Additionally, any future modifications necessary to the interconnection facility, and costs associated with construction or upgrading the transmission line from the WTE facility to the nearest substation will be borne by the owner of the new generating plant. Since this project does not include a specific site, it will not be possible to accurately estimate these costs. However, as a place marker, a value of $1,000,000 has been assumed, included in the capital costs for the plant.
6.1.18 Site Acquisition Cost
A specific site has not been proposed for this study. For modelling purposes, we have assumed that the proposed plant would be sited on Borough-owned land near the CTS. No cost for site acquisition has been included at this stage of the analysis.
6.1.19 MOA Project Management Cost
Annual costs (salary plus benefits) assumed for 1.0 full time employee (FTE) for Project Manager and 0.5 FTE Assistant Project Manager is $210,000 in 2025$.
6.1.20 Municipality’s Administration Cost
The estimated cost for the Municipality to develop this project, including public education, project siting and sizing, permitting, procurement, bid evaluation and contractor selection, and project management over the duration of the construction period and WTE facility acceptance testing is 1.0 percent of the construction cost. This value would cover a six-year period and includes the hiring of a Consulting Engineer to assist with some of the technical duties.

White Paper Report 64 September 2019
6.1.21 Alternate Financing Mechanisms
Although the local fuel (and electricity purchase prices) are key parameters, there may be options to improve revenues beyond the sale of electricity, such as steam/hot and chilled water sales (CHP), implementation of special waste programs (assured destruction) to local industries and businesses, which have been proven to be significant sources of additional revenues in many WTE communities with excess capacity. The sale of steam has not been incorporated into the financial model as it is dependent of the WTE site and would require a subsequent report.
Other incentives could be via grants from federal government (USDA, DOE, DOI, or possibly future Infrastructure Reinvestment programs). Local and state incentives may also be available in Alaska for development of regional WTE projects in which larger community helps smaller neighboring rural communities manage wastes for energy and material recovery.
6.2 Model Results Overall, developing a WTE project in the MOA appears a practical goal of the ISWMP and should be desirable by the municipal government, and potentially neighboring Boroughs. A Microsoft Excel™-based, pro forma model (Model) was constructed to help guide the MOA with the implementation steps of the proposed WTE facility project. Various scenarios (36) were constructed using Excel’s Scenario Manager, which will enable the MOA to understand the projected tipping fee impacts of additional tonnage from the neighboring Boroughs, inclusion of biosolids in the incoming waste tonnage to the WTE plant, and potential fee-in tariffs from avoided energy sales to the local electric power utilities.
As shown on Figure 12 below the required tipping fees ranged from $58.04 - $85.67 depending on the scenario assumptions. Scenario 5 (1,000 tpd WTE facility) reveals the lowest projected average tipping fee of $58.04 a ton for the first year of operation (2025).

White Paper Report 65 September 2019
Figure 12: Projected Year 1 Tipping Fee (Low to High)
The Model assumes that the last 10 years of the bond debt would be zero, allowing the electricity and biosolids revenues to fully fund WTE plant operating costs enabling a zero-tip fee. A review of the results for the remaining 35 scenarios suggests the following observations:
• Inclusion of biosolids in the revenue mix for the prospective WTE plant lowers average (required?) tip fees by about $10.00 a ton.
• Increasing avoided cost revenue by 10% above current Chugach projections lowers average tip by $5.00 to $10.00 a ton.
• Increasing the size of the WTE plant by bringing in MSW from neighboring Boroughs lowers average tip fees by $8.00 to $10.00 a ton.

White Paper Report 66 September 2019
7. FINDINGS AND RECOMMENDATIONS
7.1 Summary of Main Findings Based on the pro forma model and pre-feasibility review, it appears that the development of a WTE facility in the MOA should be considered further. In addition to the quantitative review, there are a few qualitative drivers that also support this conclusion, including the need to reduce airspace consumption at the ARL and the ability to reduce MOA’s dependence on fossil fuels for electricity generation. However, it appears at this stage of analysis that the feasibility of the project is highly dependent upon the ability of MOA to reliably collect revenue from either tipping fees or electricity sales at the facility.
7.2 Roadmap to Implementation Implementation of a WTE project is a complex process which consists of several phases requiring “go/no-go” decisions to be made by the project participants. Since no two WTE projects are identical, the discussion on project implementation in this section is by nature generic in approach. This Pre-Feasibility Study consisted of a preliminary investigation of the major project elements.
In subsequent phases, the feasibility of the WTE project is evaluated in more detail. For example, an analysis is undertaken of the facility’s existing and projected waste stream to determine the ultimate size of a single or multiple unit, WTE system. Markets are examined to determine whether the energy and/or materials produced by this system can generate adequate revenues to offset the construction, operating, and financing costs for the facility. Feasible sites are investigated along with an analysis of the technical, environmental, and institutional requirements for permitting a facility.
7.2.1 Feasibility Study
A more-detailed Feasibility Study will build upon the results of this initial study. It is envisioned that MOA will request detailed regulatory, environmental, and social impact studies; engineering and geotechnical review of potential sites for the WTE facility; waste collection and transportation studies; a detailed implementation time line including procurement, financing and permitting activities; and further refining of the pro-forma model. The results of this analysis will be summarized into a formal Feasibility Report for the client’s use in implementing the project.
A formal feasibility report, which is presented to the implementing entity, usually documents all activities in this phase. The feasibility analysis ends with a “go/no-go” decision on the part of the developer to either proceed with implementation of the project or to terminate activities for the foreseeable future.
White Paper Report 67 September 2019
7.2.2 Implementation
Subsequent phases of the project implementation typically include the following:
• Phase II – Intermediate Phase encompasses all of the intermediate steps leading up to the procurement of the WTE system. This includes securing the put or pay contract for the waste stream, the energy market contract and preliminary environmental permits. Typically, many WTE owners and operators initiate their public education program and develop a concept on plant architecture and visitor centers.
• Phase III - Procurement Phase II incorporates all the steps necessary to procure the WTE system desired by the community including contracts for waste supply, energy and materials markets, plant construction and operation (if applicable); acquiring the project site; obtaining all environmental permits and/or regulatory approvals; and securing the financing for the project. Phase II usually requires the development of specialized procurement documents such as a Request-for-Qualifications (RFQ) and Request-for-Proposal (RFP). Dependent on the financing approach selected by the community, documents such as a Bond or Trust Indenture, Engineer’s Feasibility Report, and Bond Prospectus may need to be written.
• Phase IV - Plant Construction Phase III covers all the steps, necessary in the construction of the WTE facility including site preparation; final design; ordering facility equipment; installing this equipment; testing and startup of the facility; and completing acceptance tests. These tasks are usually undertaken by the selected facility contractor, although most communities obtain the services of a knowledgeable engineering consulting firm to independently monitor construction activities and the facility’s acceptance tests. Phase III usually ends with the facility successfully completing the contractual acceptance test procedures and the community issuing a certificate of completion to the contractor.
• Phase V - Plant Operations. Phase IV covers the period from plant acceptance through the length of the operations period, which may last 20 years or more in the case of a full-service contractor for a publicly or privately- owned facility. These contracts usually have clauses allowing them to be renegotiated after this time period. In contrast, operations contracts for turnkey operators can be significantly shorter, generally five years or less.
7.3 Recommendations for Future Steps and Action Items Timely implementation of a WTE facility will require a series of political, administrative, and technical actions by MOA. The following paragraphs briefly describe these future planning steps.
7.3.1 Securing Waste Flow Control
Historically, risks associated with assuring that a reliable supply of solid waste is delivered to a WTE facility are assumed by the project developer. This means that the developer must be able to fully guarantee that solid waste needed for plant operations will be delivered to its proposed

White Paper Report 68 September 2019
WTE facility. This is termed waste flow control and usually can be achieved through several methods such as: the use of interlocal legislation for solid waste flow control; long-term put-or-pay contracts by waste collectors; subsidized tipping fees; or governmental collection of solid waste.
7.3.2 Conducting a Waste Composition Study
In addition to guaranteeing delivery of solid waste to a WTE facility, the project developer usually must assume the risk of the quality of such waste. That is, the heating value or Btu content of the waste, its percentage of moisture, and percentage of combustibles. The developer typically guarantees a reference solid waste composition, which an equipment contractor assumes for design purposes.
7.3.3 Developing the Project Team
An extremely important aspect of assuring success of a program with the complexities of a WTE project is establishment of a strong project team that can guide such a long-term project to completion. While every project is unique to some extent, there are several fundamental actions, which the WTE developer must be prepared to take to place a project on the right course for the long-term. Such measures can enhance the project’s potential for success.
At the outset of a project, a key action is the establishment of an internal team which will have support from the governing body of decision-makers. Since such projects will require significant up-front development costs for staff and consulting services over several years, it is critical that there be a long-term commitment by the community to support the project. Without this commitment, it is unlikely that the project will truly ever succeed.
Ideally, the internal project team, which will direct the activities of the developer’s ’s own staff and outside consultants or advisors, should have appropriate agency heads from their key administrative, public works, financial, legal, environmental, and communications areas. The purpose of this committee is to guide the project through key decision points and to provide policy recommendations to the political decision-makers.
As the project nears the procurement phase, other experts are sometimes added by some governments to their consulting team. For example, an insurance advisor is sometimes hired to develop the technical insurance requirements for the Request-for-Proposal or Tender, and to assist in securing insurance coverage for the project. In addition, special legal counsels are often retained to assist in environmental permitting; help negotiate energy sales contracts; or assist in the preparation and negotiation of construction and operations contracts with the selected contractor for the facility.
7.3.4 Negotiating a Power Purchase Agreement
The primary objectives of any proposed WTE project are to dispose of solid waste in an economically efficient and environmentally acceptable manner. Although the derived energy from the combustion of municipal solid waste in a WTE project is a secondary benefit, the revenues gained through the sale of electricity, steam, or recovered materials help offset the cost

White Paper Report 69 September 2019
of solid waste disposal. By turning solid waste into useful energy and materials, these projects can compete against other waste disposal options, which are much less capital intensive. The financial viability of any WTE facility, therefore, is in large measure dependent upon its ability to sell energy to a long-term customer.
7.3.5 Select Facility Site and Path to Permitting
Another key milestone for the proposed WTE facility is selecting a site that is located near existing and future waste collection areas within the wasteshed. The closer the site is to the waste generation center, the lower the potential costs will be to transport the solid waste to the facility. Similarly, sites located in a line between the center of solid waste generation and the disposal landfill for the ash generated by the facility, have a higher comparative advantage as haul costs of the ash residue can be minimized. Further, distance to utilities such as potable water, waste water service, and electric grid interconnects are important considerations for facility siting.
7.3.6 Permitting Discussions
This WTE project would be a first for Alaska environmental permitting authorities. Clearly, some education would be necessary at the outset to familiarize them on the type of process, technology, and pollution control design.
7.3.7 Deciding on Facility Construction Procurement
The procurement of a WTE system by a developer is one of the final steps on the long road of project implementation. Prior to embarking on this final path of system procurement, each community would have already addressed the difficult decisions, as discussed in previous chapters, which are necessary to implement the project.
The process selected by a developer to procure a WTE facility can be approached in three different ways:
• Design, Bid, Build (D-B-B) Approach;
• Design, Build (D-B) Approach; and
• Design, Build, Operate (D-B-O) Approach
This conventional DBB approach has been modified slightly by owners in their procurement of WTE projects. Unlike the traditional DBB approach of bidding each individual piece of equipment for the project, the entire process line and turbine generator equipment, commonly referred to as the “chute-to-stack” in mass burn facilities, is bid as a single package. The A/E firm is still responsible for designing the ancillary facilities, which can then be broken out as individual bid packages such as site civil and structural foundations and building construction to minimize contractor/vendor markups for profit and risk. This approach has the advantage of minimizing the number of potential vendors that the local government or private owner must deal with, while providing a mechanism for government for sharing the risk of project performance with a private entity.

White Paper Report 70 September 2019
The Design Build approach differs from the Design, Bid, Build approach in that a single private firm called EPC contractor is responsible for the design, construction, and startup of the project. EPC stands for Engineering – Procurement – Construction. Under this approach, the ECP turnkey contractor is responsible for acquiring the necessary equipment and supplies for the project as well as ensuring that the architectural or engineering design work is prepared. Once startup and acceptance testing is completed, however, the turnkey contractor turns over the responsibility for operating the project to the community or owner. This approach may make perfect sense for those communities which have the technical capabilities to operate WTE facilities. Other communities or owners desiring to retain the option of operation may modify this approach by negotiating a short-term initial operating agreement which would require the contractor to solve design and operational problems after acceptance testing before turning over full operation to a municipal workforce.
Typically, the types of contracts drafted under this partial turnkey scheme include:
• Civil works contract
• Process EPC contract
• Engineer contract
• Interface contract
• Waste delivery
• Power purchase
• Slag tipping and slag recycling
A modification of the DB approach is for a community to assign total responsibility to a private firm, or to a consortium, over the conduct of the project, including the design, construction, startup, testing, operation, and possibly, the ownership and project financing responsibilities. The full service is defined with a concession agreement between the private firm and the community. The full-service approach can enable a community or owner to acquire the services of an WTE facility without making the community responsible for its long-term, day-to-day operation and maintenance. Design, Build, Operate, Transfer (DBOT) is a variation of this DBO approach, where the facility is transferred to the community at the end of the concession agreement period.
7.3.8 Facility Financing
WTE facilities are capital intensive, public works projects. Typically, they are usually financed by local governments through the issuance of long-term municipal debt, and/or corporate debt. Consequently, it will important for the SWS to discuss the implementation steps so that these institutions are familiar with the proposed MOA WTE project.
White Paper Report 71 September 2019
8. REFERENCES
1. American Society of Mechanical Engineers, Integrated Waste Services Association, Municipal Waste Management Association, and Solid Waste Association of North America, America’s Own Energy Source (1995).
2. CDM Smith, King County WTE Study, Task 2 – WTE Existing Conditions Memorandum (2017).
3. Confederation of European Waste-to-Energy Plants, Municipal Waste Treatment (2015). 4. Eawag, Global Waste Challenge: Situation in Developing Countries, Swiss Federal Institute
of Aquatic Science and Technology (2008). 5. Gershman, Brickner & Bratton (GBB), Meeting the Future: Evaluating the Potential of Waste
Processing Technologies to Contribute to the Solid Waste Authority’s System (2009). 6. German Ministry of Environment, Waste Incineration – A Potential Danger? The
Contribution of Waste Management To Sustainable Development in Germany. 7. Hoomweg, D. and Bhada-Tata, P, Kennedy, C, Environment: Waste Production Must Peak
This Century: Nature, October 30, hhhhtp//www.nature.com/news/environment-waste-production-must-peak-this-centrury-1.14032 (2013).
8. Lacoste, Elisabeth and Philippe Chalmin, 2006 World Waste Survey: Turning Waste Into a Resource: Veolia Environmental Services (2006).
9. Manders, Jan., Developments on Waste to Energy Across Europe, Presentation to WTERT, October 8, 2010.
10. Municipality of Anchorage, Anchorage Energy Landscape and Opportunities Analysis (2017).
11. Mat-Su Borough, Waste and Septage Management Technologies, Request for Expressions of Interest (2019).
12. Rogoff, Marc Jay. and Francois Screve, Waste-to-Energy Technologies and Project Implementation, 3rd Edition. Elsevier (2019).
13. Rogoff, Marc Jay, Waste-to-Energy Trends, MSW Management, February (2019). 14. Rogoff, Marc Jay, Waste-to-Energy Implementation Concepts, MSW Management, February
(2018). 15. Standaert, Michael, As China Pushes Waste-to-Energy Incinerators, Protests Are Mounting,
Yale Environment 360, hhtps://e360.yale.edu/features/as-china-pushes-waste-to-energy-incinerators-protests-are-mounting (2017).
16. Tetra Tech, Integrated Solid Waste Master Plan, Municipality of Anchorage, Alaska, September 2018.
17. Themelis, Nickolas and Zhixiao Zhang. WTe in China, Waste Management World. (August 2010).

White Paper Report 72 September 2019
18. World Bank. What A Waste – A Global Review of Solid Waste Management (2015).United Nations-Habitat: Solid Waste Management in the World’s Cities. United Nations Human Settlement Programme (2009).

White Paper Report 73 September 2019
ATTACHMENTS:
See Attached Files

Project No.: ME 1784 Date: 9/25/2019Client:By: M. Rogoff, S. O'Donnell
ItemPurpose and Disclaimer
Objectives
General Description of Model
2.0 Assumptions This tab lists and describes the assumptions used throughout the individual worksheet tabs. Each scenario is defined by a series of assumptions in each column. The Live Scenario column represents the scenario assumptions that are "Live" in the model. The Live Scenario can be changed on this tab, and then each worksheet reflects that "Live Scenario" input assumptions. The reference in Cell C5 is critical to the function of the scenario model. This cell controls the "Live Scenario" assumptions used for all subsequent tabs.
3. Estimate operational costs for a Waste to Energy facility as a function of the facility size.
DiscussionThis pro forma is the work product of Geosyntec. It has been prepared for and on behalf of the Muncipality of Anchorage, Alaska for its sole use. The pro forma contains proprietary logic prepared to develop a pre-feasbility stage estimate of the capital, operational, and debt services expenses, and projected revenues for a Municipal Solid Waste Mass Burn Waste to Energy Facility to manage all or part of the City of Anchorage, AK waste stream.
1. Estimate capital costs as a function of the input quantities of solid waste.2. Estimate potential revenues from the sale of energy.
4. Estimate debt service.5. Prepare various metrics analysis to summarize the pro forma results.This pro forma model uses a concept that Geosyntec refers to as "Scenario Modeling" to consider the impact of various assumptions on the budget for the WTE facility. Scenario Modeling uses the Data Table function in Excel to automatically input discrete scenarios, which are grouping of assumptions, through the pro forma model (4.0 Pro Forma) and outputting the results to a summary table (3.0 Summary Tab). The groupings of assumptions are summarized in the 2.0 Assumptions tab and labeled. For this model, the primary scenarios evaluated involve considering the net costs associated with constructing and operating a Waste to Energy Facility.
Description of Tabs

Item Discussion3.0 Summary Analysis
4.0 Pro Forma
5.0 Capex
6.0 6.0 Inflated Rev or Exp
7.0 WTE Operating Stats
This tab provides an estimate of the revenues and expenses for the Waste to Energy facility. The inputs from Tab 2.0 Assumptions are cycled through the pro forma and output to Tab 3.0 Summary Analysis. Projected revenue and operational expenses, debt services, total operational costs, net operational costs and operational and net costs $/ton metrics are presented
This tab provides planning-level estimates of the capital cost for a mass-burn Waste to Energy facility as a function of the size of the facility. Capital and operational costs are factored as a function of the size. This tab provides estimates of the key revenue and cost factors associated with the Waste to Energy Facility.
This tab provides supporting information for the various costs assumptions used throughout the pro forma model.
This tab summarizes the projected revenue and expenses and calculates various financial and other metrics. It also includes the summary table results for each scenario. This is the tab where the Live Scenario is selected.

2.0 Assumptions
Live Scenario1 Scenarios
Item Input Description Quantity Comments/Source 1 2 3 4 5 6 7 8GENERAL ASSUMPTIONS
1. Processing Rate (tons/day) 1,000 Scenario Analysis 1,000 1,000 1,000 1,000 1,000 1,000 1,000 1,0002. Annual Inflation Rate 2.0% Geosyntec Assumed3. Project Implementation 3 Yrs 3 Yrs Construction, Geosyntec Estimate4. Planning Period 2025 - 2055 Geosyntec Assumed
4.1 Base Year 2025 Geosyntec Assumed4.2 End Year 2055 Geosyntec Assumed5. Ash Generation 25% Processible Waste Flow, Geosyntec Assumed6. Availability of Unit 90% Geosyntec Assumed7. Metal Recovery
7.1 Ferrous 3.20% Processible Waste Flow, Survey of Operating FL WTE Facilities 7.2 Non Ferrous 0.30% Processible Waste Flow, Survey of Operating FL WTE Facilities 8. Lower Heating Value, LHV 5100 kcal/kg Geosyntec Assumed9. Energy Production 609 kWh/ton Processible Waste Flow, Survey of Operating FL WTE Facilities
DEBT10. Estimated Construction Cost $322,679,002 Scenario Analysis, Geosyntec Assumed
10.1 Debt Financing Percent 100% Geosyntec Assumed11. Term 20 Yrs Geosyntec Assumed12. Interest Rate 3.50% Geosyntec Assumed 3.50% 3.50% 3.50% 3.50% 3.50% 3.50% 4.00% 4.00%13. Equity $0 Geosyntec Assumed
REVENUE 14. Ferrous $75/ton Recycling Markets.Net15. Non Ferrous $1,200/ton Recycling Markets.Net16. Energy Revenues from Electricity $0.061/kWh Geosyntec Assumed $0.061/kWh $0.061/kWh $0.068/kWh $0.068/kWh $0.075/kWh $0.075/kWh $0.061/kWh $0.061/kWh17. Biosolids Incineration 3,177,000$ Geosyntec Assumed 3,177,000$ -$ 3,177,000$ -$ 3,177,000$ -$ 3,177,000$ -$
EXPENSES18. Facility Operating Fee $30.00/ton Geosyntec Assumed19. WTE Host Fee $0.00/ton Geosyntec Assumed20. Ash Disposal $60.00/ton Geosyntec Assumed, Anchorage Regional Landfill21. Utility and Materials Costs
21.1 Potable Water Cost $0.0558/gallon Geosyntec Assumed, Survey of Operating FL WTE Facilities21.2 Potable Water Usage 0.933 gallon/ton Geosyntec Assumed, Survey of Operating FL WTE Facilities21.3 Wastewater Discharge Cost $0.0789/gallon Geosyntec Assumed, Survey of Operating FL WTE Facilities21.4 Wastewater Discharge 5.7 gallon/ton Geosyntec Assumed, Survey of Operating FL WTE Facilities21.5 Reclaimed Water Cost $0.001/gallon Geosyntec Assumed, Survey of Operating FL WTE Facilities21.6 Reclaimed Water Usage 589 gallon/ton Geosyntec Assumed, Survey of Operating FL WTE Facilities21.7 Propane Cost $1.283/gallon Geosyntec Assumed, Survey of Operating FL WTE Facilities21.8 Propane Usage 0.35 gallon/ton Geosyntec Assumed, Survey of Operating FL WTE Facilities21.9 Lime Pebble Cost $204.84/ton Geosyntec Assumed, Survey of Operating FL WTE Facilities
21.10 Lime Pebble Usage 0.0082 ton/ton Geosyntec Assumed, Survey of Operating FL WTE Facilities21.11 Lime Dolo Cost $260.97/ton Geosyntec Assumed, Survey of Operating FL WTE Facilities21.12 Lime Dolo Usage 0.0018 ton/ton Geosyntec Assumed, Survey of Operating FL WTE Facilities21.13 Ammonia Cost $807.79/ton Geosyntec Assumed, Survey of Operating FL WTE Facilities21.14 Ammonia Usage 0.0010 ton/ton Geosyntec Assumed, Survey of Operating FL WTE Facilities21.15 Urea Cost $1.17/gallon Geosyntec Assumed, Survey of Operating FL WTE Facilities21.16 Urea Usage 0.2 gallon/ton Geosyntec Assumed, Survey of Operating FL WTE Facilities21.17 Carbon Cost $0.28/lb Geosyntec Assumed, Survey of Operating FL WTE Facilities21.18 Carbon Usage 0.8233 lbs/ton Geosyntec Assumed, Survey of Operating FL WTE Facilities
Cell C5 controls the selection of the Live Scenario for the pro forma model

2.0 Assumptions
Live Scenario1
Item Input Description Quantity Comments/SourceGENERAL ASSUMPTIONS
1. Processing Rate (tons/day) 1,000 Scenario Analysis2. Annual Inflation Rate 2.0% Geosyntec Assumed3. Project Implementation 3 Yrs 3 Yrs Construction, Geosyntec Estimate4. Planning Period 2025 - 2055 Geosyntec Assumed
4.1 Base Year 2025 Geosyntec Assumed4.2 End Year 2055 Geosyntec Assumed5. Ash Generation 25% Processible Waste Flow, Geosyntec Assumed6. Availability of Unit 90% Geosyntec Assumed7. Metal Recovery
7.1 Ferrous 3.20% Processible Waste Flow, Survey of Operating FL WTE Facilities 7.2 Non Ferrous 0.30% Processible Waste Flow, Survey of Operating FL WTE Facilities 8. Lower Heating Value, LHV 5100 kcal/kg Geosyntec Assumed9. Energy Production 609 kWh/ton Processible Waste Flow, Survey of Operating FL WTE Facilities
DEBT10. Estimated Construction Cost $322,679,002 Scenario Analysis, Geosyntec Assumed
10.1 Debt Financing Percent 100% Geosyntec Assumed11. Term 20 Yrs Geosyntec Assumed12. Interest Rate 3.50% Geosyntec Assumed13. Equity $0 Geosyntec Assumed
REVENUE 14. Ferrous $75/ton Recycling Markets.Net15. Non Ferrous $1,200/ton Recycling Markets.Net16. Energy Revenues from Electricity $0.061/kWh Geosyntec Assumed17. Biosolids Incineration 3,177,000$ Geosyntec Assumed
EXPENSES18. Facility Operating Fee $30.00/ton Geosyntec Assumed19. WTE Host Fee $0.00/ton Geosyntec Assumed20. Ash Disposal $60.00/ton Geosyntec Assumed, Anchorage Regional Landfill21. Utility and Materials Costs
21.1 Potable Water Cost $0.0558/gallon Geosyntec Assumed, Survey of Operating FL WTE Facilities21.2 Potable Water Usage 0.933 gallon/ton Geosyntec Assumed, Survey of Operating FL WTE Facilities21.3 Wastewater Discharge Cost $0.0789/gallon Geosyntec Assumed, Survey of Operating FL WTE Facilities21.4 Wastewater Discharge 5.7 gallon/ton Geosyntec Assumed, Survey of Operating FL WTE Facilities21.5 Reclaimed Water Cost $0.001/gallon Geosyntec Assumed, Survey of Operating FL WTE Facilities21.6 Reclaimed Water Usage 589 gallon/ton Geosyntec Assumed, Survey of Operating FL WTE Facilities21.7 Propane Cost $1.283/gallon Geosyntec Assumed, Survey of Operating FL WTE Facilities21.8 Propane Usage 0.35 gallon/ton Geosyntec Assumed, Survey of Operating FL WTE Facilities21.9 Lime Pebble Cost $204.84/ton Geosyntec Assumed, Survey of Operating FL WTE Facilities
21.10 Lime Pebble Usage 0.0082 ton/ton Geosyntec Assumed, Survey of Operating FL WTE Facilities21.11 Lime Dolo Cost $260.97/ton Geosyntec Assumed, Survey of Operating FL WTE Facilities21.12 Lime Dolo Usage 0.0018 ton/ton Geosyntec Assumed, Survey of Operating FL WTE Facilities21.13 Ammonia Cost $807.79/ton Geosyntec Assumed, Survey of Operating FL WTE Facilities21.14 Ammonia Usage 0.0010 ton/ton Geosyntec Assumed, Survey of Operating FL WTE Facilities21.15 Urea Cost $1.17/gallon Geosyntec Assumed, Survey of Operating FL WTE Facilities21.16 Urea Usage 0.2 gallon/ton Geosyntec Assumed, Survey of Operating FL WTE Facilities21.17 Carbon Cost $0.28/lb Geosyntec Assumed, Survey of Operating FL WTE Facilities21.18 Carbon Usage 0.8233 lbs/ton Geosyntec Assumed, Survey of Operating FL WTE Facilities
Cell C5 controls the selection of the Live Scenario for the pro forma model
9 10 11 12 13 14 15 16
1,000 1,000 1,000 1,000 1,000 1,000 1,000 1,000
4.00% 4.00% 4.00% 4.00% 5.00% 5.00% 5.00% 5.00%
$0.068/kWh $0.068/kWh $0.075/kWh $0.075/kWh $0.061/kWh $0.061/kWh $0.068/kWh $0.068/kWh3,177,000$ -$ 3,177,000$ -$ 3,177,000$ -$ 3,177,000$ -$

2.0 Assumptions
Live Scenario1
Item Input Description Quantity Comments/SourceGENERAL ASSUMPTIONS
1. Processing Rate (tons/day) 1,000 Scenario Analysis2. Annual Inflation Rate 2.0% Geosyntec Assumed3. Project Implementation 3 Yrs 3 Yrs Construction, Geosyntec Estimate4. Planning Period 2025 - 2055 Geosyntec Assumed
4.1 Base Year 2025 Geosyntec Assumed4.2 End Year 2055 Geosyntec Assumed5. Ash Generation 25% Processible Waste Flow, Geosyntec Assumed6. Availability of Unit 90% Geosyntec Assumed7. Metal Recovery
7.1 Ferrous 3.20% Processible Waste Flow, Survey of Operating FL WTE Facilities 7.2 Non Ferrous 0.30% Processible Waste Flow, Survey of Operating FL WTE Facilities 8. Lower Heating Value, LHV 5100 kcal/kg Geosyntec Assumed9. Energy Production 609 kWh/ton Processible Waste Flow, Survey of Operating FL WTE Facilities
DEBT10. Estimated Construction Cost $322,679,002 Scenario Analysis, Geosyntec Assumed
10.1 Debt Financing Percent 100% Geosyntec Assumed11. Term 20 Yrs Geosyntec Assumed12. Interest Rate 3.50% Geosyntec Assumed13. Equity $0 Geosyntec Assumed
REVENUE 14. Ferrous $75/ton Recycling Markets.Net15. Non Ferrous $1,200/ton Recycling Markets.Net16. Energy Revenues from Electricity $0.061/kWh Geosyntec Assumed17. Biosolids Incineration 3,177,000$ Geosyntec Assumed
EXPENSES18. Facility Operating Fee $30.00/ton Geosyntec Assumed19. WTE Host Fee $0.00/ton Geosyntec Assumed20. Ash Disposal $60.00/ton Geosyntec Assumed, Anchorage Regional Landfill21. Utility and Materials Costs
21.1 Potable Water Cost $0.0558/gallon Geosyntec Assumed, Survey of Operating FL WTE Facilities21.2 Potable Water Usage 0.933 gallon/ton Geosyntec Assumed, Survey of Operating FL WTE Facilities21.3 Wastewater Discharge Cost $0.0789/gallon Geosyntec Assumed, Survey of Operating FL WTE Facilities21.4 Wastewater Discharge 5.7 gallon/ton Geosyntec Assumed, Survey of Operating FL WTE Facilities21.5 Reclaimed Water Cost $0.001/gallon Geosyntec Assumed, Survey of Operating FL WTE Facilities21.6 Reclaimed Water Usage 589 gallon/ton Geosyntec Assumed, Survey of Operating FL WTE Facilities21.7 Propane Cost $1.283/gallon Geosyntec Assumed, Survey of Operating FL WTE Facilities21.8 Propane Usage 0.35 gallon/ton Geosyntec Assumed, Survey of Operating FL WTE Facilities21.9 Lime Pebble Cost $204.84/ton Geosyntec Assumed, Survey of Operating FL WTE Facilities
21.10 Lime Pebble Usage 0.0082 ton/ton Geosyntec Assumed, Survey of Operating FL WTE Facilities21.11 Lime Dolo Cost $260.97/ton Geosyntec Assumed, Survey of Operating FL WTE Facilities21.12 Lime Dolo Usage 0.0018 ton/ton Geosyntec Assumed, Survey of Operating FL WTE Facilities21.13 Ammonia Cost $807.79/ton Geosyntec Assumed, Survey of Operating FL WTE Facilities21.14 Ammonia Usage 0.0010 ton/ton Geosyntec Assumed, Survey of Operating FL WTE Facilities21.15 Urea Cost $1.17/gallon Geosyntec Assumed, Survey of Operating FL WTE Facilities21.16 Urea Usage 0.2 gallon/ton Geosyntec Assumed, Survey of Operating FL WTE Facilities21.17 Carbon Cost $0.28/lb Geosyntec Assumed, Survey of Operating FL WTE Facilities21.18 Carbon Usage 0.8233 lbs/ton Geosyntec Assumed, Survey of Operating FL WTE Facilities
Cell C5 controls the selection of the Live Scenario for the pro forma model
17 18 19 20 21 22 23 24
1,000 1,000 1,200 1,200 1,200 1,200 1,200 1,200
5.00% 5.00% 3.50% 3.50% 3.50% 3.50% 3.50% 3.50%
$0.075/kWh $0.075/kWh $0.061/kWh $0.061/kWh $0.068/kWh $0.068/kWh $0.075/kWh $0.075/kWh3,177,000$ -$ 3,177,000$ -$ 3,177,000$ -$ 3,177,000$ -$

2.0 Assumptions
Live Scenario1
Item Input Description Quantity Comments/SourceGENERAL ASSUMPTIONS
1. Processing Rate (tons/day) 1,000 Scenario Analysis2. Annual Inflation Rate 2.0% Geosyntec Assumed3. Project Implementation 3 Yrs 3 Yrs Construction, Geosyntec Estimate4. Planning Period 2025 - 2055 Geosyntec Assumed
4.1 Base Year 2025 Geosyntec Assumed4.2 End Year 2055 Geosyntec Assumed5. Ash Generation 25% Processible Waste Flow, Geosyntec Assumed6. Availability of Unit 90% Geosyntec Assumed7. Metal Recovery
7.1 Ferrous 3.20% Processible Waste Flow, Survey of Operating FL WTE Facilities 7.2 Non Ferrous 0.30% Processible Waste Flow, Survey of Operating FL WTE Facilities 8. Lower Heating Value, LHV 5100 kcal/kg Geosyntec Assumed9. Energy Production 609 kWh/ton Processible Waste Flow, Survey of Operating FL WTE Facilities
DEBT10. Estimated Construction Cost $322,679,002 Scenario Analysis, Geosyntec Assumed
10.1 Debt Financing Percent 100% Geosyntec Assumed11. Term 20 Yrs Geosyntec Assumed12. Interest Rate 3.50% Geosyntec Assumed13. Equity $0 Geosyntec Assumed
REVENUE 14. Ferrous $75/ton Recycling Markets.Net15. Non Ferrous $1,200/ton Recycling Markets.Net16. Energy Revenues from Electricity $0.061/kWh Geosyntec Assumed17. Biosolids Incineration 3,177,000$ Geosyntec Assumed
EXPENSES18. Facility Operating Fee $30.00/ton Geosyntec Assumed19. WTE Host Fee $0.00/ton Geosyntec Assumed20. Ash Disposal $60.00/ton Geosyntec Assumed, Anchorage Regional Landfill21. Utility and Materials Costs
21.1 Potable Water Cost $0.0558/gallon Geosyntec Assumed, Survey of Operating FL WTE Facilities21.2 Potable Water Usage 0.933 gallon/ton Geosyntec Assumed, Survey of Operating FL WTE Facilities21.3 Wastewater Discharge Cost $0.0789/gallon Geosyntec Assumed, Survey of Operating FL WTE Facilities21.4 Wastewater Discharge 5.7 gallon/ton Geosyntec Assumed, Survey of Operating FL WTE Facilities21.5 Reclaimed Water Cost $0.001/gallon Geosyntec Assumed, Survey of Operating FL WTE Facilities21.6 Reclaimed Water Usage 589 gallon/ton Geosyntec Assumed, Survey of Operating FL WTE Facilities21.7 Propane Cost $1.283/gallon Geosyntec Assumed, Survey of Operating FL WTE Facilities21.8 Propane Usage 0.35 gallon/ton Geosyntec Assumed, Survey of Operating FL WTE Facilities21.9 Lime Pebble Cost $204.84/ton Geosyntec Assumed, Survey of Operating FL WTE Facilities
21.10 Lime Pebble Usage 0.0082 ton/ton Geosyntec Assumed, Survey of Operating FL WTE Facilities21.11 Lime Dolo Cost $260.97/ton Geosyntec Assumed, Survey of Operating FL WTE Facilities21.12 Lime Dolo Usage 0.0018 ton/ton Geosyntec Assumed, Survey of Operating FL WTE Facilities21.13 Ammonia Cost $807.79/ton Geosyntec Assumed, Survey of Operating FL WTE Facilities21.14 Ammonia Usage 0.0010 ton/ton Geosyntec Assumed, Survey of Operating FL WTE Facilities21.15 Urea Cost $1.17/gallon Geosyntec Assumed, Survey of Operating FL WTE Facilities21.16 Urea Usage 0.2 gallon/ton Geosyntec Assumed, Survey of Operating FL WTE Facilities21.17 Carbon Cost $0.28/lb Geosyntec Assumed, Survey of Operating FL WTE Facilities21.18 Carbon Usage 0.8233 lbs/ton Geosyntec Assumed, Survey of Operating FL WTE Facilities
Cell C5 controls the selection of the Live Scenario for the pro forma model
25 26 27 28 29 30 31 32
1,200 1,200 1,200 1,200 1,200 1,200 1,200 1,200
4.00% 4.00% 4.00% 4.00% 4.00% 4.00% 5.00% 5.00%
$0.061/kWh $0.061/kWh $0.068/kWh $0.068/kWh $0.075/kWh $0.075/kWh $0.061/kWh $0.061/kWh3,177,000$ -$ 3,177,000$ -$ 3,177,000$ -$ 3,177,000$ -$

2.0 Assumptions
Live Scenario1
Item Input Description Quantity Comments/SourceGENERAL ASSUMPTIONS
1. Processing Rate (tons/day) 1,000 Scenario Analysis2. Annual Inflation Rate 2.0% Geosyntec Assumed3. Project Implementation 3 Yrs 3 Yrs Construction, Geosyntec Estimate4. Planning Period 2025 - 2055 Geosyntec Assumed
4.1 Base Year 2025 Geosyntec Assumed4.2 End Year 2055 Geosyntec Assumed5. Ash Generation 25% Processible Waste Flow, Geosyntec Assumed6. Availability of Unit 90% Geosyntec Assumed7. Metal Recovery
7.1 Ferrous 3.20% Processible Waste Flow, Survey of Operating FL WTE Facilities 7.2 Non Ferrous 0.30% Processible Waste Flow, Survey of Operating FL WTE Facilities 8. Lower Heating Value, LHV 5100 kcal/kg Geosyntec Assumed9. Energy Production 609 kWh/ton Processible Waste Flow, Survey of Operating FL WTE Facilities
DEBT10. Estimated Construction Cost $322,679,002 Scenario Analysis, Geosyntec Assumed
10.1 Debt Financing Percent 100% Geosyntec Assumed11. Term 20 Yrs Geosyntec Assumed12. Interest Rate 3.50% Geosyntec Assumed13. Equity $0 Geosyntec Assumed
REVENUE 14. Ferrous $75/ton Recycling Markets.Net15. Non Ferrous $1,200/ton Recycling Markets.Net16. Energy Revenues from Electricity $0.061/kWh Geosyntec Assumed17. Biosolids Incineration 3,177,000$ Geosyntec Assumed
EXPENSES18. Facility Operating Fee $30.00/ton Geosyntec Assumed19. WTE Host Fee $0.00/ton Geosyntec Assumed20. Ash Disposal $60.00/ton Geosyntec Assumed, Anchorage Regional Landfill21. Utility and Materials Costs
21.1 Potable Water Cost $0.0558/gallon Geosyntec Assumed, Survey of Operating FL WTE Facilities21.2 Potable Water Usage 0.933 gallon/ton Geosyntec Assumed, Survey of Operating FL WTE Facilities21.3 Wastewater Discharge Cost $0.0789/gallon Geosyntec Assumed, Survey of Operating FL WTE Facilities21.4 Wastewater Discharge 5.7 gallon/ton Geosyntec Assumed, Survey of Operating FL WTE Facilities21.5 Reclaimed Water Cost $0.001/gallon Geosyntec Assumed, Survey of Operating FL WTE Facilities21.6 Reclaimed Water Usage 589 gallon/ton Geosyntec Assumed, Survey of Operating FL WTE Facilities21.7 Propane Cost $1.283/gallon Geosyntec Assumed, Survey of Operating FL WTE Facilities21.8 Propane Usage 0.35 gallon/ton Geosyntec Assumed, Survey of Operating FL WTE Facilities21.9 Lime Pebble Cost $204.84/ton Geosyntec Assumed, Survey of Operating FL WTE Facilities
21.10 Lime Pebble Usage 0.0082 ton/ton Geosyntec Assumed, Survey of Operating FL WTE Facilities21.11 Lime Dolo Cost $260.97/ton Geosyntec Assumed, Survey of Operating FL WTE Facilities21.12 Lime Dolo Usage 0.0018 ton/ton Geosyntec Assumed, Survey of Operating FL WTE Facilities21.13 Ammonia Cost $807.79/ton Geosyntec Assumed, Survey of Operating FL WTE Facilities21.14 Ammonia Usage 0.0010 ton/ton Geosyntec Assumed, Survey of Operating FL WTE Facilities21.15 Urea Cost $1.17/gallon Geosyntec Assumed, Survey of Operating FL WTE Facilities21.16 Urea Usage 0.2 gallon/ton Geosyntec Assumed, Survey of Operating FL WTE Facilities21.17 Carbon Cost $0.28/lb Geosyntec Assumed, Survey of Operating FL WTE Facilities21.18 Carbon Usage 0.8233 lbs/ton Geosyntec Assumed, Survey of Operating FL WTE Facilities
Cell C5 controls the selection of the Live Scenario for the pro forma model
33 34 35 36 37 38 39 40
1,200 1,200 1,200 1,200
5.00% 5.00% 5.00% 5.00%
$0.068/kWh $0.068/kWh $0.075/kWh $0.075/kWh3,177,000$ -$ 3,177,000$ -$

Year 1 Year 1 Year 21 Year 20Tip Fee Tip Fee Tip Fee Required Operating Result
Scenario SORTED1 66.30$ 5 58.04$ 1 (4.27)$ 20 3,983,000$ 2 75.97$ 23 59.65$ 2 10.10$ 26 3,983,000$ 3 62.16$ 11 61.20$ 3 (10.40)$ 32 3,983,000$ 4 71.84$ 3 62.16$ 4 3.97$ 2 3,318,000$ 5 58.04$ 29 62.81$ 5 (16.54)$ 8 3,318,000$ 6 67.71$ 21 63.77$ 6 (2.17)$ 14 3,318,000$ 7 69.46$ 9 65.33$ 7 (4.27)$ 22 1,565,000$ 8 79.13$ 1 66.30$ 8 10.10$ 28 1,565,000$ 9 65.33$ 27 66.94$ 9 (10.40)$ 34 1,565,000$
10 75.00$ 24 67.71$ 10 3.97$ 4 1,303,000$ 11 61.20$ 6 67.71$ 11 (16.54)$ 10 1,303,000$ 12 70.87$ 17 67.74$ 12 (2.17)$ 16 1,303,000$ 13 76.00$ 19 67.90$ 13 (4.27)$ 6 (713,000)$ 14 85.67$ 35 69.35$ 14 10.10$ 12 (713,000)$ 15 71.87$ 7 69.46$ 15 (10.40)$ 18 (713,000)$ 16 81.54$ 30 70.87$ 16 3.97$ 19 (737,880)$ 17 67.74$ 12 70.87$ 17 (16.54)$ 25 (737,880)$ 18 77.42$ 25 71.07$ 18 (2.17)$ 31 (737,880)$ 19 67.90$ 22 71.83$ 19 (1.87)$ 24 (854,000)$ 20 75.96$ 4 71.84$ 20 10.10$ 30 (854,000)$ 21 63.77$ 15 71.87$ 21 (8.01)$ 36 (854,000)$ 22 71.83$ 33 73.48$ 22 3.97$ 1 (1,402,880)$ 23 59.65$ 28 75.00$ 23 (14.14)$ 7 (1,402,880)$ 24 67.71$ 10 75.00$ 24 (2.17)$ 13 (1,402,880)$ 25 71.07$ 20 75.96$ 25 (1.87)$ 21 (3,155,880)$ 26 79.13$ 2 75.97$ 26 10.10$ 27 (3,155,880)$ 27 66.94$ 13 76.00$ 27 (8.01)$ 33 (3,155,880)$ 28 75.00$ 36 77.41$ 28 3.97$ 3 (3,417,880)$ 29 62.81$ 18 77.42$ 29 (14.14)$ 9 (3,417,880)$ 30 70.87$ 31 77.61$ 30 (2.17)$ 15 (3,417,880)$ 31 77.61$ 26 79.13$ 31 (1.87)$ 5 (5,433,880)$ 32 85.67$ 8 79.13$ 32 10.10$ 11 (5,433,880)$ 33 73.48$ 34 81.54$ 33 (8.01)$ 17 (5,433,880)$ 34 81.54$ 16 81.54$ 34 3.97$ 23 (5,574,880)$ 35 69.35$ 32 85.67$ 35 (14.14)$ 29 (5,574,880)$ 36 77.41$ 14 85.67$ 36 (2.17)$ 35 (5,574,880)$
Projected Year 1 Tipping Fee by Scenario (Low to High)

$55.00
$60.00
$65.00
$70.00
$75.00
$80.00
$85.00
$90.00
5 23 11 3 29 21 9 1 27 24 6 17 19 35 7 30 12 25 22 4 15 33 28 10 20 2 13 36 18 31 26 8 34 16 32 14
Projected Year 1 Tipping Fee by Scenario (Low to High)

Chugach Electric Association, Inc. Estimated and Preliminary Projected Avoided Cost
Year 2019 2020 2021 2022 2023 2024 2025 2026 2027 2028 2029 2030 2031 2032 2033 2034 2035 2036 2037 2038 2039Avoided Cost Weighted Avg Market Price ($/MWh) 60.43 61.68 62.93 64.24 61.57 59.67 60.78 61.90 63.08 63.86 64.33 64.98 65.74 66.39 63.40 65.03 66.71 68.44 70.25 72.08 73.97

Chugach Electric Association, Inc. Estimated a
YearAvoided Cost Weighted Avg Market Price ($/MWh)
2040 2041 2042 2043 2044 2045 2046 2047 2048 2049 2050 2051 2052 2053
75.90 77.91 79.98 82.12 84.33 86.62 88.96 91.40 93.96 96.56 99.25 102.02 104.86 107.78 Model FIW1-Test Yr Solution.xml (Plexos output)

3.0 Summary
Live Scenario1 Scenarios
Item Description Quantity 1 2 3 4 5 6 7 8 9 10 11 12 13GENERAL ASSUMPTIONS
1. Processing Rate (tons/day) 1,000 1,000 1,000 1,000 1,000 1,000 1,000 1,000 1,000 1,000 1,000 1,000 1,000 1,0002. Interest Rate - Debt Financing 3.50% 3.50% 3.50% 3.50% 3.50% 3.50% 3.50% 4.00% 4.00% 4.00% 4.00% 4.00% 4.00% 5.00%3. Energy Revenues from Electricity $0.06/kWh $0.061/kWh $0.061/kWh $0.068/kWh $0.068/kWh $0.075/kWh $0.075/kWh $0.061/kWh $0.061/kWh $0.068/kWh $0.068/kWh $0.075/kWh $0.075/kWh $0.061/kWh4. Biosolids Incineration Revenue 3,177,000$ 3,177,000$ -$ 3,177,000$ -$ 3,177,000$ -$ 3,177,000$ -$ 3,177,000$ -$ 3,177,000$ -$ 3,177,000$
5. Summary of Net Costs (Revenue - Expenses), $/ton2025 - 2029 average tip fee 66.18$ 66.18$ 76.24$ 61.88$ 71.95$ 57.58$ 67.65$ 69.34$ 79.41$ 65.04$ 75.11$ 60.75$ 70.81$ 75.88$ 2030 - 2034 average tip fee 65.87$ 65.87$ 76.99$ 61.13$ 72.24$ 56.38$ 67.50$ 69.03$ 80.15$ 64.29$ 75.40$ 59.55$ 70.66$ 75.58$ 2035 - 2039 average tip fee 65.53$ 65.53$ 77.80$ 60.29$ 72.56$ 55.06$ 67.33$ 68.70$ 80.97$ 63.46$ 75.73$ 58.22$ 70.49$ 75.24$ 2040 - 2044 average tip fee 65.16$ 65.16$ 78.71$ 59.38$ 72.92$ 53.59$ 67.14$ 68.32$ 81.87$ 62.54$ 76.09$ 56.76$ 70.30$ 74.87$ 2045 - 2049 average tip fee (4.36)$ (4.36)$ 10.59$ (10.75)$ 4.21$ (17.14)$ (2.18)$ (4.36)$ 10.59$ (10.75)$ 4.21$ (17.14)$ (2.18)$ (4.36)$ 2050 - 2054 average tip fee (4.82)$ (4.82)$ 11.70$ (11.87)$ 4.65$ (18.92)$ (2.40)$ (4.82)$ 11.70$ (11.87)$ 4.65$ (18.92)$ (2.40)$ (4.82)$ 2025 - 2054 average tip fee 54.00$ 42.26$ 55.34$ 36.68$ 49.75$ 31.09$ 44.17$ 44.37$ 57.45$ 38.79$ 51.86$ 33.20$ 46.28$ 48.73$
6. Net Costs (Revenue - Expenses), $/ton2025 66.30$ 66.30$ 75.97$ 62.16$ 71.84$ 58.04$ 67.71$ 69.46$ 79.13$ 65.33$ 75.00$ 61.20$ 70.87$ 76.00$ 2026 66.23$ 66.23$ 76.10$ 62.02$ 71.89$ 57.81$ 67.68$ 69.40$ 79.26$ 65.19$ 75.05$ 60.97$ 70.84$ 75.94$ 2027 66.18$ 66.18$ 76.24$ 61.88$ 71.95$ 57.59$ 67.65$ 69.34$ 79.40$ 65.04$ 75.11$ 60.75$ 70.81$ 75.88$ 2028 66.12$ 66.12$ 76.38$ 61.74$ 72.00$ 57.35$ 67.62$ 69.28$ 79.55$ 64.90$ 75.16$ 60.52$ 70.78$ 75.83$ 2029 66.06$ 66.06$ 76.53$ 61.59$ 72.06$ 57.12$ 67.59$ 69.22$ 79.69$ 64.75$ 75.22$ 60.29$ 70.75$ 75.77$ 2030 66.00$ 66.00$ 76.68$ 61.44$ 72.12$ 56.88$ 67.56$ 69.16$ 79.84$ 64.60$ 75.28$ 60.04$ 70.72$ 75.70$ 2031 65.94$ 65.94$ 76.83$ 61.28$ 72.18$ 56.64$ 67.53$ 69.10$ 79.99$ 64.45$ 75.34$ 59.80$ 70.69$ 75.64$ 2032 65.87$ 65.87$ 76.98$ 61.13$ 72.24$ 56.39$ 67.49$ 69.04$ 80.14$ 64.29$ 75.40$ 59.55$ 70.66$ 75.58$ 2033 65.81$ 65.81$ 77.14$ 60.97$ 72.30$ 56.13$ 67.46$ 68.97$ 80.30$ 64.13$ 75.46$ 59.30$ 70.63$ 75.52$ 2034 65.74$ 65.74$ 77.30$ 60.81$ 72.37$ 55.88$ 67.43$ 68.91$ 80.46$ 63.97$ 75.53$ 59.04$ 70.59$ 75.45$ 2035 65.67$ 65.67$ 77.46$ 60.64$ 72.43$ 55.61$ 67.40$ 68.84$ 80.63$ 63.80$ 75.59$ 58.77$ 70.56$ 75.38$ 2036 65.61$ 65.61$ 77.63$ 60.47$ 72.50$ 55.34$ 67.36$ 68.77$ 80.79$ 63.63$ 75.66$ 58.50$ 70.53$ 75.32$ 2037 65.53$ 65.53$ 77.80$ 60.30$ 72.56$ 55.06$ 67.33$ 68.70$ 80.96$ 63.46$ 75.73$ 58.23$ 70.49$ 75.24$ 2038 65.46$ 65.46$ 77.98$ 60.12$ 72.63$ 54.78$ 67.29$ 68.63$ 81.14$ 63.28$ 75.80$ 57.95$ 70.45$ 75.17$ 2039 65.39$ 65.39$ 78.15$ 59.94$ 72.70$ 54.49$ 67.25$ 68.55$ 81.32$ 63.11$ 75.87$ 57.66$ 70.42$ 75.10$ 2040 65.32$ 65.32$ 78.33$ 59.76$ 72.78$ 54.20$ 67.22$ 68.48$ 81.50$ 62.92$ 75.94$ 57.37$ 70.38$ 75.03$ 2041 65.24$ 65.24$ 78.52$ 59.57$ 72.85$ 53.91$ 67.18$ 68.40$ 81.68$ 62.74$ 76.01$ 57.07$ 70.34$ 74.95$ 2042 65.16$ 65.16$ 78.71$ 59.38$ 72.92$ 53.60$ 67.14$ 68.33$ 81.87$ 62.54$ 76.09$ 56.76$ 70.30$ 74.87$ 2043 65.08$ 65.08$ 78.90$ 59.19$ 73.00$ 53.29$ 67.10$ 68.25$ 82.06$ 62.35$ 76.16$ 56.45$ 70.26$ 74.79$ 2044 65.00$ 65.00$ 79.09$ 58.99$ 73.08$ 52.97$ 67.06$ 68.16$ 82.26$ 62.15$ 76.24$ 56.13$ 70.23$ 74.71$ 2045 (4.19)$ (4.19)$ 10.18$ (10.33)$ 4.04$ (16.46)$ (2.09)$ (4.19)$ 10.18$ (10.33)$ 4.04$ (16.46)$ (2.09)$ (4.19)$ 2046 (4.28)$ (4.28)$ 10.38$ (10.54)$ 4.12$ (16.79)$ (2.13)$ (4.28)$ 10.38$ (10.54)$ 4.12$ (16.79)$ (2.13)$ (4.28)$ 2047 (4.36)$ (4.36)$ 10.59$ (10.75)$ 4.20$ (17.13)$ (2.18)$ (4.36)$ 10.59$ (10.75)$ 4.20$ (17.13)$ (2.18)$ (4.36)$ 2048 (4.45)$ (4.45)$ 10.80$ (10.96)$ 4.29$ (17.47)$ (2.22)$ (4.45)$ 10.80$ (10.96)$ 4.29$ (17.47)$ (2.22)$ (4.45)$ 2049 (4.54)$ (4.54)$ 11.02$ (11.18)$ 4.37$ (17.82)$ (2.26)$ (4.54)$ 11.02$ (11.18)$ 4.37$ (17.82)$ (2.26)$ (4.54)$ 2050 (4.63)$ (4.63)$ 11.24$ (11.40)$ 4.46$ (18.18)$ (2.31)$ (4.63)$ 11.24$ (11.40)$ 4.46$ (18.18)$ (2.31)$ (4.63)$ 2051 (4.72)$ (4.72)$ 11.46$ (11.63)$ 4.55$ (18.54)$ (2.36)$ (4.72)$ 11.46$ (11.63)$ 4.55$ (18.54)$ (2.36)$ (4.72)$ 2052 (4.82)$ (4.82)$ 11.69$ (11.86)$ 4.65$ (18.91)$ (2.40)$ (4.82)$ 11.69$ (11.86)$ 4.65$ (18.91)$ (2.40)$ (4.82)$ 2053 (4.91)$ (4.91)$ 11.93$ (12.10)$ 4.74$ (19.29)$ (2.45)$ (4.91)$ 11.93$ (12.10)$ 4.74$ (19.29)$ (2.45)$ (4.91)$ 2054 (5.01)$ (5.01)$ 12.16$ (12.34)$ 4.83$ (19.67)$ (2.50)$ (5.01)$ 12.16$ (12.34)$ 4.83$ (19.67)$ (2.50)$ (5.01)$ 2055 (5.11)$ (5.11)$ 12.41$ (12.59)$ 4.93$ (20.07)$ (2.55)$ (5.11)$ 12.41$ (12.59)$ 4.93$ (20.07)$ (2.55)$ (5.11)$
7. Total Revenue2025 17,355,000$ 17,355,000$ 14,178,000$ 18,712,000$ 15,535,000$ 20,068,000$ 16,891,000$ 17,355,000$ 14,178,000$ 18,712,000$ 15,535,000$ 20,068,000$ 16,891,000$ 17,355,000$ 2026 17,703,000$ 17,703,000$ 14,462,000$ 19,086,000$ 15,846,000$ 20,470,000$ 17,229,000$ 17,703,000$ 14,462,000$ 19,086,000$ 15,846,000$ 20,470,000$ 17,229,000$ 17,703,000$ 2027 18,057,000$ 18,057,000$ 14,751,000$ 19,468,000$ 16,162,000$ 20,879,000$ 17,574,000$ 18,057,000$ 14,751,000$ 19,468,000$ 16,162,000$ 20,879,000$ 17,574,000$ 18,057,000$ 2028 18,418,000$ 18,418,000$ 15,046,000$ 19,857,000$ 16,486,000$ 21,297,000$ 17,925,000$ 18,418,000$ 15,046,000$ 19,857,000$ 16,486,000$ 21,297,000$ 17,925,000$ 18,418,000$ 2029 18,786,000$ 18,786,000$ 15,347,000$ 20,254,000$ 16,815,000$ 21,722,000$ 18,284,000$ 18,786,000$ 15,347,000$ 20,254,000$ 16,815,000$ 21,722,000$ 18,284,000$ 18,786,000$ 2030 19,162,000$ 19,162,000$ 15,654,000$ 20,659,000$ 17,152,000$ 22,157,000$ 18,649,000$ 19,162,000$ 15,654,000$ 20,659,000$ 17,152,000$ 22,157,000$ 18,649,000$ 19,162,000$

Live Scenario1 Scenarios
Item Description Quantity 1 2 3 4 5 6 7 8 9 10 11 12 13GENERAL ASSUMPTIONS
2031 19,545,000$ 19,545,000$ 15,967,000$ 21,073,000$ 17,495,000$ 22,600,000$ 19,022,000$ 19,545,000$ 15,967,000$ 21,073,000$ 17,495,000$ 22,600,000$ 19,022,000$ 19,545,000$ 2032 19,936,000$ 19,936,000$ 16,287,000$ 21,494,000$ 17,845,000$ 23,052,000$ 19,403,000$ 19,936,000$ 16,287,000$ 21,494,000$ 17,845,000$ 23,052,000$ 19,403,000$ 19,936,000$ 2033 20,335,000$ 20,335,000$ 16,612,000$ 21,924,000$ 18,202,000$ 23,513,000$ 19,791,000$ 20,335,000$ 16,612,000$ 21,924,000$ 18,202,000$ 23,513,000$ 19,791,000$ 20,335,000$ 2034 20,741,000$ 20,741,000$ 16,945,000$ 22,362,000$ 18,566,000$ 23,983,000$ 20,187,000$ 20,741,000$ 16,945,000$ 22,362,000$ 18,566,000$ 23,983,000$ 20,187,000$ 20,741,000$ 2035 21,156,000$ 21,156,000$ 17,283,000$ 22,810,000$ 18,937,000$ 24,463,000$ 20,590,000$ 21,156,000$ 17,283,000$ 22,810,000$ 18,937,000$ 24,463,000$ 20,590,000$ 21,156,000$ 2036 21,579,000$ 21,579,000$ 17,629,000$ 23,266,000$ 19,316,000$ 24,952,000$ 21,002,000$ 21,579,000$ 17,629,000$ 23,266,000$ 19,316,000$ 24,952,000$ 21,002,000$ 21,579,000$ 2037 22,011,000$ 22,011,000$ 17,982,000$ 23,731,000$ 19,702,000$ 25,451,000$ 21,422,000$ 22,011,000$ 17,982,000$ 23,731,000$ 19,702,000$ 25,451,000$ 21,422,000$ 22,011,000$ 2038 22,451,000$ 22,451,000$ 18,341,000$ 24,206,000$ 20,096,000$ 25,960,000$ 21,851,000$ 22,451,000$ 18,341,000$ 24,206,000$ 20,096,000$ 25,960,000$ 21,851,000$ 22,451,000$ 2039 22,900,000$ 22,900,000$ 18,708,000$ 24,690,000$ 20,498,000$ 26,480,000$ 22,288,000$ 22,900,000$ 18,708,000$ 24,690,000$ 20,498,000$ 26,480,000$ 22,288,000$ 22,900,000$ 2040 23,358,000$ 23,358,000$ 19,082,000$ 25,184,000$ 20,908,000$ 27,009,000$ 22,733,000$ 23,358,000$ 19,082,000$ 25,184,000$ 20,908,000$ 27,009,000$ 22,733,000$ 23,358,000$ 2041 23,825,000$ 23,825,000$ 19,464,000$ 25,687,000$ 21,326,000$ 27,549,000$ 23,188,000$ 23,825,000$ 19,464,000$ 25,687,000$ 21,326,000$ 27,549,000$ 23,188,000$ 23,825,000$ 2042 24,302,000$ 24,302,000$ 19,853,000$ 26,201,000$ 21,753,000$ 28,100,000$ 23,652,000$ 24,302,000$ 19,853,000$ 26,201,000$ 21,753,000$ 28,100,000$ 23,652,000$ 24,302,000$ 2043 24,788,000$ 24,788,000$ 20,250,000$ 26,725,000$ 22,188,000$ 28,662,000$ 24,125,000$ 24,788,000$ 20,250,000$ 26,725,000$ 22,188,000$ 28,662,000$ 24,125,000$ 24,788,000$ 2044 25,284,000$ 25,284,000$ 20,655,000$ 27,260,000$ 22,631,000$ 29,236,000$ 24,607,000$ 25,284,000$ 20,655,000$ 27,260,000$ 22,631,000$ 29,236,000$ 24,607,000$ 25,284,000$ 2045 25,789,000$ 25,789,000$ 21,068,000$ 27,805,000$ 23,084,000$ 29,820,000$ 25,099,000$ 25,789,000$ 21,068,000$ 27,805,000$ 23,084,000$ 29,820,000$ 25,099,000$ 25,789,000$ 2046 26,305,000$ 26,305,000$ 21,490,000$ 28,361,000$ 23,546,000$ 30,417,000$ 25,601,000$ 26,305,000$ 21,490,000$ 28,361,000$ 23,546,000$ 30,417,000$ 25,601,000$ 26,305,000$ 2047 26,831,000$ 26,831,000$ 21,920,000$ 28,928,000$ 24,017,000$ 31,025,000$ 26,113,000$ 26,831,000$ 21,920,000$ 28,928,000$ 24,017,000$ 31,025,000$ 26,113,000$ 26,831,000$ 2048 27,368,000$ 27,368,000$ 22,358,000$ 29,507,000$ 24,497,000$ 31,646,000$ 26,636,000$ 27,368,000$ 22,358,000$ 29,507,000$ 24,497,000$ 31,646,000$ 26,636,000$ 27,368,000$ 2049 27,915,000$ 27,915,000$ 22,805,000$ 30,097,000$ 24,987,000$ 32,278,000$ 27,168,000$ 27,915,000$ 22,805,000$ 30,097,000$ 24,987,000$ 32,278,000$ 27,168,000$ 27,915,000$ 2050 28,473,000$ 28,473,000$ 23,261,000$ 30,699,000$ 25,487,000$ 32,924,000$ 27,712,000$ 28,473,000$ 23,261,000$ 30,699,000$ 25,487,000$ 32,924,000$ 27,712,000$ 28,473,000$ 2051 29,043,000$ 29,043,000$ 23,726,000$ 31,313,000$ 25,996,000$ 33,583,000$ 28,266,000$ 29,043,000$ 23,726,000$ 31,313,000$ 25,996,000$ 33,583,000$ 28,266,000$ 29,043,000$ 2052 29,624,000$ 29,624,000$ 24,201,000$ 31,939,000$ 26,516,000$ 34,254,000$ 28,831,000$ 29,624,000$ 24,201,000$ 31,939,000$ 26,516,000$ 34,254,000$ 28,831,000$ 29,624,000$ 2053 30,216,000$ 30,216,000$ 24,685,000$ 32,578,000$ 27,047,000$ 34,939,000$ 29,408,000$ 30,216,000$ 24,685,000$ 32,578,000$ 27,047,000$ 34,939,000$ 29,408,000$ 30,216,000$ 2054 30,821,000$ 30,821,000$ 25,179,000$ 33,229,000$ 27,587,000$ 35,638,000$ 29,996,000$ 30,821,000$ 25,179,000$ 33,229,000$ 27,587,000$ 35,638,000$ 29,996,000$ 30,821,000$ 2055 31,437,000$ 31,437,000$ 25,682,000$ 33,894,000$ 28,139,000$ 36,351,000$ 30,596,000$ 31,437,000$ 25,682,000$ 33,894,000$ 28,139,000$ 36,351,000$ 30,596,000$ 31,437,000$
8. Total Costs2025 39,133,000$ 39,133,000$ 39,133,000$ 39,133,000$ 39,133,000$ 39,133,000$ 39,133,000$ 40,172,000$ 40,172,000$ 40,172,000$ 40,172,000$ 40,172,000$ 40,172,000$ 42,322,000$ 2026 39,461,000$ 39,461,000$ 39,461,000$ 39,461,000$ 39,461,000$ 39,461,000$ 39,461,000$ 40,500,000$ 40,500,000$ 40,500,000$ 40,500,000$ 40,500,000$ 40,500,000$ 42,650,000$ 2027 39,796,000$ 39,796,000$ 39,796,000$ 39,796,000$ 39,796,000$ 39,796,000$ 39,796,000$ 40,835,000$ 40,835,000$ 40,835,000$ 40,835,000$ 40,835,000$ 40,835,000$ 42,985,000$ 2028 40,138,000$ 40,138,000$ 40,138,000$ 40,138,000$ 40,138,000$ 40,138,000$ 40,138,000$ 41,177,000$ 41,177,000$ 41,177,000$ 41,177,000$ 41,177,000$ 41,177,000$ 43,327,000$ 2029 40,487,000$ 40,487,000$ 40,487,000$ 40,487,000$ 40,487,000$ 40,487,000$ 40,487,000$ 41,526,000$ 41,526,000$ 41,526,000$ 41,526,000$ 41,526,000$ 41,526,000$ 43,676,000$ 2030 40,842,000$ 40,842,000$ 40,842,000$ 40,842,000$ 40,842,000$ 40,842,000$ 40,842,000$ 41,881,000$ 41,881,000$ 41,881,000$ 41,881,000$ 41,881,000$ 41,881,000$ 44,031,000$ 2031 41,205,000$ 41,205,000$ 41,205,000$ 41,205,000$ 41,205,000$ 41,205,000$ 41,205,000$ 42,244,000$ 42,244,000$ 42,244,000$ 42,244,000$ 42,244,000$ 42,244,000$ 44,394,000$ 2032 41,575,000$ 41,575,000$ 41,575,000$ 41,575,000$ 41,575,000$ 41,575,000$ 41,575,000$ 42,614,000$ 42,614,000$ 42,614,000$ 42,614,000$ 42,614,000$ 42,614,000$ 44,764,000$ 2033 41,953,000$ 41,953,000$ 41,953,000$ 41,953,000$ 41,953,000$ 41,953,000$ 41,953,000$ 42,992,000$ 42,992,000$ 42,992,000$ 42,992,000$ 42,992,000$ 42,992,000$ 45,142,000$ 2034 42,338,000$ 42,338,000$ 42,338,000$ 42,338,000$ 42,338,000$ 42,338,000$ 42,338,000$ 43,377,000$ 43,377,000$ 43,377,000$ 43,377,000$ 43,377,000$ 43,377,000$ 45,527,000$ 2035 42,730,000$ 42,730,000$ 42,730,000$ 42,730,000$ 42,730,000$ 42,730,000$ 42,730,000$ 43,769,000$ 43,769,000$ 43,769,000$ 43,769,000$ 43,769,000$ 43,769,000$ 45,919,000$ 2036 43,131,000$ 43,131,000$ 43,131,000$ 43,131,000$ 43,131,000$ 43,131,000$ 43,131,000$ 44,170,000$ 44,170,000$ 44,170,000$ 44,170,000$ 44,170,000$ 44,170,000$ 46,320,000$ 2037 43,539,000$ 43,539,000$ 43,539,000$ 43,539,000$ 43,539,000$ 43,539,000$ 43,539,000$ 44,578,000$ 44,578,000$ 44,578,000$ 44,578,000$ 44,578,000$ 44,578,000$ 46,728,000$ 2038 43,956,000$ 43,956,000$ 43,956,000$ 43,956,000$ 43,956,000$ 43,956,000$ 43,956,000$ 44,995,000$ 44,995,000$ 44,995,000$ 44,995,000$ 44,995,000$ 44,995,000$ 47,145,000$ 2039 44,381,000$ 44,381,000$ 44,381,000$ 44,381,000$ 44,381,000$ 44,381,000$ 44,381,000$ 45,420,000$ 45,420,000$ 45,420,000$ 45,420,000$ 45,420,000$ 45,420,000$ 47,570,000$ 2040 44,815,000$ 44,815,000$ 44,815,000$ 44,815,000$ 44,815,000$ 44,815,000$ 44,815,000$ 45,854,000$ 45,854,000$ 45,854,000$ 45,854,000$ 45,854,000$ 45,854,000$ 48,004,000$ 2041 45,257,000$ 45,257,000$ 45,257,000$ 45,257,000$ 45,257,000$ 45,257,000$ 45,257,000$ 46,296,000$ 46,296,000$ 46,296,000$ 46,296,000$ 46,296,000$ 46,296,000$ 48,446,000$ 2042 45,708,000$ 45,708,000$ 45,708,000$ 45,708,000$ 45,708,000$ 45,708,000$ 45,708,000$ 46,747,000$ 46,747,000$ 46,747,000$ 46,747,000$ 46,747,000$ 46,747,000$ 48,897,000$ 2043 46,168,000$ 46,168,000$ 46,168,000$ 46,168,000$ 46,168,000$ 46,168,000$ 46,168,000$ 47,207,000$ 47,207,000$ 47,207,000$ 47,207,000$ 47,207,000$ 47,207,000$ 49,357,000$ 2044 46,637,000$ 46,637,000$ 46,637,000$ 46,637,000$ 46,637,000$ 46,637,000$ 46,637,000$ 47,676,000$ 47,676,000$ 47,676,000$ 47,676,000$ 47,676,000$ 47,676,000$ 49,826,000$ 2045 24,412,000$ 24,412,000$ 24,412,000$ 24,412,000$ 24,412,000$ 24,412,000$ 24,412,000$ 24,412,000$ 24,412,000$ 24,412,000$ 24,412,000$ 24,412,000$ 24,412,000$ 24,412,000$ 2046 24,900,000$ 24,900,000$ 24,900,000$ 24,900,000$ 24,900,000$ 24,900,000$ 24,900,000$ 24,900,000$ 24,900,000$ 24,900,000$ 24,900,000$ 24,900,000$ 24,900,000$ 24,900,000$ 2047 25,398,000$ 25,398,000$ 25,398,000$ 25,398,000$ 25,398,000$ 25,398,000$ 25,398,000$ 25,398,000$ 25,398,000$ 25,398,000$ 25,398,000$ 25,398,000$ 25,398,000$ 25,398,000$ 2048 25,906,000$ 25,906,000$ 25,906,000$ 25,906,000$ 25,906,000$ 25,906,000$ 25,906,000$ 25,906,000$ 25,906,000$ 25,906,000$ 25,906,000$ 25,906,000$ 25,906,000$ 25,906,000$ 2049 26,424,000$ 26,424,000$ 26,424,000$ 26,424,000$ 26,424,000$ 26,424,000$ 26,424,000$ 26,424,000$ 26,424,000$ 26,424,000$ 26,424,000$ 26,424,000$ 26,424,000$ 26,424,000$ 2050 26,953,000$ 26,953,000$ 26,953,000$ 26,953,000$ 26,953,000$ 26,953,000$ 26,953,000$ 26,953,000$ 26,953,000$ 26,953,000$ 26,953,000$ 26,953,000$ 26,953,000$ 26,953,000$ 2051 27,492,000$ 27,492,000$ 27,492,000$ 27,492,000$ 27,492,000$ 27,492,000$ 27,492,000$ 27,492,000$ 27,492,000$ 27,492,000$ 27,492,000$ 27,492,000$ 27,492,000$ 27,492,000$ 2052 28,042,000$ 28,042,000$ 28,042,000$ 28,042,000$ 28,042,000$ 28,042,000$ 28,042,000$ 28,042,000$ 28,042,000$ 28,042,000$ 28,042,000$ 28,042,000$ 28,042,000$ 28,042,000$ 2053 28,603,000$ 28,603,000$ 28,603,000$ 28,603,000$ 28,603,000$ 28,603,000$ 28,603,000$ 28,603,000$ 28,603,000$ 28,603,000$ 28,603,000$ 28,603,000$ 28,603,000$ 28,603,000$ 2054 29,175,000$ 29,175,000$ 29,175,000$ 29,175,000$ 29,175,000$ 29,175,000$ 29,175,000$ 29,175,000$ 29,175,000$ 29,175,000$ 29,175,000$ 29,175,000$ 29,175,000$ 29,175,000$ 2055 29,758,000$ 29,758,000$ 29,758,000$ 29,758,000$ 29,758,000$ 29,758,000$ 29,758,000$ 29,758,000$ 29,758,000$ 29,758,000$ 29,758,000$ 29,758,000$ 29,758,000$ 29,758,000$

Live Scenario1 Scenarios
Item Description Quantity 1 2 3 4 5 6 7 8 9 10 11 12 13GENERAL ASSUMPTIONS
9. Operating Costs2025 16,429,000$ 16,429,000$ 16,429,000$ 16,429,000$ 16,429,000$ 16,429,000$ 16,429,000$ 16,429,000$ 16,429,000$ 16,429,000$ 16,429,000$ 16,429,000$ 16,429,000$ 16,429,000$ 2026 16,757,000$ 16,757,000$ 16,757,000$ 16,757,000$ 16,757,000$ 16,757,000$ 16,757,000$ 16,757,000$ 16,757,000$ 16,757,000$ 16,757,000$ 16,757,000$ 16,757,000$ 16,757,000$ 2027 17,092,000$ 17,092,000$ 17,092,000$ 17,092,000$ 17,092,000$ 17,092,000$ 17,092,000$ 17,092,000$ 17,092,000$ 17,092,000$ 17,092,000$ 17,092,000$ 17,092,000$ 17,092,000$ 2028 17,434,000$ 17,434,000$ 17,434,000$ 17,434,000$ 17,434,000$ 17,434,000$ 17,434,000$ 17,434,000$ 17,434,000$ 17,434,000$ 17,434,000$ 17,434,000$ 17,434,000$ 17,434,000$ 2029 17,783,000$ 17,783,000$ 17,783,000$ 17,783,000$ 17,783,000$ 17,783,000$ 17,783,000$ 17,783,000$ 17,783,000$ 17,783,000$ 17,783,000$ 17,783,000$ 17,783,000$ 17,783,000$ 2030 18,138,000$ 18,138,000$ 18,138,000$ 18,138,000$ 18,138,000$ 18,138,000$ 18,138,000$ 18,138,000$ 18,138,000$ 18,138,000$ 18,138,000$ 18,138,000$ 18,138,000$ 18,138,000$ 2031 18,501,000$ 18,501,000$ 18,501,000$ 18,501,000$ 18,501,000$ 18,501,000$ 18,501,000$ 18,501,000$ 18,501,000$ 18,501,000$ 18,501,000$ 18,501,000$ 18,501,000$ 18,501,000$ 2032 18,871,000$ 18,871,000$ 18,871,000$ 18,871,000$ 18,871,000$ 18,871,000$ 18,871,000$ 18,871,000$ 18,871,000$ 18,871,000$ 18,871,000$ 18,871,000$ 18,871,000$ 18,871,000$ 2033 19,249,000$ 19,249,000$ 19,249,000$ 19,249,000$ 19,249,000$ 19,249,000$ 19,249,000$ 19,249,000$ 19,249,000$ 19,249,000$ 19,249,000$ 19,249,000$ 19,249,000$ 19,249,000$ 2034 19,634,000$ 19,634,000$ 19,634,000$ 19,634,000$ 19,634,000$ 19,634,000$ 19,634,000$ 19,634,000$ 19,634,000$ 19,634,000$ 19,634,000$ 19,634,000$ 19,634,000$ 19,634,000$ 2035 20,026,000$ 20,026,000$ 20,026,000$ 20,026,000$ 20,026,000$ 20,026,000$ 20,026,000$ 20,026,000$ 20,026,000$ 20,026,000$ 20,026,000$ 20,026,000$ 20,026,000$ 20,026,000$ 2036 20,427,000$ 20,427,000$ 20,427,000$ 20,427,000$ 20,427,000$ 20,427,000$ 20,427,000$ 20,427,000$ 20,427,000$ 20,427,000$ 20,427,000$ 20,427,000$ 20,427,000$ 20,427,000$ 2037 20,835,000$ 20,835,000$ 20,835,000$ 20,835,000$ 20,835,000$ 20,835,000$ 20,835,000$ 20,835,000$ 20,835,000$ 20,835,000$ 20,835,000$ 20,835,000$ 20,835,000$ 20,835,000$ 2038 21,252,000$ 21,252,000$ 21,252,000$ 21,252,000$ 21,252,000$ 21,252,000$ 21,252,000$ 21,252,000$ 21,252,000$ 21,252,000$ 21,252,000$ 21,252,000$ 21,252,000$ 21,252,000$ 2039 21,677,000$ 21,677,000$ 21,677,000$ 21,677,000$ 21,677,000$ 21,677,000$ 21,677,000$ 21,677,000$ 21,677,000$ 21,677,000$ 21,677,000$ 21,677,000$ 21,677,000$ 21,677,000$ 2040 22,111,000$ 22,111,000$ 22,111,000$ 22,111,000$ 22,111,000$ 22,111,000$ 22,111,000$ 22,111,000$ 22,111,000$ 22,111,000$ 22,111,000$ 22,111,000$ 22,111,000$ 22,111,000$ 2041 22,553,000$ 22,553,000$ 22,553,000$ 22,553,000$ 22,553,000$ 22,553,000$ 22,553,000$ 22,553,000$ 22,553,000$ 22,553,000$ 22,553,000$ 22,553,000$ 22,553,000$ 22,553,000$ 2042 23,004,000$ 23,004,000$ 23,004,000$ 23,004,000$ 23,004,000$ 23,004,000$ 23,004,000$ 23,004,000$ 23,004,000$ 23,004,000$ 23,004,000$ 23,004,000$ 23,004,000$ 23,004,000$ 2043 23,464,000$ 23,464,000$ 23,464,000$ 23,464,000$ 23,464,000$ 23,464,000$ 23,464,000$ 23,464,000$ 23,464,000$ 23,464,000$ 23,464,000$ 23,464,000$ 23,464,000$ 23,464,000$ 2044 23,933,000$ 23,933,000$ 23,933,000$ 23,933,000$ 23,933,000$ 23,933,000$ 23,933,000$ 23,933,000$ 23,933,000$ 23,933,000$ 23,933,000$ 23,933,000$ 23,933,000$ 23,933,000$ 2045 24,412,000$ 24,412,000$ 24,412,000$ 24,412,000$ 24,412,000$ 24,412,000$ 24,412,000$ 24,412,000$ 24,412,000$ 24,412,000$ 24,412,000$ 24,412,000$ 24,412,000$ 24,412,000$ 2046 24,900,000$ 24,900,000$ 24,900,000$ 24,900,000$ 24,900,000$ 24,900,000$ 24,900,000$ 24,900,000$ 24,900,000$ 24,900,000$ 24,900,000$ 24,900,000$ 24,900,000$ 24,900,000$ 2047 25,398,000$ 25,398,000$ 25,398,000$ 25,398,000$ 25,398,000$ 25,398,000$ 25,398,000$ 25,398,000$ 25,398,000$ 25,398,000$ 25,398,000$ 25,398,000$ 25,398,000$ 25,398,000$ 2048 25,906,000$ 25,906,000$ 25,906,000$ 25,906,000$ 25,906,000$ 25,906,000$ 25,906,000$ 25,906,000$ 25,906,000$ 25,906,000$ 25,906,000$ 25,906,000$ 25,906,000$ 25,906,000$ 2049 26,424,000$ 26,424,000$ 26,424,000$ 26,424,000$ 26,424,000$ 26,424,000$ 26,424,000$ 26,424,000$ 26,424,000$ 26,424,000$ 26,424,000$ 26,424,000$ 26,424,000$ 26,424,000$ 2050 26,953,000$ 26,953,000$ 26,953,000$ 26,953,000$ 26,953,000$ 26,953,000$ 26,953,000$ 26,953,000$ 26,953,000$ 26,953,000$ 26,953,000$ 26,953,000$ 26,953,000$ 26,953,000$ 2051 27,492,000$ 27,492,000$ 27,492,000$ 27,492,000$ 27,492,000$ 27,492,000$ 27,492,000$ 27,492,000$ 27,492,000$ 27,492,000$ 27,492,000$ 27,492,000$ 27,492,000$ 27,492,000$ 2052 28,042,000$ 28,042,000$ 28,042,000$ 28,042,000$ 28,042,000$ 28,042,000$ 28,042,000$ 28,042,000$ 28,042,000$ 28,042,000$ 28,042,000$ 28,042,000$ 28,042,000$ 28,042,000$ 2053 28,603,000$ 28,603,000$ 28,603,000$ 28,603,000$ 28,603,000$ 28,603,000$ 28,603,000$ 28,603,000$ 28,603,000$ 28,603,000$ 28,603,000$ 28,603,000$ 28,603,000$ 28,603,000$ 2054 29,175,000$ 29,175,000$ 29,175,000$ 29,175,000$ 29,175,000$ 29,175,000$ 29,175,000$ 29,175,000$ 29,175,000$ 29,175,000$ 29,175,000$ 29,175,000$ 29,175,000$ 29,175,000$ 2055 29,758,000$ 29,758,000$ 29,758,000$ 29,758,000$ 29,758,000$ 29,758,000$ 29,758,000$ 29,758,000$ 29,758,000$ 29,758,000$ 29,758,000$ 29,758,000$ 29,758,000$ 29,758,000$
10. Debt Service2025 22,704,000$ 22,704,000$ 22,704,000$ 22,704,000$ 22,704,000$ 22,704,000$ 22,704,000$ 23,743,000$ 23,743,000$ 23,743,000$ 23,743,000$ 23,743,000$ 23,743,000$ 25,893,000$ 2026 22,704,000$ 22,704,000$ 22,704,000$ 22,704,000$ 22,704,000$ 22,704,000$ 22,704,000$ 23,743,000$ 23,743,000$ 23,743,000$ 23,743,000$ 23,743,000$ 23,743,000$ 25,893,000$ 2027 22,704,000$ 22,704,000$ 22,704,000$ 22,704,000$ 22,704,000$ 22,704,000$ 22,704,000$ 23,743,000$ 23,743,000$ 23,743,000$ 23,743,000$ 23,743,000$ 23,743,000$ 25,893,000$ 2028 22,704,000$ 22,704,000$ 22,704,000$ 22,704,000$ 22,704,000$ 22,704,000$ 22,704,000$ 23,743,000$ 23,743,000$ 23,743,000$ 23,743,000$ 23,743,000$ 23,743,000$ 25,893,000$ 2029 22,704,000$ 22,704,000$ 22,704,000$ 22,704,000$ 22,704,000$ 22,704,000$ 22,704,000$ 23,743,000$ 23,743,000$ 23,743,000$ 23,743,000$ 23,743,000$ 23,743,000$ 25,893,000$ 2030 22,704,000$ 22,704,000$ 22,704,000$ 22,704,000$ 22,704,000$ 22,704,000$ 22,704,000$ 23,743,000$ 23,743,000$ 23,743,000$ 23,743,000$ 23,743,000$ 23,743,000$ 25,893,000$ 2031 22,704,000$ 22,704,000$ 22,704,000$ 22,704,000$ 22,704,000$ 22,704,000$ 22,704,000$ 23,743,000$ 23,743,000$ 23,743,000$ 23,743,000$ 23,743,000$ 23,743,000$ 25,893,000$ 2032 22,704,000$ 22,704,000$ 22,704,000$ 22,704,000$ 22,704,000$ 22,704,000$ 22,704,000$ 23,743,000$ 23,743,000$ 23,743,000$ 23,743,000$ 23,743,000$ 23,743,000$ 25,893,000$ 2033 22,704,000$ 22,704,000$ 22,704,000$ 22,704,000$ 22,704,000$ 22,704,000$ 22,704,000$ 23,743,000$ 23,743,000$ 23,743,000$ 23,743,000$ 23,743,000$ 23,743,000$ 25,893,000$ 2034 22,704,000$ 22,704,000$ 22,704,000$ 22,704,000$ 22,704,000$ 22,704,000$ 22,704,000$ 23,743,000$ 23,743,000$ 23,743,000$ 23,743,000$ 23,743,000$ 23,743,000$ 25,893,000$ 2035 22,704,000$ 22,704,000$ 22,704,000$ 22,704,000$ 22,704,000$ 22,704,000$ 22,704,000$ 23,743,000$ 23,743,000$ 23,743,000$ 23,743,000$ 23,743,000$ 23,743,000$ 25,893,000$ 2036 22,704,000$ 22,704,000$ 22,704,000$ 22,704,000$ 22,704,000$ 22,704,000$ 22,704,000$ 23,743,000$ 23,743,000$ 23,743,000$ 23,743,000$ 23,743,000$ 23,743,000$ 25,893,000$ 2037 22,704,000$ 22,704,000$ 22,704,000$ 22,704,000$ 22,704,000$ 22,704,000$ 22,704,000$ 23,743,000$ 23,743,000$ 23,743,000$ 23,743,000$ 23,743,000$ 23,743,000$ 25,893,000$ 2038 22,704,000$ 22,704,000$ 22,704,000$ 22,704,000$ 22,704,000$ 22,704,000$ 22,704,000$ 23,743,000$ 23,743,000$ 23,743,000$ 23,743,000$ 23,743,000$ 23,743,000$ 25,893,000$ 2039 22,704,000$ 22,704,000$ 22,704,000$ 22,704,000$ 22,704,000$ 22,704,000$ 22,704,000$ 23,743,000$ 23,743,000$ 23,743,000$ 23,743,000$ 23,743,000$ 23,743,000$ 25,893,000$ 2040 22,704,000$ 22,704,000$ 22,704,000$ 22,704,000$ 22,704,000$ 22,704,000$ 22,704,000$ 23,743,000$ 23,743,000$ 23,743,000$ 23,743,000$ 23,743,000$ 23,743,000$ 25,893,000$ 2041 22,704,000$ 22,704,000$ 22,704,000$ 22,704,000$ 22,704,000$ 22,704,000$ 22,704,000$ 23,743,000$ 23,743,000$ 23,743,000$ 23,743,000$ 23,743,000$ 23,743,000$ 25,893,000$ 2042 22,704,000$ 22,704,000$ 22,704,000$ 22,704,000$ 22,704,000$ 22,704,000$ 22,704,000$ 23,743,000$ 23,743,000$ 23,743,000$ 23,743,000$ 23,743,000$ 23,743,000$ 25,893,000$ 2043 22,704,000$ 22,704,000$ 22,704,000$ 22,704,000$ 22,704,000$ 22,704,000$ 22,704,000$ 23,743,000$ 23,743,000$ 23,743,000$ 23,743,000$ 23,743,000$ 23,743,000$ 25,893,000$ 2044 22,704,000$ 22,704,000$ 22,704,000$ 22,704,000$ 22,704,000$ 22,704,000$ 22,704,000$ 23,743,000$ 23,743,000$ 23,743,000$ 23,743,000$ 23,743,000$ 23,743,000$ 25,893,000$ 2045 -$ -$ -$ -$ -$ -$ -$ -$ -$ -$ -$ -$ -$ -$ 2046 -$ -$ -$ -$ -$ -$ -$ -$ -$ -$ -$ -$ -$ -$ 2047 -$ -$ -$ -$ -$ -$ -$ -$ -$ -$ -$ -$ -$ -$

Live Scenario1 Scenarios
Item Description Quantity 1 2 3 4 5 6 7 8 9 10 11 12 13GENERAL ASSUMPTIONS
2048 -$ -$ -$ -$ -$ -$ -$ -$ -$ -$ -$ -$ -$ -$ 2049 -$ -$ -$ -$ -$ -$ -$ -$ -$ -$ -$ -$ -$ -$ 2050 -$ -$ -$ -$ -$ -$ -$ -$ -$ -$ -$ -$ -$ -$ 2051 -$ -$ -$ -$ -$ -$ -$ -$ -$ -$ -$ -$ -$ -$ 2052 -$ -$ -$ -$ -$ -$ -$ -$ -$ -$ -$ -$ -$ -$ 2053 -$ -$ -$ -$ -$ -$ -$ -$ -$ -$ -$ -$ -$ -$ 2054 -$ -$ -$ -$ -$ -$ -$ -$ -$ -$ -$ -$ -$ -$ 2055 -$ -$ -$ -$ -$ -$ -$ -$ -$ -$ -$ -$ -$ -$
11. Waste Processed (tons)2025 328,500 328,500 328,500 328,500 328,500 328,500 328,500 328,500 328,500 328,500 328,500 328,500 328,500 328,5002026 328,500 328,500 328,500 328,500 328,500 328,500 328,500 328,500 328,500 328,500 328,500 328,500 328,500 328,5002027 328,500 328,500 328,500 328,500 328,500 328,500 328,500 328,500 328,500 328,500 328,500 328,500 328,500 328,5002028 328,500 328,500 328,500 328,500 328,500 328,500 328,500 328,500 328,500 328,500 328,500 328,500 328,500 328,5002029 328,500 328,500 328,500 328,500 328,500 328,500 328,500 328,500 328,500 328,500 328,500 328,500 328,500 328,5002030 328,500 328,500 328,500 328,500 328,500 328,500 328,500 328,500 328,500 328,500 328,500 328,500 328,500 328,5002031 328,500 328,500 328,500 328,500 328,500 328,500 328,500 328,500 328,500 328,500 328,500 328,500 328,500 328,5002032 328,500 328,500 328,500 328,500 328,500 328,500 328,500 328,500 328,500 328,500 328,500 328,500 328,500 328,5002033 328,500 328,500 328,500 328,500 328,500 328,500 328,500 328,500 328,500 328,500 328,500 328,500 328,500 328,5002034 328,500 328,500 328,500 328,500 328,500 328,500 328,500 328,500 328,500 328,500 328,500 328,500 328,500 328,5002035 328,500 328,500 328,500 328,500 328,500 328,500 328,500 328,500 328,500 328,500 328,500 328,500 328,500 328,5002036 328,500 328,500 328,500 328,500 328,500 328,500 328,500 328,500 328,500 328,500 328,500 328,500 328,500 328,5002037 328,500 328,500 328,500 328,500 328,500 328,500 328,500 328,500 328,500 328,500 328,500 328,500 328,500 328,5002038 328,500 328,500 328,500 328,500 328,500 328,500 328,500 328,500 328,500 328,500 328,500 328,500 328,500 328,5002039 328,500 328,500 328,500 328,500 328,500 328,500 328,500 328,500 328,500 328,500 328,500 328,500 328,500 328,5002040 328,500 328,500 328,500 328,500 328,500 328,500 328,500 328,500 328,500 328,500 328,500 328,500 328,500 328,5002041 328,500 328,500 328,500 328,500 328,500 328,500 328,500 328,500 328,500 328,500 328,500 328,500 328,500 328,5002042 328,500 328,500 328,500 328,500 328,500 328,500 328,500 328,500 328,500 328,500 328,500 328,500 328,500 328,5002043 328,500 328,500 328,500 328,500 328,500 328,500 328,500 328,500 328,500 328,500 328,500 328,500 328,500 328,5002044 328,500 328,500 328,500 328,500 328,500 328,500 328,500 328,500 328,500 328,500 328,500 328,500 328,500 328,5002045 328,500 328,500 328,500 328,500 328,500 328,500 328,500 328,500 328,500 328,500 328,500 328,500 328,500 328,5002046 328,500 328,500 328,500 328,500 328,500 328,500 328,500 328,500 328,500 328,500 328,500 328,500 328,500 328,5002047 328,500 328,500 328,500 328,500 328,500 328,500 328,500 328,500 328,500 328,500 328,500 328,500 328,500 328,5002048 328,500 328,500 328,500 328,500 328,500 328,500 328,500 328,500 328,500 328,500 328,500 328,500 328,500 328,5002049 328,500 328,500 328,500 328,500 328,500 328,500 328,500 328,500 328,500 328,500 328,500 328,500 328,500 328,5002050 328,500 328,500 328,500 328,500 328,500 328,500 328,500 328,500 328,500 328,500 328,500 328,500 328,500 328,5002051 328,500 328,500 328,500 328,500 328,500 328,500 328,500 328,500 328,500 328,500 328,500 328,500 328,500 328,5002052 328,500 328,500 328,500 328,500 328,500 328,500 328,500 328,500 328,500 328,500 328,500 328,500 328,500 328,5002053 328,500 328,500 328,500 328,500 328,500 328,500 328,500 328,500 328,500 328,500 328,500 328,500 328,500 328,5002054 328,500 328,500 328,500 328,500 328,500 328,500 328,500 328,500 328,500 328,500 328,500 328,500 328,500 328,5002055 328,500 328,500 328,500 328,500 328,500 328,500 328,500 328,500 328,500 328,500 328,500 328,500 328,500 328,500

3.0 Summary
Live Scenario1
Item Description QuantityGENERAL ASSUMPTIONS
1. Processing Rate (tons/day) 1,0002. Interest Rate - Debt Financing 3.50%3. Energy Revenues from Electricity $0.06/kWh4. Biosolids Incineration Revenue 3,177,000$
5. Summary of Net Costs (Revenue - Expenses), $/ton2025 - 2029 average tip fee 66.18$ 2030 - 2034 average tip fee 65.87$ 2035 - 2039 average tip fee 65.53$ 2040 - 2044 average tip fee 65.16$ 2045 - 2049 average tip fee (4.36)$ 2050 - 2054 average tip fee (4.82)$ 2025 - 2054 average tip fee 54.00$
6. Net Costs (Revenue - Expenses), $/ton2025 66.30$ 2026 66.23$ 2027 66.18$ 2028 66.12$ 2029 66.06$ 2030 66.00$ 2031 65.94$ 2032 65.87$ 2033 65.81$ 2034 65.74$ 2035 65.67$ 2036 65.61$ 2037 65.53$ 2038 65.46$ 2039 65.39$ 2040 65.32$ 2041 65.24$ 2042 65.16$ 2043 65.08$ 2044 65.00$ 2045 (4.19)$ 2046 (4.28)$ 2047 (4.36)$ 2048 (4.45)$ 2049 (4.54)$ 2050 (4.63)$ 2051 (4.72)$ 2052 (4.82)$ 2053 (4.91)$ 2054 (5.01)$ 2055 (5.11)$
7. Total Revenue2025 17,355,000$ 2026 17,703,000$ 2027 18,057,000$ 2028 18,418,000$ 2029 18,786,000$ 2030 19,162,000$
14 15 16 17 18 19 20 21 22 23 24 25 26
1,000 1,000 1,000 1,000 1,000 1,200 1,200 1,200 1,200 1,200 1,200 1,200 1,2005.00% 5.00% 5.00% 5.00% 5.00% 3.50% 3.50% 3.50% 3.50% 3.50% 3.50% 4.00% 4.00%
$0.061/kWh $0.068/kWh $0.068/kWh $0.075/kWh $0.075/kWh $0.061/kWh $0.061/kWh $0.068/kWh $0.068/kWh $0.075/kWh $0.075/kWh $0.061/kWh $0.061/kWh-$ 3,177,000$ -$ 3,177,000$ -$ 3,177,000$ -$ 3,177,000$ -$ 3,177,000$ -$ 3,177,000$ -$
85.95$ 71.59$ 81.65$ 67.29$ 77.36$ 67.86$ 76.24$ 63.56$ 71.95$ 59.26$ 67.65$ 71.02$ 79.41$ 86.69$ 70.83$ 81.95$ 66.09$ 77.20$ 67.73$ 76.99$ 62.98$ 72.24$ 58.23$ 67.50$ 70.89$ 80.15$ 87.51$ 70.00$ 82.27$ 64.76$ 77.03$ 67.58$ 77.81$ 62.34$ 72.57$ 57.10$ 67.33$ 70.74$ 80.97$ 88.42$ 69.09$ 82.63$ 63.30$ 76.85$ 67.42$ 78.71$ 61.64$ 72.93$ 55.85$ 67.14$ 70.58$ 81.87$ 10.59$ (10.75)$ 4.21$ (17.14)$ (2.18)$ (1.87)$ 10.59$ (8.26)$ 4.21$ (14.64)$ (2.18)$ (1.87)$ 10.59$ 11.70$ (11.87)$ 4.65$ (18.92)$ (2.40)$ (2.07)$ 11.70$ (9.12)$ 4.65$ (16.17)$ (2.40)$ (2.07)$ 11.70$ 61.81$ 43.15$ 56.23$ 37.57$ 50.64$ 44.44$ 55.34$ 38.86$ 49.76$ 33.27$ 44.17$ 46.55$ 57.45$
85.67$ 71.87$ 81.54$ 67.74$ 77.42$ 67.90$ 75.96$ 63.77$ 71.83$ 59.65$ 67.71$ 71.07$ 79.13$ 85.81$ 71.73$ 81.60$ 67.52$ 77.39$ 67.88$ 76.10$ 63.67$ 71.89$ 59.46$ 67.68$ 71.05$ 79.27$ 85.95$ 71.59$ 81.65$ 67.29$ 77.35$ 67.86$ 76.24$ 63.56$ 71.95$ 59.26$ 67.65$ 71.02$ 79.40$ 86.09$ 71.45$ 81.71$ 67.06$ 77.33$ 67.83$ 76.38$ 63.45$ 72.00$ 59.07$ 67.62$ 70.99$ 79.55$ 86.24$ 71.30$ 81.77$ 66.83$ 77.30$ 67.80$ 76.53$ 63.34$ 72.06$ 58.87$ 67.59$ 70.97$ 79.69$ 86.38$ 71.15$ 81.82$ 66.59$ 77.27$ 67.78$ 76.68$ 63.22$ 72.12$ 58.66$ 67.56$ 70.94$ 79.84$ 86.54$ 70.99$ 81.88$ 66.34$ 77.24$ 67.75$ 76.83$ 63.10$ 72.18$ 58.45$ 67.53$ 70.92$ 79.99$ 86.69$ 70.84$ 81.95$ 66.09$ 77.20$ 67.73$ 76.98$ 62.98$ 72.24$ 58.24$ 67.50$ 70.89$ 80.15$ 86.85$ 70.68$ 82.01$ 65.84$ 77.17$ 67.70$ 77.14$ 62.86$ 72.30$ 58.02$ 67.46$ 70.86$ 80.30$ 87.01$ 70.52$ 82.07$ 65.58$ 77.14$ 67.67$ 77.30$ 62.73$ 72.36$ 57.80$ 67.43$ 70.83$ 80.46$ 87.17$ 70.35$ 82.14$ 65.32$ 77.11$ 67.64$ 77.47$ 62.61$ 72.43$ 57.57$ 67.40$ 70.80$ 80.63$ 87.34$ 70.18$ 82.20$ 65.05$ 77.07$ 67.61$ 77.63$ 62.48$ 72.50$ 57.34$ 67.36$ 70.77$ 80.79$ 87.51$ 70.01$ 82.27$ 64.77$ 77.04$ 67.58$ 77.80$ 62.34$ 72.57$ 57.11$ 67.33$ 70.75$ 80.97$ 87.68$ 69.83$ 82.34$ 64.49$ 77.00$ 67.55$ 77.98$ 62.21$ 72.64$ 56.87$ 67.29$ 70.72$ 81.14$ 87.86$ 69.65$ 82.41$ 64.20$ 76.96$ 67.52$ 78.15$ 62.07$ 72.71$ 56.62$ 67.26$ 70.68$ 81.32$ 88.04$ 69.47$ 82.48$ 63.91$ 76.93$ 67.49$ 78.33$ 61.93$ 72.78$ 56.37$ 67.22$ 70.65$ 81.50$ 88.23$ 69.28$ 82.56$ 63.61$ 76.89$ 67.46$ 78.52$ 61.79$ 72.85$ 56.12$ 67.18$ 70.62$ 81.68$ 88.41$ 69.09$ 82.63$ 63.31$ 76.85$ 67.42$ 78.71$ 61.64$ 72.92$ 55.86$ 67.14$ 70.59$ 81.87$ 88.61$ 68.89$ 82.71$ 63.00$ 76.81$ 67.39$ 78.90$ 61.49$ 73.00$ 55.59$ 67.10$ 70.55$ 82.06$ 88.80$ 68.69$ 82.79$ 62.68$ 76.77$ 67.35$ 79.09$ 61.34$ 73.08$ 55.32$ 67.06$ 70.51$ 82.26$ 10.18$ (10.33)$ 4.04$ (16.46)$ (2.09)$ (1.80)$ 10.18$ (7.94)$ 4.04$ (14.07)$ (2.09)$ (1.80)$ 10.18$ 10.38$ (10.54)$ 4.12$ (16.79)$ (2.13)$ (1.83)$ 10.38$ (8.09)$ 4.12$ (14.35)$ (2.14)$ (1.83)$ 10.38$ 10.59$ (10.75)$ 4.20$ (17.13)$ (2.18)$ (1.87)$ 10.59$ (8.25)$ 4.21$ (14.64)$ (2.18)$ (1.87)$ 10.59$ 10.80$ (10.96)$ 4.29$ (17.47)$ (2.22)$ (1.91)$ 10.80$ (8.42)$ 4.29$ (14.93)$ (2.22)$ (1.91)$ 10.80$ 11.02$ (11.18)$ 4.37$ (17.82)$ (2.26)$ (1.95)$ 11.02$ (8.59)$ 4.38$ (15.23)$ (2.27)$ (1.95)$ 11.02$ 11.24$ (11.40)$ 4.46$ (18.18)$ (2.31)$ (1.99)$ 11.24$ (8.76)$ 4.46$ (15.53)$ (2.31)$ (1.99)$ 11.24$ 11.46$ (11.63)$ 4.55$ (18.54)$ (2.36)$ (2.02)$ 11.46$ (8.93)$ 4.55$ (15.84)$ (2.36)$ (2.02)$ 11.46$ 11.69$ (11.86)$ 4.65$ (18.91)$ (2.40)$ (2.06)$ 11.69$ (9.11)$ 4.64$ (16.16)$ (2.40)$ (2.06)$ 11.69$ 11.93$ (12.10)$ 4.74$ (19.29)$ (2.45)$ (2.11)$ 11.93$ (9.29)$ 4.74$ (16.48)$ (2.45)$ (2.11)$ 11.93$ 12.16$ (12.34)$ 4.83$ (19.67)$ (2.50)$ (2.15)$ 12.17$ (9.48)$ 4.83$ (16.81)$ (2.50)$ (2.15)$ 12.17$ 12.41$ (12.59)$ 4.93$ (20.07)$ (2.55)$ (2.19)$ 12.41$ (9.67)$ 4.93$ (17.15)$ (2.55)$ (2.19)$ 12.41$
14,178,000$ 18,712,000$ 15,535,000$ 20,068,000$ 16,891,000$ 20,191,000$ 17,014,000$ 21,819,000$ 18,642,000$ 23,446,000$ 20,269,000$ 20,191,000$ 17,014,000$ 14,462,000$ 19,086,000$ 15,846,000$ 20,470,000$ 17,229,000$ 20,595,000$ 17,354,000$ 22,255,000$ 19,015,000$ 23,915,000$ 20,675,000$ 20,595,000$ 17,354,000$ 14,751,000$ 19,468,000$ 16,162,000$ 20,879,000$ 17,574,000$ 21,007,000$ 17,702,000$ 22,700,000$ 19,395,000$ 24,394,000$ 21,088,000$ 21,007,000$ 17,702,000$ 15,046,000$ 19,857,000$ 16,486,000$ 21,297,000$ 17,925,000$ 21,427,000$ 18,056,000$ 23,154,000$ 19,783,000$ 24,882,000$ 21,510,000$ 21,427,000$ 18,056,000$ 15,347,000$ 20,254,000$ 16,815,000$ 21,722,000$ 18,284,000$ 21,856,000$ 18,417,000$ 23,617,000$ 20,178,000$ 25,379,000$ 21,940,000$ 21,856,000$ 18,417,000$ 15,654,000$ 20,659,000$ 17,152,000$ 22,157,000$ 18,649,000$ 22,293,000$ 18,785,000$ 24,090,000$ 20,582,000$ 25,887,000$ 22,379,000$ 22,293,000$ 18,785,000$

Live Scenario1
Item Description QuantityGENERAL ASSUMPTIONS
2031 19,545,000$ 2032 19,936,000$ 2033 20,335,000$ 2034 20,741,000$ 2035 21,156,000$ 2036 21,579,000$ 2037 22,011,000$ 2038 22,451,000$ 2039 22,900,000$ 2040 23,358,000$ 2041 23,825,000$ 2042 24,302,000$ 2043 24,788,000$ 2044 25,284,000$ 2045 25,789,000$ 2046 26,305,000$ 2047 26,831,000$ 2048 27,368,000$ 2049 27,915,000$ 2050 28,473,000$ 2051 29,043,000$ 2052 29,624,000$ 2053 30,216,000$ 2054 30,821,000$ 2055 31,437,000$
8. Total Costs2025 39,133,000$ 2026 39,461,000$ 2027 39,796,000$ 2028 40,138,000$ 2029 40,487,000$ 2030 40,842,000$ 2031 41,205,000$ 2032 41,575,000$ 2033 41,953,000$ 2034 42,338,000$ 2035 42,730,000$ 2036 43,131,000$ 2037 43,539,000$ 2038 43,956,000$ 2039 44,381,000$ 2040 44,815,000$ 2041 45,257,000$ 2042 45,708,000$ 2043 46,168,000$ 2044 46,637,000$ 2045 24,412,000$ 2046 24,900,000$ 2047 25,398,000$ 2048 25,906,000$ 2049 26,424,000$ 2050 26,953,000$ 2051 27,492,000$ 2052 28,042,000$ 2053 28,603,000$ 2054 29,175,000$ 2055 29,758,000$
14 15 16 17 18 19 20 21 22 23 24 25 26
15,967,000$ 21,073,000$ 17,495,000$ 22,600,000$ 19,022,000$ 22,738,000$ 19,161,000$ 24,572,000$ 20,994,000$ 26,405,000$ 22,827,000$ 22,738,000$ 19,161,000$ 16,287,000$ 21,494,000$ 17,845,000$ 23,052,000$ 19,403,000$ 23,193,000$ 19,544,000$ 25,063,000$ 21,414,000$ 26,933,000$ 23,283,000$ 23,193,000$ 19,544,000$ 16,612,000$ 21,924,000$ 18,202,000$ 23,513,000$ 19,791,000$ 23,657,000$ 19,935,000$ 25,564,000$ 21,842,000$ 27,471,000$ 23,749,000$ 23,657,000$ 19,935,000$ 16,945,000$ 22,362,000$ 18,566,000$ 23,983,000$ 20,187,000$ 24,130,000$ 20,333,000$ 26,075,000$ 22,279,000$ 28,021,000$ 24,224,000$ 24,130,000$ 20,333,000$ 17,283,000$ 22,810,000$ 18,937,000$ 24,463,000$ 20,590,000$ 24,613,000$ 20,740,000$ 26,597,000$ 22,724,000$ 28,581,000$ 24,708,000$ 24,613,000$ 20,740,000$ 17,629,000$ 23,266,000$ 19,316,000$ 24,952,000$ 21,002,000$ 25,105,000$ 21,155,000$ 27,129,000$ 23,179,000$ 29,153,000$ 25,203,000$ 25,105,000$ 21,155,000$ 17,982,000$ 23,731,000$ 19,702,000$ 25,451,000$ 21,422,000$ 25,607,000$ 21,578,000$ 27,672,000$ 23,642,000$ 29,736,000$ 25,707,000$ 25,607,000$ 21,578,000$ 18,341,000$ 24,206,000$ 20,096,000$ 25,960,000$ 21,851,000$ 26,119,000$ 22,010,000$ 28,225,000$ 24,115,000$ 30,330,000$ 26,221,000$ 26,119,000$ 22,010,000$ 18,708,000$ 24,690,000$ 20,498,000$ 26,480,000$ 22,288,000$ 26,642,000$ 22,450,000$ 28,789,000$ 24,597,000$ 30,937,000$ 26,745,000$ 26,642,000$ 22,450,000$ 19,082,000$ 25,184,000$ 20,908,000$ 27,009,000$ 22,733,000$ 27,175,000$ 22,899,000$ 29,365,000$ 25,089,000$ 31,556,000$ 27,280,000$ 27,175,000$ 22,899,000$ 19,464,000$ 25,687,000$ 21,326,000$ 27,549,000$ 23,188,000$ 27,718,000$ 23,357,000$ 29,953,000$ 25,591,000$ 32,187,000$ 27,826,000$ 27,718,000$ 23,357,000$ 19,853,000$ 26,201,000$ 21,753,000$ 28,100,000$ 23,652,000$ 28,272,000$ 23,824,000$ 30,552,000$ 26,103,000$ 32,831,000$ 28,382,000$ 28,272,000$ 23,824,000$ 20,250,000$ 26,725,000$ 22,188,000$ 28,662,000$ 24,125,000$ 28,838,000$ 24,300,000$ 31,163,000$ 26,625,000$ 33,487,000$ 28,950,000$ 28,838,000$ 24,300,000$ 20,655,000$ 27,260,000$ 22,631,000$ 29,236,000$ 24,607,000$ 29,415,000$ 24,786,000$ 31,786,000$ 27,158,000$ 34,157,000$ 29,529,000$ 29,415,000$ 24,786,000$ 21,068,000$ 27,805,000$ 23,084,000$ 29,820,000$ 25,099,000$ 30,003,000$ 25,282,000$ 32,422,000$ 27,701,000$ 34,840,000$ 30,119,000$ 30,003,000$ 25,282,000$ 21,490,000$ 28,361,000$ 23,546,000$ 30,417,000$ 25,601,000$ 30,603,000$ 25,788,000$ 33,070,000$ 28,255,000$ 35,537,000$ 30,722,000$ 30,603,000$ 25,788,000$ 21,920,000$ 28,928,000$ 24,017,000$ 31,025,000$ 26,113,000$ 31,215,000$ 26,304,000$ 33,731,000$ 28,820,000$ 36,248,000$ 31,336,000$ 31,215,000$ 26,304,000$ 22,358,000$ 29,507,000$ 24,497,000$ 31,646,000$ 26,636,000$ 31,839,000$ 26,830,000$ 34,406,000$ 29,396,000$ 36,973,000$ 31,963,000$ 31,839,000$ 26,830,000$ 22,805,000$ 30,097,000$ 24,987,000$ 32,278,000$ 27,168,000$ 32,476,000$ 27,366,000$ 35,094,000$ 29,984,000$ 37,712,000$ 32,602,000$ 32,476,000$ 27,366,000$ 23,261,000$ 30,699,000$ 25,487,000$ 32,924,000$ 27,712,000$ 33,126,000$ 27,913,000$ 35,796,000$ 30,584,000$ 38,466,000$ 33,254,000$ 33,126,000$ 27,913,000$ 23,726,000$ 31,313,000$ 25,996,000$ 33,583,000$ 28,266,000$ 33,788,000$ 28,472,000$ 36,512,000$ 31,196,000$ 39,236,000$ 33,919,000$ 33,788,000$ 28,472,000$ 24,201,000$ 31,939,000$ 26,516,000$ 34,254,000$ 28,831,000$ 34,464,000$ 29,041,000$ 37,242,000$ 31,819,000$ 40,020,000$ 34,598,000$ 34,464,000$ 29,041,000$ 24,685,000$ 32,578,000$ 27,047,000$ 34,939,000$ 29,408,000$ 35,153,000$ 29,622,000$ 37,987,000$ 32,456,000$ 40,821,000$ 35,290,000$ 35,153,000$ 29,622,000$ 25,179,000$ 33,229,000$ 27,587,000$ 35,638,000$ 29,996,000$ 35,856,000$ 30,214,000$ 38,747,000$ 33,105,000$ 41,637,000$ 35,995,000$ 35,856,000$ 30,214,000$ 25,682,000$ 33,894,000$ 28,139,000$ 36,351,000$ 30,596,000$ 36,573,000$ 30,819,000$ 39,522,000$ 33,767,000$ 42,470,000$ 36,715,000$ 36,573,000$ 30,819,000$
42,322,000$ 42,322,000$ 42,322,000$ 42,322,000$ 42,322,000$ 46,959,000$ 46,959,000$ 46,959,000$ 46,959,000$ 46,959,000$ 46,959,000$ 48,206,000$ 48,206,000$ 42,650,000$ 42,650,000$ 42,650,000$ 42,650,000$ 42,650,000$ 47,354,000$ 47,354,000$ 47,354,000$ 47,354,000$ 47,354,000$ 47,354,000$ 48,601,000$ 48,601,000$ 42,985,000$ 42,985,000$ 42,985,000$ 42,985,000$ 42,985,000$ 47,756,000$ 47,756,000$ 47,756,000$ 47,756,000$ 47,756,000$ 47,756,000$ 49,003,000$ 49,003,000$ 43,327,000$ 43,327,000$ 43,327,000$ 43,327,000$ 43,327,000$ 48,166,000$ 48,166,000$ 48,166,000$ 48,166,000$ 48,166,000$ 48,166,000$ 49,413,000$ 49,413,000$ 43,676,000$ 43,676,000$ 43,676,000$ 43,676,000$ 43,676,000$ 48,584,000$ 48,584,000$ 48,584,000$ 48,584,000$ 48,584,000$ 48,584,000$ 49,831,000$ 49,831,000$ 44,031,000$ 44,031,000$ 44,031,000$ 44,031,000$ 44,031,000$ 49,011,000$ 49,011,000$ 49,011,000$ 49,011,000$ 49,011,000$ 49,011,000$ 50,258,000$ 50,258,000$ 44,394,000$ 44,394,000$ 44,394,000$ 44,394,000$ 44,394,000$ 49,447,000$ 49,447,000$ 49,447,000$ 49,447,000$ 49,447,000$ 49,447,000$ 50,694,000$ 50,694,000$ 44,764,000$ 44,764,000$ 44,764,000$ 44,764,000$ 44,764,000$ 49,891,000$ 49,891,000$ 49,891,000$ 49,891,000$ 49,891,000$ 49,891,000$ 51,138,000$ 51,138,000$ 45,142,000$ 45,142,000$ 45,142,000$ 45,142,000$ 45,142,000$ 50,343,000$ 50,343,000$ 50,343,000$ 50,343,000$ 50,343,000$ 50,343,000$ 51,590,000$ 51,590,000$ 45,527,000$ 45,527,000$ 45,527,000$ 45,527,000$ 45,527,000$ 50,805,000$ 50,805,000$ 50,805,000$ 50,805,000$ 50,805,000$ 50,805,000$ 52,052,000$ 52,052,000$ 45,919,000$ 45,919,000$ 45,919,000$ 45,919,000$ 45,919,000$ 51,277,000$ 51,277,000$ 51,277,000$ 51,277,000$ 51,277,000$ 51,277,000$ 52,524,000$ 52,524,000$ 46,320,000$ 46,320,000$ 46,320,000$ 46,320,000$ 46,320,000$ 51,757,000$ 51,757,000$ 51,757,000$ 51,757,000$ 51,757,000$ 51,757,000$ 53,004,000$ 53,004,000$ 46,728,000$ 46,728,000$ 46,728,000$ 46,728,000$ 46,728,000$ 52,248,000$ 52,248,000$ 52,248,000$ 52,248,000$ 52,248,000$ 52,248,000$ 53,495,000$ 53,495,000$ 47,145,000$ 47,145,000$ 47,145,000$ 47,145,000$ 47,145,000$ 52,748,000$ 52,748,000$ 52,748,000$ 52,748,000$ 52,748,000$ 52,748,000$ 53,995,000$ 53,995,000$ 47,570,000$ 47,570,000$ 47,570,000$ 47,570,000$ 47,570,000$ 53,258,000$ 53,258,000$ 53,258,000$ 53,258,000$ 53,258,000$ 53,258,000$ 54,505,000$ 54,505,000$ 48,004,000$ 48,004,000$ 48,004,000$ 48,004,000$ 48,004,000$ 53,778,000$ 53,778,000$ 53,778,000$ 53,778,000$ 53,778,000$ 53,778,000$ 55,025,000$ 55,025,000$ 48,446,000$ 48,446,000$ 48,446,000$ 48,446,000$ 48,446,000$ 54,309,000$ 54,309,000$ 54,309,000$ 54,309,000$ 54,309,000$ 54,309,000$ 55,556,000$ 55,556,000$ 48,897,000$ 48,897,000$ 48,897,000$ 48,897,000$ 48,897,000$ 54,850,000$ 54,850,000$ 54,850,000$ 54,850,000$ 54,850,000$ 54,850,000$ 56,097,000$ 56,097,000$ 49,357,000$ 49,357,000$ 49,357,000$ 49,357,000$ 49,357,000$ 55,402,000$ 55,402,000$ 55,402,000$ 55,402,000$ 55,402,000$ 55,402,000$ 56,649,000$ 56,649,000$ 49,826,000$ 49,826,000$ 49,826,000$ 49,826,000$ 49,826,000$ 55,965,000$ 55,965,000$ 55,965,000$ 55,965,000$ 55,965,000$ 55,965,000$ 57,212,000$ 57,212,000$ 24,412,000$ 24,412,000$ 24,412,000$ 24,412,000$ 24,412,000$ 29,294,000$ 29,294,000$ 29,294,000$ 29,294,000$ 29,294,000$ 29,294,000$ 29,294,000$ 29,294,000$ 24,900,000$ 24,900,000$ 24,900,000$ 24,900,000$ 24,900,000$ 29,880,000$ 29,880,000$ 29,880,000$ 29,880,000$ 29,880,000$ 29,880,000$ 29,880,000$ 29,880,000$ 25,398,000$ 25,398,000$ 25,398,000$ 25,398,000$ 25,398,000$ 30,478,000$ 30,478,000$ 30,478,000$ 30,478,000$ 30,478,000$ 30,478,000$ 30,478,000$ 30,478,000$ 25,906,000$ 25,906,000$ 25,906,000$ 25,906,000$ 25,906,000$ 31,087,000$ 31,087,000$ 31,087,000$ 31,087,000$ 31,087,000$ 31,087,000$ 31,087,000$ 31,087,000$ 26,424,000$ 26,424,000$ 26,424,000$ 26,424,000$ 26,424,000$ 31,709,000$ 31,709,000$ 31,709,000$ 31,709,000$ 31,709,000$ 31,709,000$ 31,709,000$ 31,709,000$ 26,953,000$ 26,953,000$ 26,953,000$ 26,953,000$ 26,953,000$ 32,343,000$ 32,343,000$ 32,343,000$ 32,343,000$ 32,343,000$ 32,343,000$ 32,343,000$ 32,343,000$ 27,492,000$ 27,492,000$ 27,492,000$ 27,492,000$ 27,492,000$ 32,990,000$ 32,990,000$ 32,990,000$ 32,990,000$ 32,990,000$ 32,990,000$ 32,990,000$ 32,990,000$ 28,042,000$ 28,042,000$ 28,042,000$ 28,042,000$ 28,042,000$ 33,650,000$ 33,650,000$ 33,650,000$ 33,650,000$ 33,650,000$ 33,650,000$ 33,650,000$ 33,650,000$ 28,603,000$ 28,603,000$ 28,603,000$ 28,603,000$ 28,603,000$ 34,323,000$ 34,323,000$ 34,323,000$ 34,323,000$ 34,323,000$ 34,323,000$ 34,323,000$ 34,323,000$ 29,175,000$ 29,175,000$ 29,175,000$ 29,175,000$ 29,175,000$ 35,010,000$ 35,010,000$ 35,010,000$ 35,010,000$ 35,010,000$ 35,010,000$ 35,010,000$ 35,010,000$ 29,758,000$ 29,758,000$ 29,758,000$ 29,758,000$ 29,758,000$ 35,710,000$ 35,710,000$ 35,710,000$ 35,710,000$ 35,710,000$ 35,710,000$ 35,710,000$ 35,710,000$

Live Scenario1
Item Description QuantityGENERAL ASSUMPTIONS
9. Operating Costs2025 16,429,000$ 2026 16,757,000$ 2027 17,092,000$ 2028 17,434,000$ 2029 17,783,000$ 2030 18,138,000$ 2031 18,501,000$ 2032 18,871,000$ 2033 19,249,000$ 2034 19,634,000$ 2035 20,026,000$ 2036 20,427,000$ 2037 20,835,000$ 2038 21,252,000$ 2039 21,677,000$ 2040 22,111,000$ 2041 22,553,000$ 2042 23,004,000$ 2043 23,464,000$ 2044 23,933,000$ 2045 24,412,000$ 2046 24,900,000$ 2047 25,398,000$ 2048 25,906,000$ 2049 26,424,000$ 2050 26,953,000$ 2051 27,492,000$ 2052 28,042,000$ 2053 28,603,000$ 2054 29,175,000$ 2055 29,758,000$
10. Debt Service2025 22,704,000$ 2026 22,704,000$ 2027 22,704,000$ 2028 22,704,000$ 2029 22,704,000$ 2030 22,704,000$ 2031 22,704,000$ 2032 22,704,000$ 2033 22,704,000$ 2034 22,704,000$ 2035 22,704,000$ 2036 22,704,000$ 2037 22,704,000$ 2038 22,704,000$ 2039 22,704,000$ 2040 22,704,000$ 2041 22,704,000$ 2042 22,704,000$ 2043 22,704,000$ 2044 22,704,000$ 2045 -$ 2046 -$ 2047 -$
14 15 16 17 18 19 20 21 22 23 24 25 26
16,429,000$ 16,429,000$ 16,429,000$ 16,429,000$ 16,429,000$ 19,714,000$ 19,714,000$ 19,714,000$ 19,714,000$ 19,714,000$ 19,714,000$ 19,714,000$ 19,714,000$ 16,757,000$ 16,757,000$ 16,757,000$ 16,757,000$ 16,757,000$ 20,109,000$ 20,109,000$ 20,109,000$ 20,109,000$ 20,109,000$ 20,109,000$ 20,109,000$ 20,109,000$ 17,092,000$ 17,092,000$ 17,092,000$ 17,092,000$ 17,092,000$ 20,511,000$ 20,511,000$ 20,511,000$ 20,511,000$ 20,511,000$ 20,511,000$ 20,511,000$ 20,511,000$ 17,434,000$ 17,434,000$ 17,434,000$ 17,434,000$ 17,434,000$ 20,921,000$ 20,921,000$ 20,921,000$ 20,921,000$ 20,921,000$ 20,921,000$ 20,921,000$ 20,921,000$ 17,783,000$ 17,783,000$ 17,783,000$ 17,783,000$ 17,783,000$ 21,339,000$ 21,339,000$ 21,339,000$ 21,339,000$ 21,339,000$ 21,339,000$ 21,339,000$ 21,339,000$ 18,138,000$ 18,138,000$ 18,138,000$ 18,138,000$ 18,138,000$ 21,766,000$ 21,766,000$ 21,766,000$ 21,766,000$ 21,766,000$ 21,766,000$ 21,766,000$ 21,766,000$ 18,501,000$ 18,501,000$ 18,501,000$ 18,501,000$ 18,501,000$ 22,202,000$ 22,202,000$ 22,202,000$ 22,202,000$ 22,202,000$ 22,202,000$ 22,202,000$ 22,202,000$ 18,871,000$ 18,871,000$ 18,871,000$ 18,871,000$ 18,871,000$ 22,646,000$ 22,646,000$ 22,646,000$ 22,646,000$ 22,646,000$ 22,646,000$ 22,646,000$ 22,646,000$ 19,249,000$ 19,249,000$ 19,249,000$ 19,249,000$ 19,249,000$ 23,098,000$ 23,098,000$ 23,098,000$ 23,098,000$ 23,098,000$ 23,098,000$ 23,098,000$ 23,098,000$ 19,634,000$ 19,634,000$ 19,634,000$ 19,634,000$ 19,634,000$ 23,560,000$ 23,560,000$ 23,560,000$ 23,560,000$ 23,560,000$ 23,560,000$ 23,560,000$ 23,560,000$ 20,026,000$ 20,026,000$ 20,026,000$ 20,026,000$ 20,026,000$ 24,032,000$ 24,032,000$ 24,032,000$ 24,032,000$ 24,032,000$ 24,032,000$ 24,032,000$ 24,032,000$ 20,427,000$ 20,427,000$ 20,427,000$ 20,427,000$ 20,427,000$ 24,512,000$ 24,512,000$ 24,512,000$ 24,512,000$ 24,512,000$ 24,512,000$ 24,512,000$ 24,512,000$ 20,835,000$ 20,835,000$ 20,835,000$ 20,835,000$ 20,835,000$ 25,003,000$ 25,003,000$ 25,003,000$ 25,003,000$ 25,003,000$ 25,003,000$ 25,003,000$ 25,003,000$ 21,252,000$ 21,252,000$ 21,252,000$ 21,252,000$ 21,252,000$ 25,503,000$ 25,503,000$ 25,503,000$ 25,503,000$ 25,503,000$ 25,503,000$ 25,503,000$ 25,503,000$ 21,677,000$ 21,677,000$ 21,677,000$ 21,677,000$ 21,677,000$ 26,013,000$ 26,013,000$ 26,013,000$ 26,013,000$ 26,013,000$ 26,013,000$ 26,013,000$ 26,013,000$ 22,111,000$ 22,111,000$ 22,111,000$ 22,111,000$ 22,111,000$ 26,533,000$ 26,533,000$ 26,533,000$ 26,533,000$ 26,533,000$ 26,533,000$ 26,533,000$ 26,533,000$ 22,553,000$ 22,553,000$ 22,553,000$ 22,553,000$ 22,553,000$ 27,064,000$ 27,064,000$ 27,064,000$ 27,064,000$ 27,064,000$ 27,064,000$ 27,064,000$ 27,064,000$ 23,004,000$ 23,004,000$ 23,004,000$ 23,004,000$ 23,004,000$ 27,605,000$ 27,605,000$ 27,605,000$ 27,605,000$ 27,605,000$ 27,605,000$ 27,605,000$ 27,605,000$ 23,464,000$ 23,464,000$ 23,464,000$ 23,464,000$ 23,464,000$ 28,157,000$ 28,157,000$ 28,157,000$ 28,157,000$ 28,157,000$ 28,157,000$ 28,157,000$ 28,157,000$ 23,933,000$ 23,933,000$ 23,933,000$ 23,933,000$ 23,933,000$ 28,720,000$ 28,720,000$ 28,720,000$ 28,720,000$ 28,720,000$ 28,720,000$ 28,720,000$ 28,720,000$ 24,412,000$ 24,412,000$ 24,412,000$ 24,412,000$ 24,412,000$ 29,294,000$ 29,294,000$ 29,294,000$ 29,294,000$ 29,294,000$ 29,294,000$ 29,294,000$ 29,294,000$ 24,900,000$ 24,900,000$ 24,900,000$ 24,900,000$ 24,900,000$ 29,880,000$ 29,880,000$ 29,880,000$ 29,880,000$ 29,880,000$ 29,880,000$ 29,880,000$ 29,880,000$ 25,398,000$ 25,398,000$ 25,398,000$ 25,398,000$ 25,398,000$ 30,478,000$ 30,478,000$ 30,478,000$ 30,478,000$ 30,478,000$ 30,478,000$ 30,478,000$ 30,478,000$ 25,906,000$ 25,906,000$ 25,906,000$ 25,906,000$ 25,906,000$ 31,087,000$ 31,087,000$ 31,087,000$ 31,087,000$ 31,087,000$ 31,087,000$ 31,087,000$ 31,087,000$ 26,424,000$ 26,424,000$ 26,424,000$ 26,424,000$ 26,424,000$ 31,709,000$ 31,709,000$ 31,709,000$ 31,709,000$ 31,709,000$ 31,709,000$ 31,709,000$ 31,709,000$ 26,953,000$ 26,953,000$ 26,953,000$ 26,953,000$ 26,953,000$ 32,343,000$ 32,343,000$ 32,343,000$ 32,343,000$ 32,343,000$ 32,343,000$ 32,343,000$ 32,343,000$ 27,492,000$ 27,492,000$ 27,492,000$ 27,492,000$ 27,492,000$ 32,990,000$ 32,990,000$ 32,990,000$ 32,990,000$ 32,990,000$ 32,990,000$ 32,990,000$ 32,990,000$ 28,042,000$ 28,042,000$ 28,042,000$ 28,042,000$ 28,042,000$ 33,650,000$ 33,650,000$ 33,650,000$ 33,650,000$ 33,650,000$ 33,650,000$ 33,650,000$ 33,650,000$ 28,603,000$ 28,603,000$ 28,603,000$ 28,603,000$ 28,603,000$ 34,323,000$ 34,323,000$ 34,323,000$ 34,323,000$ 34,323,000$ 34,323,000$ 34,323,000$ 34,323,000$ 29,175,000$ 29,175,000$ 29,175,000$ 29,175,000$ 29,175,000$ 35,010,000$ 35,010,000$ 35,010,000$ 35,010,000$ 35,010,000$ 35,010,000$ 35,010,000$ 35,010,000$ 29,758,000$ 29,758,000$ 29,758,000$ 29,758,000$ 29,758,000$ 35,710,000$ 35,710,000$ 35,710,000$ 35,710,000$ 35,710,000$ 35,710,000$ 35,710,000$ 35,710,000$
25,893,000$ 25,893,000$ 25,893,000$ 25,893,000$ 25,893,000$ 27,245,000$ 27,245,000$ 27,245,000$ 27,245,000$ 27,245,000$ 27,245,000$ 28,492,000$ 28,492,000$ 25,893,000$ 25,893,000$ 25,893,000$ 25,893,000$ 25,893,000$ 27,245,000$ 27,245,000$ 27,245,000$ 27,245,000$ 27,245,000$ 27,245,000$ 28,492,000$ 28,492,000$ 25,893,000$ 25,893,000$ 25,893,000$ 25,893,000$ 25,893,000$ 27,245,000$ 27,245,000$ 27,245,000$ 27,245,000$ 27,245,000$ 27,245,000$ 28,492,000$ 28,492,000$ 25,893,000$ 25,893,000$ 25,893,000$ 25,893,000$ 25,893,000$ 27,245,000$ 27,245,000$ 27,245,000$ 27,245,000$ 27,245,000$ 27,245,000$ 28,492,000$ 28,492,000$ 25,893,000$ 25,893,000$ 25,893,000$ 25,893,000$ 25,893,000$ 27,245,000$ 27,245,000$ 27,245,000$ 27,245,000$ 27,245,000$ 27,245,000$ 28,492,000$ 28,492,000$ 25,893,000$ 25,893,000$ 25,893,000$ 25,893,000$ 25,893,000$ 27,245,000$ 27,245,000$ 27,245,000$ 27,245,000$ 27,245,000$ 27,245,000$ 28,492,000$ 28,492,000$ 25,893,000$ 25,893,000$ 25,893,000$ 25,893,000$ 25,893,000$ 27,245,000$ 27,245,000$ 27,245,000$ 27,245,000$ 27,245,000$ 27,245,000$ 28,492,000$ 28,492,000$ 25,893,000$ 25,893,000$ 25,893,000$ 25,893,000$ 25,893,000$ 27,245,000$ 27,245,000$ 27,245,000$ 27,245,000$ 27,245,000$ 27,245,000$ 28,492,000$ 28,492,000$ 25,893,000$ 25,893,000$ 25,893,000$ 25,893,000$ 25,893,000$ 27,245,000$ 27,245,000$ 27,245,000$ 27,245,000$ 27,245,000$ 27,245,000$ 28,492,000$ 28,492,000$ 25,893,000$ 25,893,000$ 25,893,000$ 25,893,000$ 25,893,000$ 27,245,000$ 27,245,000$ 27,245,000$ 27,245,000$ 27,245,000$ 27,245,000$ 28,492,000$ 28,492,000$ 25,893,000$ 25,893,000$ 25,893,000$ 25,893,000$ 25,893,000$ 27,245,000$ 27,245,000$ 27,245,000$ 27,245,000$ 27,245,000$ 27,245,000$ 28,492,000$ 28,492,000$ 25,893,000$ 25,893,000$ 25,893,000$ 25,893,000$ 25,893,000$ 27,245,000$ 27,245,000$ 27,245,000$ 27,245,000$ 27,245,000$ 27,245,000$ 28,492,000$ 28,492,000$ 25,893,000$ 25,893,000$ 25,893,000$ 25,893,000$ 25,893,000$ 27,245,000$ 27,245,000$ 27,245,000$ 27,245,000$ 27,245,000$ 27,245,000$ 28,492,000$ 28,492,000$ 25,893,000$ 25,893,000$ 25,893,000$ 25,893,000$ 25,893,000$ 27,245,000$ 27,245,000$ 27,245,000$ 27,245,000$ 27,245,000$ 27,245,000$ 28,492,000$ 28,492,000$ 25,893,000$ 25,893,000$ 25,893,000$ 25,893,000$ 25,893,000$ 27,245,000$ 27,245,000$ 27,245,000$ 27,245,000$ 27,245,000$ 27,245,000$ 28,492,000$ 28,492,000$ 25,893,000$ 25,893,000$ 25,893,000$ 25,893,000$ 25,893,000$ 27,245,000$ 27,245,000$ 27,245,000$ 27,245,000$ 27,245,000$ 27,245,000$ 28,492,000$ 28,492,000$ 25,893,000$ 25,893,000$ 25,893,000$ 25,893,000$ 25,893,000$ 27,245,000$ 27,245,000$ 27,245,000$ 27,245,000$ 27,245,000$ 27,245,000$ 28,492,000$ 28,492,000$ 25,893,000$ 25,893,000$ 25,893,000$ 25,893,000$ 25,893,000$ 27,245,000$ 27,245,000$ 27,245,000$ 27,245,000$ 27,245,000$ 27,245,000$ 28,492,000$ 28,492,000$ 25,893,000$ 25,893,000$ 25,893,000$ 25,893,000$ 25,893,000$ 27,245,000$ 27,245,000$ 27,245,000$ 27,245,000$ 27,245,000$ 27,245,000$ 28,492,000$ 28,492,000$ 25,893,000$ 25,893,000$ 25,893,000$ 25,893,000$ 25,893,000$ 27,245,000$ 27,245,000$ 27,245,000$ 27,245,000$ 27,245,000$ 27,245,000$ 28,492,000$ 28,492,000$
-$ -$ -$ -$ -$ -$ -$ -$ -$ -$ -$ -$ -$ -$ -$ -$ -$ -$ -$ -$ -$ -$ -$ -$ -$ -$ -$ -$ -$ -$ -$ -$ -$ -$ -$ -$ -$ -$ -$

Live Scenario1
Item Description QuantityGENERAL ASSUMPTIONS
2048 -$ 2049 -$ 2050 -$ 2051 -$ 2052 -$ 2053 -$ 2054 -$ 2055 -$
11. Waste Processed (tons)2025 328,5002026 328,5002027 328,5002028 328,5002029 328,5002030 328,5002031 328,5002032 328,5002033 328,5002034 328,5002035 328,5002036 328,5002037 328,5002038 328,5002039 328,5002040 328,5002041 328,5002042 328,5002043 328,5002044 328,5002045 328,5002046 328,5002047 328,5002048 328,5002049 328,5002050 328,5002051 328,5002052 328,5002053 328,5002054 328,5002055 328,500
14 15 16 17 18 19 20 21 22 23 24 25 26
-$ -$ -$ -$ -$ -$ -$ -$ -$ -$ -$ -$ -$ -$ -$ -$ -$ -$ -$ -$ -$ -$ -$ -$ -$ -$ -$ -$ -$ -$ -$ -$ -$ -$ -$ -$ -$ -$ -$ -$ -$ -$ -$ -$ -$ -$ -$ -$ -$ -$ -$ -$ -$ -$ -$ -$ -$ -$ -$ -$ -$ -$ -$ -$ -$ -$ -$ -$ -$ -$ -$ -$ -$ -$ -$ -$ -$ -$ -$ -$ -$ -$ -$ -$ -$ -$ -$ -$ -$ -$ -$ -$ -$ -$ -$ -$ -$ -$ -$ -$ -$ -$ -$ -$
328,500 328,500 328,500 328,500 328,500 394,200 394,200 394,200 394,200 394,200 394,200 394,200 394,200328,500 328,500 328,500 328,500 328,500 394,200 394,200 394,200 394,200 394,200 394,200 394,200 394,200328,500 328,500 328,500 328,500 328,500 394,200 394,200 394,200 394,200 394,200 394,200 394,200 394,200328,500 328,500 328,500 328,500 328,500 394,200 394,200 394,200 394,200 394,200 394,200 394,200 394,200328,500 328,500 328,500 328,500 328,500 394,200 394,200 394,200 394,200 394,200 394,200 394,200 394,200328,500 328,500 328,500 328,500 328,500 394,200 394,200 394,200 394,200 394,200 394,200 394,200 394,200328,500 328,500 328,500 328,500 328,500 394,200 394,200 394,200 394,200 394,200 394,200 394,200 394,200328,500 328,500 328,500 328,500 328,500 394,200 394,200 394,200 394,200 394,200 394,200 394,200 394,200328,500 328,500 328,500 328,500 328,500 394,200 394,200 394,200 394,200 394,200 394,200 394,200 394,200328,500 328,500 328,500 328,500 328,500 394,200 394,200 394,200 394,200 394,200 394,200 394,200 394,200328,500 328,500 328,500 328,500 328,500 394,200 394,200 394,200 394,200 394,200 394,200 394,200 394,200328,500 328,500 328,500 328,500 328,500 394,200 394,200 394,200 394,200 394,200 394,200 394,200 394,200328,500 328,500 328,500 328,500 328,500 394,200 394,200 394,200 394,200 394,200 394,200 394,200 394,200328,500 328,500 328,500 328,500 328,500 394,200 394,200 394,200 394,200 394,200 394,200 394,200 394,200328,500 328,500 328,500 328,500 328,500 394,200 394,200 394,200 394,200 394,200 394,200 394,200 394,200328,500 328,500 328,500 328,500 328,500 394,200 394,200 394,200 394,200 394,200 394,200 394,200 394,200328,500 328,500 328,500 328,500 328,500 394,200 394,200 394,200 394,200 394,200 394,200 394,200 394,200328,500 328,500 328,500 328,500 328,500 394,200 394,200 394,200 394,200 394,200 394,200 394,200 394,200328,500 328,500 328,500 328,500 328,500 394,200 394,200 394,200 394,200 394,200 394,200 394,200 394,200328,500 328,500 328,500 328,500 328,500 394,200 394,200 394,200 394,200 394,200 394,200 394,200 394,200328,500 328,500 328,500 328,500 328,500 394,200 394,200 394,200 394,200 394,200 394,200 394,200 394,200328,500 328,500 328,500 328,500 328,500 394,200 394,200 394,200 394,200 394,200 394,200 394,200 394,200328,500 328,500 328,500 328,500 328,500 394,200 394,200 394,200 394,200 394,200 394,200 394,200 394,200328,500 328,500 328,500 328,500 328,500 394,200 394,200 394,200 394,200 394,200 394,200 394,200 394,200328,500 328,500 328,500 328,500 328,500 394,200 394,200 394,200 394,200 394,200 394,200 394,200 394,200328,500 328,500 328,500 328,500 328,500 394,200 394,200 394,200 394,200 394,200 394,200 394,200 394,200328,500 328,500 328,500 328,500 328,500 394,200 394,200 394,200 394,200 394,200 394,200 394,200 394,200328,500 328,500 328,500 328,500 328,500 394,200 394,200 394,200 394,200 394,200 394,200 394,200 394,200328,500 328,500 328,500 328,500 328,500 394,200 394,200 394,200 394,200 394,200 394,200 394,200 394,200328,500 328,500 328,500 328,500 328,500 394,200 394,200 394,200 394,200 394,200 394,200 394,200 394,200328,500 328,500 328,500 328,500 328,500 394,200 394,200 394,200 394,200 394,200 394,200 394,200 394,200

3.0 Summary
Live Scenario1
Item Description QuantityGENERAL ASSUMPTIONS
1. Processing Rate (tons/day) 1,0002. Interest Rate - Debt Financing 3.50%3. Energy Revenues from Electricity $0.06/kWh4. Biosolids Incineration Revenue 3,177,000$
5. Summary of Net Costs (Revenue - Expenses), $/ton2025 - 2029 average tip fee 66.18$ 2030 - 2034 average tip fee 65.87$ 2035 - 2039 average tip fee 65.53$ 2040 - 2044 average tip fee 65.16$ 2045 - 2049 average tip fee (4.36)$ 2050 - 2054 average tip fee (4.82)$ 2025 - 2054 average tip fee 54.00$
6. Net Costs (Revenue - Expenses), $/ton2025 66.30$ 2026 66.23$ 2027 66.18$ 2028 66.12$ 2029 66.06$ 2030 66.00$ 2031 65.94$ 2032 65.87$ 2033 65.81$ 2034 65.74$ 2035 65.67$ 2036 65.61$ 2037 65.53$ 2038 65.46$ 2039 65.39$ 2040 65.32$ 2041 65.24$ 2042 65.16$ 2043 65.08$ 2044 65.00$ 2045 (4.19)$ 2046 (4.28)$ 2047 (4.36)$ 2048 (4.45)$ 2049 (4.54)$ 2050 (4.63)$ 2051 (4.72)$ 2052 (4.82)$ 2053 (4.91)$ 2054 (5.01)$ 2055 (5.11)$
7. Total Revenue2025 17,355,000$ 2026 17,703,000$ 2027 18,057,000$ 2028 18,418,000$ 2029 18,786,000$ 2030 19,162,000$
27 28 29 30 31 32 33 34 35 36 37 38 39
1,200 1,200 1,200 1,200 1,200 1,200 1,200 1,200 1,200 1,2004.00% 4.00% 4.00% 4.00% 5.00% 5.00% 5.00% 5.00% 5.00% 5.00%
$0.068/kWh $0.068/kWh $0.075/kWh $0.075/kWh $0.061/kWh $0.061/kWh $0.068/kWh $0.068/kWh $0.075/kWh $0.075/kWh3,177,000$ -$ 3,177,000$ -$ 3,177,000$ -$ 3,177,000$ -$ 3,177,000$ -$
66.72$ 75.11$ 62.42$ 70.81$ 77.56$ 85.95$ 73.26$ 81.65$ 68.97$ 77.36$ 66.14$ 75.40$ 61.40$ 70.66$ 77.43$ 86.69$ 72.69$ 81.95$ 67.94$ 77.20$ 65.51$ 75.73$ 60.27$ 70.49$ 77.29$ 87.51$ 72.05$ 82.27$ 66.81$ 77.03$ 64.80$ 76.09$ 59.02$ 70.31$ 77.13$ 88.42$ 71.34$ 82.63$ 65.56$ 76.85$ (8.26)$ 4.21$ (14.64)$ (2.18)$ (1.87)$ 10.59$ (8.26)$ 4.21$ (14.64)$ (2.18)$ (9.12)$ 4.65$ (16.17)$ (2.40)$ (2.07)$ 11.70$ (9.12)$ 4.65$ (16.17)$ (2.40)$ 40.97$ 51.86$ 35.38$ 46.28$ 50.91$ 61.81$ 45.33$ 56.23$ 39.74$ 50.64$
66.94$ 75.00$ 62.81$ 70.87$ 77.61$ 85.67$ 73.48$ 81.54$ 69.35$ 77.41$ 66.83$ 75.05$ 62.62$ 70.84$ 77.59$ 85.81$ 73.38$ 81.60$ 69.17$ 77.38$ 66.73$ 75.11$ 62.43$ 70.81$ 77.56$ 85.95$ 73.27$ 81.65$ 68.97$ 77.36$ 66.61$ 75.16$ 62.23$ 70.78$ 77.54$ 86.09$ 73.16$ 81.71$ 68.77$ 77.33$ 66.50$ 75.22$ 62.03$ 70.75$ 77.51$ 86.23$ 73.04$ 81.77$ 68.57$ 77.30$ 66.38$ 75.28$ 61.82$ 70.72$ 77.48$ 86.38$ 72.92$ 81.82$ 68.37$ 77.27$ 66.27$ 75.34$ 61.62$ 70.69$ 77.46$ 86.53$ 72.81$ 81.88$ 68.16$ 77.23$ 66.15$ 75.40$ 61.40$ 70.66$ 77.43$ 86.69$ 72.69$ 81.95$ 67.95$ 77.20$ 66.02$ 75.46$ 61.18$ 70.63$ 77.40$ 86.84$ 72.56$ 82.01$ 67.73$ 77.17$ 65.90$ 75.53$ 60.96$ 70.59$ 77.37$ 87.01$ 72.44$ 82.07$ 67.50$ 77.14$ 65.77$ 75.60$ 60.74$ 70.56$ 77.35$ 87.17$ 72.31$ 82.14$ 67.28$ 77.11$ 65.64$ 75.66$ 60.50$ 70.53$ 77.32$ 87.34$ 72.18$ 82.20$ 67.05$ 77.07$ 65.51$ 75.73$ 60.27$ 70.49$ 77.29$ 87.51$ 72.05$ 82.27$ 66.81$ 77.03$ 65.37$ 75.80$ 60.03$ 70.46$ 77.26$ 87.68$ 71.92$ 82.34$ 66.58$ 77.00$ 65.24$ 75.87$ 59.79$ 70.42$ 77.22$ 87.86$ 71.78$ 82.41$ 66.33$ 76.96$ 65.09$ 75.94$ 59.54$ 70.38$ 77.19$ 88.04$ 71.64$ 82.48$ 66.08$ 76.93$ 64.95$ 76.01$ 59.28$ 70.35$ 77.16$ 88.22$ 71.49$ 82.56$ 65.82$ 76.89$ 64.80$ 76.09$ 59.02$ 70.31$ 77.13$ 88.41$ 71.34$ 82.63$ 65.56$ 76.85$ 64.65$ 76.16$ 58.76$ 70.27$ 77.09$ 88.60$ 71.19$ 82.71$ 65.30$ 76.81$ 64.50$ 76.24$ 58.49$ 70.23$ 77.06$ 88.80$ 71.04$ 82.78$ 65.03$ 76.77$ (7.94)$ 4.04$ (14.07)$ (2.09)$ (1.80)$ 10.18$ (7.94)$ 4.04$ (14.07)$ (2.09)$ (8.09)$ 4.12$ (14.35)$ (2.14)$ (1.83)$ 10.38$ (8.09)$ 4.12$ (14.35)$ (2.14)$ (8.25)$ 4.21$ (14.64)$ (2.18)$ (1.87)$ 10.59$ (8.25)$ 4.21$ (14.64)$ (2.18)$ (8.42)$ 4.29$ (14.93)$ (2.22)$ (1.91)$ 10.80$ (8.42)$ 4.29$ (14.93)$ (2.22)$ (8.59)$ 4.38$ (15.23)$ (2.27)$ (1.95)$ 11.02$ (8.59)$ 4.38$ (15.23)$ (2.27)$ (8.76)$ 4.46$ (15.53)$ (2.31)$ (1.99)$ 11.24$ (8.76)$ 4.46$ (15.53)$ (2.31)$ (8.93)$ 4.55$ (15.84)$ (2.36)$ (2.02)$ 11.46$ (8.93)$ 4.55$ (15.84)$ (2.36)$ (9.11)$ 4.64$ (16.16)$ (2.40)$ (2.06)$ 11.69$ (9.11)$ 4.64$ (16.16)$ (2.40)$ (9.29)$ 4.74$ (16.48)$ (2.45)$ (2.11)$ 11.93$ (9.29)$ 4.74$ (16.48)$ (2.45)$ (9.48)$ 4.83$ (16.81)$ (2.50)$ (2.15)$ 12.17$ (9.48)$ 4.83$ (16.81)$ (2.50)$ (9.67)$ 4.93$ (17.15)$ (2.55)$ (2.19)$ 12.41$ (9.67)$ 4.93$ (17.15)$ (2.55)$
21,819,000$ 18,642,000$ 23,446,000$ 20,269,000$ 20,191,000$ 17,014,000$ 21,819,000$ 18,642,000$ 23,446,000$ 20,269,000$ 22,255,000$ 19,015,000$ 23,915,000$ 20,675,000$ 20,595,000$ 17,354,000$ 22,255,000$ 19,015,000$ 23,915,000$ 20,675,000$ 22,700,000$ 19,395,000$ 24,394,000$ 21,088,000$ 21,007,000$ 17,702,000$ 22,700,000$ 19,395,000$ 24,394,000$ 21,088,000$ 23,154,000$ 19,783,000$ 24,882,000$ 21,510,000$ 21,427,000$ 18,056,000$ 23,154,000$ 19,783,000$ 24,882,000$ 21,510,000$ 23,617,000$ 20,178,000$ 25,379,000$ 21,940,000$ 21,856,000$ 18,417,000$ 23,617,000$ 20,178,000$ 25,379,000$ 21,940,000$ 24,090,000$ 20,582,000$ 25,887,000$ 22,379,000$ 22,293,000$ 18,785,000$ 24,090,000$ 20,582,000$ 25,887,000$ 22,379,000$

Live Scenario1
Item Description QuantityGENERAL ASSUMPTIONS
2031 19,545,000$ 2032 19,936,000$ 2033 20,335,000$ 2034 20,741,000$ 2035 21,156,000$ 2036 21,579,000$ 2037 22,011,000$ 2038 22,451,000$ 2039 22,900,000$ 2040 23,358,000$ 2041 23,825,000$ 2042 24,302,000$ 2043 24,788,000$ 2044 25,284,000$ 2045 25,789,000$ 2046 26,305,000$ 2047 26,831,000$ 2048 27,368,000$ 2049 27,915,000$ 2050 28,473,000$ 2051 29,043,000$ 2052 29,624,000$ 2053 30,216,000$ 2054 30,821,000$ 2055 31,437,000$
8. Total Costs2025 39,133,000$ 2026 39,461,000$ 2027 39,796,000$ 2028 40,138,000$ 2029 40,487,000$ 2030 40,842,000$ 2031 41,205,000$ 2032 41,575,000$ 2033 41,953,000$ 2034 42,338,000$ 2035 42,730,000$ 2036 43,131,000$ 2037 43,539,000$ 2038 43,956,000$ 2039 44,381,000$ 2040 44,815,000$ 2041 45,257,000$ 2042 45,708,000$ 2043 46,168,000$ 2044 46,637,000$ 2045 24,412,000$ 2046 24,900,000$ 2047 25,398,000$ 2048 25,906,000$ 2049 26,424,000$ 2050 26,953,000$ 2051 27,492,000$ 2052 28,042,000$ 2053 28,603,000$ 2054 29,175,000$ 2055 29,758,000$
27 28 29 30 31 32 33 34 35 36 37 38 39
24,572,000$ 20,994,000$ 26,405,000$ 22,827,000$ 22,738,000$ 19,161,000$ 24,572,000$ 20,994,000$ 26,405,000$ 22,827,000$ 25,063,000$ 21,414,000$ 26,933,000$ 23,283,000$ 23,193,000$ 19,544,000$ 25,063,000$ 21,414,000$ 26,933,000$ 23,283,000$ 25,564,000$ 21,842,000$ 27,471,000$ 23,749,000$ 23,657,000$ 19,935,000$ 25,564,000$ 21,842,000$ 27,471,000$ 23,749,000$ 26,075,000$ 22,279,000$ 28,021,000$ 24,224,000$ 24,130,000$ 20,333,000$ 26,075,000$ 22,279,000$ 28,021,000$ 24,224,000$ 26,597,000$ 22,724,000$ 28,581,000$ 24,708,000$ 24,613,000$ 20,740,000$ 26,597,000$ 22,724,000$ 28,581,000$ 24,708,000$ 27,129,000$ 23,179,000$ 29,153,000$ 25,203,000$ 25,105,000$ 21,155,000$ 27,129,000$ 23,179,000$ 29,153,000$ 25,203,000$ 27,672,000$ 23,642,000$ 29,736,000$ 25,707,000$ 25,607,000$ 21,578,000$ 27,672,000$ 23,642,000$ 29,736,000$ 25,707,000$ 28,225,000$ 24,115,000$ 30,330,000$ 26,221,000$ 26,119,000$ 22,010,000$ 28,225,000$ 24,115,000$ 30,330,000$ 26,221,000$ 28,789,000$ 24,597,000$ 30,937,000$ 26,745,000$ 26,642,000$ 22,450,000$ 28,789,000$ 24,597,000$ 30,937,000$ 26,745,000$ 29,365,000$ 25,089,000$ 31,556,000$ 27,280,000$ 27,175,000$ 22,899,000$ 29,365,000$ 25,089,000$ 31,556,000$ 27,280,000$ 29,953,000$ 25,591,000$ 32,187,000$ 27,826,000$ 27,718,000$ 23,357,000$ 29,953,000$ 25,591,000$ 32,187,000$ 27,826,000$ 30,552,000$ 26,103,000$ 32,831,000$ 28,382,000$ 28,272,000$ 23,824,000$ 30,552,000$ 26,103,000$ 32,831,000$ 28,382,000$ 31,163,000$ 26,625,000$ 33,487,000$ 28,950,000$ 28,838,000$ 24,300,000$ 31,163,000$ 26,625,000$ 33,487,000$ 28,950,000$ 31,786,000$ 27,158,000$ 34,157,000$ 29,529,000$ 29,415,000$ 24,786,000$ 31,786,000$ 27,158,000$ 34,157,000$ 29,529,000$ 32,422,000$ 27,701,000$ 34,840,000$ 30,119,000$ 30,003,000$ 25,282,000$ 32,422,000$ 27,701,000$ 34,840,000$ 30,119,000$ 33,070,000$ 28,255,000$ 35,537,000$ 30,722,000$ 30,603,000$ 25,788,000$ 33,070,000$ 28,255,000$ 35,537,000$ 30,722,000$ 33,731,000$ 28,820,000$ 36,248,000$ 31,336,000$ 31,215,000$ 26,304,000$ 33,731,000$ 28,820,000$ 36,248,000$ 31,336,000$ 34,406,000$ 29,396,000$ 36,973,000$ 31,963,000$ 31,839,000$ 26,830,000$ 34,406,000$ 29,396,000$ 36,973,000$ 31,963,000$ 35,094,000$ 29,984,000$ 37,712,000$ 32,602,000$ 32,476,000$ 27,366,000$ 35,094,000$ 29,984,000$ 37,712,000$ 32,602,000$ 35,796,000$ 30,584,000$ 38,466,000$ 33,254,000$ 33,126,000$ 27,913,000$ 35,796,000$ 30,584,000$ 38,466,000$ 33,254,000$ 36,512,000$ 31,196,000$ 39,236,000$ 33,919,000$ 33,788,000$ 28,472,000$ 36,512,000$ 31,196,000$ 39,236,000$ 33,919,000$ 37,242,000$ 31,819,000$ 40,020,000$ 34,598,000$ 34,464,000$ 29,041,000$ 37,242,000$ 31,819,000$ 40,020,000$ 34,598,000$ 37,987,000$ 32,456,000$ 40,821,000$ 35,290,000$ 35,153,000$ 29,622,000$ 37,987,000$ 32,456,000$ 40,821,000$ 35,290,000$ 38,747,000$ 33,105,000$ 41,637,000$ 35,995,000$ 35,856,000$ 30,214,000$ 38,747,000$ 33,105,000$ 41,637,000$ 35,995,000$ 39,522,000$ 33,767,000$ 42,470,000$ 36,715,000$ 36,573,000$ 30,819,000$ 39,522,000$ 33,767,000$ 42,470,000$ 36,715,000$
48,206,000$ 48,206,000$ 48,206,000$ 48,206,000$ 50,785,000$ 50,785,000$ 50,785,000$ 50,785,000$ 50,785,000$ 50,785,000$ 48,601,000$ 48,601,000$ 48,601,000$ 48,601,000$ 51,180,000$ 51,180,000$ 51,180,000$ 51,180,000$ 51,180,000$ 51,180,000$ 49,003,000$ 49,003,000$ 49,003,000$ 49,003,000$ 51,582,000$ 51,582,000$ 51,582,000$ 51,582,000$ 51,582,000$ 51,582,000$ 49,413,000$ 49,413,000$ 49,413,000$ 49,413,000$ 51,992,000$ 51,992,000$ 51,992,000$ 51,992,000$ 51,992,000$ 51,992,000$ 49,831,000$ 49,831,000$ 49,831,000$ 49,831,000$ 52,410,000$ 52,410,000$ 52,410,000$ 52,410,000$ 52,410,000$ 52,410,000$ 50,258,000$ 50,258,000$ 50,258,000$ 50,258,000$ 52,837,000$ 52,837,000$ 52,837,000$ 52,837,000$ 52,837,000$ 52,837,000$ 50,694,000$ 50,694,000$ 50,694,000$ 50,694,000$ 53,273,000$ 53,273,000$ 53,273,000$ 53,273,000$ 53,273,000$ 53,273,000$ 51,138,000$ 51,138,000$ 51,138,000$ 51,138,000$ 53,717,000$ 53,717,000$ 53,717,000$ 53,717,000$ 53,717,000$ 53,717,000$ 51,590,000$ 51,590,000$ 51,590,000$ 51,590,000$ 54,169,000$ 54,169,000$ 54,169,000$ 54,169,000$ 54,169,000$ 54,169,000$ 52,052,000$ 52,052,000$ 52,052,000$ 52,052,000$ 54,631,000$ 54,631,000$ 54,631,000$ 54,631,000$ 54,631,000$ 54,631,000$ 52,524,000$ 52,524,000$ 52,524,000$ 52,524,000$ 55,103,000$ 55,103,000$ 55,103,000$ 55,103,000$ 55,103,000$ 55,103,000$ 53,004,000$ 53,004,000$ 53,004,000$ 53,004,000$ 55,583,000$ 55,583,000$ 55,583,000$ 55,583,000$ 55,583,000$ 55,583,000$ 53,495,000$ 53,495,000$ 53,495,000$ 53,495,000$ 56,074,000$ 56,074,000$ 56,074,000$ 56,074,000$ 56,074,000$ 56,074,000$ 53,995,000$ 53,995,000$ 53,995,000$ 53,995,000$ 56,574,000$ 56,574,000$ 56,574,000$ 56,574,000$ 56,574,000$ 56,574,000$ 54,505,000$ 54,505,000$ 54,505,000$ 54,505,000$ 57,084,000$ 57,084,000$ 57,084,000$ 57,084,000$ 57,084,000$ 57,084,000$ 55,025,000$ 55,025,000$ 55,025,000$ 55,025,000$ 57,604,000$ 57,604,000$ 57,604,000$ 57,604,000$ 57,604,000$ 57,604,000$ 55,556,000$ 55,556,000$ 55,556,000$ 55,556,000$ 58,135,000$ 58,135,000$ 58,135,000$ 58,135,000$ 58,135,000$ 58,135,000$ 56,097,000$ 56,097,000$ 56,097,000$ 56,097,000$ 58,676,000$ 58,676,000$ 58,676,000$ 58,676,000$ 58,676,000$ 58,676,000$ 56,649,000$ 56,649,000$ 56,649,000$ 56,649,000$ 59,228,000$ 59,228,000$ 59,228,000$ 59,228,000$ 59,228,000$ 59,228,000$ 57,212,000$ 57,212,000$ 57,212,000$ 57,212,000$ 59,791,000$ 59,791,000$ 59,791,000$ 59,791,000$ 59,791,000$ 59,791,000$ 29,294,000$ 29,294,000$ 29,294,000$ 29,294,000$ 29,294,000$ 29,294,000$ 29,294,000$ 29,294,000$ 29,294,000$ 29,294,000$ 29,880,000$ 29,880,000$ 29,880,000$ 29,880,000$ 29,880,000$ 29,880,000$ 29,880,000$ 29,880,000$ 29,880,000$ 29,880,000$ 30,478,000$ 30,478,000$ 30,478,000$ 30,478,000$ 30,478,000$ 30,478,000$ 30,478,000$ 30,478,000$ 30,478,000$ 30,478,000$ 31,087,000$ 31,087,000$ 31,087,000$ 31,087,000$ 31,087,000$ 31,087,000$ 31,087,000$ 31,087,000$ 31,087,000$ 31,087,000$ 31,709,000$ 31,709,000$ 31,709,000$ 31,709,000$ 31,709,000$ 31,709,000$ 31,709,000$ 31,709,000$ 31,709,000$ 31,709,000$ 32,343,000$ 32,343,000$ 32,343,000$ 32,343,000$ 32,343,000$ 32,343,000$ 32,343,000$ 32,343,000$ 32,343,000$ 32,343,000$ 32,990,000$ 32,990,000$ 32,990,000$ 32,990,000$ 32,990,000$ 32,990,000$ 32,990,000$ 32,990,000$ 32,990,000$ 32,990,000$ 33,650,000$ 33,650,000$ 33,650,000$ 33,650,000$ 33,650,000$ 33,650,000$ 33,650,000$ 33,650,000$ 33,650,000$ 33,650,000$ 34,323,000$ 34,323,000$ 34,323,000$ 34,323,000$ 34,323,000$ 34,323,000$ 34,323,000$ 34,323,000$ 34,323,000$ 34,323,000$ 35,010,000$ 35,010,000$ 35,010,000$ 35,010,000$ 35,010,000$ 35,010,000$ 35,010,000$ 35,010,000$ 35,010,000$ 35,010,000$ 35,710,000$ 35,710,000$ 35,710,000$ 35,710,000$ 35,710,000$ 35,710,000$ 35,710,000$ 35,710,000$ 35,710,000$ 35,710,000$
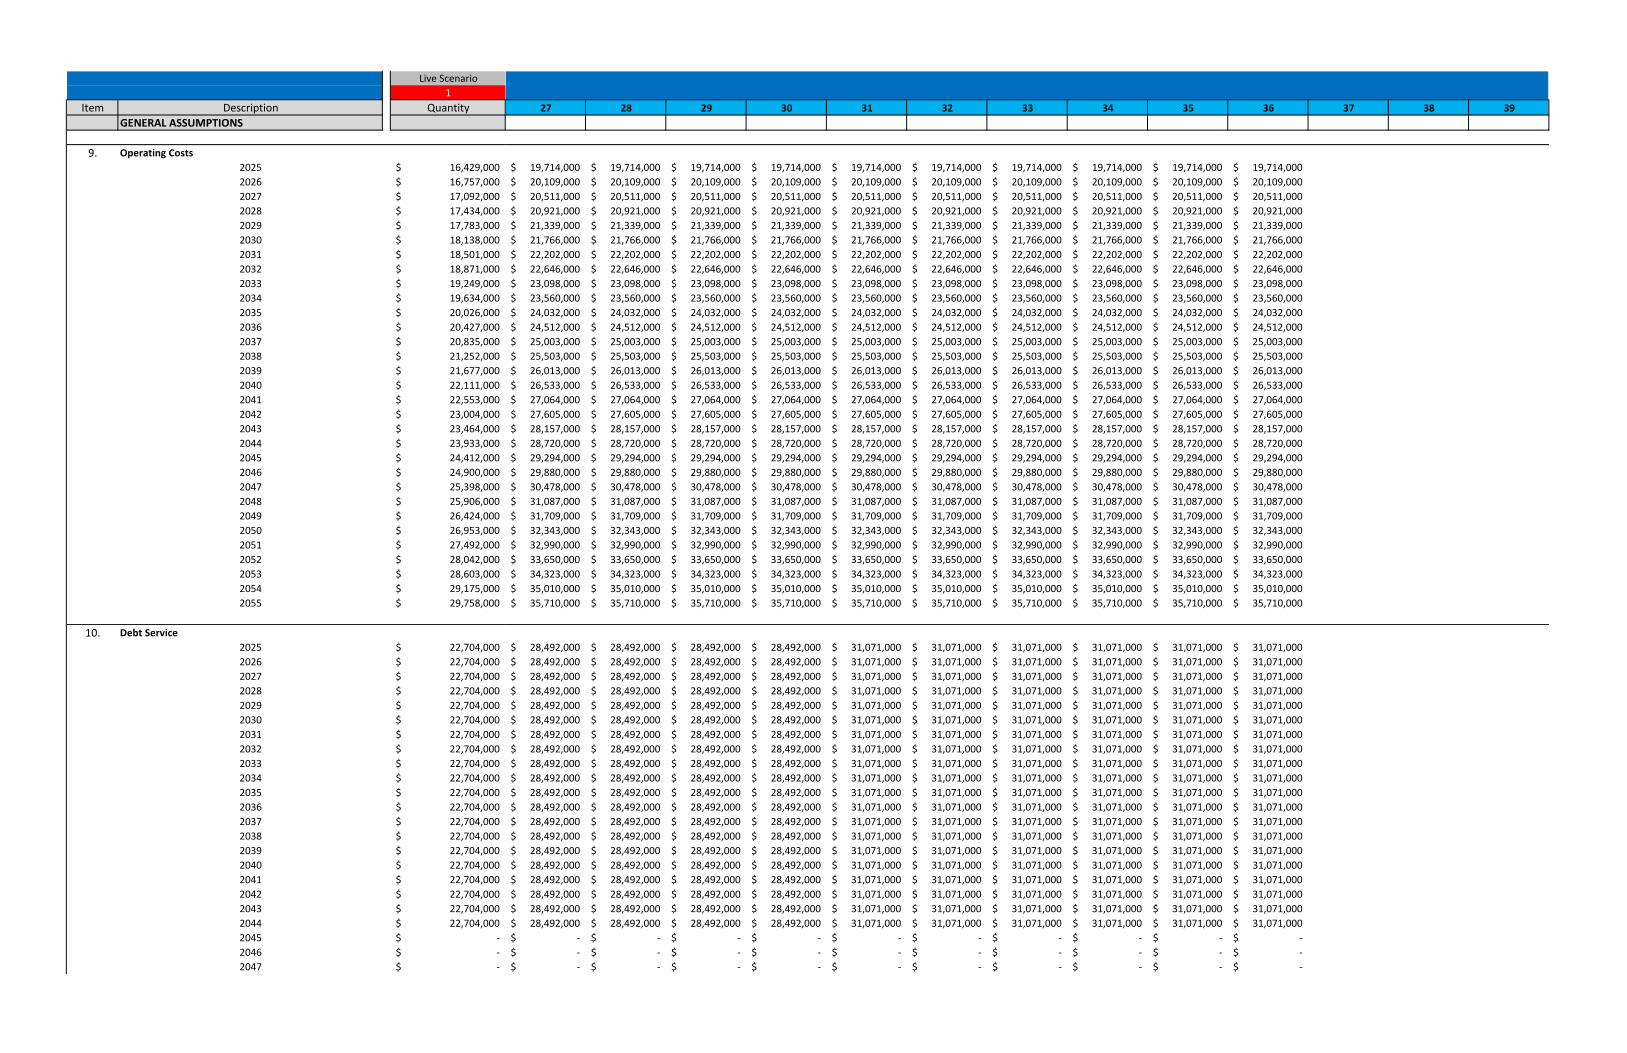
Live Scenario1
Item Description QuantityGENERAL ASSUMPTIONS
9. Operating Costs2025 16,429,000$ 2026 16,757,000$ 2027 17,092,000$ 2028 17,434,000$ 2029 17,783,000$ 2030 18,138,000$ 2031 18,501,000$ 2032 18,871,000$ 2033 19,249,000$ 2034 19,634,000$ 2035 20,026,000$ 2036 20,427,000$ 2037 20,835,000$ 2038 21,252,000$ 2039 21,677,000$ 2040 22,111,000$ 2041 22,553,000$ 2042 23,004,000$ 2043 23,464,000$ 2044 23,933,000$ 2045 24,412,000$ 2046 24,900,000$ 2047 25,398,000$ 2048 25,906,000$ 2049 26,424,000$ 2050 26,953,000$ 2051 27,492,000$ 2052 28,042,000$ 2053 28,603,000$ 2054 29,175,000$ 2055 29,758,000$
10. Debt Service2025 22,704,000$ 2026 22,704,000$ 2027 22,704,000$ 2028 22,704,000$ 2029 22,704,000$ 2030 22,704,000$ 2031 22,704,000$ 2032 22,704,000$ 2033 22,704,000$ 2034 22,704,000$ 2035 22,704,000$ 2036 22,704,000$ 2037 22,704,000$ 2038 22,704,000$ 2039 22,704,000$ 2040 22,704,000$ 2041 22,704,000$ 2042 22,704,000$ 2043 22,704,000$ 2044 22,704,000$ 2045 -$ 2046 -$ 2047 -$
27 28 29 30 31 32 33 34 35 36 37 38 39
19,714,000$ 19,714,000$ 19,714,000$ 19,714,000$ 19,714,000$ 19,714,000$ 19,714,000$ 19,714,000$ 19,714,000$ 19,714,000$ 20,109,000$ 20,109,000$ 20,109,000$ 20,109,000$ 20,109,000$ 20,109,000$ 20,109,000$ 20,109,000$ 20,109,000$ 20,109,000$ 20,511,000$ 20,511,000$ 20,511,000$ 20,511,000$ 20,511,000$ 20,511,000$ 20,511,000$ 20,511,000$ 20,511,000$ 20,511,000$ 20,921,000$ 20,921,000$ 20,921,000$ 20,921,000$ 20,921,000$ 20,921,000$ 20,921,000$ 20,921,000$ 20,921,000$ 20,921,000$ 21,339,000$ 21,339,000$ 21,339,000$ 21,339,000$ 21,339,000$ 21,339,000$ 21,339,000$ 21,339,000$ 21,339,000$ 21,339,000$ 21,766,000$ 21,766,000$ 21,766,000$ 21,766,000$ 21,766,000$ 21,766,000$ 21,766,000$ 21,766,000$ 21,766,000$ 21,766,000$ 22,202,000$ 22,202,000$ 22,202,000$ 22,202,000$ 22,202,000$ 22,202,000$ 22,202,000$ 22,202,000$ 22,202,000$ 22,202,000$ 22,646,000$ 22,646,000$ 22,646,000$ 22,646,000$ 22,646,000$ 22,646,000$ 22,646,000$ 22,646,000$ 22,646,000$ 22,646,000$ 23,098,000$ 23,098,000$ 23,098,000$ 23,098,000$ 23,098,000$ 23,098,000$ 23,098,000$ 23,098,000$ 23,098,000$ 23,098,000$ 23,560,000$ 23,560,000$ 23,560,000$ 23,560,000$ 23,560,000$ 23,560,000$ 23,560,000$ 23,560,000$ 23,560,000$ 23,560,000$ 24,032,000$ 24,032,000$ 24,032,000$ 24,032,000$ 24,032,000$ 24,032,000$ 24,032,000$ 24,032,000$ 24,032,000$ 24,032,000$ 24,512,000$ 24,512,000$ 24,512,000$ 24,512,000$ 24,512,000$ 24,512,000$ 24,512,000$ 24,512,000$ 24,512,000$ 24,512,000$ 25,003,000$ 25,003,000$ 25,003,000$ 25,003,000$ 25,003,000$ 25,003,000$ 25,003,000$ 25,003,000$ 25,003,000$ 25,003,000$ 25,503,000$ 25,503,000$ 25,503,000$ 25,503,000$ 25,503,000$ 25,503,000$ 25,503,000$ 25,503,000$ 25,503,000$ 25,503,000$ 26,013,000$ 26,013,000$ 26,013,000$ 26,013,000$ 26,013,000$ 26,013,000$ 26,013,000$ 26,013,000$ 26,013,000$ 26,013,000$ 26,533,000$ 26,533,000$ 26,533,000$ 26,533,000$ 26,533,000$ 26,533,000$ 26,533,000$ 26,533,000$ 26,533,000$ 26,533,000$ 27,064,000$ 27,064,000$ 27,064,000$ 27,064,000$ 27,064,000$ 27,064,000$ 27,064,000$ 27,064,000$ 27,064,000$ 27,064,000$ 27,605,000$ 27,605,000$ 27,605,000$ 27,605,000$ 27,605,000$ 27,605,000$ 27,605,000$ 27,605,000$ 27,605,000$ 27,605,000$ 28,157,000$ 28,157,000$ 28,157,000$ 28,157,000$ 28,157,000$ 28,157,000$ 28,157,000$ 28,157,000$ 28,157,000$ 28,157,000$ 28,720,000$ 28,720,000$ 28,720,000$ 28,720,000$ 28,720,000$ 28,720,000$ 28,720,000$ 28,720,000$ 28,720,000$ 28,720,000$ 29,294,000$ 29,294,000$ 29,294,000$ 29,294,000$ 29,294,000$ 29,294,000$ 29,294,000$ 29,294,000$ 29,294,000$ 29,294,000$ 29,880,000$ 29,880,000$ 29,880,000$ 29,880,000$ 29,880,000$ 29,880,000$ 29,880,000$ 29,880,000$ 29,880,000$ 29,880,000$ 30,478,000$ 30,478,000$ 30,478,000$ 30,478,000$ 30,478,000$ 30,478,000$ 30,478,000$ 30,478,000$ 30,478,000$ 30,478,000$ 31,087,000$ 31,087,000$ 31,087,000$ 31,087,000$ 31,087,000$ 31,087,000$ 31,087,000$ 31,087,000$ 31,087,000$ 31,087,000$ 31,709,000$ 31,709,000$ 31,709,000$ 31,709,000$ 31,709,000$ 31,709,000$ 31,709,000$ 31,709,000$ 31,709,000$ 31,709,000$ 32,343,000$ 32,343,000$ 32,343,000$ 32,343,000$ 32,343,000$ 32,343,000$ 32,343,000$ 32,343,000$ 32,343,000$ 32,343,000$ 32,990,000$ 32,990,000$ 32,990,000$ 32,990,000$ 32,990,000$ 32,990,000$ 32,990,000$ 32,990,000$ 32,990,000$ 32,990,000$ 33,650,000$ 33,650,000$ 33,650,000$ 33,650,000$ 33,650,000$ 33,650,000$ 33,650,000$ 33,650,000$ 33,650,000$ 33,650,000$ 34,323,000$ 34,323,000$ 34,323,000$ 34,323,000$ 34,323,000$ 34,323,000$ 34,323,000$ 34,323,000$ 34,323,000$ 34,323,000$ 35,010,000$ 35,010,000$ 35,010,000$ 35,010,000$ 35,010,000$ 35,010,000$ 35,010,000$ 35,010,000$ 35,010,000$ 35,010,000$ 35,710,000$ 35,710,000$ 35,710,000$ 35,710,000$ 35,710,000$ 35,710,000$ 35,710,000$ 35,710,000$ 35,710,000$ 35,710,000$
28,492,000$ 28,492,000$ 28,492,000$ 28,492,000$ 31,071,000$ 31,071,000$ 31,071,000$ 31,071,000$ 31,071,000$ 31,071,000$ 28,492,000$ 28,492,000$ 28,492,000$ 28,492,000$ 31,071,000$ 31,071,000$ 31,071,000$ 31,071,000$ 31,071,000$ 31,071,000$ 28,492,000$ 28,492,000$ 28,492,000$ 28,492,000$ 31,071,000$ 31,071,000$ 31,071,000$ 31,071,000$ 31,071,000$ 31,071,000$ 28,492,000$ 28,492,000$ 28,492,000$ 28,492,000$ 31,071,000$ 31,071,000$ 31,071,000$ 31,071,000$ 31,071,000$ 31,071,000$ 28,492,000$ 28,492,000$ 28,492,000$ 28,492,000$ 31,071,000$ 31,071,000$ 31,071,000$ 31,071,000$ 31,071,000$ 31,071,000$ 28,492,000$ 28,492,000$ 28,492,000$ 28,492,000$ 31,071,000$ 31,071,000$ 31,071,000$ 31,071,000$ 31,071,000$ 31,071,000$ 28,492,000$ 28,492,000$ 28,492,000$ 28,492,000$ 31,071,000$ 31,071,000$ 31,071,000$ 31,071,000$ 31,071,000$ 31,071,000$ 28,492,000$ 28,492,000$ 28,492,000$ 28,492,000$ 31,071,000$ 31,071,000$ 31,071,000$ 31,071,000$ 31,071,000$ 31,071,000$ 28,492,000$ 28,492,000$ 28,492,000$ 28,492,000$ 31,071,000$ 31,071,000$ 31,071,000$ 31,071,000$ 31,071,000$ 31,071,000$ 28,492,000$ 28,492,000$ 28,492,000$ 28,492,000$ 31,071,000$ 31,071,000$ 31,071,000$ 31,071,000$ 31,071,000$ 31,071,000$ 28,492,000$ 28,492,000$ 28,492,000$ 28,492,000$ 31,071,000$ 31,071,000$ 31,071,000$ 31,071,000$ 31,071,000$ 31,071,000$ 28,492,000$ 28,492,000$ 28,492,000$ 28,492,000$ 31,071,000$ 31,071,000$ 31,071,000$ 31,071,000$ 31,071,000$ 31,071,000$ 28,492,000$ 28,492,000$ 28,492,000$ 28,492,000$ 31,071,000$ 31,071,000$ 31,071,000$ 31,071,000$ 31,071,000$ 31,071,000$ 28,492,000$ 28,492,000$ 28,492,000$ 28,492,000$ 31,071,000$ 31,071,000$ 31,071,000$ 31,071,000$ 31,071,000$ 31,071,000$ 28,492,000$ 28,492,000$ 28,492,000$ 28,492,000$ 31,071,000$ 31,071,000$ 31,071,000$ 31,071,000$ 31,071,000$ 31,071,000$ 28,492,000$ 28,492,000$ 28,492,000$ 28,492,000$ 31,071,000$ 31,071,000$ 31,071,000$ 31,071,000$ 31,071,000$ 31,071,000$ 28,492,000$ 28,492,000$ 28,492,000$ 28,492,000$ 31,071,000$ 31,071,000$ 31,071,000$ 31,071,000$ 31,071,000$ 31,071,000$ 28,492,000$ 28,492,000$ 28,492,000$ 28,492,000$ 31,071,000$ 31,071,000$ 31,071,000$ 31,071,000$ 31,071,000$ 31,071,000$ 28,492,000$ 28,492,000$ 28,492,000$ 28,492,000$ 31,071,000$ 31,071,000$ 31,071,000$ 31,071,000$ 31,071,000$ 31,071,000$ 28,492,000$ 28,492,000$ 28,492,000$ 28,492,000$ 31,071,000$ 31,071,000$ 31,071,000$ 31,071,000$ 31,071,000$ 31,071,000$
-$ -$ -$ -$ -$ -$ -$ -$ -$ -$ -$ -$ -$ -$ -$ -$ -$ -$ -$ -$ -$ -$ -$ -$ -$ -$ -$ -$ -$ -$

Live Scenario1
Item Description QuantityGENERAL ASSUMPTIONS
2048 -$ 2049 -$ 2050 -$ 2051 -$ 2052 -$ 2053 -$ 2054 -$ 2055 -$
11. Waste Processed (tons)2025 328,5002026 328,5002027 328,5002028 328,5002029 328,5002030 328,5002031 328,5002032 328,5002033 328,5002034 328,5002035 328,5002036 328,5002037 328,5002038 328,5002039 328,5002040 328,5002041 328,5002042 328,5002043 328,5002044 328,5002045 328,5002046 328,5002047 328,5002048 328,5002049 328,5002050 328,5002051 328,5002052 328,5002053 328,5002054 328,5002055 328,500
27 28 29 30 31 32 33 34 35 36 37 38 39
-$ -$ -$ -$ -$ -$ -$ -$ -$ -$ -$ -$ -$ -$ -$ -$ -$ -$ -$ -$ -$ -$ -$ -$ -$ -$ -$ -$ -$ -$ -$ -$ -$ -$ -$ -$ -$ -$ -$ -$ -$ -$ -$ -$ -$ -$ -$ -$ -$ -$ -$ -$ -$ -$ -$ -$ -$ -$ -$ -$ -$ -$ -$ -$ -$ -$ -$ -$ -$ -$ -$ -$ -$ -$ -$ -$ -$ -$ -$ -$
394,200 394,200 394,200 394,200 394,200 394,200 394,200 394,200 394,200 394,200394,200 394,200 394,200 394,200 394,200 394,200 394,200 394,200 394,200 394,200394,200 394,200 394,200 394,200 394,200 394,200 394,200 394,200 394,200 394,200394,200 394,200 394,200 394,200 394,200 394,200 394,200 394,200 394,200 394,200394,200 394,200 394,200 394,200 394,200 394,200 394,200 394,200 394,200 394,200394,200 394,200 394,200 394,200 394,200 394,200 394,200 394,200 394,200 394,200394,200 394,200 394,200 394,200 394,200 394,200 394,200 394,200 394,200 394,200394,200 394,200 394,200 394,200 394,200 394,200 394,200 394,200 394,200 394,200394,200 394,200 394,200 394,200 394,200 394,200 394,200 394,200 394,200 394,200394,200 394,200 394,200 394,200 394,200 394,200 394,200 394,200 394,200 394,200394,200 394,200 394,200 394,200 394,200 394,200 394,200 394,200 394,200 394,200394,200 394,200 394,200 394,200 394,200 394,200 394,200 394,200 394,200 394,200394,200 394,200 394,200 394,200 394,200 394,200 394,200 394,200 394,200 394,200394,200 394,200 394,200 394,200 394,200 394,200 394,200 394,200 394,200 394,200394,200 394,200 394,200 394,200 394,200 394,200 394,200 394,200 394,200 394,200394,200 394,200 394,200 394,200 394,200 394,200 394,200 394,200 394,200 394,200394,200 394,200 394,200 394,200 394,200 394,200 394,200 394,200 394,200 394,200394,200 394,200 394,200 394,200 394,200 394,200 394,200 394,200 394,200 394,200394,200 394,200 394,200 394,200 394,200 394,200 394,200 394,200 394,200 394,200394,200 394,200 394,200 394,200 394,200 394,200 394,200 394,200 394,200 394,200394,200 394,200 394,200 394,200 394,200 394,200 394,200 394,200 394,200 394,200394,200 394,200 394,200 394,200 394,200 394,200 394,200 394,200 394,200 394,200394,200 394,200 394,200 394,200 394,200 394,200 394,200 394,200 394,200 394,200394,200 394,200 394,200 394,200 394,200 394,200 394,200 394,200 394,200 394,200394,200 394,200 394,200 394,200 394,200 394,200 394,200 394,200 394,200 394,200394,200 394,200 394,200 394,200 394,200 394,200 394,200 394,200 394,200 394,200394,200 394,200 394,200 394,200 394,200 394,200 394,200 394,200 394,200 394,200394,200 394,200 394,200 394,200 394,200 394,200 394,200 394,200 394,200 394,200394,200 394,200 394,200 394,200 394,200 394,200 394,200 394,200 394,200 394,200394,200 394,200 394,200 394,200 394,200 394,200 394,200 394,200 394,200 394,200394,200 394,200 394,200 394,200 394,200 394,200 394,200 394,200 394,200 394,200

3.0 Summary
Live Scenario1
Item Description QuantityGENERAL ASSUMPTIONS
1. Processing Rate (tons/day) 1,0002. Interest Rate - Debt Financing 3.50%3. Energy Revenues from Electricity $0.06/kWh4. Biosolids Incineration Revenue 3,177,000$
5. Summary of Net Costs (Revenue - Expenses), $/ton2025 - 2029 average tip fee 66.18$ 2030 - 2034 average tip fee 65.87$ 2035 - 2039 average tip fee 65.53$ 2040 - 2044 average tip fee 65.16$ 2045 - 2049 average tip fee (4.36)$ 2050 - 2054 average tip fee (4.82)$ 2025 - 2054 average tip fee 54.00$
6. Net Costs (Revenue - Expenses), $/ton2025 66.30$ 2026 66.23$ 2027 66.18$ 2028 66.12$ 2029 66.06$ 2030 66.00$ 2031 65.94$ 2032 65.87$ 2033 65.81$ 2034 65.74$ 2035 65.67$ 2036 65.61$ 2037 65.53$ 2038 65.46$ 2039 65.39$ 2040 65.32$ 2041 65.24$ 2042 65.16$ 2043 65.08$ 2044 65.00$ 2045 (4.19)$ 2046 (4.28)$ 2047 (4.36)$ 2048 (4.45)$ 2049 (4.54)$ 2050 (4.63)$ 2051 (4.72)$ 2052 (4.82)$ 2053 (4.91)$ 2054 (5.01)$ 2055 (5.11)$
7. Total Revenue2025 17,355,000$ 2026 17,703,000$ 2027 18,057,000$ 2028 18,418,000$ 2029 18,786,000$ 2030 19,162,000$
40

Live Scenario1
Item Description QuantityGENERAL ASSUMPTIONS
2031 19,545,000$ 2032 19,936,000$ 2033 20,335,000$ 2034 20,741,000$ 2035 21,156,000$ 2036 21,579,000$ 2037 22,011,000$ 2038 22,451,000$ 2039 22,900,000$ 2040 23,358,000$ 2041 23,825,000$ 2042 24,302,000$ 2043 24,788,000$ 2044 25,284,000$ 2045 25,789,000$ 2046 26,305,000$ 2047 26,831,000$ 2048 27,368,000$ 2049 27,915,000$ 2050 28,473,000$ 2051 29,043,000$ 2052 29,624,000$ 2053 30,216,000$ 2054 30,821,000$ 2055 31,437,000$
8. Total Costs2025 39,133,000$ 2026 39,461,000$ 2027 39,796,000$ 2028 40,138,000$ 2029 40,487,000$ 2030 40,842,000$ 2031 41,205,000$ 2032 41,575,000$ 2033 41,953,000$ 2034 42,338,000$ 2035 42,730,000$ 2036 43,131,000$ 2037 43,539,000$ 2038 43,956,000$ 2039 44,381,000$ 2040 44,815,000$ 2041 45,257,000$ 2042 45,708,000$ 2043 46,168,000$ 2044 46,637,000$ 2045 24,412,000$ 2046 24,900,000$ 2047 25,398,000$ 2048 25,906,000$ 2049 26,424,000$ 2050 26,953,000$ 2051 27,492,000$ 2052 28,042,000$ 2053 28,603,000$ 2054 29,175,000$ 2055 29,758,000$
40

Live Scenario1
Item Description QuantityGENERAL ASSUMPTIONS
9. Operating Costs2025 16,429,000$ 2026 16,757,000$ 2027 17,092,000$ 2028 17,434,000$ 2029 17,783,000$ 2030 18,138,000$ 2031 18,501,000$ 2032 18,871,000$ 2033 19,249,000$ 2034 19,634,000$ 2035 20,026,000$ 2036 20,427,000$ 2037 20,835,000$ 2038 21,252,000$ 2039 21,677,000$ 2040 22,111,000$ 2041 22,553,000$ 2042 23,004,000$ 2043 23,464,000$ 2044 23,933,000$ 2045 24,412,000$ 2046 24,900,000$ 2047 25,398,000$ 2048 25,906,000$ 2049 26,424,000$ 2050 26,953,000$ 2051 27,492,000$ 2052 28,042,000$ 2053 28,603,000$ 2054 29,175,000$ 2055 29,758,000$
10. Debt Service2025 22,704,000$ 2026 22,704,000$ 2027 22,704,000$ 2028 22,704,000$ 2029 22,704,000$ 2030 22,704,000$ 2031 22,704,000$ 2032 22,704,000$ 2033 22,704,000$ 2034 22,704,000$ 2035 22,704,000$ 2036 22,704,000$ 2037 22,704,000$ 2038 22,704,000$ 2039 22,704,000$ 2040 22,704,000$ 2041 22,704,000$ 2042 22,704,000$ 2043 22,704,000$ 2044 22,704,000$ 2045 -$ 2046 -$ 2047 -$
40

Live Scenario1
Item Description QuantityGENERAL ASSUMPTIONS
2048 -$ 2049 -$ 2050 -$ 2051 -$ 2052 -$ 2053 -$ 2054 -$ 2055 -$
11. Waste Processed (tons)2025 328,5002026 328,5002027 328,5002028 328,5002029 328,5002030 328,5002031 328,5002032 328,5002033 328,5002034 328,5002035 328,5002036 328,5002037 328,5002038 328,5002039 328,5002040 328,5002041 328,5002042 328,5002043 328,5002044 328,5002045 328,5002046 328,5002047 328,5002048 328,5002049 328,5002050 328,5002051 328,5002052 328,5002053 328,5002054 328,5002055 328,500
40

4.0 Pro Forma Model
Live Scenario 1Processing Rate (tons/day) 1,000Annual Inflation Rate 2.00%Energy Production 609 kWh/tonFerrous 3.20%Non Ferrous 0.30%Biosolids Incineration 3,177,000$ Facility Operating Fee $30.00/tonAsh Disposal $60.00/tonAsh Generation 25%Availability of Unit 90%Potable Water Usage 0.93 gal/tonWastewater Discharge 5.7 gal/tonReclaimed Water Usage 589 gal/tonPropane Usage 0.35 gal/tonLime Pebble Usage 0.0082 ton/tonLime Dolo Usage 0.0018 ton/tonAmmonia Usage 0.0010 ton/tonUrea Usage 0.23 gal/tonCarbon Usage 0.82 lbs/ton
YEAR 2025 2026 2027 2028 2029 2030 2031 2032 2033 2034 2035 2036 2037 PROJECTIONSWaste Processing Rate (tpd) 1,000 tpd 1,000 tpd 1,000 tpd 1,000 tpd 1,000 tpd 1,000 tpd 1,000 tpd 1,000 tpd 1,000 tpd 1,000 tpd 1,000 tpd 1,000 tpd 1,000 tpdFacility Sizing (tpd) 1,000 tpdWaste Processed (tons) 328,500 328,500 328,500 328,500 328,500 328,500 328,500 328,500 328,500 328,500 328,500 328,500 328,500Energy Produced (MWh) 200,057 200,057 200,057 200,057 200,057 200,057 200,057 200,057 200,057 200,057 200,057 200,057 200,057Potable Water Needs (gal) 306,575 306,575 306,575 306,575 306,575 306,575 306,575 306,575 306,575 306,575 306,575 306,575 306,575Wastewater Discharge (gal) 1,886,120 1,886,120 1,886,120 1,886,120 1,886,120 1,886,120 1,886,120 1,886,120 1,886,120 1,886,120 1,886,120 1,886,120 1,886,120Reclaimed Water Needs (gal) 193,621,269 193,621,269 193,621,269 193,621,269 193,621,269 193,621,269 193,621,269 193,621,269 193,621,269 193,621,269 193,621,269 193,621,269 193,621,269Propane Needs (gal) 116,109 116,109 116,109 116,109 116,109 116,109 116,109 116,109 116,109 116,109 116,109 116,109 116,109Lime Pebble Needs (tons) 2,691 2,691 2,691 2,691 2,691 2,691 2,691 2,691 2,691 2,691 2,691 2,691 2,691Lime Dolo Needs (tons) 576 576 576 576 576 576 576 576 576 576 576 576 576Ammonia Needs (tons) 339 339 339 339 339 339 339 339 339 339 339 339 339Urea Needs (gal) 76,670 76,670 76,670 76,670 76,670 76,670 76,670 76,670 76,670 76,670 76,670 76,670 76,670Carbon Needs (lbs) 270,461 270,461 270,461 270,461 270,461 270,461 270,461 270,461 270,461 270,461 270,461 270,461 270,461
OPERATING REVENUESEnergy Sales $12,207,000 $12,452,000 $12,701,000 $12,955,000 $13,214,000 $13,478,000 $13,748,000 $14,023,000 $14,303,000 $14,589,000 $14,881,000 $15,178,000 $15,482,000Metals Recovery Ferrous $788,000 $809,000 $830,000 $851,000 $872,000 $894,000 $915,000 $936,000 $957,000 $978,000 $999,000 $1,020,000 $1,041,000 Non Ferrous $1,183,000 $1,202,000 $1,222,000 $1,242,000 $1,271,000 $1,301,000 $1,330,000 $1,360,000 $1,390,000 $1,419,000 $1,449,000 $1,478,000 $1,508,000Biosolids $3,177,000 $3,240,540 $3,305,350 $3,371,460 $3,438,890 $3,507,670 $3,577,820 $3,649,380 $3,722,370 $3,796,820 $3,872,760 $3,950,220 $4,029,220
Subtotal, Revenue $17,355,000 $17,703,540 $18,058,350 $18,419,460 $18,795,890 $19,180,670 $19,570,820 $19,968,380 $20,372,370 $20,782,820 $21,201,760 $21,626,220 $22,060,220
OPERATING EXPENSESOperating Fee $9,855,000 $10,052,000 $10,253,000 $10,458,000 $10,667,000 $10,881,000 $11,098,000 $11,320,000 $11,547,000 $11,778,000 $12,013,000 $12,253,000 $12,499,000Ash Disposal $4,928,000 $5,026,000 $5,127,000 $5,229,000 $5,334,000 $5,440,000 $5,549,000 $5,660,000 $5,773,000 $5,889,000 $6,007,000 $6,127,000 $6,249,000Potable Water $17,000 $17,000 $18,000 $18,000 $19,000 $19,000 $19,000 $20,000 $20,000 $20,000 $21,000 $21,000 $22,000Wastewater $149,000 $152,000 $155,000 $158,000 $161,000 $164,000 $168,000 $171,000 $174,000 $178,000 $181,000 $185,000 $189,000Reclaimed Water $192,000 $196,000 $200,000 $204,000 $208,000 $212,000 $216,000 $220,000 $225,000 $229,000 $234,000 $239,000 $243,000Propane $149,000 $152,000 $155,000 $158,000 $161,000 $164,000 $168,000 $171,000 $175,000 $178,000 $182,000 $185,000 $189,000Lime Pebble $551,000 $562,000 $573,000 $585,000 $597,000 $609,000 $621,000 $633,000 $646,000 $659,000 $672,000 $685,000 $699,000Lime Dolo $150,000 $153,000 $156,000 $159,000 $163,000 $166,000 $169,000 $173,000 $176,000 $180,000 $183,000 $187,000 $191,000Ammonia $274,000 $279,000 $285,000 $291,000 $296,000 $302,000 $308,000 $314,000 $321,000 $327,000 $334,000 $340,000 $347,000Urea $90,000 $92,000 $93,000 $95,000 $97,000 $99,000 $101,000 $103,000 $105,000 $107,000 $109,000 $112,000 $114,000Carbon $74,000 $76,000 $77,000 $79,000 $81,000 $82,000 $84,000 $85,000 $87,000 $89,000 $91,000 $93,000 $94,000
Subtotal, Operating Expenses $16,429,000 $16,757,000 $17,092,000 $17,434,000 $17,784,000 $18,138,000 $18,501,000 $18,870,000 $19,249,000 $19,634,000 $20,027,000 $20,427,000 $20,836,000DEBT SERVICE, i=3.5%, Term=20 Yrs, $ $322,679,002 $22,704,000 $22,704,000 $22,704,000 $22,704,000 $22,704,000 $22,704,000 $22,704,000 $22,704,000 $22,704,000 $22,704,000 $22,704,000 $22,704,000 $22,704,000

YEAR 2025 2026 2027 2028 2029 2030 2031 2032 2033 2034 2035 2036 2037 PROJECTIONSTOTAL, OPERATING EXPENSES + DEBT, $ $39,133,000 $39,461,000 $39,796,000 $40,138,000 $40,488,000 $40,842,000 $41,205,000 $41,574,000 $41,953,000 $42,338,000 $42,731,000 $43,131,000 $43,540,000REVENUE - (OPERATING EXPENSES + DEBT), $ $21,778,000 $21,757,460 $21,737,650 $21,718,540 $21,692,110 $21,661,330 $21,634,180 $21,605,620 $21,580,630 $21,555,180 $21,529,240 $21,504,780 $21,479,780
SUMMARY, $/ton STATISTICCSOPERATING EXPENSES + DEBT SERVICE ($/ton) $119.13 $120.12 $121.14 $122.19 $123.25 $124.33 $125.43 $126.56 $127.71 $128.88 $130.08 $131.30 $132.54REVENUE - (OPERATING EXPENSES + DEBT) ($/ton) $66.30 $66.23 $66.17 $66.11 $66.03 $65.94 $65.86 $65.77 $65.69 $65.62 $65.54 $65.46 $65.39
Facility Nominal Size, tpd 1,000 tpdProject Facility Capex, $ $322,679,002Cash In-Lieu of Capacity Payments $0Finance Amount, $ $322,679,002
Average Tip Fee By Date Range2025-2029 average tip fee $66.17/ton2030-2034 average tip fee $65.78/ton2035-2039 average tip fee $65.39/ton2040-2044 average tip fee $65.04/ton2025-2044 average tip fee $65.59/ton

2038 2039 2040 2041 2042 2043 2044 2045 2046 2047 2048 2049 2050 2051 2052 2053 2054 2055
1,000 tpd 1,000 tpd 1,000 tpd 1,000 tpd 1,000 tpd 1,000 tpd 1,000 tpd 1,000 tpd 1,000 tpd 1,000 tpd 1,000 tpd 1,000 tpd 1,000 tpd 1,000 tpd 1,000 tpd 1,000 tpd 1,000 tpd 1,000 tpd
328,500 328,500 328,500 328,500 328,500 328,500 328,500 328,500 328,500 328,500 328,500 328,500 328,500 328,500 328,500 328,500 328,500 328,500200,057 200,057 200,057 200,057 200,057 200,057 200,057 200,057 200,057 200,057 200,057 200,057 200,057 200,057 200,057 200,057 200,057 200,057306,575 306,575 306,575 306,575 306,575 306,575 306,575 306,575 306,575 306,575 306,575 306,575 306,575 306,575 306,575 306,575 306,575 306,575
1,886,120 1,886,120 1,886,120 1,886,120 1,886,120 1,886,120 1,886,120 1,886,120 1,886,120 1,886,120 1,886,120 1,886,120 1,886,120 1,886,120 1,886,120 1,886,120 1,886,120 1,886,120193,621,269 193,621,269 193,621,269 193,621,269 193,621,269 193,621,269 193,621,269 193,621,269 193,621,269 193,621,269 193,621,269 193,621,269 193,621,269 193,621,269 193,621,269 193,621,269 193,621,269 193,621,269
116,109 116,109 116,109 116,109 116,109 116,109 116,109 116,109 116,109 116,109 116,109 116,109 116,109 116,109 116,109 116,109 116,109 116,1092,691 2,691 2,691 2,691 2,691 2,691 2,691 2,691 2,691 2,691 2,691 2,691 2,691 2,691 2,691 2,691 2,691 2,691
576 576 576 576 576 576 576 576 576 576 576 576 576 576 576 576 576 576339 339 339 339 339 339 339 339 339 339 339 339 339 339 339 339 339 339
76,670 76,670 76,670 76,670 76,670 76,670 76,670 76,670 76,670 76,670 76,670 76,670 76,670 76,670 76,670 76,670 76,670 76,670270,461 270,461 270,461 270,461 270,461 270,461 270,461 270,461 270,461 270,461 270,461 270,461 270,461 270,461 270,461 270,461 270,461 270,461
$15,792,000 $16,107,000 $16,430,000 $16,758,000 $17,093,000 $17,435,000 $17,784,000 $18,140,000 $18,502,000 $18,872,000 $19,250,000 $19,635,000 $20,028,000 $20,428,000 $20,837,000 $21,253,000 $21,679,000 $22,112,000
$1,062,000 $1,083,000 $1,104,000 $1,125,000 $1,146,000 $1,167,000 $1,188,000 $1,209,000 $1,230,000 $1,251,000 $1,272,000 $1,293,000 $1,314,000 $1,346,000 $1,377,000 $1,409,000 $1,440,000 $1,472,000$1,537,000 $1,567,000 $1,597,000 $1,626,000 $1,656,000 $1,685,000 $1,715,000 $1,744,000 $1,784,000 $1,823,000 $1,863,000 $1,902,000 $1,941,000 $1,981,000 $2,020,000 $2,060,000 $2,099,000 $2,139,000$4,109,800 $4,192,000 $4,275,840 $4,361,360 $4,448,590 $4,537,560 $4,628,310 $4,720,880 $4,815,300 $4,911,610 $5,009,840 $5,110,040 $5,212,240 $5,316,480 $5,422,810 $5,531,270 $5,641,900 $5,754,740
$22,500,800 $22,949,000 $23,406,840 $23,870,360 $24,343,590 $24,824,560 $25,315,310 $25,813,880 $26,331,300 $26,857,610 $27,394,840 $27,940,040 $28,495,240 $29,071,480 $29,656,810 $30,253,270 $30,859,900 $31,477,740
$12,748,000 $13,003,000 $13,264,000 $13,529,000 $13,799,000 $14,075,000 $14,357,000 $14,644,000 $14,937,000 $15,236,000 $15,540,000 $15,851,000 $16,168,000 $16,492,000 $16,821,000 $17,158,000 $17,501,000 $17,851,000$6,374,000 $6,502,000 $6,632,000 $6,764,000 $6,900,000 $7,038,000 $7,178,000 $7,322,000 $7,468,000 $7,618,000 $7,770,000 $7,926,000 $8,084,000 $8,246,000 $8,411,000 $8,579,000 $8,750,000 $8,925,000
$22,000 $23,000 $23,000 $23,000 $24,000 $24,000 $25,000 $25,000 $26,000 $26,000 $27,000 $28,000 $28,000 $29,000 $29,000 $30,000 $30,000 $31,000$193,000 $196,000 $200,000 $204,000 $208,000 $213,000 $217,000 $221,000 $226,000 $230,000 $235,000 $239,000 $244,000 $249,000 $254,000 $259,000 $264,000 $270,000$248,000 $253,000 $258,000 $263,000 $269,000 $274,000 $279,000 $285,000 $291,000 $297,000 $302,000 $309,000 $315,000 $321,000 $327,000 $334,000 $341,000 $347,000$193,000 $197,000 $200,000 $204,000 $209,000 $213,000 $217,000 $221,000 $226,000 $230,000 $235,000 $240,000 $244,000 $249,000 $254,000 $259,000 $265,000 $270,000$713,000 $727,000 $742,000 $757,000 $772,000 $787,000 $803,000 $819,000 $835,000 $852,000 $869,000 $887,000 $904,000 $922,000 $941,000 $960,000 $979,000 $998,000$194,000 $198,000 $202,000 $206,000 $210,000 $215,000 $219,000 $223,000 $228,000 $232,000 $237,000 $242,000 $246,000 $251,000 $256,000 $262,000 $267,000 $272,000$354,000 $361,000 $368,000 $376,000 $383,000 $391,000 $399,000 $407,000 $415,000 $423,000 $432,000 $440,000 $449,000 $458,000 $467,000 $477,000 $486,000 $496,000$116,000 $118,000 $121,000 $123,000 $126,000 $128,000 $131,000 $133,000 $136,000 $139,000 $142,000 $144,000 $147,000 $150,000 $153,000 $156,000 $159,000 $163,000
$96,000 $98,000 $100,000 $102,000 $104,000 $106,000 $108,000 $111,000 $113,000 $115,000 $117,000 $120,000 $122,000 $125,000 $127,000 $130,000 $132,000 $135,000$21,251,000 $21,676,000 $22,110,000 $22,551,000 $23,004,000 $23,464,000 $23,933,000 $24,411,000 $24,901,000 $25,398,000 $25,906,000 $26,426,000 $26,951,000 $27,492,000 $28,040,000 $28,604,000 $29,174,000 $29,758,000$22,704,000 $22,704,000 $22,704,000 $22,704,000 $22,704,000 $22,704,000 $22,704,000 $0 $0 $0 $0 $0 $0 $0 $0 $0 $0 $0
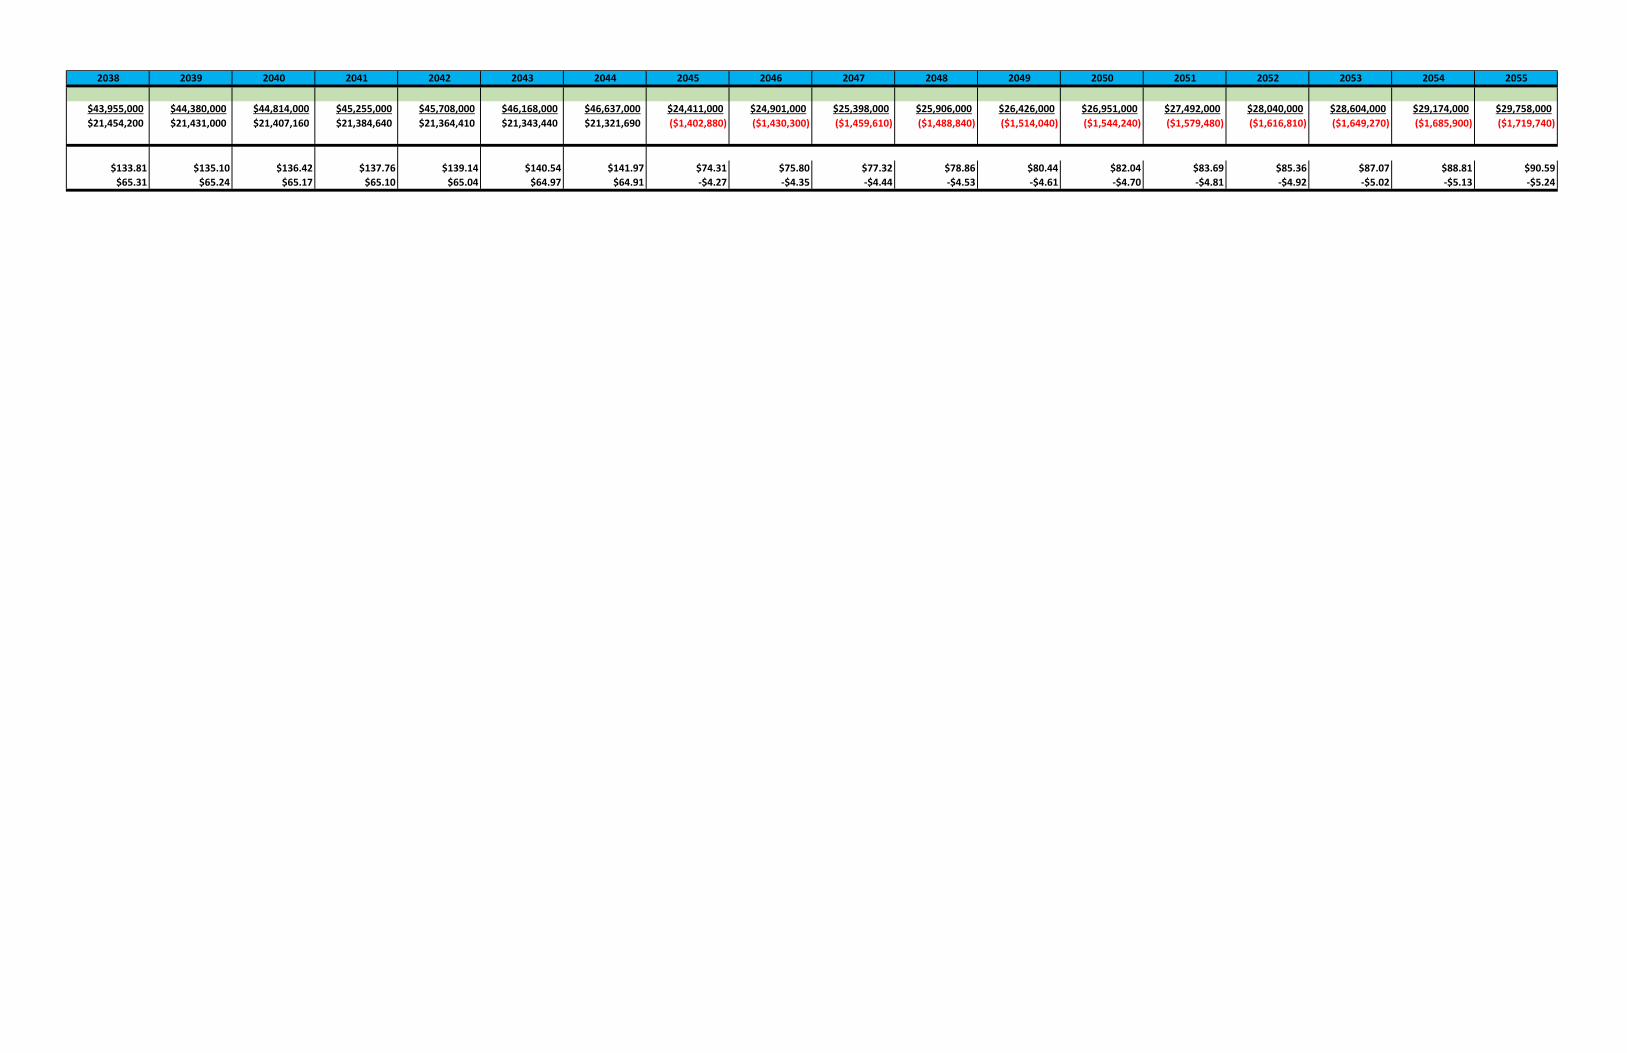
2038 2039 2040 2041 2042 2043 2044 2045 2046 2047 2048 2049 2050 2051 2052 2053 2054 2055
$43,955,000 $44,380,000 $44,814,000 $45,255,000 $45,708,000 $46,168,000 $46,637,000 $24,411,000 $24,901,000 $25,398,000 $25,906,000 $26,426,000 $26,951,000 $27,492,000 $28,040,000 $28,604,000 $29,174,000 $29,758,000$21,454,200 $21,431,000 $21,407,160 $21,384,640 $21,364,410 $21,343,440 $21,321,690 ($1,402,880) ($1,430,300) ($1,459,610) ($1,488,840) ($1,514,040) ($1,544,240) ($1,579,480) ($1,616,810) ($1,649,270) ($1,685,900) ($1,719,740)
$133.81 $135.10 $136.42 $137.76 $139.14 $140.54 $141.97 $74.31 $75.80 $77.32 $78.86 $80.44 $82.04 $83.69 $85.36 $87.07 $88.81 $90.59$65.31 $65.24 $65.17 $65.10 $65.04 $64.97 $64.91 -$4.27 -$4.35 -$4.44 -$4.53 -$4.61 -$4.70 -$4.81 -$4.92 -$5.02 -$5.13 -$5.24
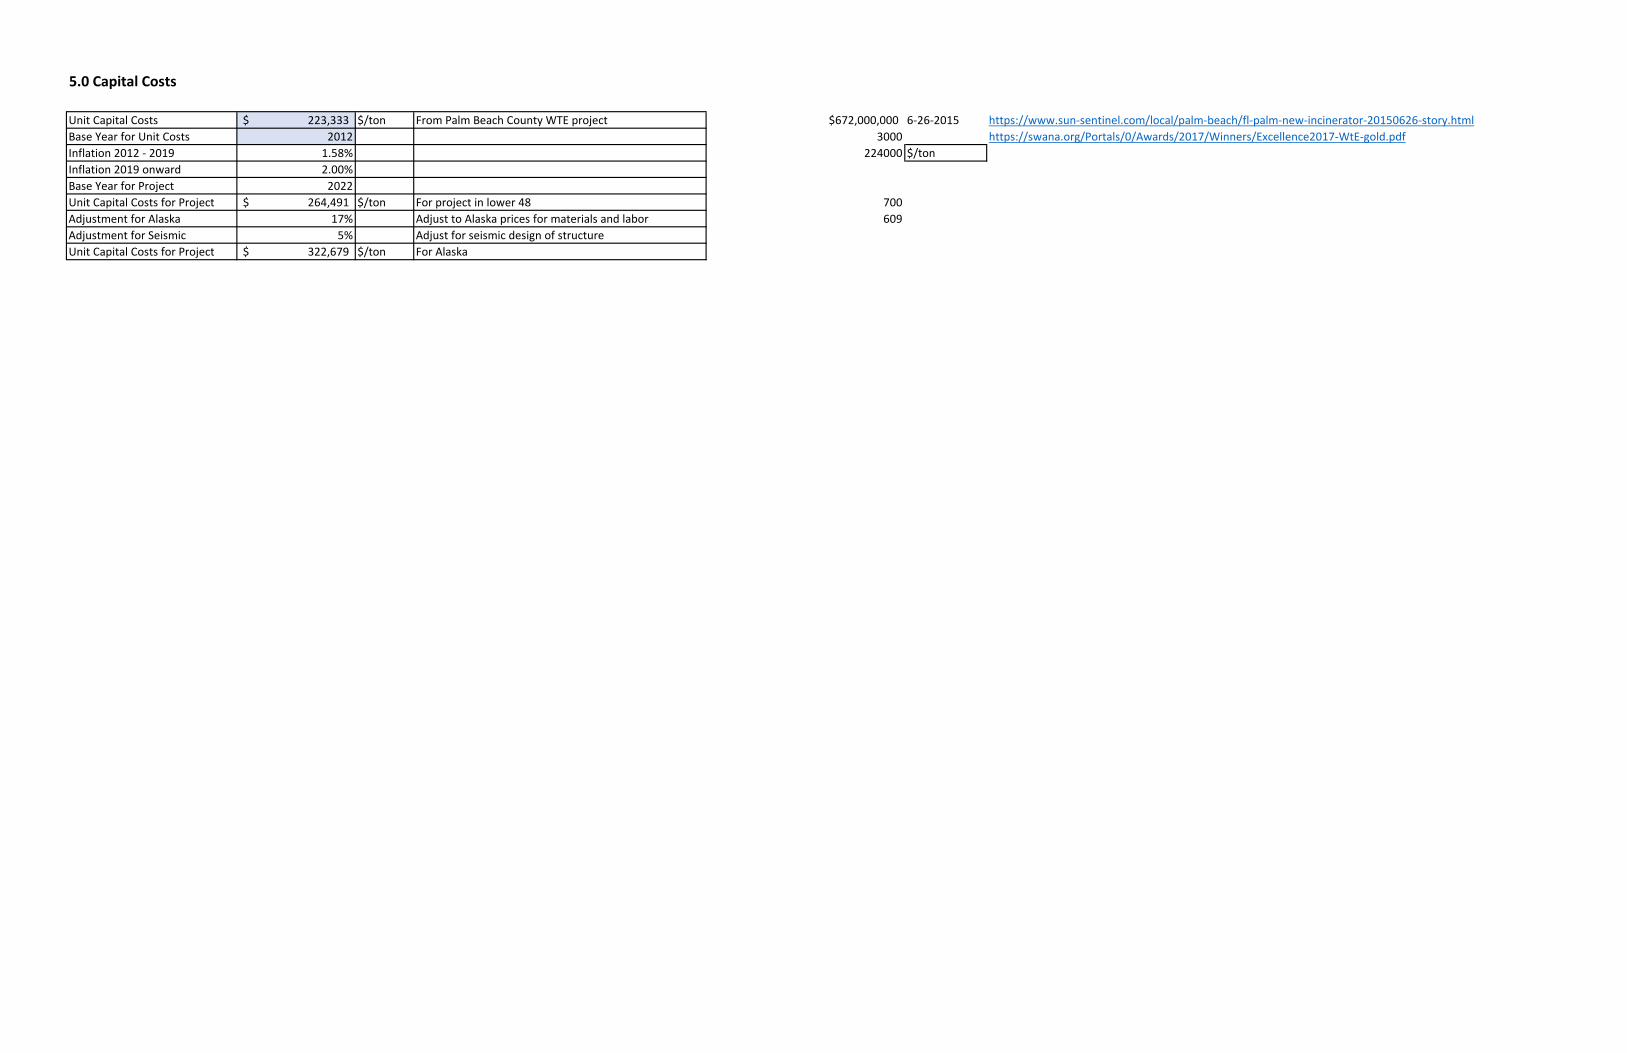
5.0 Capital Costs
Unit Capital Costs 223,333$ $/ton From Palm Beach County WTE project $672,000,000 6-26-2015 https://www.sun-sentinel.com/local/palm-beach/fl-palm-new-incinerator-20150626-story.htmlBase Year for Unit Costs 2012 3000 https://swana.org/Portals/0/Awards/2017/Winners/Excellence2017-WtE-gold.pdfInflation 2012 - 2019 1.58% 224000 $/tonInflation 2019 onward 2.00%Base Year for Project 2022Unit Capital Costs for Project 264,491$ $/ton For project in lower 48 700Adjustment for Alaska 17% Adjust to Alaska prices for materials and labor 609Adjustment for Seismic 5% Adjust for seismic design of structureUnit Capital Costs for Project 322,679$ $/ton For Alaska

6.0 Inflated Revenue and Expenses
Live Scenario 1Facility Sizing (tpd) 1,000 tpdAnnual Inflation Rate 2.00%
Year 2025 2026 2027 2028 2029 2030 2031
Operating Fee $30.00/ton $30.60/ton $31.21/ton $31.84/ton $32.47/ton $33.12/ton $33.78/tonAsh Disposal $60.00/ton $61.20/ton $62.42/ton $63.67/ton $64.95/ton $66.24/ton $67.57/tonPotable Water $0.056/gal $0.06/gal $0.06/gal $0.06/gal $0.06/gal $0.06/gal $0.06/galWastewater $0.079/gal $0.08/gal $0.08/gal $0.08/gal $0.09/gal $0.09/gal $0.09/galReclaimed Water $0.0010/gal $0.00/gal $0.00/gal $0.00/gal $0.00/gal $0.00/gal $0.00/galPropane $1.28/gal $1.31/gal $1.33/gal $1.36/gal $1.39/gal $1.42/gal $1.44/galLime Pebble $204.84/ton $208.93/ton $213.11/ton $217.38/ton $221.72/ton $226.16/ton $230.68/tonLime Dolo $260.97/ton $266.19/ton $271.51/ton $276.95/ton $282.48/ton $288.13/ton $293.90/tonAmmonia $807.79/ton $823.95/ton $840.43/ton $857.23/ton $874.38/ton $891.87/ton $909.70/tonUrea $1.17/gal $1.19/ton $1.22/ton $1.24/ton $1.27/ton $1.29/ton $1.32/tonCarbon $0.28/lb $0.28/ton $0.29/ton $0.29/ton $0.30/ton $0.30/ton $0.31/ton
Energy Sales $0.0610/kWh $0.0622/kWh $0.0635/kWh $0.0648/kWh $0.0661/kWh $0.0674/kWh $0.0687/kWhFerrous $75/ton $77/ton $79/ton $81/ton $83/ton $85/ton $87/tonNon-Ferrous $1,200/ton $1,220/ton $1,240/ton $1,260/ton $1,290/ton $1,320/ton $1,350/tonBiosolids Incineration $3,177,000 $3,240,540/ton $3,305,350/ton $3,371,460/ton $3,438,890/ton $3,507,670/ton $3,577,820/ton

2032 2033 2034 2035 2036 2037 2038 2039 2040
$34.46/ton $35.15/ton $35.85/ton $36.57/ton $37.30/ton $38.05/ton $38.81/ton $39.58/ton $40.38/ton$68.92/ton $70.30/ton $71.71/ton $73.14/ton $74.60/ton $76.09/ton $77.62/ton $79.17/ton $80.75/ton
$0.06/gal $0.07/gal $0.07/gal $0.07/gal $0.07/gal $0.07/gal $0.07/gal $0.07/gal $0.08/gal$0.09/gal $0.09/gal $0.09/gal $0.10/gal $0.10/gal $0.10/gal $0.10/gal $0.10/gal $0.11/gal$0.00/gal $0.00/gal $0.00/gal $0.00/gal $0.00/gal $0.00/gal $0.00/gal $0.00/gal $0.00/gal$1.47/gal $1.50/gal $1.53/gal $1.56/gal $1.60/gal $1.63/gal $1.66/gal $1.69/gal $1.73/gal
$235.29/ton $240.00/ton $244.80/ton $249.70/ton $254.69/ton $259.78/ton $264.98/ton $270.28/ton $275.68/ton$299.77/ton $305.77/ton $311.89/ton $318.12/ton $324.49/ton $330.98/ton $337.59/ton $344.35/ton $351.23/ton$927.90/ton $946.46/ton $965.38/ton $984.69/ton $1,004.39/ton $1,024.47/ton $1,044.96/ton $1,065.86/ton $1,087.18/ton
$1.35/ton $1.37/ton $1.40/ton $1.43/ton $1.46/ton $1.49/ton $1.52/ton $1.55/ton $1.58/ton$0.32/ton $0.32/ton $0.33/ton $0.34/ton $0.34/ton $0.35/ton $0.36/ton $0.36/ton $0.37/ton
$0.0701/kWh $0.0715/kWh $0.0729/kWh $0.0744/kWh $0.0759/kWh $0.0774/kWh $0.0789/kWh $0.0805/kWh $0.0821/kWh$89/ton $91/ton $93/ton $95/ton $97/ton $99/ton $101/ton $103/ton $105/ton
$1,380/ton $1,410/ton $1,440/ton $1,470/ton $1,500/ton $1,530/ton $1,560/ton $1,590/ton $1,620/ton$3,649,380/ton $3,722,370/ton $3,796,820/ton $3,872,760/ton $3,950,220/ton $4,029,220/ton $4,109,800/ton $4,192,000/ton $4,275,840/ton

2041 2042 2043 2044 2045 2046 2047 2048 2049
$41.18/ton $42.01/ton $42.85/ton $43.70/ton $44.58/ton $45.47/ton $46.38/ton $47.31/ton $48.25/ton$82.37/ton $84.01/ton $85.69/ton $87.41/ton $89.16/ton $90.94/ton $92.76/ton $94.61/ton $96.51/ton
$0.08/gal $0.08/gal $0.08/gal $0.08/gal $0.08/gal $0.08/gal $0.09/gal $0.09/gal $0.09/gal$0.11/gal $0.11/gal $0.11/gal $0.11/gal $0.12/gal $0.12/gal $0.12/gal $0.12/gal $0.13/gal$0.00/gal $0.00/gal $0.00/gal $0.00/gal $0.00/gal $0.00/gal $0.00/gal $0.00/gal $0.00/gal$1.76/gal $1.80/gal $1.83/gal $1.87/gal $1.91/gal $1.94/gal $1.98/gal $2.02/gal $2.06/gal
$281.20/ton $286.82/ton $292.56/ton $298.41/ton $304.38/ton $310.47/ton $316.67/ton $323.01/ton $329.47/ton$358.26/ton $365.42/ton $372.73/ton $380.19/ton $387.79/ton $395.55/ton $403.46/ton $411.53/ton $419.76/ton
$1,108.92/ton $1,131.10/ton $1,153.72/ton $1,176.80/ton $1,200.33/ton $1,224.34/ton $1,248.83/ton $1,273.80/ton $1,299.28/ton$1.61/ton $1.64/ton $1.67/ton $1.71/ton $1.74/ton $1.78/ton $1.81/ton $1.85/ton $1.88/ton$0.38/ton $0.39/ton $0.39/ton $0.40/ton $0.41/ton $0.42/ton $0.43/ton $0.43/ton $0.44/ton
$0.0838/kWh $0.0854/kWh $0.0872/kWh $0.0889/kWh $0.0907/kWh $0.0925/kWh $0.0943/kWh $0.0962/kWh $0.0981/kWh$107/ton $109/ton $111/ton $113/ton $115/ton $117/ton $119/ton $121/ton $123/ton
$1,650/ton $1,680/ton $1,710/ton $1,740/ton $1,770/ton $1,810/ton $1,850/ton $1,890/ton $1,930/ton$4,361,360/ton $4,448,590/ton $4,537,560/ton $4,628,310/ton $4,720,880/ton $4,815,300/ton $4,911,610/ton $5,009,840/ton $5,110,040/ton

2050 2051 2052 2053 2054 2055
$49.22/ton $50.20/ton $51.21/ton $52.23/ton $53.28/ton $54.34/ton$98.44/ton $100.41/ton $102.41/ton $104.46/ton $106.55/ton $108.68/ton
$0.09/gal $0.09/gal $0.10/gal $0.10/gal $0.10/gal $0.10/gal$0.13/gal $0.13/gal $0.13/gal $0.14/gal $0.14/gal $0.14/gal$0.00/gal $0.00/gal $0.00/gal $0.00/gal $0.00/gal $0.00/gal$2.10/gal $2.15/gal $2.19/gal $2.23/gal $2.28/gal $2.32/gal
$336.06/ton $342.78/ton $349.63/ton $356.63/ton $363.76/ton $371.03/ton$428.15/ton $436.71/ton $445.45/ton $454.36/ton $463.44/ton $472.71/ton
$1,325.27/ton $1,351.77/ton $1,378.81/ton $1,406.38/ton $1,434.51/ton $1,463.20/ton$1.92/ton $1.96/ton $2.00/ton $2.04/ton $2.08/ton $2.12/ton$0.45/ton $0.46/ton $0.47/ton $0.48/ton $0.49/ton $0.50/ton
$0.1001/kWh $0.1021/kWh $0.1042/kWh $0.1062/kWh $0.1084/kWh $0.1105/kWh$125/ton $128/ton $131/ton $134/ton $137/ton $140/ton
$1,970/ton $2,010/ton $2,050/ton $2,090/ton $2,130/ton $2,170/ton$5,212,240/ton $5,316,480/ton $5,422,810/ton $5,531,270/ton $5,641,900/ton $5,754,740/ton

11.0 WTE Operating Stats
Location Owner OperatorPlant Year Online or Expanded Technology Design Capacity (Tons/Day) Annual Throughput (Tons)
Construction Cost (Million $)
Management/Vendor Operating Fee ($)/Ton
Guranteed Energy Production (mWe)
North Plant Wheelabrator Wheelabrator Mass BurnSouth Plant Wheelabrator Wheelabrator Mass Burn
Dade County Covanta 1985 RDF 3000 1200000 650 50 1000MWH/dayCity of Tampa City of Tampa Wheelabrator Mass Burn 1000 310650 see note (3) 173475Hillsborough County Hillsborough County Covanta 1985 Mass Burn 1,600 580000 140 39.55 469425MWhLake County Covanta Covanta Mass BurnLee County Lee County Covanta 1994 Mass Burn 1836 641821 250 393336
REF #1 Solid Waste Authority Babcock and Wilcox 1989 RDF 2000 see note (2) 189 38.91 see note (3)REF #2 Solid Waste Authority Babcock and Wilcox 2015 Mass Burn 3000 969197 672 21.49 488001MWh
Pasco County Pasco County Covanta 1991 Mass Burn 1050 340000 90 225000MWHPinellas County Pinellas County Covanta 1983 Mass Burn 3,000 810000 555 20 430
Lee County NotesDade County NotesPalm Beach REF #1 Notes (1) All numbers are based
on the fiscal year from 10/1/15 to 9/30/16.
(5) 64,670,571 gallons of wastewater disposed to county facility
(6) 760 tons of urea
City of Tampa numbers are based off the City of Tampa fiscal year which is Oct 1 through Sept 30th
(1) City Water usage 30 million gallons, total reclaimed water usage for 2016 is 203 million gallons
(2) total gas usage for 2016 was 60,696 kcf (do not have actual cost
(3) O&M fee was $72.57/ton up to 206 K tons and the it drops to $35.22/ton
Hillsborough County Limestone cost = $537,078
Palm Beach REF #2 Notes (1) Water usage 88,563,464 gal
(2) 22,716,040 gal (3) 627,264 lb (4) 682,964 ccf (5) receive a onetime advanced capacity payment of $ 56.6 M at the time the generator was installed. SWA made a commitment of 70 MW at that time and must retain a minimum of a 70% capacity factor in order to retain that
Pebble Lime $891,012, Dolomitic Lime $326,937,
(2) 795,000 tons is the contractual guarantee. The actual for the fiscal year was 754,973 tons of processible waste and 543,572 tons of RDF burned.
(3) The annual "energy production" (gross) was 374,110 mW-hrs. The annual "energy production" (net to SWA) was 309,397 mW-hrs. The annual "energy production"
(4) PBREF#1 annual water usage (gallons): Potable Water (used by personnel = 971,023; Well water (cooling tower make-up and process water) = 366,800,456; Well water (irrigation) = 13,990,359; Non-potable water for boiler makeup = 50,108,000
1. Throughput – FY16 was a record year, FY 15 and 2. Electricity Purchaser – Seminole contract was 3. We currently receive no capacity payments, 4. Avoided energy – we only have one data point Natural Gas: For the County it is about $ 600,000. There Ammonia; N/A but we had to install a de-nitrification Annual Management fee; It is a tiered system, but most the average $/kWh in FY 15/16 was $ 0.021. From Duke –
Broward County
Palm Beach
Stats

Ferrous Non- Ferrous
Average kwH/Ton Electricity Purchaser Capacity Payment ($/Mwe)Avoided Energy (cents/kwH)
Water Purchases (Annual $)
Wastewater Charges (Annual $) Ammonia (Annual $) Natural Gas (Annual $) Ash Generation (Tons/Day)
470 Duke/FPL 0 2 160000 200000 n/a 600000 350 55 5476.82 seminole see note (1) see note (2) 72661 9618 89
469.244 Seminole NA 5-5.5 231000 430000 160058 273216 345 6 4
557 Seminole 4,586,518 2.29 266,499.00 28,394.43 601441 255602 444 42.7 6.6569 rdf FPL 1.55 see note (8) see note (4) see note (5) see note (6) see note (7) 317 70 11
504 FPL see note (5) 3 see note (1) see note (2) see note (3) see note (4) 782 64 3570 net Duke 75 market county county 22% 3.20% 0.30%
520 Duke 77.6 0.027 360000 1250000 n/a 1000000 750 80 4.5
(7) 272,032 therms (8)"Avoided Energy (cents/kwH)" is not fixed. The Utility calculates that value on a hourly basis and this number can vary significantly. In addition, we are paid at an hourly rate of the lesser of the aforementioned calculation and the Utility's "Avoided Unit Energy Cost". Therefore, even if a "fixed" value was estimated, it would be misleading.
Energy Pass Throughs
Average Metals Recovery (Tons/Day)

2018
O&M Items ReductionLabor $433,000 $398,000Natural Gas $1,140,000 $1,140,000Electricity $114,000 $99,000Chemicals $216,000 $196,000Water $1,506,000 $1,256,000ARL Tipping $88,000 $88,000TOTAL $3,497,000 $3,177,000
20 tpd328.5 days6570 Tons a year484$ per ton


123456789
10111213141516171819202122232425262728293031323334353637383940