white corn production and markets for north dakota growers
TRANSCRIPT

Agribusiness and Applied Economics Report No. 489 July 2002
White Corn Production and Markets
for North Dakota Growers
Bruce L. Dahl
William W. Wilson
Department of Agribusiness and Applied EconomicsAgricultural Experiment StationNorth Dakota State University
Fargo, ND 58105-5636

Acknowledgments
Comments on earlier versions of this paper were obtained from George Flaskerud andMarcelo Carena though errors and omissions are the responsibility of the authors. We wouldlike to thank Marcelo Carena, Assistant Professor, Department of Plant Sciences at NDSU whoprovided data and insight for this project. This research was conducted with support fromSBARE and the North Dakota Corn Growers Association.
We would be happy to provide a single copy of this publication free of charge. You canaddress your inquiry to Carol Jensen, Department of Agribusiness and Applied Economics,North Dakota State University, PO Box 5636, Fargo, ND 58105-5636, (Ph. 701-231-7441, Fax701-231-7400), (e-mail: [email protected]) or obtain a copy electronically from ourweb site: http://agecon.lib.umn.edu/ .
NOTICE:
The analyses and views reported in this paper are those of the author(s). They are not necessarilyendorsed by the Department of Agribusiness and Applied Economics or by North Dakota StateUniversity.
North Dakota State University is committed to the policy that all persons shall have equal accessto its programs, and employment without regard to race, color, creed, religion, national origin, sex, age,marital status, disability, public assistance status, veteran status, or sexual orientation.
Information on other titles in this series may be obtained from: Department of Agribusiness andApplied Economics, North Dakota State University, P.O. Box 5636, Fargo, ND 58105. Telephone: 701-231-7441, Fax: 701-231-7400, or e-mail: [email protected].
Copyright © 2002 by Bruce L. Dahl and William W. Wilson. All rights reserved. Readers maymake verbatim copies of this document for non-commercial purposes by any means, provided that thiscopyright notice appears on all such copies.
Table of Contents
Page
List of Tables . . . . . . . . . . . . . . . . . . . . . . . . . . . . . . . . . . . . . . . . . . . . . . . . . . . . . . . . . . . . . . . . ii
List of Figures . . . . . . . . . . . . . . . . . . . . . . . . . . . . . . . . . . . . . . . . . . . . . . . . . . . . . . . . . . . . . . . iii
Abstract . . . . . . . . . . . . . . . . . . . . . . . . . . . . . . . . . . . . . . . . . . . . . . . . . . . . . . . . . . . . . . . . . . . . iv
Introduction and Scope . . . . . . . . . . . . . . . . . . . . . . . . . . . . . . . . . . . . . . . . . . . . . . . . . . . . . . . . . 1
Supply and Demand . . . . . . . . . . . . . . . . . . . . . . . . . . . . . . . . . . . . . . . . . . . . . . . . . . . . . . . . . . . . 1
Domestic Markets . . . . . . . . . . . . . . . . . . . . . . . . . . . . . . . . . . . . . . . . . . . . . . . . . . . . . . . . . . . . . 5
Agronomic Competitiveness . . . . . . . . . . . . . . . . . . . . . . . . . . . . . . . . . . . . . . . . . . . . . . . . . . . . . 6Yields . . . . . . . . . . . . . . . . . . . . . . . . . . . . . . . . . . . . . . . . . . . . . . . . . . . . . . . . . . . . . . . . . 6Budget Analysis . . . . . . . . . . . . . . . . . . . . . . . . . . . . . . . . . . . . . . . . . . . . . . . . . . . . . . . . . 7
Geographic Competition . . . . . . . . . . . . . . . . . . . . . . . . . . . . . . . . . . . . . . . . . . . . . . . . . . . . . . . 12
Conclusions . . . . . . . . . . . . . . . . . . . . . . . . . . . . . . . . . . . . . . . . . . . . . . . . . . . . . . . . . . . . . . . . . 14
References . . . . . . . . . . . . . . . . . . . . . . . . . . . . . . . . . . . . . . . . . . . . . . . . . . . . . . . . . . . . . . . . . . 16

ii
List of Tables
Table No. Page
1 Major Domestic Processors of White Corn . . . . . . . . . . . . . . . . . . . . . . . . . . . . . . . . . . . . 6
2 Estimated Shipping Costs of White Corn from Selected North Dakota andNebraska Origins to Export and Domestic Locations . . . . . . . . . . . . . . . . . . . . . . . . . . . 13
3 Estimated Net Local Price of White Corn for Specific Origins (DestinationPrice Less Transportation . . . . . . . . . . . . . . . . . . . . . . . . . . . . . . . . . . . . . . . . . . . . . . . . 14

iii
List of Figures
Figure No. Page
1 Harvested Acres for U.S. White Corn, 1980/81 to 2002/03 . . . . . . . . . . . . . . . . . . . . . . . 2
2 U.S. White Corn Production, 1980/81 to 2002/03 . . . . . . . . . . . . . . . . . . . . . . . . . . . . . . . 2
3 U.S. White Corn Planted Acres, by State, 1992/93 to 2002/03 . . . . . . . . . . . . . . . . . . . . . 3
4 U.S. White Corn Production, by State, 1992/93 to 2001/02 . . . . . . . . . . . . . . . . . . . . . . . 3
5 Supply and Demand for U.S. White Corn, 1980/81 to 2001/02 . . . . . . . . . . . . . . . . . . . . 4
6 Exports of U.S. White Corn, by Country, 2000/01 and Partial 2001/02 . . . . . . . . . . . . . . 5
7 Comparison of U.S. Corn and White Corn Yields, 1980-2001 . . . . . . . . . . . . . . . . . . . . . 7
8 North Dakota Corn Production Costs, 2002 . . . . . . . . . . . . . . . . . . . . . . . . . . . . . . . . . . . 8
9 Nebraska Corn Production Costs for Selected Areas and Crop Practices, 1999 . . . . . . . . 8
10 Comparison of Net Returns for Yellow and White Corn and Difference,North Dakota, 2002 . . . . . . . . . . . . . . . . . . . . . . . . . . . . . . . . . . . . . . . . . . . . . . . . . . . . . . 9
11 Comparison of Net Returns for Yellow and White Corn and Difference, Nebraska, 1999 . . . . . . . . . . . . . . . . . . . . . . . . . . . . . . . . . . . . . . . . . . . . . . . . . . . . . . . . . 9
12 Effect of Yields on Difference in Net Returns Relative to Yellow Corn,North Dakota, 2002 . . . . . . . . . . . . . . . . . . . . . . . . . . . . . . . . . . . . . . . . . . . . . . . . . . . . . 10
13 Effect of Yields on Difference in Net Returns Relative to Yellow Corn,Nebraska, 1999 . . . . . . . . . . . . . . . . . . . . . . . . . . . . . . . . . . . . . . . . . . . . . . . . . . . . . . . . 10
14 Effect of White Corn Premiums on Difference in Net Returns Relative toYellow Corn, North Dakota, 2002 . . . . . . . . . . . . . . . . . . . . . . . . . . . . . . . . . . . . . . . . . . 11
15 Effect of White Corn Premiums on Difference in Net Returns Relative to Yellow Corn, Nebraska, 1999 . . . . . . . . . . . . . . . . . . . . . . . . . . . . . . . . . . . . . . . . . . . . . 12

iv
Abstract
U.S. white corn production, consumption, and exports increased from 1980 to 1999/00and production and area have since declined. White corn is produced largely in Nebraska,Kentucky, and Texas, although production in Texas has declined and has increased in other states(Illinois, Indiana, and Iowa). Major domestic processors of white corn are located in the southernUnited States, with the closest large domestic processor located in St. Joseph, MO. Comparisonsof white and yellow corn varieties suggest yields are similar, but have a wide range of variability. Net returns for white corn are most affected by white corn premiums and yield differencesrelative to yellow corn in southeastern and south central North Dakota. A 10 percent yieldadvantage for white corn over yellow corn or increases in the white corn premium from 10cents/bu to 30 cents/bu would increase net returns to labor by $10/a in southeastern North Dakota. Effects of increases in yield advantages or white corn premiums have larger impacts in Nebraskathan in North Dakota. Estimated net local prices for North Dakota were 22-25 cents/bu higher forshipment to the Pacific Northwest (PNW) export market than for shipment to domestic markets. This dominance of the PNW market for exports of either white or yellow corn from North Dakotaand cost disadvantages relative to production from Nebraska makes serving the domesticprocessing market not so attractive. Results would change if: 1) a local processor or domesticmarket were to arise which was not at a disadvantage to being supplied from other areas; 2)premiums for white corn over yellow corn were to increase for a sustained period of time; 3) yieldadvantages of white corn varieties relative to yellow corn varieties increase; or 4) an exportmarket which was not disadvantaged relative to being supplied from other regions were toemerge.
Key Words: white corn, supply/demand, North Dakota, competitiveness, markets, geographiccompetition

*Research Scientist and Professor, respectively, Department of Agribusiness and Applied Economics, NorthDakota State University, Fargo.
White Corn Production and Markets for North Dakota Growers
Bruce L. Dahl and William W. Wilson*
Introduction and Scope
In recent years, farmers growing corn have experienced lower profitability of traditionalyellow corn due to lower prices. Some producers searching for alternatives to gain profitabilityhave chosen production of white corn as an alternative to yellow corn. White corn production inthe United States has increased dramatically in recent years. These factors have fosteredquestions about the potential of white corn production being introduced into northern productionregions.
The purpose of this report is to describe the white corn market and assess the prospectiveagronomic competitiveness of white corn grown in the northern regions. The following sectionsprovide a description of supply and demand and trends in U.S. white corn production. Latersections describe domestic markets, agronomic competitiveness due to differences in prices/yieldsof white and yellow corn. Finally, geographic competition from markets are examined to identifyrelative attractiveness or cost disadvantages of supplying markets from North Dakota.
Supply and Demand
U.S. area of white corn increased substantially from 1980 to 2000 (Figure 1). Harvestedacres in the late 1990s and early 2000s are two to four times that harvested during the early1980s. In 1980/01, white corn was harvested on 443,000 acres, while in 2001/02, white corn washarvested on 893,000 acres. U.S. production of white corn has over the same period more thanquadrupled (Figure 2). Production of white corn in 1980/81 was 29 million bushels. By 2001/02production of white corn had increased to 135 million bushels. However, area and productionspiked in 1999/00 and have declined since then with projections for 2002/03 harvested acres atjust over 800,000 and production down from 155 million bushels for 1990/00 to a projectedproduction of 117 million bushels for 2002/03.
White corn is planted in several states in the United States, but planted area has beenconcentrated in Nebraska, Kentucky, Texas, and Illinois and has increased in the late 1990s andearly 2000s in Indiana and Iowa (Figure 3). Production is concentrated in the same states,although, changes in production in the 1990s and 2000s also reflect yield variability across statesand years. In most years in this period, over 50 percent of production is from Nebraska,Kentucky, and Texas (Figure 4). Since 1999/00, production in the states of Illinois, Indiana, andIowa have increased in importance and Texas has declined. Production increases for white cornhave come from increases in production in states where large areas of white corn have beengrown (Nebraska and Kentucky), from increases in production in states where white corn hadpreviously not been important (Indiana, Iowa, and others), and from introduction of white cornproduction into states where white corn had not been grown such as the upper Midwest whichincludes Minnesota and Wisconsin.

2
1980 1983 1986 1989 1992 1995 1998 20010
200
400
600
800
1000
1200
1400H
arve
sted
Acr
es (0
00)
Figure 1. Harvested Acres for U.S. White Corn, 1980/81 to 2002/03.
1980 1983 1986 1989 1992 1995 1998 20010
50
100
150
200
Prod
uctio
n (M
il. b
u.)
Figure 2. U.S. White Corn Production, 1980/81 to 2002/03.

3
1992 1995 1998 20010
200
400
600
800
1000
1200
1400Pl
ante
d Ac
res
(000
) CaliforniaUpper MidwestKansasOhioSoutheastern StatesIowaMissouriIndianaIllinoisTexasKentuckyNebraska
Figure 3. U.S. White Corn Planted Acres, by State, 1992/93 to 2002/03.
1992 1995 1998 20010
50
100
150
Prod
uctio
n (M
il. b
u.)
MississippiCaliforniaUpper MidwestKansasOhioSoutheastern StatesIowaMissouriIndianaIllinoisTexasKentuckyNebraska
Figure 4. U.S. White Corn Production, by State, 1992/93 to 2001/02.

4
1980 1985 1990 1995 2000
crop year
(50)
0
50
100
150
200
Milli
on B
ushe
ls Production
Domestic Use
Supplies
Exports
Excess Supplies
Figure 5. Supply and Demand for U.S. White Corn, 1980/81 to 2001/02.
As production of white corn in the United States has grown, both domestic consumptionand exports of U.S. white corn have increased (Figure 5). Domestic consumption of U.S. whitecorn has more than doubled from 26 million bushels in 1980/81 to 60 million bushels in 2001/02. Growth in exports of U.S. white corn have increased even more dramatically, increasing from 7million bushels in 1980/81 to 62 million bushels in 2001/02.
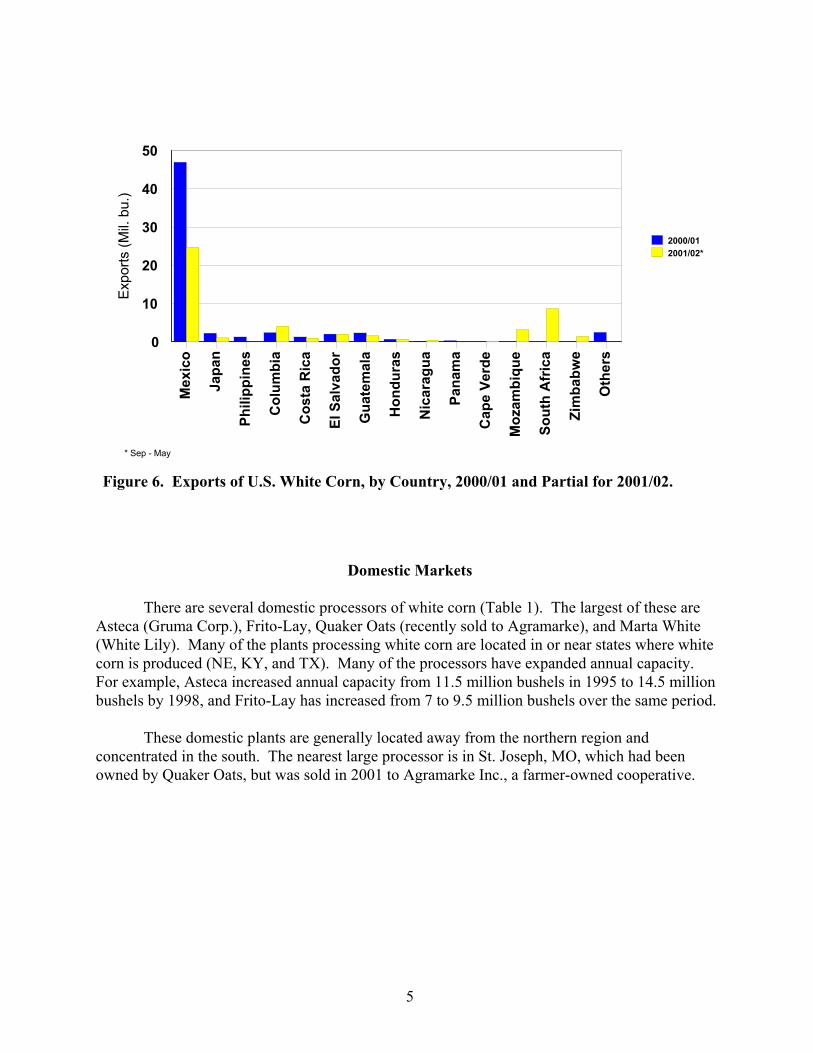
Mexico was the largest importer of U.S. white corn in 2000/01 importing 75 percent ofU.S. white corn exports in that marketing year (Figure 6). Other major importers of U.S. whitecorn in that year were Central/South American countries (Colombia, Costa Rica, El Salvador,Guatemala, Honduras, Nicaragua, and Panama) along with Japan and the Philippines. Exports for2001/02, although only representing a portion of the crop year, show similar trends and includeshipments to Mozambique, South Africa, and Zimbabwe.
5
Mex
ico
Japa
n
Phili
ppin
es
Col
umbi
a
Cos
ta R
ica
El S
alva
dor
Gua
tem
ala
Hon
dura
s
Nic
arag
ua
Pana
ma
Cap
e Ve
rde
Moz
ambi
que
Sout
h A
fric
a
Zim
babw
e
Oth
ers
0
10
20
30
40
50
Expo
rts (M
il. b
u.)
2000/012001/02*
* Sep - May
Figure 6. Exports of U.S. White Corn, by Country, 2000/01 and Partial for 2001/02.
Domestic Markets
There are several domestic processors of white corn (Table 1). The largest of these areAsteca (Gruma Corp.), Frito-Lay, Quaker Oats (recently sold to Agramarke), and Marta White(White Lily). Many of the plants processing white corn are located in or near states where whitecorn is produced (NE, KY, and TX). Many of the processors have expanded annual capacity. For example, Asteca increased annual capacity from 11.5 million bushels in 1995 to 14.5 millionbushels by 1998, and Frito-Lay has increased from 7 to 9.5 million bushels over the same period.
These domestic plants are generally located away from the northern region andconcentrated in the south. The nearest large processor is in St. Joseph, MO, which had beenowned by Quaker Oats, but was sold in 2001 to Agramarke Inc., a farmer-owned cooperative.

6
Table 1. Major Domestic Processors of White Corn
Firm - Locations 1995 1998
--- million bushels ---
Asteca (Gruma Corp.) - CA, IN, KY, TX 11.5 14.5
Frito-Lay 7 9.5
Quaker Oats - IO, MO 5.5 5.5
Marta White (White Lily) - TN 5 4.5
ADM- TX, CA, KY, NE 2.5
Minsa - TX, IO 1.5
Others 7.2 9.5
Total 36.2 47.5
Agronomic Competitiveness
Yields
Average yields of corn and white corn were compared to evaluate their competitiveness. U.S. corn (predominately yellow) and white corn yields have increased from 1980-2001 (Figure 7). Yields of U.S. all corn and white corn follow the same general pattern. However,yields for white corn were generally lower than those of all U.S. corn through most of the 1980sand have recently increased above those for all corn in the last few years. This suggests growth inyields for white corn has been at a faster rate than those for yellow corn.
Yields for white and yellow corn varieties adapted to North Dakota have been examinedin several variety trials. Results from trials suggest yields from white and yellow corn varietiesare comparable, with a high degree of variability. For example, results from a trial in NorthDakota in 2001 had a white variety yielding 147 bu/a while the average of all varieties was 137where the LSD (Least Significant Difference) at 5 percent probability was 27 bu/a (Carena, 2002and Carena and Berglund, 2001). Most yellow varieties had yields within 27 bu/a of the mean. This suggests yields for most white and yellow corn varieties are similar. Thus, budget analysisbelow assumes yields are equal and then sensitivities are conducted.

7
1980
1983
1986
1989
1992
1995
1998 20
0160
70
80
90
100
110
120
130
140
150
160
bu/a
US Corn
White Corn
Figure 7. Comparison of U.S. Corn and White Corn Yields, 1980-2001.
Budget Analysis
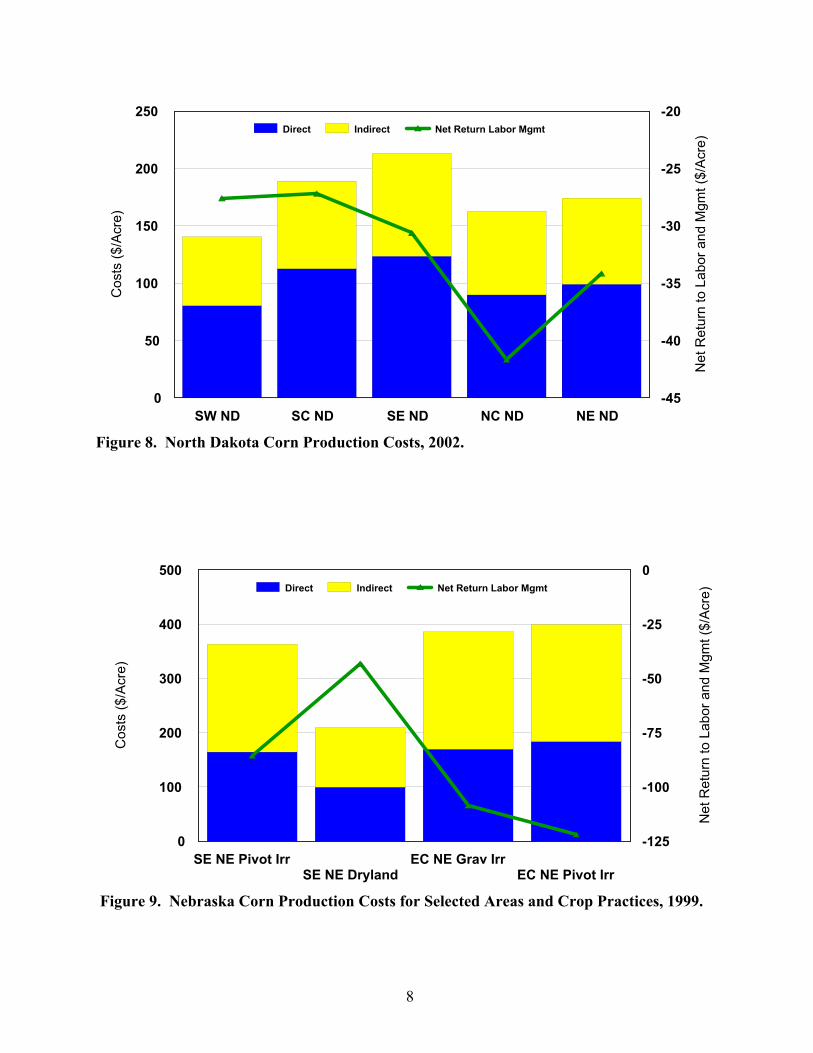
A budget analysis of production of white or yellow corn was conducted using cropbudgets generated for North Dakota and Nebraska. Budgets were obtained from Swenson andHaugen for North Dakota and from the Nebraska Extension Service. These were utilized tocompare effects of yield differences and white corn premiums on profitability of white versusyellow corn varieties in selected growing regions of North Dakota and Nebraska. Costs and netreturns to labor for yellow corn are shown in Figures 8 and 9 for North Dakota and Nebraska.
Net returns to labor and management were estimated for both yellow and white corn. Yields and costs of producing both white and yellow corn were assumed equivalent. However, apremium of 10 cents/bu was applied to white corn. Net returns were less negative for white cornbudgets in North Dakota than for yellow corn. Differences in net returns between white andyellow were highest for southeastern ($10/a) and south central ($9/a) North Dakota and lowest forsouthwestern ($6/a) North Dakota (Figure 10). For Nebraska, differences in net returns werehighest for white corn production grown under irrigation in both southeast and east centralNebraska. White corn increased net returns under irrigation in these areas over yellow by $15/a(Figure 11).
Sensitivities were conducted on both yields and premiums of white corn. Increasing whitecorn yields by 10 percent increased the advantage of white over yellow (Figures 12 and 13). These increases were largest in southeastern and south central North Dakota. Increasing yields ofwhite corn by 10 percent increased the advantage of white corn net revenue over yellow insoutheastern North Dakota from $10/a to $30/a. Decreases in yields by 10 percent affected thesame areas the most. A 10 percent decrease in yields resulted in white corn being at a $9/a costdisadvantage to yellow, where in the base case it had a $10/a advantage. Increasing yields inNebraska increased the advantage of white over yellow corn under irrigation from $15/a to $45/a.
8
SW ND SC ND SE ND NC ND NE ND0
50
100
150
200
250C
osts
($/A
cre)
-45
-40
-35
-30
-25
-20
Net
Ret
urn
to L
abor
and
Mgm
t ($/
Acre
)Direct Indirect Net Return Labor Mgmt
Figure 8. North Dakota Corn Production Costs, 2002.
SE NE Pivot IrrSE NE Dryland
EC NE Grav IrrEC NE Pivot Irr
0
100
200
300
400
500
Cos
ts ($
/Acr
e)
-125
-100
-75
-50
-25
0
Net
Ret
urn
to L
abor
and
Mgm
t ($/
Acre
)Direct Indirect Net Return Labor Mgmt
Figure 9. Nebraska Corn Production Costs for Selected Areas and Crop Practices, 1999.

9
SE NE Pivot IrrSE NE Dryland
EC NE Grav IrrEC NE Pivot Irr
-150
-100
-50
0
50
Cos
ts ($
/Acr
e)
Yellow White Difference (White-Yellow)
Figure 11. Comparison of Net Returns for Yellow and White Corn and Difference,Nebraska, 1999.
SW ND SC ND SE ND NC ND NE ND-50
-40
-30
-20
-10
0
10
20C
osts
($/A
cre)
Yellow White Difference (White-Yellow)
Figure 10. Comparison of Net Returns for Yellow and White Corn and Difference, NorthDakota, 2002.

10
SW ND SC ND SE ND NC ND NE ND-20
-10
0
10
20
30
40
Diff
eren
ce in
Net
Ret
urns
(Whi
te-Y
ello
w $
/Acr
e)+10% Yield Base -10% Yield
Figure 12. Effect of Yields on Difference in Net Returns Relative to Yellow Corn, NorthDakota, 2002.
SE NE Pivot Irr SE NE Dryland EC NE Grav Irr EC NE Pivot Irr-20
-10
0
10
20
30
40
50
60
Diff
eren
ce in
Net
Ret
urns
(Whi
te-Y
ello
w $
/Acr
e)
+10% Yield Base -10% Yield
Figure 13. Effect of Yields on Difference in Net Returns Relative to Yellow Corn, Nebraska,1999.

11
SW ND SC ND SE ND NC ND NE ND-20
-10
0
10
20
30
40
Diff
eren
ce in
Net
Ret
urns
(Whi
te-Y
ello
w $
/Acr
e)
Prem 30c/b Base Prem 10 c/b Prem -10c/b
Figure 14. Effect of White Corn Premiums on Difference in Net Returns Relative to YellowCorn, North Dakota, 2002.
Changes in premiums for white corn had similar effects. Increasing the premium forwhite corn from 10 cents/bu to 30 cents/bu increased the advantage of white corn in southeasternNorth Dakota to $30/a (Figure 14). Similarly, decreasing the premium for white corn from 10cents/bu to -10 cents/bu resulted in white corn in southeastern North Dakota being at a $10/adisadvantage to yellow corn production. Changes in premiums in Nebraska had similar effects to10 percent changes in yields. Increasing the premium from 10 cents/bu to 30 cents/bu increasednet returns under irrigation in southeastern and east central Nebraska from $15/a to $45/a (Figure15).

12
SE NE Pivot Irr SE NE Dryland EC NE Grav Irr EC NE Pivot Irr-20
-10
0
10
20
30
40
50
60D
iffer
ence
in N
et R
etur
ns (W
hite
-Yel
low
$/A
cre)
Prem 30c/b Base Prem 10 c/b Prem -10c/b
Figure 15. Effect of White Corn Premiums on Difference in Net Returns Relative to YellowCorn, Nebraska, 1999.
Geographic Competition
Competitiveness of white corn production in North Dakota versus other regions wasevaluated by comparing net corn prices to different markets and contrasting these with otherprominent white corn producing regions (Nebraska).
Rail shipping rates for corn to several export locations [Pacific Northwest (PNW), St.Louis, Texas Gulf, and to Mexico by rail] were taken from Burlington Northern Santa Fe (BNSF). Rates were obtained for two North Dakota corn shuttle loading facilities, Anton (Hillsboro) andJamestown, and for six shuttle locations in Nebraska which were chosen to represent cropreporting districts where white corn is produced. Domestic rail shipping rates were compared forone additional North Dakota location (Arvilla) and same locations for export comparisons to St.Joseph, MO (Table 2).
Prices at specific markets were taken from AMS (2002b) for April 2002. Averagemonthly prices reflect largely No. 2 yellow corn; however, white and yellow corn prices deliveredKansas City provide insight into the spread between white and yellow corn. This spread (10cents/bu) was added to all No. 2 yellow corn prices to examine geographic competition.

13
Table 2. Estimated Shipping Costs of White Corn from Selected North Dakota and NebraskaOrigins to Export and Domestic Locations.
Destinations
Region-State
Origin Station PNW St. Louis Gulf Mexico St. Joseph
CE-ND Alton (Hillsboro) 0.77 0.71 0.77 1.17 0.45
Cen-ND Jamestown 0.76 0.70 0.76 1.16 0.47
NC-ND Arvilla 0.54
NE-NE S. Sioux City 0.71 0.63 0.71 1.05 0.36
EC-NE Fremont 0.73 0.59 0.61 0.92 0.32
SE-NE Lincoln 0.73 0.59 0.61 0.92 0.30
Cen-NE Roseland 0.72 0.64 0.59 0.92 0.37
SW-NE Maywood 0.72 0.64 0.59 0.92 0.36
PH-NE Gurley* 0.64 0.68 0.59 0.87 0.41* For St. Joseph, Transportation rates to Alliance were utilized as none for Gurley were available.
Estimated net local prices indicate that the PNW is the predominant market determininglocal prices for North Dakota white corn (Table 3). This is also true in Nebraska, but to a lesserextent. Net local prices for Alton are 22 cents/bu, and Jamestown is 25 cents/bu higher fordelivery to the PNW than for shipments to St. Joseph. This suggests that a competitive price forsupplies from Alton would be a price at St. Joseph of $2.24/bu or $1.79 + 0.45 = $2.24. Thus,relative prices (i.e., PNW relative to St. Joseph) and/or shipping costs would have to decline forwhite corn to move from North Dakota to St. Joseph. In fact, relative prices for shipment of whitecorn from Alton and Jamestown to St. Joseph would be at a 12 cents/bu to 15 cents/budisadvantage to yellow corn shipped to the PNW (PNW net local price less 10 cents/bu whitecorn premium).

14
Table 3. Estimated Net Local Price of White Corn for Specific Origins (Destination Price LessTransportation).
Destinations
Origin PNW St. Louis Gulf St. Joseph
Region-State
Price 2.56 2.16 2.31 2.02
Net Local Price (Destination Price Less Transportation)
CE-ND Alton (Hillsboro) 1.79 1.45 1.54 1.57
Cen-ND Jamestown 1.80 1.46 1.55 1.55
NC-ND Arvilla 1.48
NE-NE S. Sioux City 1.85 1.53 1.60 1.66
EC-NE Fremont 1.83 1.57 1.70 1.70
SE-NE Lincoln 1.83 1.57 1.70 1.72
Cen-NE Roseland 1.84 1.52 1.72 1.65
SW-NE Maywood 1.84 1.52 1.72 1.66
PH-NE Gurley* 1.92 1.48 1.72 1.61* For St. Joseph, Transportation rates to Alliance were utilized as none for Gurley were available.
Conclusions
U.S. white corn production, consumption and exports have increased dramatically from1980 to 2000. Production and area have since declined. White corn has been produced largely inNebraska, Kentucky, and Texas, although production in Texas has declined and production inother states (Illinois, Indiana, and Iowa) have increased. Major domestic processors of white cornare located in the southern United States, with the closest large domestic processor located in St.Joseph, MO. Comparisons of white and yellow corn varieties suggest yields are similar but havea wide range of variability. Net returns for white corn are most affected by white corn premiumsand yield differences relative to yellow corn in southeastern and south central North Dakota. A10 percent yield advantage for white over yellow corn or increases in the white corn premiumfrom 10 cents/bu to 30 cents/bu would increase net returns to labor by $10/a in southeasternNorth Dakota. Effects of increases in yield advantages or white corn premiums had a largerimpact in Nebraska than in North Dakota. Estimated net local prices for North Dakota were 22-25 cents/bu higher for shipment to the PNW export market than for shipment to domestic

15
markets. This dominance of the PNW market for exports of either white or yellow corn fromNorth Dakota and cost disadvantages relative to production from Nebraska make serving thedomestic processing market not so attractive.
These conclusions depend on the prevailing conditions remaining in place. Results wouldchange if: 1) a local processor or domestic market were to arise which was not at a disadvantageto being supplied from other areas; 2) premiums for white corn over yellow corn were to increasefor a sustained period of time; 3) yield advantages of white corn varieties relative to yellow cornvarieties increase; or 4) an export market which was not disadvantaged relative to being suppliedfrom other regions were to emerge.
16
References
Agricultural Marketing Service. 2002a. Grain Transportation Report. U.S. Department ofAgriculture, Washington, DC.
Agricultural Marketing Service. 2002b. Grain and Feed Weekly Summary and Statistics Vol50(19, May 10). U.S. Department of Agriculture, Washington, DC.
Burlington Northern Santa Fe. 2002. Corn Shuttle Train Rates. http://www.bnsf.com/business/agcom/bnsf4022/bnsf4022.html#shuttle
Nebraska Cooperative Extension Service. 1999. Nebraska Crop Budgets. University ofNebraska, Institute of Agriculture and Natural Resources, http://www.ianr.unl.edu/pubs/farmmgt/ec872/index.htm
Carena, M. J. 2002. Yield Data on Yellow/White Corn Variety Trials at Fargo. North DakotaState University, Department of Plant Sciences.
Carena, M. J., and D. Berglund. 2001. North Dakota Corn Performance Testing 2001. CircularA-793(Revised), North Dakota Agricultural Experiment Station and Extension Service,Fargo.
Swenson, Andrew and Ron Haugen. 2001. “Projected 2002 Crop Budgets.” Farm ManagementPlanning Guide. North Dakota State University, Extension Service, Fargo.