which is riskier – the euro or the dollar? 1. introduction ... · which is riskier – the euro...
TRANSCRIPT

Otar Nadaraia1
Deputy Governor of the National Bank of Georgia
Otar Gorgodze
Head of Specialized Groups and Supervisory Policy Department
David Utiashvili
Head of Financial Risks and Macroprudential Policy Division
Which is riskier – the Euro or the Dollar?
1. Introduction
In the majority of open and small developing countries funding in own currency is
significantly limited, which constitutes a source of additional financial risks. The
economic literature knows this problem as ‘Original Sin’2 which negatively affects the
conduct and effectiveness of economic policy. Hausmann and Stein (2001) analyze this
phenomenon confirms its influence on the conduct of economic policy based on the
empirical data from different countries. This problem is particularly urgent in Georgia.
Funding in the national currency is extremely limited not only from foreign sources, but
from domestic sources as well.
Usually, dollarization is considered to be a rational response from economic agents for the
purpose of hedging future consumption, when a country is characterized by
macroeconomic instability.
However, the years of macroeconomic stability in Georgia did not inspire the Georgian
depositors to alter their behavior and rely on their currency as primary means of saving.
The latter increases dollarization of deposits in Georgia and further deepens the Original
Sin problem. Ize Yeyati (2003) argues that a high level of dollarization of deposits is
possible during macroeconomic stabilization as well, and presents the economic model of
“hysterical behavior.”
Analysis of the reasons of scarcity of domestic currency funds or finding the ways to
surmount this limit is a cumbersome and arguable topic for further research, outside the
1 Together with the editors of the journal “Economics and Banking”, the authors would like to express
particular gratitude to Giorgi Chiladze, Giorgi Shagidze, Aleksandre Bluashvili, Nerses Yeritsyan and
research team of National Bank of Armenia, Robert Tchaidze, Erez Yerushalmi, Clive Briault, George
Arveladze and Vugar Ahmadov for their comments and insights, as well as Levan Lagvilava and Lasha
Nikolaishvili, NBG employees, for their contributions to the technical analysis of this article. 2 The term is used in Christian literature regarding the expulsion of Adam and Eve from the Garden of Eden.

scope of this article (however, the authors hope that the findings of this paper will
contribute to the ongoing efforts of Larization). This article aims to answer the following
question: given limited capacity for attracting funds in own currency, in which foreign
currency is it optimal for a country to attract funds?
Only few currencies enjoy the international status of those used for saving, settlement and
capital flow worldwide. Among them the US Dollar and the Euro are the largest.
Therefore, this article discusses the possibility of choosing the optimal currency (or mix)
between these two.
During the recent Lari nominal exchange rate fluctuations in Georgia, depreciation of the
Georgian Lari against the US Dollar significantly exceeded its depreciation against the
Euro.3 It is important to determine if this fact is accidental, or can be explained and
rationalized.
Reduction of currency fluctuations in the presence dollarization will help decrease the
riskiness of bank assets. Further, substitution of the denomination of foreign trade with a
currency which is more stable against Lari will reduce the risk component of foreign
exchange expenses. For instance, according to Cincibuch & Vávra (2001), in EU the costs
incurred due to exchange rate uncertainties are within 0.25-0.5% of GDP. In case of
Georgia, costs incurred due to exchange rate uncertainties must be even higher as many
contracts/agreements use foreign currency (e.g. real estate market).
The next chapter describes the so-called “Black Swan” event, significant risk caused by the
exchange rate. The third chapter offers the analysis risks related to the USD/GEL and
Euro/GEL exchange rates behavior. The fourth chapter conducts additional critical risk
assessment analysis, the fifth chapter discusses specific economic policy measures that can
reduce the risks caused by the dollarization of Georgian financial system. The last chapter
offers conclusive remarks.
2. Black Swan, “Tail4” Event
Risk management should be the primary function within the financial system.5
Identification and use of a relatively less risky process can bring significant economic
3 Also, during the devaluation episode of 2008-2009, the GEL devaluation against the USD exceeded the GEL
devaluation against the Euro. The maximum annual devaluation against the US Dollar was at 19.6%, while
the maximum annual devaluation against the Euro reached 16.2%. 4 The tail of the probability distribution, with high magnitude but low probability events. 5 High leverage and limited liability of financial institutions is perceived as an argument for paying relatively
less attention to the risk management by these institutions. In particular, when the leverage is high, risk-
bearing activities may seem more attractive because in case of success, the profit for the management and
benefits. Normally, investors and economic agents are focused on the expected value of a
random variable, while risk managers are interested in the identification of unexpected
events and are focused on the distribution’s tail. It must be mentioned that small-scale
fluctuations, as well as the events with midget possible damage deserve low interest in risk
management. It is important to identify the vulnerability towards so-called Black Swan
events, and to implement active measures to mitigate such risks.
The concept of the Black Swan was popularized by Nasim Taleb in his book “The Black
Swan: The Impact of the Highly Improbable.” The formal definition of the term is given
in the author’s technical manuscript, and constitutes the combination of the following
conditions: a) a highly unexpected event for a given observer, b) carries large
consequences, and c) is subjected to ex-post rationalization.
Naturally, in small, open economies the exchange rate has an important influence on
prices. When there are no deviations from the inflation target, a relatively small
depreciation is permissible. The simultaneous growth phenomenon of depreciation and
prices (wages, nominal income) already entails macroeconomic instability, which, in
itself, is a different type of risk. Further, it is important to determine the depreciation of
which exchange rate specifically we are talking about. In this sense, the most extreme
shock is when the depreciation occurs against that currency in which the country is a net
borrower, and in parallel, there is no growth in nominal income, or income generated as
the result of increased competitiveness. Therefore, in this case the Black Swan event
would be strengthening of that currency in which the debt is denominated against the
currencies of virtually all other trade partners during the foreign shock. As the result,
depreciation against one currency will not be followed by the depreciation of real
effective exchange rate.
Considering that borrowing options for Georgia are limited to those in USD or Euro, it is
important to determine which currency has higher likelihood for the occurrence of the
Black Swan event.
3. Risk Analysis
This chapter discusses different empirical data patters and economic observatios which
will be useful for comparative analysis of the volatility risks and integration of the Lari
with the US Dollar and the Euro.
the shareholders is larger than their losses in case of failure. The latter, in its turn, constitutes one of the
arguments for state regulation of the financial sector (Freixas and Rochet 2008).
3.1. Nominal Exchange Rate Fluctuations
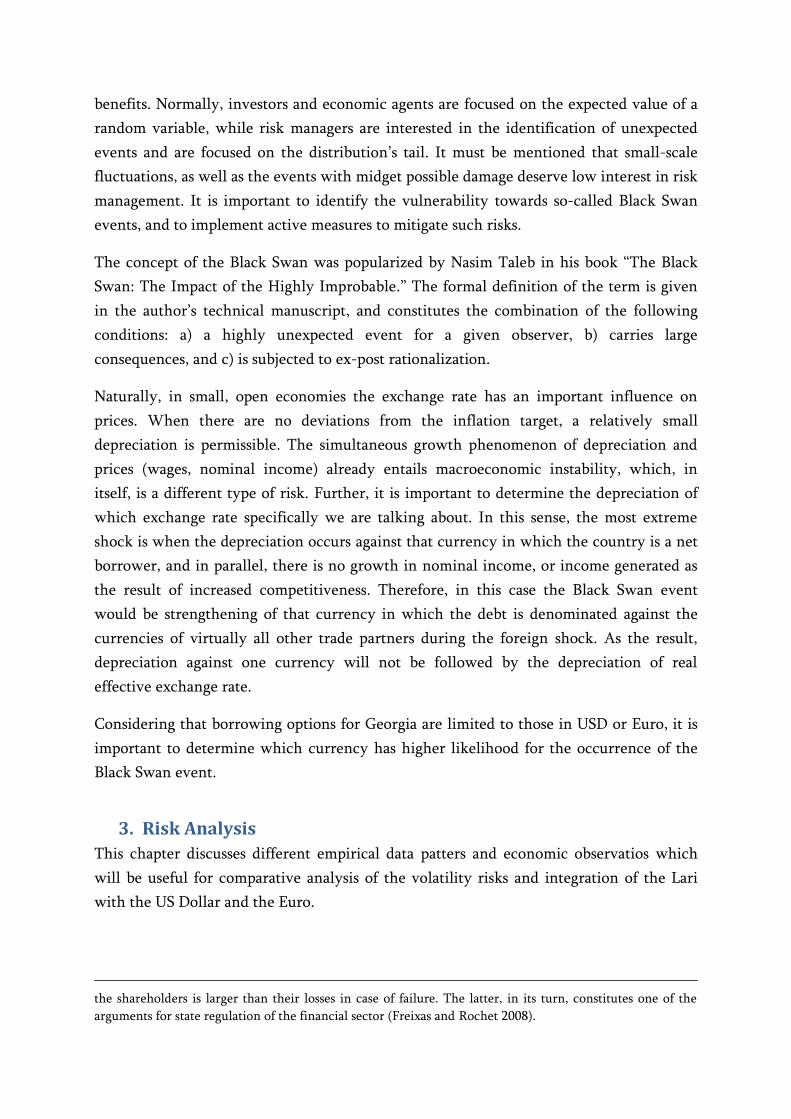
It is interesting to note that in case of the nominal exchange rate, the fluctuation of the
Dollar against the Lari is lower in the short term; however, as the change period gets
longer, the Euro becomes more stable. Here, the historical relationship is at least partially
conditioned by the fact that the USD exchange rate is assigned higher importance in the
short-term period. This makes USD borrowing more attractive compared to borrowing in
EUR, as clients with as unhedged position are normally short-sighted with less focus on
potential long-term dynamics.
Chart 1 Nominal exchange rate dynamics (data before 1999 is substituted with ECU rate
data).6
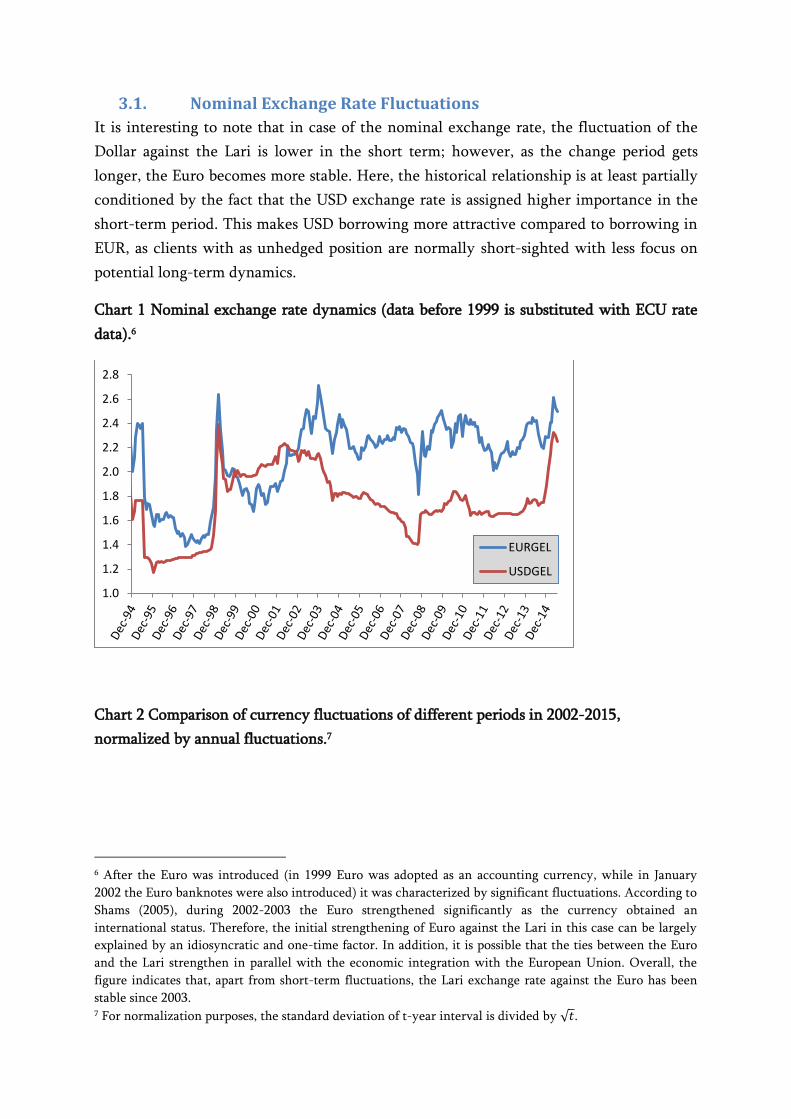
Chart 2 Comparison of currency fluctuations of different periods in 2002-2015,
normalized by annual fluctuations.7
6 After the Euro was introduced (in 1999 Euro was adopted as an accounting currency, while in January
2002 the Euro banknotes were also introduced) it was characterized by significant fluctuations. According to
Shams (2005), during 2002-2003 the Euro strengthened significantly as the currency obtained an
international status. Therefore, the initial strengthening of Euro against the Lari in this case can be largely
explained by an idiosyncratic and one-time factor. In addition, it is possible that the ties between the Euro
and the Lari strengthen in parallel with the economic integration with the European Union. Overall, the
figure indicates that, apart from short-term fluctuations, the Lari exchange rate against the Euro has been
stable since 2003. 7 For normalization purposes, the standard deviation of t-year interval is divided by √𝑡.
1.0
1.2
1.4
1.6
1.8
2.0
2.2
2.4
2.6
2.8
EURGEL
USDGEL
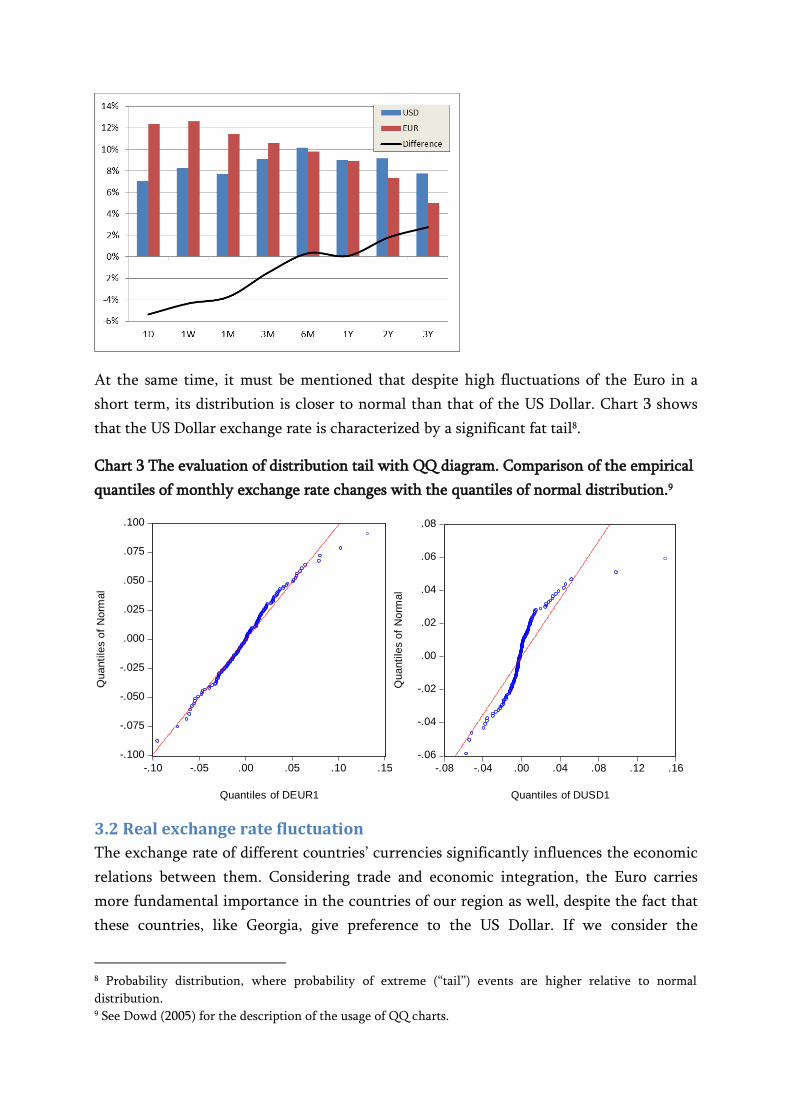
At the same time, it must be mentioned that despite high fluctuations of the Euro in a
short term, its distribution is closer to normal than that of the US Dollar. Chart 3 shows
that the US Dollar exchange rate is characterized by a significant fat tail8.
Chart 3 The evaluation of distribution tail with QQ diagram. Comparison of the empirical
quantiles of monthly exchange rate changes with the quantiles of normal distribution.9
3.2 Real exchange rate fluctuation
The exchange rate of different countries’ currencies significantly influences the economic
relations between them. Considering trade and economic integration, the Euro carries
more fundamental importance in the countries of our region as well, despite the fact that
these countries, like Georgia, give preference to the US Dollar. If we consider the
8 Probability distribution, where probability of extreme (“tail”) events are higher relative to normal
distribution. 9 See Dowd (2005) for the description of the usage of QQ charts.
-.100
-.075
-.050
-.025
.000
.025
.050
.075
.100
-.10 -.05 .00 .05 .10 .15
Quantiles of DEUR1
Qu
an
tile
s o
f N
orm
al
-.06
-.04
-.02
.00
.02
.04
.06
.08
-.08 -.04 .00 .04 .08 .12 .16
Quantiles of DUSD1
Qu
an
tile
s o
f N
orm
al
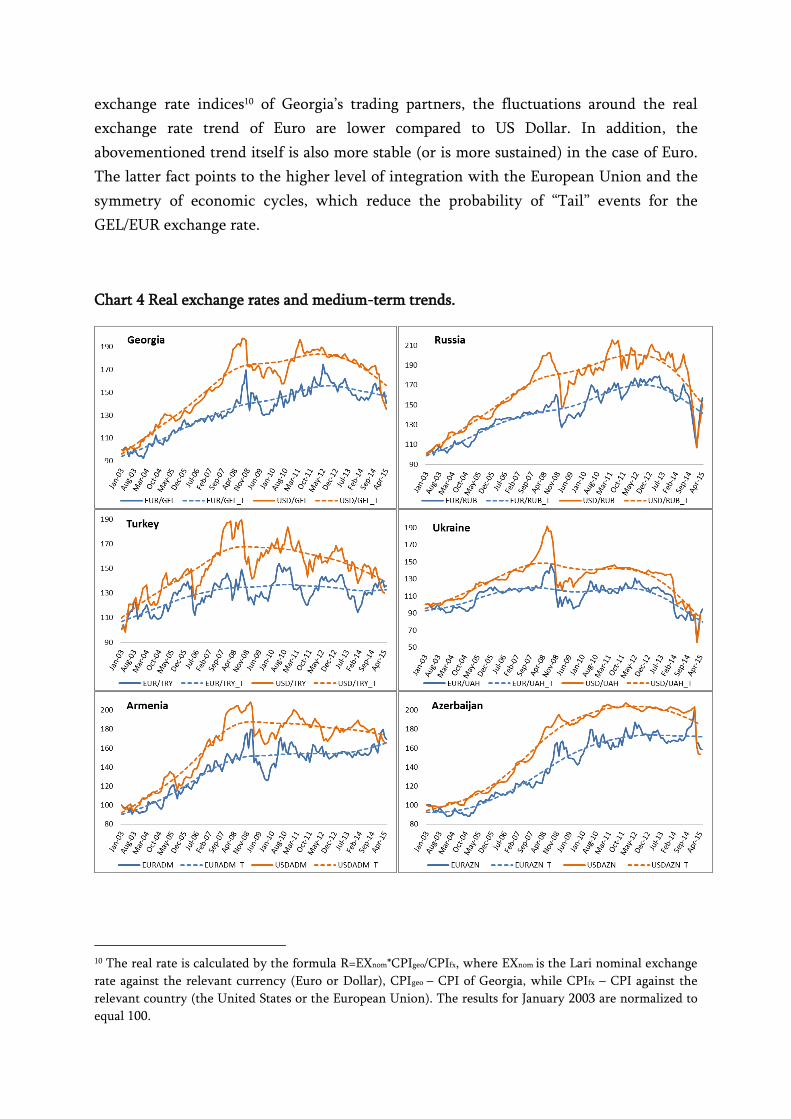
exchange rate indices10 of Georgia’s trading partners, the fluctuations around the real
exchange rate trend of Euro are lower compared to US Dollar. In addition, the
abovementioned trend itself is also more stable (or is more sustained) in the case of Euro.
The latter fact points to the higher level of integration with the European Union and the
symmetry of economic cycles, which reduce the probability of “Tail” events for the
GEL/EUR exchange rate.
Chart 4 Real exchange rates and medium-term trends.
10 The real rate is calculated by the formula R=EXnom*CPIgeo/CPIfx, where EXnom is the Lari nominal exchange
rate against the relevant currency (Euro or Dollar), CPIgeo – CPI of Georgia, while CPIfx – CPI against the
relevant country (the United States or the European Union). The results for January 2003 are normalized to
equal 100.
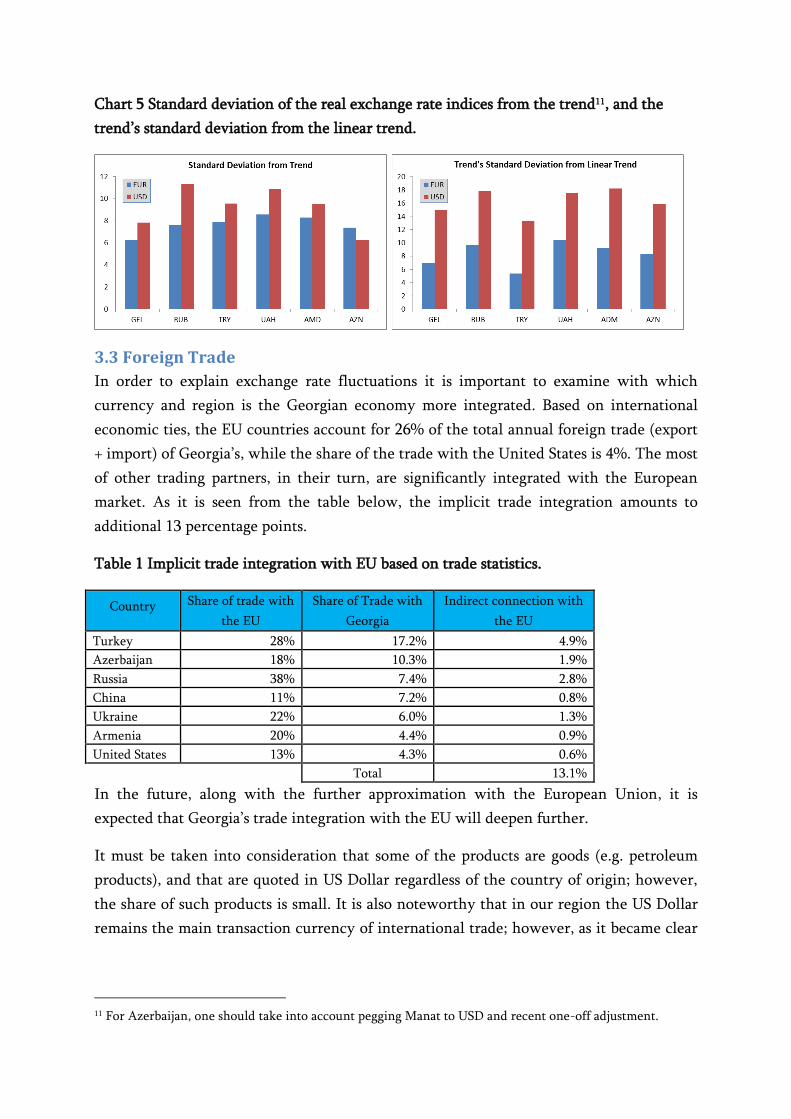
Chart 5 Standard deviation of the real exchange rate indices from the trend11, and the
trend’s standard deviation from the linear trend.
3.3 Foreign Trade
In order to explain exchange rate fluctuations it is important to examine with which
currency and region is the Georgian economy more integrated. Based on international
economic ties, the EU countries account for 26% of the total annual foreign trade (export
+ import) of Georgia’s, while the share of the trade with the United States is 4%. The most
of other trading partners, in their turn, are significantly integrated with the European
market. As it is seen from the table below, the implicit trade integration amounts to
additional 13 percentage points.
Table 1 Implicit trade integration with EU based on trade statistics.
Country Share of trade with
the EU
Share of Trade with
Georgia
Indirect connection with
the EU
Turkey 28% 17.2% 4.9%
Azerbaijan 18% 10.3% 1.9%
Russia 38% 7.4% 2.8%
China 11% 7.2% 0.8%
Ukraine 22% 6.0% 1.3%
Armenia 20% 4.4% 0.9%
United States 13% 4.3% 0.6%
Total 13.1%
In the future, along with the further approximation with the European Union, it is
expected that Georgia’s trade integration with the EU will deepen further.
It must be taken into consideration that some of the products are goods (e.g. petroleum
products), and that are quoted in US Dollar regardless of the country of origin; however,
the share of such products is small. It is also noteworthy that in our region the US Dollar
remains the main transaction currency of international trade; however, as it became clear
11 For Azerbaijan, one should take into account pegging Manat to USD and recent one-off adjustment.
during the current depreciation episode, the underlying pricing is not anchored in US
Dollar12 and its rate does not have a significant impact on foreign trade.
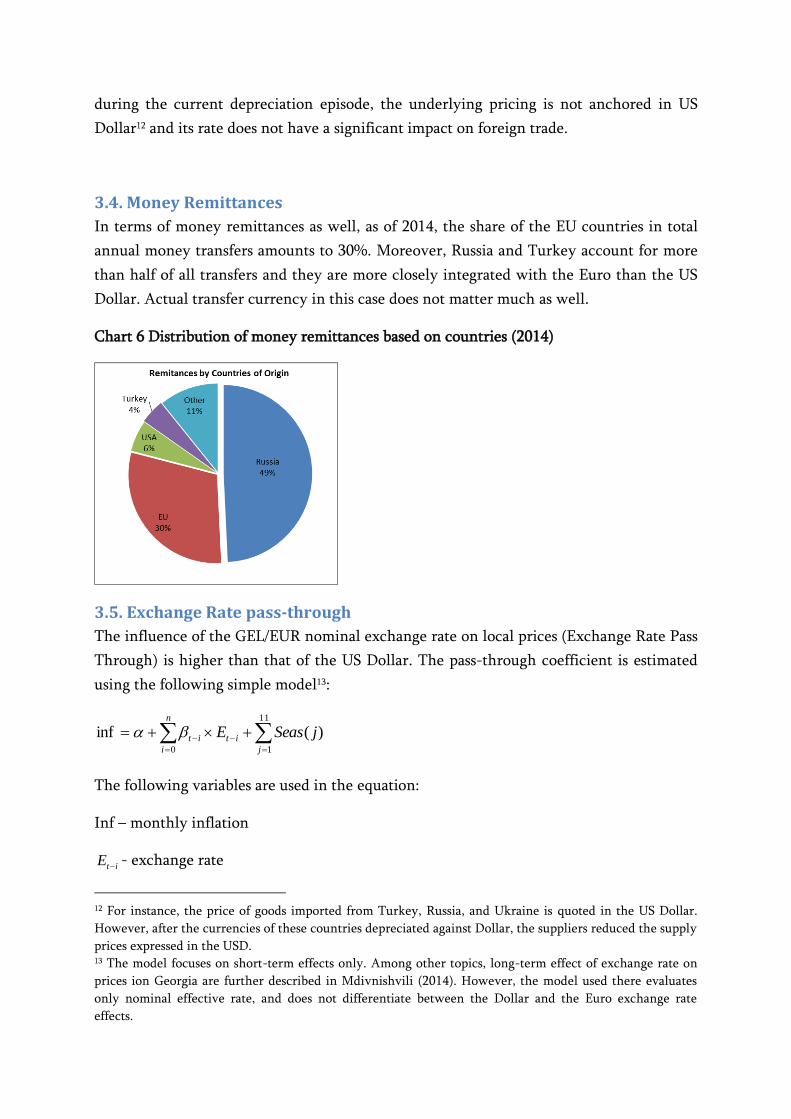
3.4. Money Remittances
In terms of money remittances as well, as of 2014, the share of the EU countries in total
annual money transfers amounts to 30%. Moreover, Russia and Turkey account for more
than half of all transfers and they are more closely integrated with the Euro than the US
Dollar. Actual transfer currency in this case does not matter much as well.
Chart 6 Distribution of money remittances based on countries (2014)
3.5. Exchange Rate pass-through
The influence of the GEL/EUR nominal exchange rate on local prices (Exchange Rate Pass
Through) is higher than that of the US Dollar. The pass-through coefficient is estimated
using the following simple model13:
11
10
)(infj
n
i
itit jSeasE
The following variables are used in the equation:
Inf – monthly inflation
itE - exchange rate
12 For instance, the price of goods imported from Turkey, Russia, and Ukraine is quoted in the US Dollar.
However, after the currencies of these countries depreciated against Dollar, the suppliers reduced the supply
prices expressed in the USD. 13 The model focuses on short-term effects only. Among other topics, long-term effect of exchange rate on
prices ion Georgia are further described in Mdivnishvili (2014). However, the model used there evaluates
only nominal effective rate, and does not differentiate between the Dollar and the Euro exchange rate
effects.
)( jSeas - seasonality indicator
Estimation has been conducted using simple OLS method. Coefficient shows by how
many percent will the inflation grow if the exchange rate devalues by 1%. The impact of
Dollar and Euro exchange rate on the level of prices in Georgia are evaluated separately.
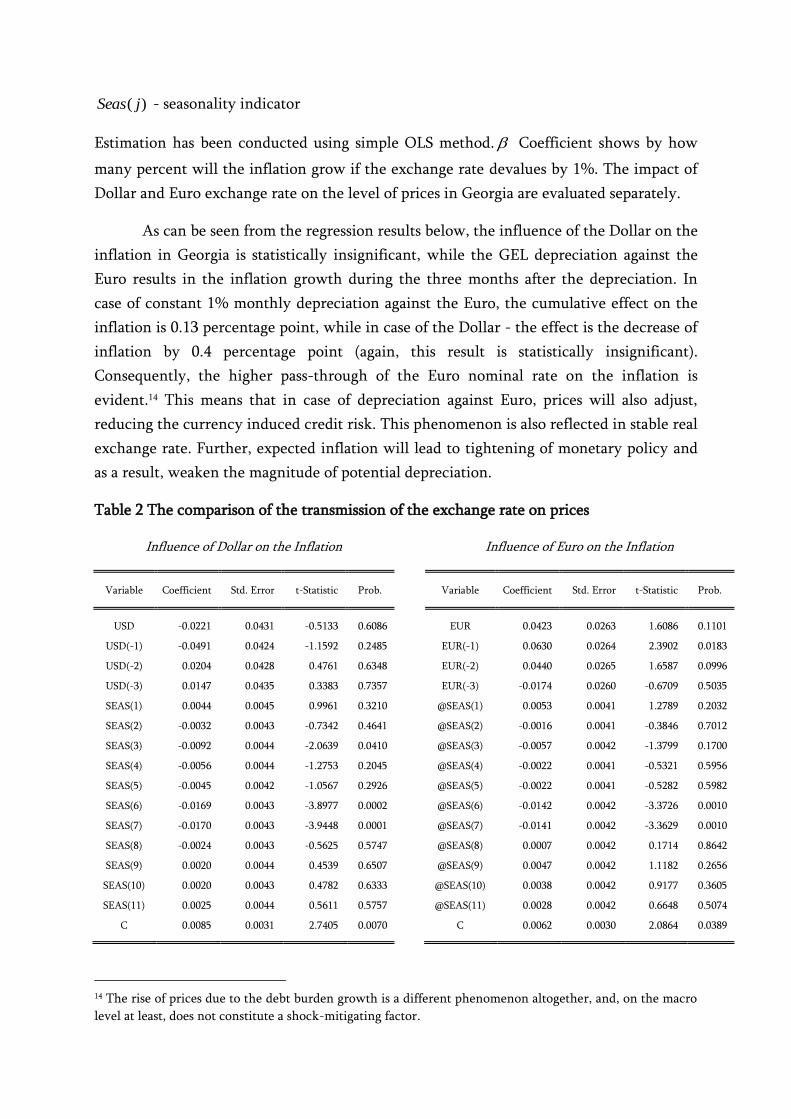
As can be seen from the regression results below, the influence of the Dollar on the
inflation in Georgia is statistically insignificant, while the GEL depreciation against the
Euro results in the inflation growth during the three months after the depreciation. In
case of constant 1% monthly depreciation against the Euro, the cumulative effect on the
inflation is 0.13 percentage point, while in case of the Dollar - the effect is the decrease of
inflation by 0.4 percentage point (again, this result is statistically insignificant).
Consequently, the higher pass-through of the Euro nominal rate on the inflation is
evident.14 This means that in case of depreciation against Euro, prices will also adjust,
reducing the currency induced credit risk. This phenomenon is also reflected in stable real
exchange rate. Further, expected inflation will lead to tightening of monetary policy and
as a result, weaken the magnitude of potential depreciation.
Table 2 The comparison of the transmission of the exchange rate on prices
Influence of Dollar on the Inflation
Influence of Euro on the Inflation
Variable Coefficient Std. Error t-Statistic Prob.
Variable Coefficient Std. Error t-Statistic Prob.
USD -0.0221 0.0431 -0.5133 0.6086
EUR 0.0423 0.0263 1.6086 0.1101
USD(-1) -0.0491 0.0424 -1.1592 0.2485
EUR(-1) 0.0630 0.0264 2.3902 0.0183
USD(-2) 0.0204 0.0428 0.4761 0.6348
EUR(-2) 0.0440 0.0265 1.6587 0.0996
USD(-3) 0.0147 0.0435 0.3383 0.7357
EUR(-3) -0.0174 0.0260 -0.6709 0.5035
SEAS(1) 0.0044 0.0045 0.9961 0.3210
@SEAS(1) 0.0053 0.0041 1.2789 0.2032
SEAS(2) -0.0032 0.0043 -0.7342 0.4641
@SEAS(2) -0.0016 0.0041 -0.3846 0.7012
SEAS(3) -0.0092 0.0044 -2.0639 0.0410
@SEAS(3) -0.0057 0.0042 -1.3799 0.1700
SEAS(4) -0.0056 0.0044 -1.2753 0.2045
@SEAS(4) -0.0022 0.0041 -0.5321 0.5956
SEAS(5) -0.0045 0.0042 -1.0567 0.2926
@SEAS(5) -0.0022 0.0041 -0.5282 0.5982
SEAS(6) -0.0169 0.0043 -3.8977 0.0002
@SEAS(6) -0.0142 0.0042 -3.3726 0.0010
SEAS(7) -0.0170 0.0043 -3.9448 0.0001
@SEAS(7) -0.0141 0.0042 -3.3629 0.0010
SEAS(8) -0.0024 0.0043 -0.5625 0.5747
@SEAS(8) 0.0007 0.0042 0.1714 0.8642
SEAS(9) 0.0020 0.0044 0.4539 0.6507
@SEAS(9) 0.0047 0.0042 1.1182 0.2656
SEAS(10) 0.0020 0.0043 0.4782 0.6333
@SEAS(10) 0.0038 0.0042 0.9177 0.3605
SEAS(11) 0.0025 0.0044 0.5611 0.5757
@SEAS(11) 0.0028 0.0042 0.6648 0.5074
C 0.0085 0.0031 2.7405 0.0070
C 0.0062 0.0030 2.0864 0.0389
14 The rise of prices due to the debt burden growth is a different phenomenon altogether, and, on the macro
level at least, does not constitute a shock-mitigating factor.
3.6. Optimum Currency Area
When analyzing the common currency zone, the Optimum Currency Area (OCA) index15
is often used. The index is based on Robert Mandell’s theory (1961) and has been
developed by Bayoumi and Eichengreen (1996). It is noteworthy that the index is a
approximation for testing Mandell’s hypothesis, and its calculation is based on certain
restrictive assumptions. Nevertheless, this index is most widely used in the Eurozone
candidate counties in order to assess their readiness for entering the currency union (e.g.
Cincibuch & Vávra 2001, and Komárek, Čech, Horváth 2003). This index constitutes an
effort to evaluate how integrated the economies are in order to reduce the probability and
impact of asymmetric shocks. If there is high asymmetry, then these countries experience
different shocks and/or the same shocks have different influences on them. Therefore,
these countries require different types of monetary policy and their integration within the
same currency is not optimal. According to the Optimum Currency Area theory, for
economies with more symmetrical business cycles, the movements of their currencies are
also synchronized. Therefore, this theory and the currency area index with minor
modifications can be used to determine against which currency the Lari is likely to
experience lower fluctuations.
The following economic indicators are used to calculate the index: the correlation
between economic cycles, the composition of foreign trade, foreign trade orientation, and
the size of the economies.
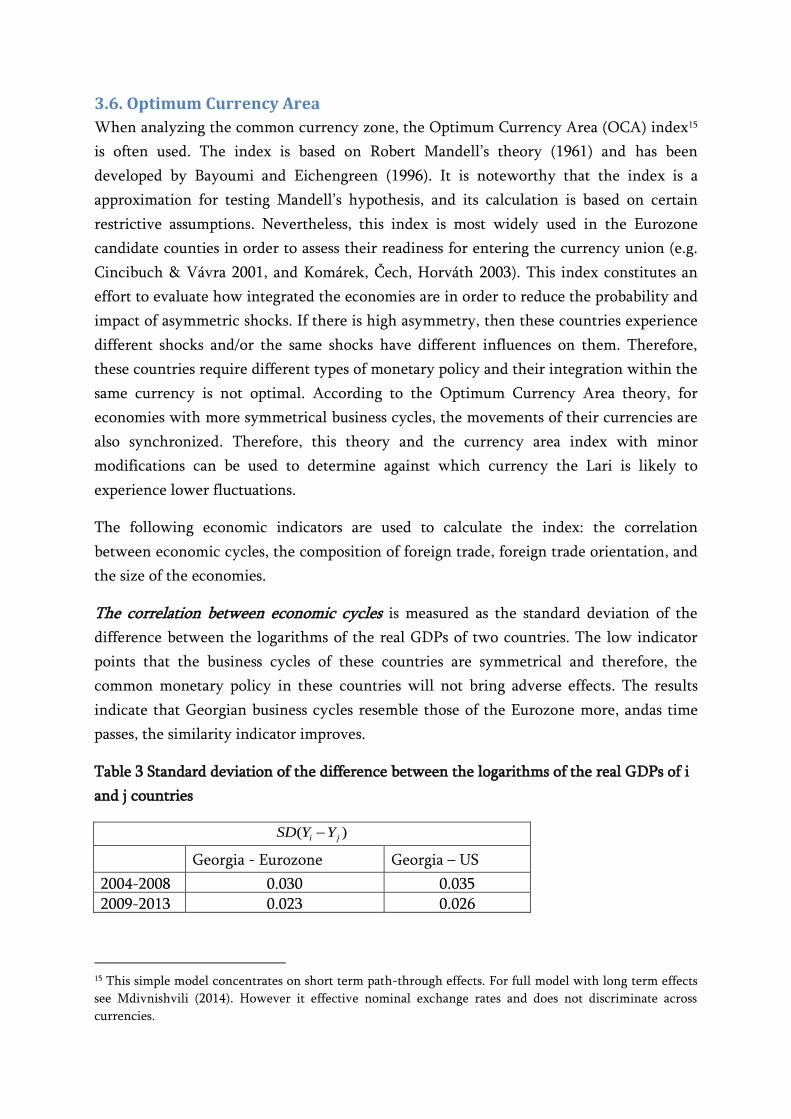
The correlation between economic cycles is measured as the standard deviation of the
difference between the logarithms of the real GDPs of two countries. The low indicator
points that the business cycles of these countries are symmetrical and therefore, the
common monetary policy in these countries will not bring adverse effects. The results
indicate that Georgian business cycles resemble those of the Eurozone more, andas time
passes, the similarity indicator improves.
Table 3 Standard deviation of the difference between the logarithms of the real GDPs of i
and j countries
)( ji YYSD
Georgia - Eurozone Georgia – US
2004-2008 0.030 0.035 2009-2013 0.023 0.026
15 This simple model concentrates on short term path-through effects. For full model with long term effects
see Mdivnishvili (2014). However it effective nominal exchange rates and does not discriminate across
currencies.

The composition of foreign trade is the indicator which measures the structural
differences between the countries. If the trade between countries takes place between
industries, then the shocks have different effects on these countries. Further, if the trade
takes place within the industries, then the countries are structurally similar and shocks
will have similar impact on their economies. This indicator is calculated as an absolute
difference between the shares of different sectors in the countries’ foreign trade. The low
indicator points to the similarity in the trade structure. The results indicate that the
Georgian foreign trade structure resembles that of the Eurozone more, and, with the
passing of time, the similarity indicator improves.
Table 4 The differences between the shares of agriculture products, minerals and
industrial goods in the exports of i and j countriesijDISSIM .
ijDISSIM
Georgia - Eurozone Georgia - US
2004-2008 0.515 0.624 2009-2013 0.348 0.418
Foreign trade orientation the asymmetric foreign trade orientation of countries is the
main source of different shocks influencing these counties. Within the Eurozone, the
examples of such asymmetric trade orientation are the strong trade connections between
Ireland and Great Britain, Finland and East Asia, Portugal and Brazil. In the best cases, the
countries of the optimum currency area trade only among themselves. The growth of the
trade connections between countries points to the structural compatibility between them.
This indicator can be measured as the ratio of bilateral trade to GDP, where high indicator
points to more integration. The obtained results indicate that the Georgian foreign trade
orientation towards the Eurozone is higher and with the passing of time, this indicator
increases.
Table 5. Average ijTRADE of the ratio of i and j countries’ bilateral exports to total GDP
ijTRADE
Georgia - Eurozone Georgia - US
2004-2008 0.006 0.002 2009-2013 0.012 0.004
Size of the countries. The open currency area index also takes into account countries’ size.
The smaller the country, the smaller the benefit obtained from the free floating of the
national currency. On the other hand, the larger the country – the more expenses are

related to its adoption of the common currency. The average of the logarithms of the
GDPs of the counties is used as a size indicator, and low indicator points to more benefit
from common currency. The results indicate that the size indicator is better with regards
to Eurozone.
Table 6. Average ijSIZE of logarithms of i and j countries’ GDPs
ijSIZE
Georgia - Eurozone Georgia - US
2004-2008 6.05 6.07 2009-2013 6.13 6.25
Calculation of the Currency Area Index. In order to calculate the currency area index,
Bayoumi and Eichengreen (1996) estimated the following equation:
ijijijjiij SIZETRADEDISSIMYYSDeSD 012.0054.022.0)(46.1009.0)( ,
Where )( ijeSD is the standard deviation of the nominal exchange rate of i and j countries.
When evaluating this equation, the following economic assumption is used: higher the
economic integration between countries, the smaller should be the bilateral fluctuation of
their currencies.
Low index points to high integration. In case of Georgia, the currency area index is lower
for Eurozone, and, with the passing of time, the indicator improves. Therefore, based on
the Optimum currency Area theory, we can conclude that more integration is optimal
with the Euro, rather than the US Dollar.
Table 7 Optimum Currency Area Index
ijOCA
Georgia - Eurozone Georgia - US
2004-2008 0.038 0.047 2009-2013 0.025 0.032
It must be noted that the integration indicator is improving not only vis-à-vis Eurozone,
but the United States as well, and this indicates Georgia’s overall growing integration into
the world economy.
It is evident from the empirical analysis that the GEL is characterized by more integration
and stability via-a-vis the Euro. The application of different methods allows us to
conclude that the results are stable against different specificities and are in line with
general theoretical economic analysis.
3.7 Global Reserve currency Argument
It is noteworthy that the US Dollar enjoys the status of a global hedge (Prasad 2014,
Economist 2014) even considering that the US Dollar does not display the tendency of
strengthening in a long-term period. As the Dollar is considered to be a safe currency, it
appreciates during the global crisis, and vice versa. The latter, considering high
dollarization levels of Georgian financial sector, further enhances the procyclicality of the
system. During the global recession, when foreign demand is reduced, the Dollar
strengthens and the domestic demand decreases (due to the dollarization of loans), which
further reduces economic activity. By contrast, during the rapid growth of the global
GDP, the US Dollar gets depreciated, which further strengthens local demand in Georgia,
resulting in the overheating of the domestic economy and further overvaluation of the
exchange rate. Therefore, even if the fluctuations of the US Dollar and the Euro were
equal, such distribution of fluctuations in time renders the usage of the Euro in Georgia
even more attractive.
3.8 Diversification Argument
Even if we assume that the fluctuations of the Lari against the US Dollar and the Euro are
identical, based only on the argument that the correlation between them is less than one16,
it is more efficient to partially substitute the Dollar with the Euro in the Georgian
financial system. Considering that banks do not experience difficulties attracting resources
in Euro from institutional investors, only through diversification, by way of decreasing
the probability of extreme shocks, it is possible to reduce currency risks without any costs.
In this regard, what should be optimal Euro/Dollar structure in the local financial system
is an interesting question for discussion. We can use variance minimization method as a
simple illustration of the idea.
In the optimal portfolio, the shares of the Dollar and the Euro loans are chosen so that the
variation of portfolio value is at minimum. Let’s assume that in a portfolio the value of
which is 1 GEL, the share of the Dollar loans is w, while the share of the Euro loans is 1-
w. The value of the total portfolio in t period would be:
EUR
tEUR
USD
tUSDt EE
wE
E
wV
00
1,
16 Because of which, the likelihood of the “Black Swan”, that is, the likelihood that the Lari will depreciate
against both currencies without the depreciation of the real effective exchange rate, is even lower.
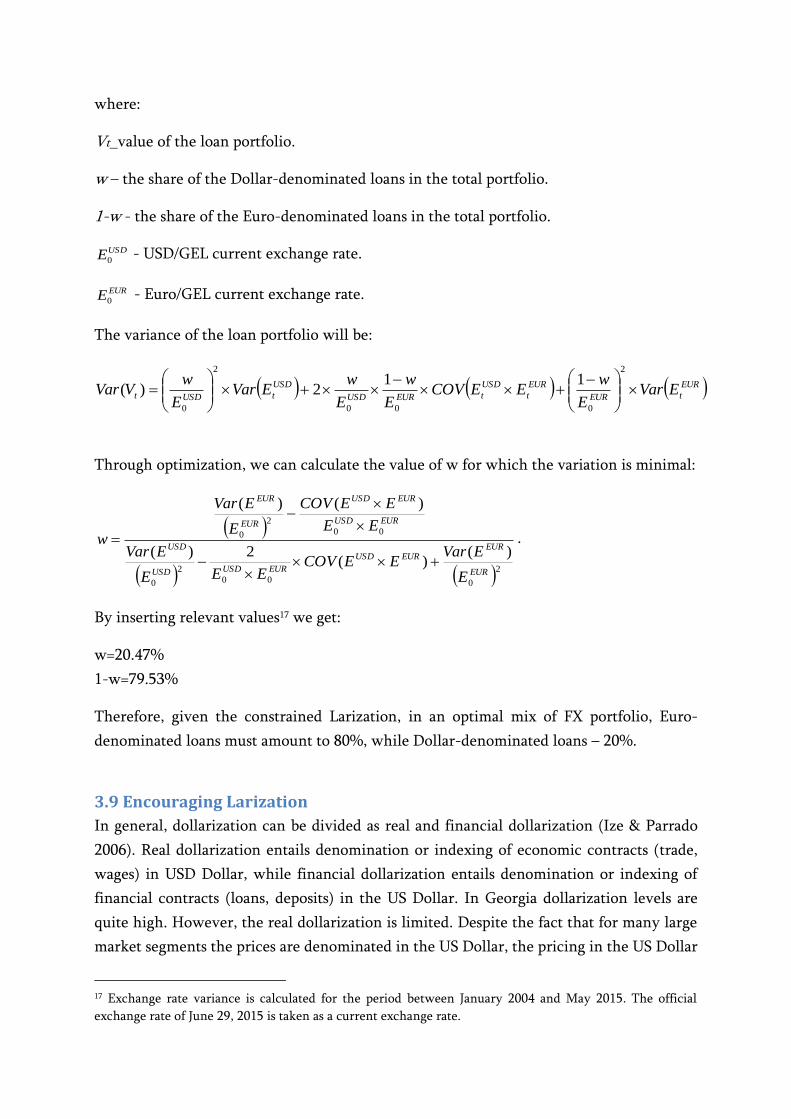
where:
Vt_value of the loan portfolio.
w – the share of the Dollar-denominated loans in the total portfolio.
1-w - the share of the Euro-denominated loans in the total portfolio.
USDE0 - USD/GEL current exchange rate.
EURE0 - Euro/GEL current exchange rate.
The variance of the loan portfolio will be:
EUR
tEUR
EUR
t
USD
tEURUSD
USD
tUSDt EVarE
wEECOV
E
w
E
wEVar
E
wVVar
2
000
2
0
112)(
Through optimization, we can calculate the value of w for which the variation is minimal:
2000
2
0
00
2
0
)()(
2)(
)()(
EUR
EUREURUSD
EURUSDUSD
USD
EURUSD
EURUSD
EUR
EUR
E
EVarEECOV
EEE
EVar
EE
EECOV
E
EVar
w
.
By inserting relevant values17 we get:
w=20.47%
1-w=79.53%
Therefore, given the constrained Larization, in an optimal mix of FX portfolio, Euro-
denominated loans must amount to 80%, while Dollar-denominated loans – 20%.
3.9 Encouraging Larization
In general, dollarization can be divided as real and financial dollarization (Ize & Parrado
2006). Real dollarization entails denomination or indexing of economic contracts (trade,
wages) in USD Dollar, while financial dollarization entails denomination or indexing of
financial contracts (loans, deposits) in the US Dollar. In Georgia dollarization levels are
quite high. However, the real dollarization is limited. Despite the fact that for many large
market segments the prices are denominated in the US Dollar, the pricing in the US Dollar
17 Exchange rate variance is calculated for the period between January 2004 and May 2015. The official
exchange rate of June 29, 2015 is taken as a current exchange rate.
in these segments is questionable. The Dollar measure is used as the value in medium and
long-term period, - expressed as US Dollar denomination of durable goods and assets,
while the real economy and assets are not actually denominated in this currency. For
instance, the assumption that real estate or the real estate rentals are USD-denominated is
fundamentally wrong. The reduction of income of a country in terms of USD must also
necessarily cause the drop of long-term asset prices expressed in the USD. It is clear that
the role of the US Dollar is more of a stereotype, than a pricing based on fundamental
factors. In this sense, it is at least possible that encouraging the Euro will play an
important role in the weakening of this stereotype. For instance, it is possible to prohibit
quoting real estate in the US Dollar and permit it only in Euro and Lari.18 The latter would
be a more balanced approach than permitting such operations in Lari only and this
approach may serve as a “bridge” for the complete eradication of dollarization. In addition,
when unlimited alternatives exist, it is possible to use other administrative leverages more
confidently, for example, prohibit issuing loans in the US Dollar at least in cases of small
retail loans. Therefore, despite the fact that discussing a comprehensive Larization strategy
does not constitute the objective of this article, we believe that fostering the Euro will be
important step in this process, along with such activities as inflation indexation19 and
hedging FX risk20, cost measures, anchoring currency appreciation expectations21,
administrative measures and more (Nadaraia 2009a, Nadaraia 2009b, Nadaraia 2011,
Kakulia & Aslamazishvili, 2000).
18 One of the reasons for deposit dollarization is that the borrowers save in the US Dollar for the initial
installment of their loans. 19 Inflation indexation entails periodic correction of payments in financial contracts (e.g. coupons and
nominal value) based on price level changes, e.g. CPI changes. The first step can be issuance of inflation
indexed government securities. This approach will improve transparency when establishing price levels and
the incentives for inflation control will be created from the fiscal perspective as well. In total, the trust
towards Lari will increase. The indexation of financial products with inflation is used in many countries and
it mainly extends to government securities. However, an interesting example is Israel, where the prices of
banking products, among others, are also attached to the index (Pricel 1997). 20 In the insurance of FX risk, in addition to developing the FX risk insurance market, the long-term FX risk
insurance by the government in exchange for the price paid by the borrower is also factored in. Naturally,
in comparison with inflation indexation, this is more simple, yet more debatable method. It is difficult to
definitively establish the fair price of insurance and prove that the risk from the private sector does not
transfer to the public sector at least to a certain extent. 21 Under sufficiently low inflation environment, real exchange rate appreciation via nominal exchange rate,
among others.
4. What Happened before, will not necessarily be repeated, or how
predictable is the exchange rate?22
“In theory, there is no difference between theory and practice. But, in practice,
there is”
Yogi Berra & others23
Despite the conclusions obtained from the analysis of the previous chapter,
considering the risk management principles, it is important to approach these conclusions
with certain degree of skepticism. Statistical inference about properties of unobserved
underlying process generators may entail errors. The latter is particularly important in
case of such complicated chaotic dynamic systems24, as the financial system. As the result,
it is important to apply sound risk management principles when changing economic
policy so that, considering the limitations of the risk assessment, the vulnerability towards
the Black Swan events does not increase at the expense of the reduction of measurable
minor risks.
The analysis above largely relied on historical dynamics. A statistical significance of
the relationship is important for inferring that similar relationship will continue in the
future too; however, naturally, we must not exclude a possibility that the Lari may
significantly depreciate against the Euro, especially in the short-term period. For instance,
in Poland, which is more integrated with the Euro, in 2008 the depreciation reached 50%
during the peak of overshooting and then, stabilized at around 25% (however, it should
also be mentioned that during the same period, the exchange rate of Zloty against the
USD depreciated by about 90% and then stabilized at around 40%).
Generally, the question of forecasting the exchange rate is widely discussed in
scientific economic literature. Based on the existing consensus, while fundamental factors
determine the exchange rate in the long-term, its short-term movements are un-
22 The data related risk is one of the types of model risk (Dowd 2005). Such risks and model’s reliance on
historical performance is often subject of disclosure requirements, for example by US Securities Commission
(Arnot, etc. 2008). Also, the principle of risk disclosure is mentioned in different codes of professional
ethics. For instance, a Financial Risk Manager (FRM) “Shall be diligent about not overstating the accuracy or
certainty of results or conclusions” (Article 4.4 of the Code of Conduct of Global Association of Risk
Professionals, GARP 2010). 23 https://en.wikiquote.org/wiki/Jan_L._A._van_de_Snepscheut 24 Chaos here is a mathematical term describing a situation during which minor deviations from the initial
conditions deliver radically different results.
predictable. This approach is supported by empirical research, as well as by the Efficient
Market Theory25.
The empirical research starts with the work of Meese and Rogorff (1983), which
states that a random walk process better assesses the fluctuations in the exchange rate
than fundamental economic models. The random walk process entails that the difference
between each two consecutive observations follows independent identical distribution,
the expected value of which is 0, while the variation is any finite number. In their
research, Meese and Rogoff examine the empirical data and predict each new value based
on its previous value; the authors then compare the obtained results with the realized
results. Based on the analysis of the results of several fundamental economic models and
random walk model, the researchers concluded that the economic models are useless for
short-term exchange rate forecasting, as they do not display more reliability than the
random walk approach.
It is noteworthy that in the short run the influence of fundamental factors on the
dynamics of the exchange rate is rather low, and it is mostly determined by expectations.
Because of this, the exchange rate is characterized by high fluctuations and, in certain
cases, the changes may reach irrational and extreme values. In this sense, the speculative
expectations of currency traders are particularly important, as they are formed by the
preliminary assessment of fundamental factor tendencies (so-called “Fundamentalists”),
and/or by the forecasting and chart analysis of the behavioral tendencies of the other
market players (technical analysts or so-called “Chartists”). To illustrate, it is notable that
in early 1980s, due to capital inflows caused by high interest rates in the United States, the
US Dollar exchange rate started strengthening against other currencies. However, by
1984, it deviated from the long-term trend so much that the economists could not explain
this tendency with fundamental factors anymore. The Dollar exchange rate continued
strengthening in 1985 as well, and as the researchers argue (Frankel et al., 1990; Frankel &
Kenneth, 1990), this was caused by speculative expectations, in which technical analysis
played a bigger role than fundamental factors. Finally, in order to restore the currency
balance, the active intervention by G5 member countries’ governments became necessary.
This is a good example of the so-called “herd behavior” and market inefficiency.
25 According to the Efficient-market hypothesis (Fama, 1970), all information that determines expectations
and therefore, supply and demand for the currency, is already reflected in its price, while the information
that can change existing expectations is accidental, and has an equal chance of changing the exchange rate
in both directions. The theory is based on the main assumption that all existing information is already
reflected in price.
5. Recommended Actions
The abovementioned findings must be noteworthy for public, as well as private
sectors, including banks. The growth of Euro’s share in the structure of assets and
liabilities of the bank can be an important factor to increase resilience and obtain
competitive advantage via risk management.
In this process, the proactive economic policy can support the private sector through
following activities:
Currency induced credit risk weighing and stress tests in pillar II
It is important to discuss how the results of the analysis can be factored in the supervisory
policy. These findings should impact the existing approaches to foreign currency lending
in the first place. For instance, the additional weighing for credit risk caused by currency
fluctuations may be halved for the Euro26 compared to the US Dollar. In addition, within
the framework of the supervisory stress tests and Pillar II, Lari depreciation scenarios can
be lower against Euro compared to US Dollar, leading to preferential leading standards in
Euro. At the same time, it is important that this approach must not be used for significant
reduction of capital adequacy but for its more risk sensitive allocation27.
Encouraging liquidity and funding
In order to encourage the financing in the Euro, it is possible to reduce liquidity
requirements within existing supervisory requirements, as well as within the planed Basel
III coefficients ((LCR&NSFR). Further, the similar principles may be considered in the
minimum reserve requirements and other macroprudential instruments.
26 To illustrate, let’s assume that the average duration of the foreign currency portfolio is 3 years. Therefore,
if we take the 99th percentile of the 3-year change of the Lari exchange rate in 2004-2015 (Value-at-Risk), it
will equal 19% for the Euro and 41% for the Dollar. Therefore, can roughly estimate that for the current
portfolio, the Dollar is twice as risky, and if the currency induced credit risk weight for the Dollar is 100%,
for the Euro it may be 46%. Further, the additional argument is the nonlinear impact of the depreciation on
asset quality, which renders the Euro even more attractive. At the same time, it must be taken into account
that the capital must not be reduced too much as the currency induced credit risk in the Euro will always
remain until low Larization is an issue. 27 In general, capital requirements are based on many complex factors. In addition to the efficiency resulting
from the growth of the leverage due to the reduction of capital, the impact on the bank’s credit rating and
an indirect effect on the cost of attracted funds must also be taken into consideration (Lezhava, 2013). It is
also important to determine the difference between the return on capital and, for instance, long-term Lari
deposit value in terms of the cost efficiency. In addition, the liquidity cost and the sophistication of risk
management in terms of historic cost of risk and proactive projection of credit losses, including, in cases of
stress scenarios must also be taken into consideration.
To illustrate, for example reduction of additional risk weights on FX loans from 100% to 50% will decrease
the FX lending rates on average by 0.5 percentage points only (smaller impact in percentage points for
business loans), assuming same required return on equity and no increase in cost of funds due to higher
leverage.
Financial Education and Risk disclosure
It is important to take relevant measures in terms of financial education and consumer
protection. For instance, establish different currency devaluation scenarios in the risk
disclosure requirements.
FX Policy
Currency market operations may be shifted more to the Euro. For instance, currency
interventions, which currently are conducted in USD only, can be carried out in the Euro
as well by NBG. That will also help to reduce the short-term volatility of GEL/EUR
compared to GEL/USD.
In addition, it is possible to use a currency basket for public orientation and declare it a
short-term/medium-term guide.
External funding
When the government borrows from IFIs or via Eurobonds, it is important to shift
composition of debt towards the Euro. The same concerns large corporations that borrow
from abroad.
Multi-currency lending
For the exporters and the receivers of transfers it will be optimal to obtain loans in that
currency in which their income is denominated. In addition, if a company exports to
several countries, it would be optimal for that company to proportionally diversify its
loans into relevant currencies.28 This will be especially important if the Georgian economy
undergoes structural transformation and becomes export-oriented (Nadaraia et al. 2013).
Administrative measures29
In parallel to analyzing the effectiveness of these instruments, more radical activities may
also be discussed, such as partial prohibition of loans in USD, which will be more
attainable if the Euro alternative exists; also, for example, banning quotation of real estate
prices in USD and allow only GEL or EUR.
Insurance of EUR/USD exchange rate risk
28 Naturally, the following issues must be taken into consideration: high interest rates in certain currencies,
instability of margins in the Lari equivalent terms, and the capacity for relatively more complex
management of assets and liabilities. 29 The effectiveness of the use of administrative measures is considered rather questionable by the private
sector, as it may create certain imbalance in the currency composition of the funds attracted and disbursed
by the banks, or, in the short-term period, reduce the effectiveness of the financial sector, limit access to
finance, or even promote the creation of the informal market. However, it must also be taken into
consideration that when a market pays limited attention to the “Black Swan” events, the administrative
measures, taking into account the need for right balance between financial stability and access to finance,
may become unavoidable. It is noteworthy that such measures, in various forms, have been adopted in many
countries (for instance, in Azerbaijan, Armenia, Turkey, Ukraine, Korea, Argentina, and Brazil).

As the Euro is characterized by more short-term fluctuations30 than the Dollar, and also
due to the stereotypical attitudes to the Dollar, the consumers of banking products may be
unwilling to switch from US Dollars to Euro products. In this regard, it must be taken into
consideration that the USD/EUR currency market is the deepest and the most developed
which enables to insure EUR/USD currency risks at a rather low cost. For instance, it will
be relatively less costly for banks to transform the Dollar resources into the Euro
resources. Similarly, through short-term contracts it is possible for the borrower’s loan to
be denominated in the Euro in the long term, and in the Dollar in the short term. In this
case, there is the risk, on the one hand, that the price of the short-term insurance will go
up; however, it must be mentioned that this is driven by differences between the interest
rates of the United States and the Eurozone, and likelihood of large divergence,
considering the size and integration of the US and the Eurozone, is low. On the other
hand, there is a risk that when the term of the short-term contract expires, the borrower
will have to pay in Euro with the new exchange rate. However, in sum, based on the
assumption that in the Euro is more stable in the long term, the risk is still reduced both
for the client and the bank considering the aforementioned findings and the
diversification argument.
The chart below demonstrates the current price of the Euro/USD forwards at different
durations. For instance, one can pre-agree to exchange EUR in USD in 6 months from
now with 0.4% higher rate than today (in other words, according to interest rate parity
there are expectations that the Euro will strengthen slightly).
Chart 7 EUR/USD forward rate (basis points)
30 Currency fluctuations increase the spreads on FX conversion operations, and, as a consequence, negatively
reflect on the interest rate paid/accrued by a client on his/her loan or deposit. To illustrate, the average
spread when converting USD to GEL is 0.3-1.5%, while in case if Euro, it is 0.8-3.0%. Therefore, if we
discuss one-year deposits and loans, they will become 0.5-1.5 percentage point more expensive. On the
other hand, high spreads are partially driven by higher operating cost. So, once the transactions in Euro will
increase, those costs are expected to go down due to scale effect. If in parallel other instruments (e.g. FX
interventions) also reduce short-term volatility of Euro exchange rate, difference between Euro and Dollar
exchange rate will probably be immaterial.
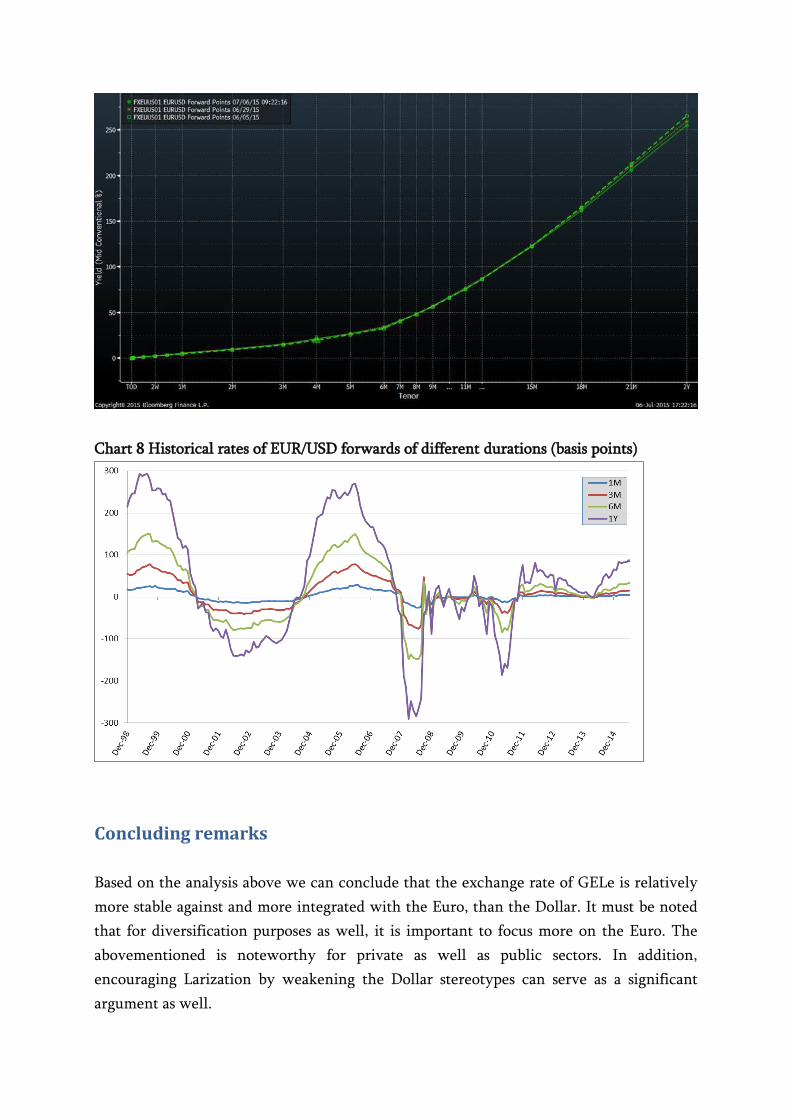
Chart 8 Historical rates of EUR/USD forwards of different durations (basis points)
Concluding remarks
Based on the analysis above we can conclude that the exchange rate of GELe is relatively
more stable against and more integrated with the Euro, than the Dollar. It must be noted
that for diversification purposes as well, it is important to focus more on the Euro. The
abovementioned is noteworthy for private as well as public sectors. In addition,
encouraging Larization by weakening the Dollar stereotypes can serve as a significant
argument as well.
Encouraging Euro will reduce economic risks caused by the dollarization problem. This
process will also support the progress of Georgia’s integration with the Eurozone, and it is
likely for this effect to become stronger in the future. As noted by Komárek, Čech,
Horváth (2003), these processes support each other: integration supports currency
stability, while the use of currency supports integration.
Further, we should take into consideration the events that take place within the European
Union. In case peripheral countries exit the Eurozone, Georgia’s economic ties with the
Eurozone may naturally weaken. However, it is still likely that relatively more integration
will be maintained with the Euro rather than US Dollar.
Overall, it is important to underscore that the conclusion consists in the Euro’s lower level
of riskiness when compared to the Dollar and does not state that there are no risks
associated with the Euro at all. Moreover, this article should not be cited as a supporting
argument for pegging the GEL exchange rate to the Euro. Again, the main priority should
be the Larization and focus on more effective actions to further stimulate the process.
Bibliography:
Arnott, Robert D., Jason C. Hsu, John M. West 2008, The Fundamental Index: A Better Way to
Invest, John Wiley & Sons Ltd.
Campa, J & Goldberg, L 2005 ‘Exchange rate pass-through into import prices’, Review of Economics and Statistics, vol. 87, pp. 679-690.
Dowd, K,. Measuring Market Risk, 2nd Edition, John Wiley & Sons Ltd.
Eichengreen, B & Bayoumi, T 1996, ‘Ever closer to heaven? An optimum-currency-area index
for European countries’, Center for International and Development Economics Research.
Fama, E 1970, ‘Efficient capital markets: a review of theory and empirical work’, Journal of Finance, pp. 383–417.
Frankel, J & Froot, K 1990, ‘The rationality of the foreign exchange rate: chartists,
Fundamentalists and trading in the foreign exchange market’, AEA papers and proceedings, vol. 80, no. 2, pp. 181-185.
Frankel, J, Bergsten, F & Mussa, M 1994, ‘Exchange Rate Policy’, University of Chicago Press,
pp. 293 – 366.
GARP, 2010, Code of Conduct, Global Association of Risk Professionals,
http://www.garp.org/media/59589/code%20of%20conduct0610.pdf
Goldberg, P & Knetter, M 1997 ‘Goods prices and exchange rates: what have we learned?’, Journal of Economic Literature, vol. 58, no. 3, pp. 1243-1272.
Hausmann, R, Panizza, U & Stein, E 2001, ‘Why do countries float the way they float?,’ Journal of Development Economics, Elsevier, vol. 66(2), pp 387-414.
Kakulia, M 2001, ‘Concept and Indicators of Dollarization’, Bulletin of the Georgian Academy of Sciences, vol. 164, no. 3. http://www.science.org.ge/moambe/New/pub13/164-3.htm
Kokenyne, A, Ley, J & Veyrune, R 2010, ‘Dedollarization’, IMF Working Paper.
Komarek L., Z. Cech & R. Horvath, 2003. "Optimum Currency Area Indices - How Close is the
Czech Republic to the Eurozone?," Working Papers 2003/10, Czech National Bank, Research
Department.

Meese, R & Rogoff, K 1983, ‘Empirical Exchange Rate Models of the Seventies: Do They Fit
Out-Of-Sample?’ Journal of International Economics, pp. 3-24.
Mundell, R 1961 ‘A Theory of Optimum Currency Areas’, American Economic Review, vol. 51
no. 4, pp. 657–665.
Ize, A & Parrado, E 2006, ‘Real Dollarization, Financial Dollarization, and Monetary Policy’,
Working Papers Central Bank of Chile, vol. 375.
Nadaraia, O 2011, “Local currency lending in Georgia – problems and solution”,
https://www.nbg.gov.ge/uploads/publications/on/ebrd.pdf
Nadaraia, O 2009a, “Managing FX Risk in Partially Dollarized Banking Systems”,
https://www.nbg.gov.ge/uploads/publications/on/the_hending_missing.pdf
Nadaraia, O 2009b, “Hedging FX Risk”.
https://www.nbg.gov.ge/uploads/publications/on/hedging_fx_risk.pdf
Nadaraia, O, Gorgodze, O, Utiashvili, D & Sharumashvili, N 2013, “Economic Growth and
Structural Transformation”, Journal "Economics and Banking", 2013, N 2.
https://www.nbg.gov.ge/uploads/publications/on/Economic%20Growth%20and%20Structural
%20Transformation.pdf
Economist 2014, ‘The once and future currency’, the Economist, 8 March,
http://www.economist.com/news/finance-and-economics/21598651-new-book-examines-
worlds-love-hate-relationship-dollar-once-and
Prasad E 2014, The Dollar Trap: How the U.S. Dollar Tightened Its Grip on Global Finance,
Princeton University Press.
Pricel, R 1997, ‘The rationale and design of inflation-indexed bonds’, IMF Working Paper,
WP/97/12.
Shams, R, 2005, “Dollar-Euro Exchange Rate 1999-2004 - Dollar and Euro as International
Currencies”, HWWA Discussion Paper 321.
Taleb, N 2007, The Black Swan: The Impact of the Highly Improbable, 2nd edn, Random House
Trade Paperbacks.
Taleb, N 2015 „Silent Risk , The Technical Incerto: Lectures on Risk and Probability“, Vol 1,
https://drive.google.com/file/d/0B8nhAlfIk3QIR1o1dnk5ZmRaaGs/view
Cincibuch M., and D. Vávra 2001, “Toward the European Monetary Union: A Need for
Exchange Rate Flexibility?”, Eastern European Economics, Vol. 39, No. 6.
კაკულია, მ & ასლამაზიშვილი, ნ 2000, ‘დოლარიზაცია საქართველოში: მასშტაბები, ფაქტორები, დაძლევის გზები’, თბილისი, პაატა გუგუშვილის სახელობის ეკონომიკის
ინსტიტუტი.
ლეჟავა, პ 2013, ‘ფასწარმოქმნა სესხებზე და კონკურენცია საქართველოს საბანკო
სექტორში’, ეკონომიკა და საბანკო საქმე, vol. 1, no. 1, pp. 31-40
მდივნიშვილი, თ 2014, ‘გაცვლითი კურსის გავლენა სამომხმარებლო ფასებსა და
იმპორტის ფასებზე’, ეკონომიკა და საბანკო საქმე, vol. 2, no. 2, pp. 17-27.