where in the world? supply chain optimization and … in the world? supply chain optimization and...
TRANSCRIPT
Where in the World?
Supply Chain Optimization and Site Selection in
Deloitte Consulting LLP
Site Selection in Emerging Economies
Deloitte Consulting LLP
September 21, 2009
Today’s Discussion
SCO and site selection – a crash course
What is so different about emerging economies?
Taking a total supply chain cost approach
Q&A
- 2 -
SCO and site selection – a crash course
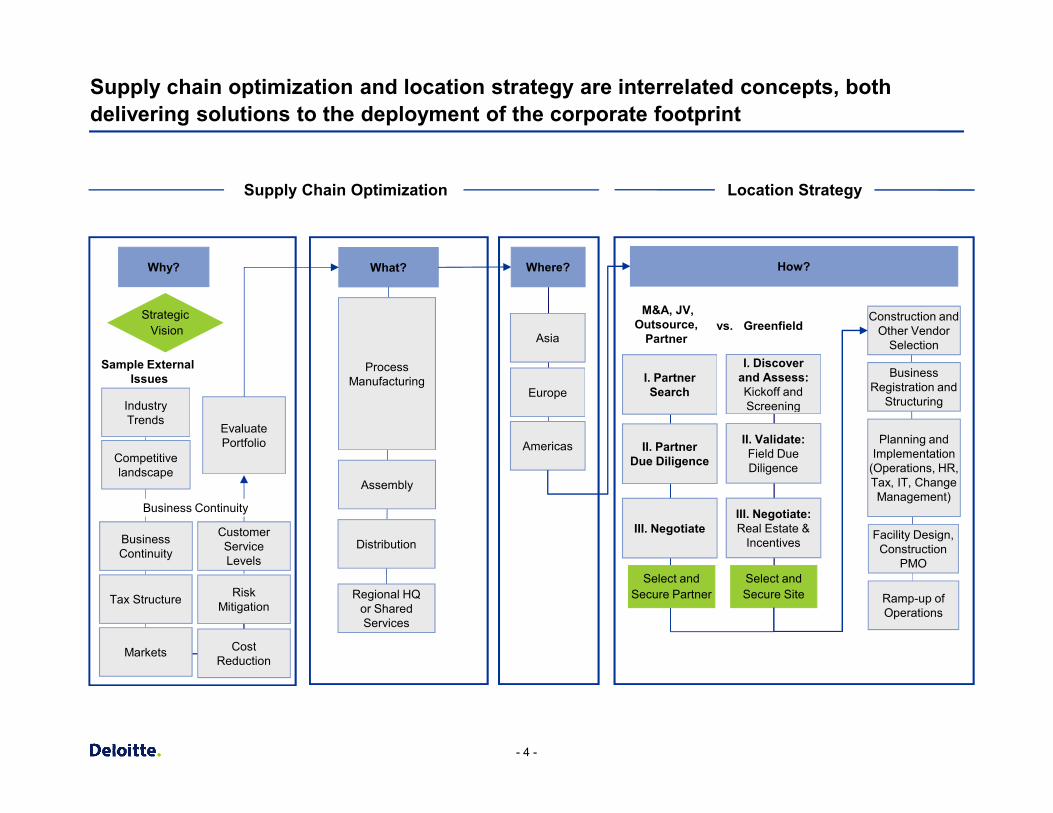
Supply chain optimization and location strategy are interrelated concepts, both delivering solutions to the deployment of the corporate footprint
What?
StrategicVision
Why?
Asia
Europe
Sample ExternalIssues
Industry
Construction and Other Vendor
Selection
Business Registration and
Structuring
Process Manufacturing
I. Discover and Assess:Kickoff and Screening
Supply Chain Optimization
Where? How?
GreenfieldM&A, JV,
Outsource, Partner
I. Partner Search
vs.
Location Strategy
- 4 -
AmericasEvaluate Portfolio
Industry Trends
Business Continuity
Competitive landscape
Tax Structure
Cost Reduction
Risk Mitigation
Markets
Planning and Implementation
(Operations, HR, Tax, IT, Change Management)
Structuring
Facility Design, Construction
PMO
Ramp-up of Operations
Customer Service Levels
Business Continuity
Assembly
Distribution
Regional HQ or Shared Services
Screening
II. Validate:Field Due Diligence
III. Negotiate:Real Estate &
Incentives
Select and Secure Site
II. Partner Due Diligence
III. Negotiate
Select and Secure Partner
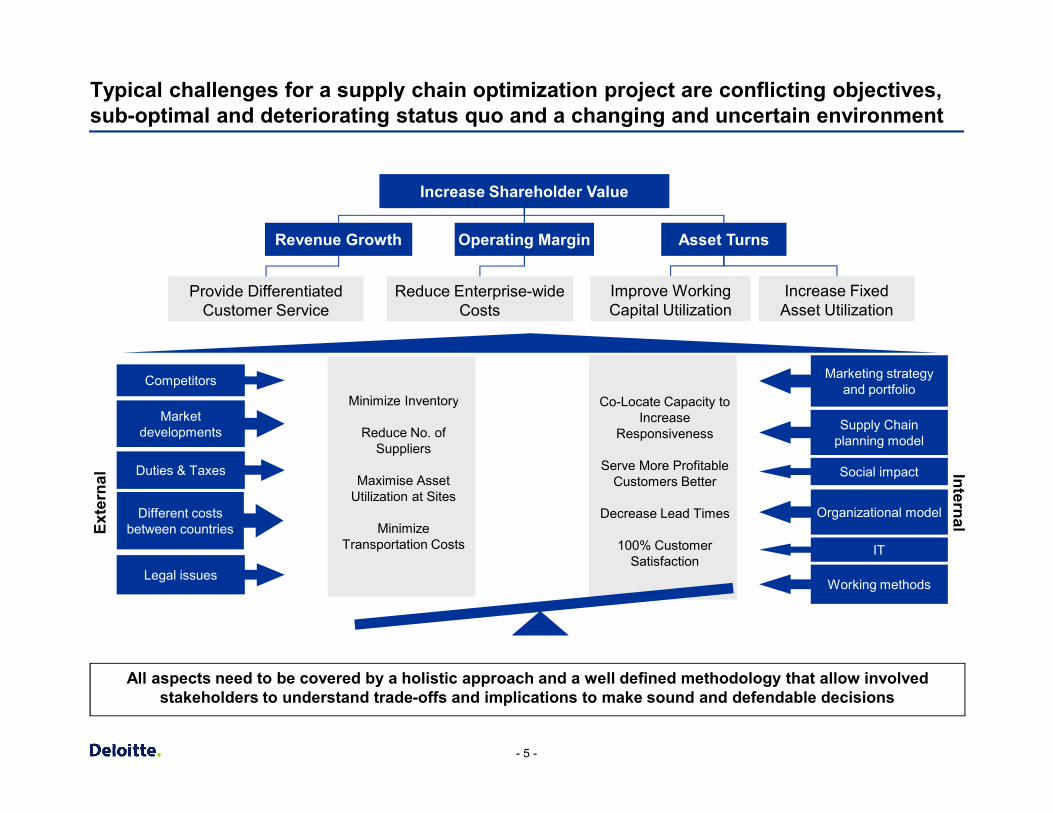
Typical challenges for a supply chain optimization project are conflicting objectives, sub-optimal and deteriorating status quo and a changing and uncertain environment
Minimize Inventory Co-Locate Capacity to Competitors
Revenue Growth Operating Margin
Increase Shareholder Value
Provide Differentiated Customer Service
Reduce Enterprise-wide Costs
Asset Turns
Increase Fixed Asset Utilization
Improve Working Capital Utilization
Marketing strategy and portfolio
- 5 -
All aspects need to be covered by a holistic approach and a well defined methodology that allow involved stakeholders to understand trade-offs and implications to make sound and defendable decisions
Minimize Inventory
Reduce No. of Suppliers
Maximise Asset Utilization at Sites
Minimize Transportation Costs
Co-Locate Capacity to Increase
Responsiveness
Serve More Profitable Customers Better
Decrease Lead Times
100% Customer Satisfaction
InternalExte
rnal
Market developments
Duties & Taxes
Supply Chain planning model
Social impact
Organizational modelDifferent costs between countries
Legal issues
IT
Working methods
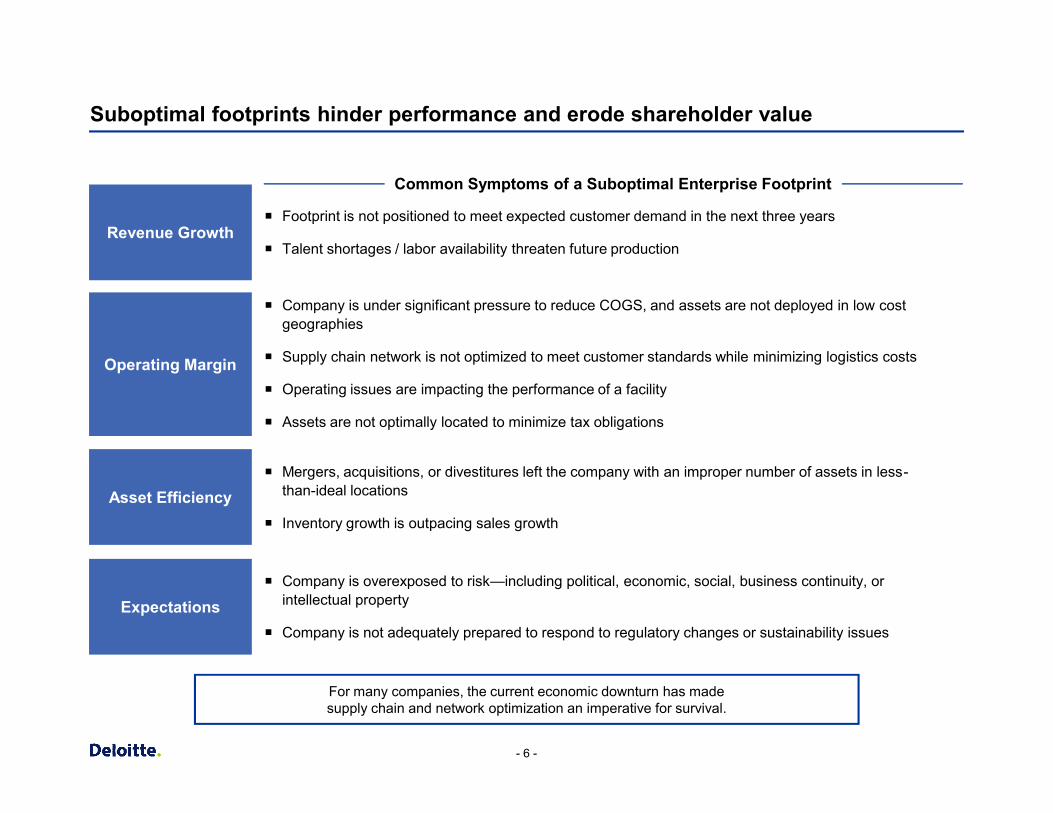
Suboptimal footprints hinder performance and erode shareholder value
¡ Footprint is not positioned to meet expected customer demand in the next three years
¡ Talent shortages / labor availability threaten future production
¡ Company is under significant pressure to reduce COGS, and assets are not deployed in low cost geographies
¡ Supply chain network is not optimized to meet customer standards while minimizing logistics costs
¡ Operating issues are impacting the performance of a facility
Revenue Growth
Operating Margin
Common Symptoms of a Suboptimal Enterprise Footprint
- 6 -
¡ Assets are not optimally located to minimize tax obligations
¡ Mergers, acquisitions, or divestitures left the company with an improper number of assets in less-than-ideal locations
¡ Inventory growth is outpacing sales growth
¡ Company is overexposed to risk—including political, economic, social, business continuity, or intellectual property
¡ Company is not adequately prepared to respond to regulatory changes or sustainability issues
Asset Efficiency
Expectations
For many companies, the current economic downturn has made supply chain and network optimization an imperative for survival.
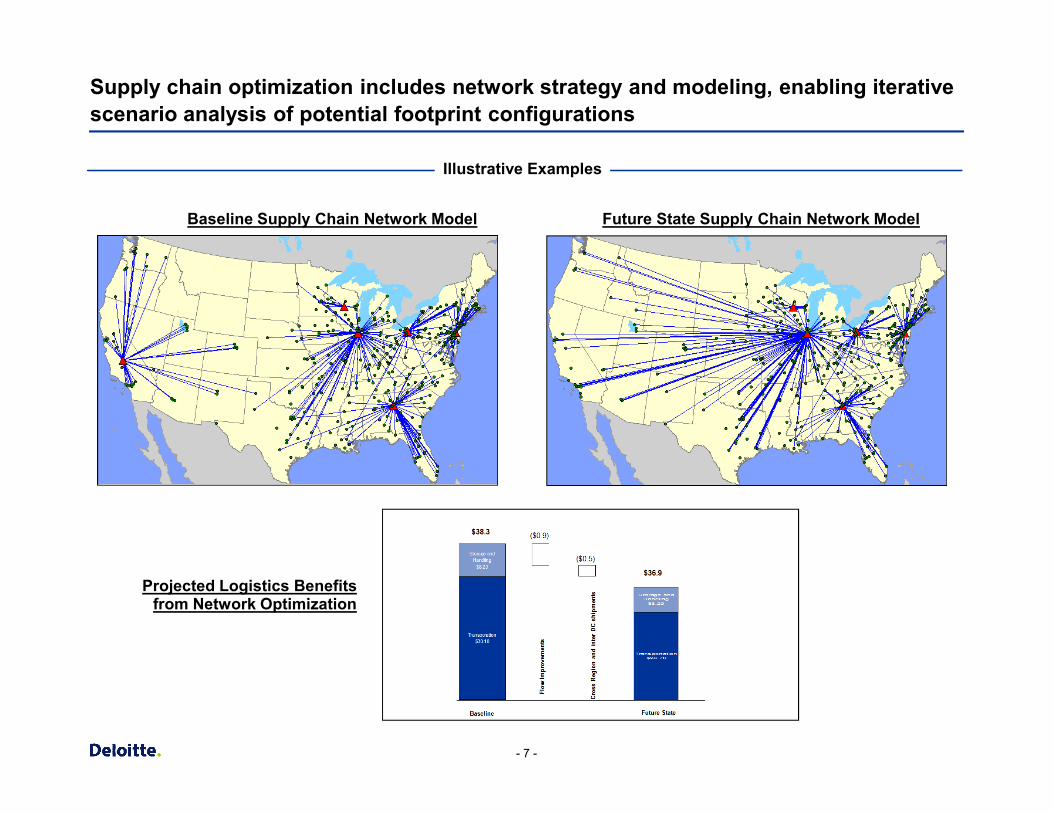
Supply chain optimization includes network strategy and modeling, enabling iterative scenario analysis of potential footprint configurations
Illustrative Examples
Baseline Supply Chain Network Model Future State Supply Chain Network Model
- 7 -
Projected Logistics Benefits from Network Optimization
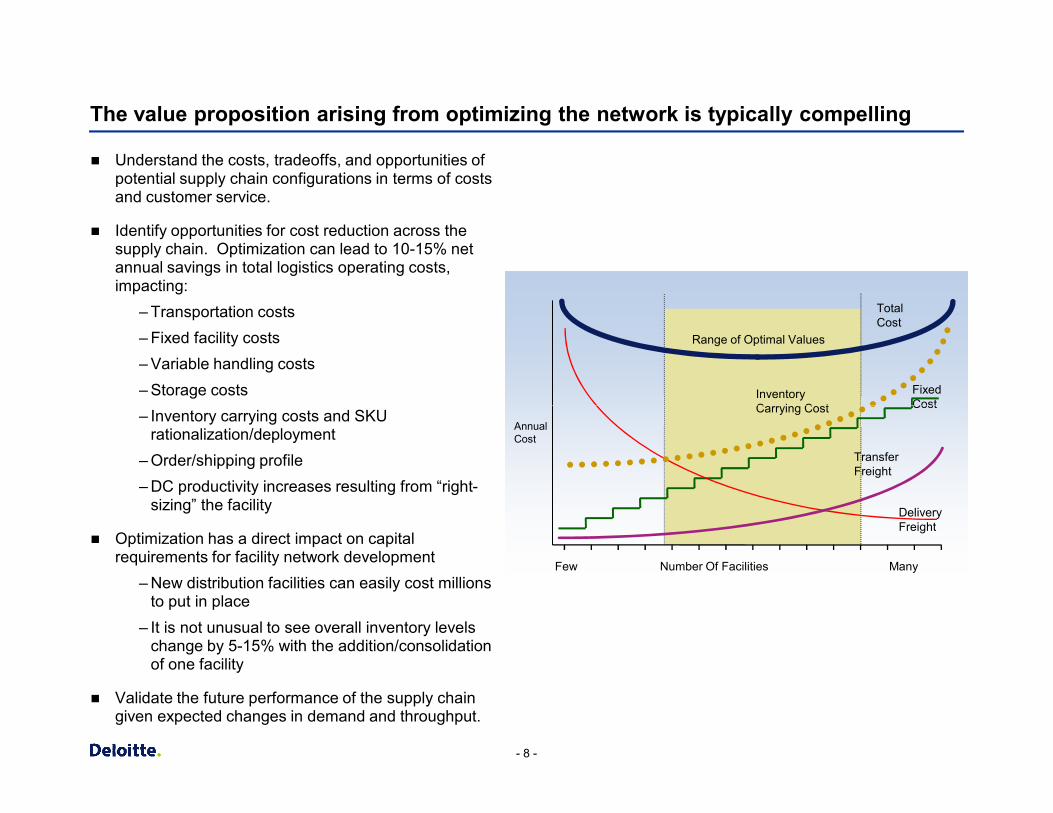
The value proposition arising from optimizing the network is typically compelling
n Understand the costs, tradeoffs, and opportunities of potential supply chain configurations in terms of costs and customer service.
n Identify opportunities for cost reduction across the supply chain. Optimization can lead to 10-15% net annual savings in total logistics operating costs, impacting:
– Transportation costs– Fixed facility costs– Variable handling costs– Storage costs
Range of Optimal Values
Fixed Cost
Total Cost
Inventory Carrying Cost
- 8 -
– Inventory carrying costs and SKU rationalization/deployment
– Order/shipping profile– DC productivity increases resulting from “right-
sizing” the facility
n Optimization has a direct impact on capital requirements for facility network development
– New distribution facilities can easily cost millions to put in place
– It is not unusual to see overall inventory levels change by 5-15% with the addition/consolidation of one facility
n Validate the future performance of the supply chain given expected changes in demand and throughput.
Annual Cost
Transfer Freight
Cost
Delivery Freight
Number Of FacilitiesFew Many
Carrying Cost
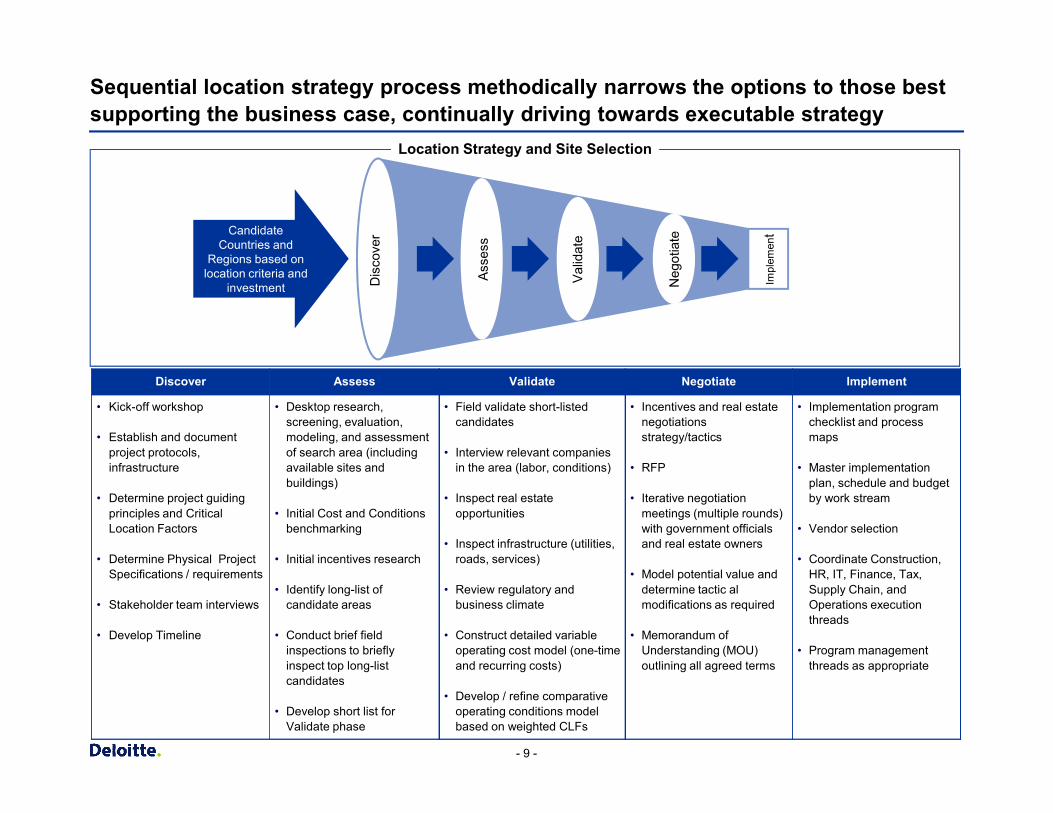
Sequential location strategy process methodically narrows the options to those best supporting the business case, continually driving towards executable strategy
Candidate Countries and
Regions based on location criteria and
investment Dis
cove
r
Asse
ss
Valid
ate
Neg
otia
te
Impl
emen
t
Discover Assess Validate Negotiate Implement
• Kick-off workshop • Desktop research, • Field validate short-listed • Incentives and real estate • Implementation program
Location Strategy and Site Selection
- 9 -
• Kick-off workshop
• Establish and document project protocols, infrastructure
• Determine project guiding principles and Critical Location Factors
• Determine Physical Project Specifications / requirements
• Stakeholder team interviews
• Develop Timeline
• Desktop research, screening, evaluation, modeling, and assessment of search area (including available sites and buildings)
• Initial Cost and Conditions benchmarking
• Initial incentives research
• Identify long-list of candidate areas
• Conduct brief field inspections to briefly inspect top long-list candidates
• Develop short list for Validate phase
• Field validate short-listed candidates
• Interview relevant companies in the area (labor, conditions)
• Inspect real estate opportunities
• Inspect infrastructure (utilities, roads, services)
• Review regulatory and business climate
• Construct detailed variable operating cost model (one-time and recurring costs)
• Develop / refine comparative operating conditions model based on weighted CLFs
• Incentives and real estate negotiations strategy/tactics
• RFP
• Iterative negotiation meetings (multiple rounds) with government officials and real estate owners
• Model potential value and determine tactic al modifications as required
• Memorandum of Understanding (MOU) outlining all agreed terms
• Implementation program checklist and process maps
• Master implementation plan, schedule and budget by work stream
• Vendor selection
• Coordinate Construction, HR, IT, Finance, Tax, Supply Chain, and Operations execution threads
• Program management threads as appropriate
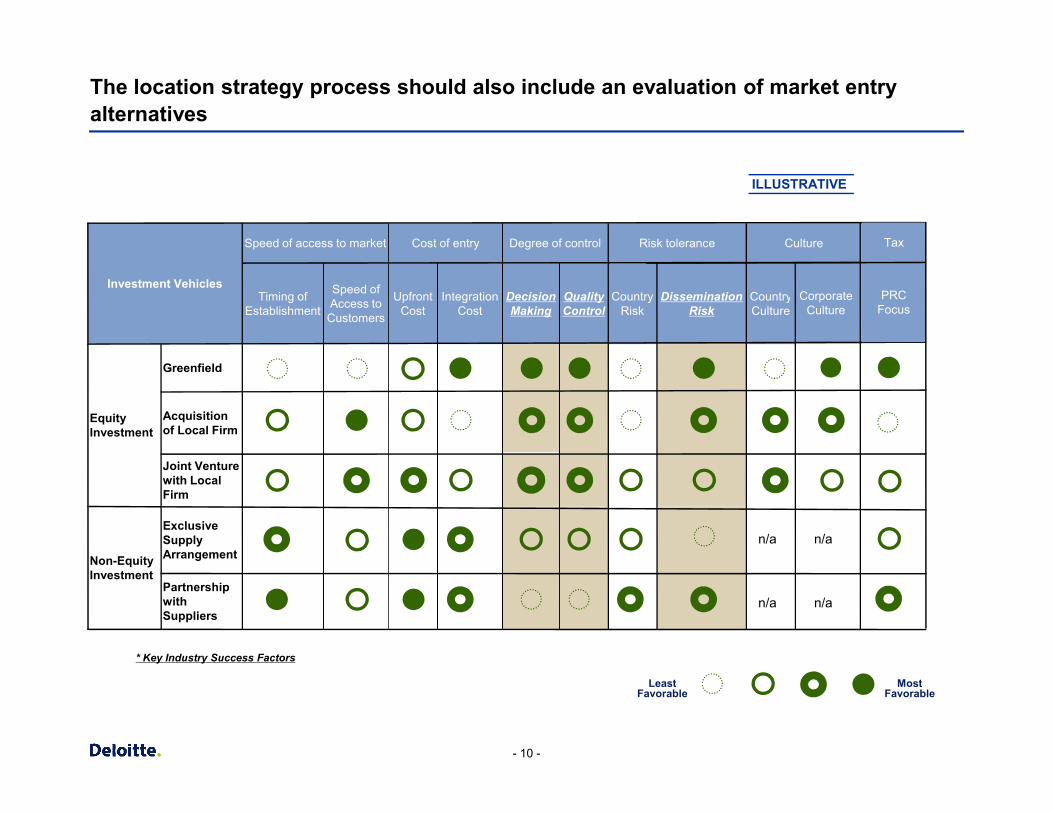
The location strategy process should also include an evaluation of market entry alternatives
Country Culture
Culture
Corporate Culture
Decision Making
Greenfield
Investment VehiclesDissemination
RiskCountry
RiskQuality Control
Risk toleranceDegree of control
Integration Cost
Upfront Cost
Speed of Access to Customers
Timing of Establishment
Cost of entrySpeed of access to market
PRCFocus
Tax
ILLUSTRATIVE
- 10 -
Least Favorable
Most Favorable
Non-Equity Investment
Equity Investment
Partnership with Suppliers
Exclusive Supply Arrangement
Joint Venture with Local Firm
Acquisition of Local Firm
n/a n/a
n/a n/a
* Key Industry Success Factors
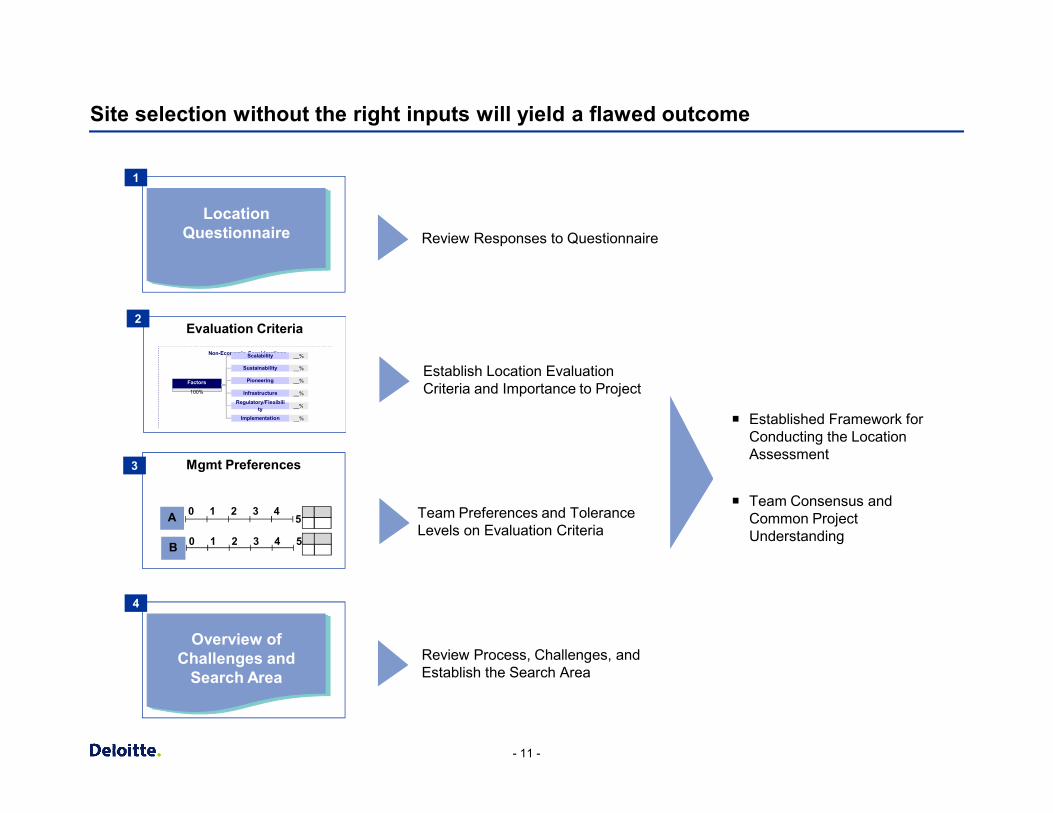
Site selection without the right inputs will yield a flawed outcome
Review Responses to Questionnaire
Establish Location Evaluation Criteria and Importance to Project
Evaluation Criteria
Location Questionnaire
1
2
Factors
100%
Regulatory/Flexibili__%
Non-Economic Considerations
Sustainability __%
Pioneering __%
Infrastructure __%
Scalability __%
- 11 -
Team Preferences and Tolerance Levels on Evaluation Criteria
Mgmt Preferences
B
A
1 2 3 4 50
1 2 3 45
0
3
ty __%
Implementation __%
Review Process, Challenges, and Establish the Search Area
Overview of Challenges and
Search Area
4
¡ Established Framework for Conducting the Location Assessment
¡ Team Consensus and Common Project Understanding
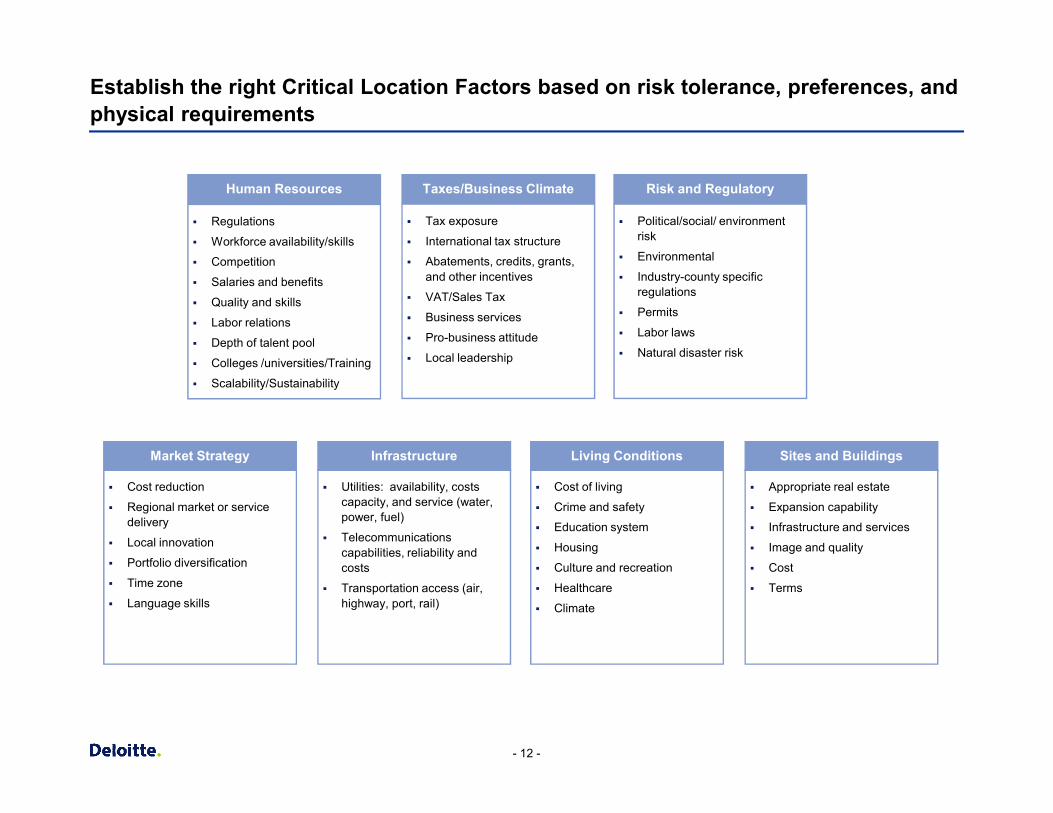
Establish the right Critical Location Factors based on risk tolerance, preferences, and physical requirements
§ Regulations
§ Workforce availability/skills
§ Competition
§ Salaries and benefits
§ Quality and skills
§ Labor relations
§ Depth of talent pool
§ Colleges /universities/Training
§ Scalability/Sustainability
Human Resources
§ Political/social/ environment risk
§ Environmental
§ Industry-county specific regulations
§ Permits
§ Labor laws
§ Natural disaster risk
Risk and Regulatory
§ Tax exposure
§ International tax structure
§ Abatements, credits, grants, and other incentives
§ VAT/Sales Tax
§ Business services
§ Pro-business attitude
§ Local leadership
Taxes/Business Climate
- 12 -
§ Cost reduction
§ Regional market or service delivery
§ Local innovation
§ Portfolio diversification
§ Time zone
§ Language skills
Market Strategy
§ Utilities: availability, costs capacity, and service (water, power, fuel)
§ Telecommunications capabilities, reliability and costs
§ Transportation access (air, highway, port, rail)
Infrastructure
§ Appropriate real estate
§ Expansion capability
§ Infrastructure and services
§ Image and quality
§ Cost
§ Terms
Sites and Buildings
§ Cost of living
§ Crime and safety
§ Education system
§ Housing
§ Culture and recreation
§ Healthcare
§ Climate
Living Conditions
What is so different about emerging economies?
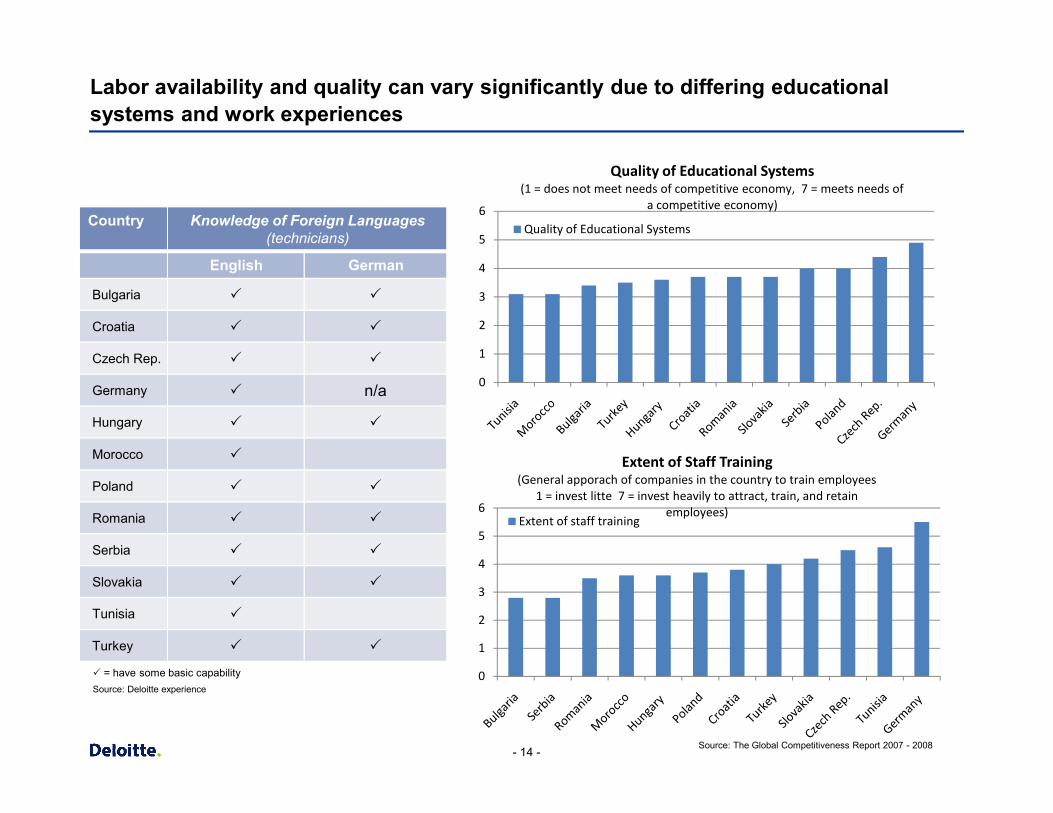
Labor availability and quality can vary significantly due to differing educational systems and work experiences
0
1
2
3
4
5
6
Quality of Educational Systems(1 = does not meet needs of competitive economy, 7 = meets needs of
a competitive economy)
Quality of Educational SystemsCountry Knowledge of Foreign Languages
(technicians)
English German
Bulgaria P P
Croatia P P
Czech Rep. P P
Germany P n/a
- 14 -
0
1
2
3
4
5
6
Extent of Staff Training(General apporach of companies in the country to train employees
1 = invest litte 7 = invest heavily to attract, train, and retain employees)
Extent of staff training
Hungary P P
Morocco P
Poland P P
Romania P P
Serbia P P
Slovakia P P
Tunisia P
Turkey P P
P = have some basic capabilitySource: Deloitte experience
Source: The Global Competitiveness Report 2007 - 2008
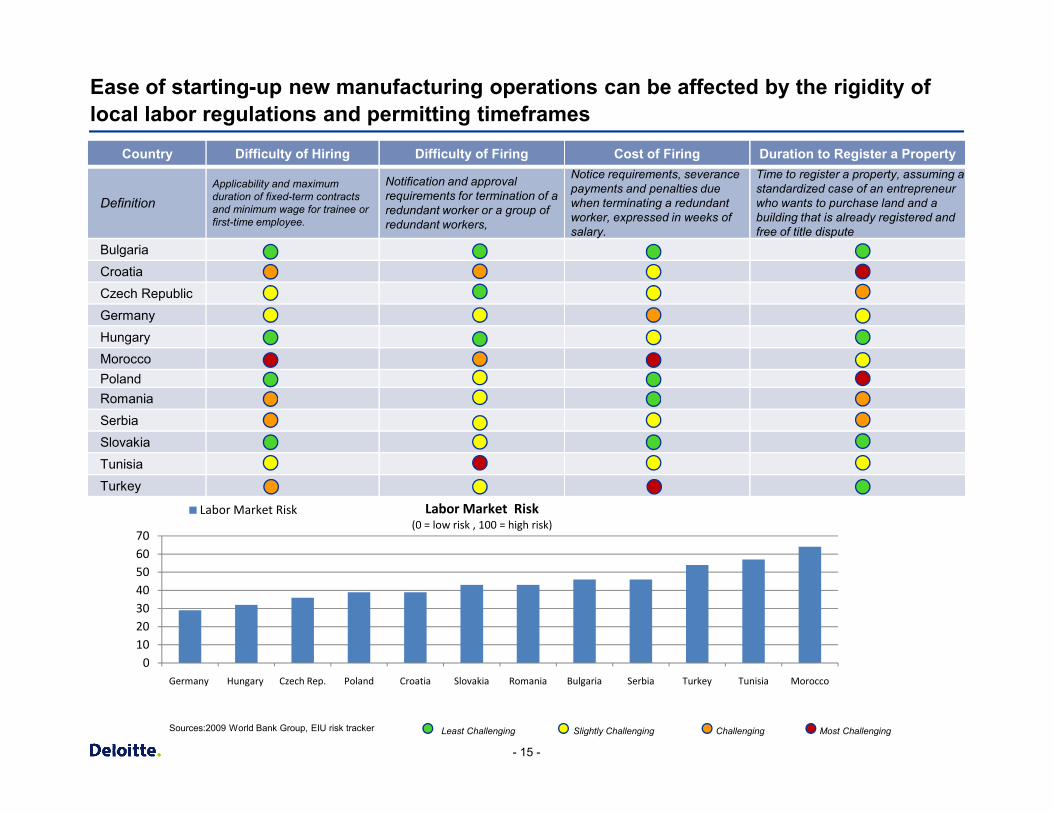
Ease of starting-up new manufacturing operations can be affected by the rigidity of local labor regulations and permitting timeframes
Country Difficulty of Hiring Difficulty of Firing Cost of Firing Duration to Register a Property
DefinitionApplicability and maximum duration of fixed-term contracts and minimum wage for trainee or first-time employee.
Notification and approval requirements for termination of a redundant worker or a group of redundant workers,
Notice requirements, severance payments and penalties due when terminating a redundant worker, expressed in weeks of salary.
Time to register a property, assuming a standardized case of an entrepreneur who wants to purchase land and a building that is already registered and free of title dispute
BulgariaCroatiaCzech RepublicGermany Hungary MoroccoPolandRomania
- 15 -
010203040506070
Germany Hungary Czech Rep. Poland Croatia Slovakia Romania Bulgaria Serbia Turkey Tunisia Morocco
Labor Market Risk(0 = low risk , 100 = high risk)
Labor Market Risk
SerbiaSlovakiaTunisiaTurkey
Most ChallengingSlightly ChallengingLeast Challenging ChallengingSources:2009 World Bank Group, EIU risk tracker
67
Legal & Regulatory Risk(1 = highest risk, 7 = lowest risk)
Legal & regulatory risk
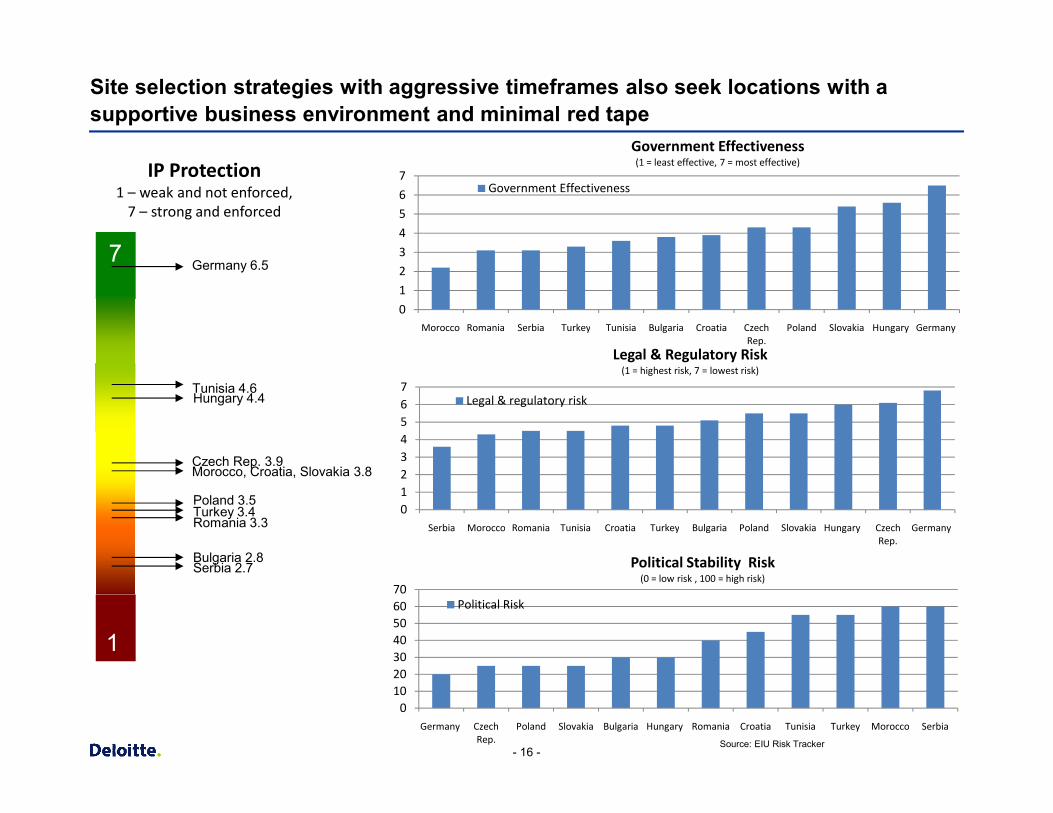
Site selection strategies with aggressive timeframes also seek locations with a supportive business environment and minimal red tape
0
1
2
3
4
5
6
7
Morocco Romania Serbia Turkey Tunisia Bulgaria Croatia Czech Rep.
Poland Slovakia Hungary Germany
Government Effectiveness(1 = least effective, 7 = most effective)
Government Effectiveness
Tunisia 4.6
7
Hungary 4.4
Germany 6.5
IP Protection1 – weak and not enforced,
7 – strong and enforced
- 16 -
0123456
Serbia Morocco Romania Tunisia Croatia Turkey Bulgaria Poland Slovakia Hungary Czech Rep.
Germany
Legal & regulatory risk
Source: EIU Risk Tracker
010203040506070
Germany Czech Rep.
Poland Slovakia Bulgaria Hungary Romania Croatia Tunisia Turkey Morocco Serbia
Political Stability Risk(0 = low risk , 100 = high risk)
Political Risk
1
Czech Rep. 3.9
Bulgaria 2.8
Poland 3.5Turkey 3.4Romania 3.3
Serbia 2.7
Morocco, Croatia, Slovakia 3.8
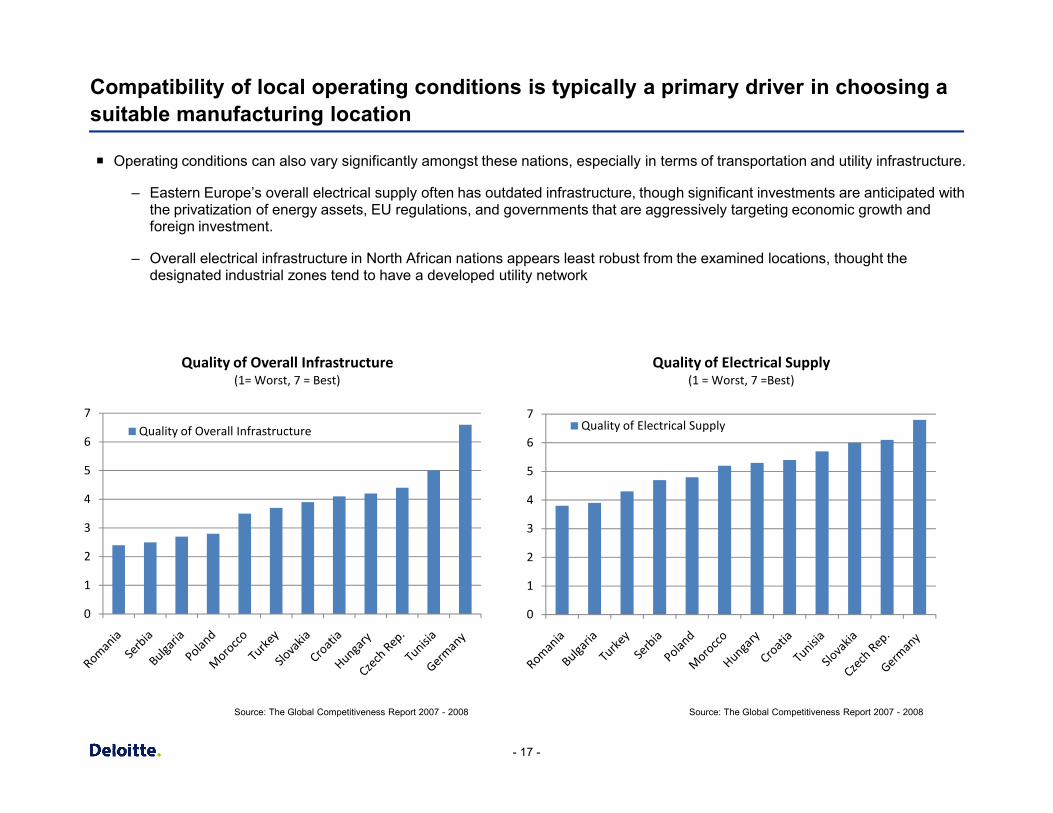
Compatibility of local operating conditions is typically a primary driver in choosing a suitable manufacturing location
7
Quality of Overall Infrastructure(1= Worst, 7 = Best)
¡ Operating conditions can also vary significantly amongst these nations, especially in terms of transportation and utility infrastructure.
– Eastern Europe’s overall electrical supply often has outdated infrastructure, though significant investments are anticipated with the privatization of energy assets, EU regulations, and governments that are aggressively targeting economic growth and foreign investment.
– Overall electrical infrastructure in North African nations appears least robust from the examined locations, thought the designated industrial zones tend to have a developed utility network
7
Quality of Electrical Supply(1 = Worst, 7 =Best)
- 17 -
0
1
2
3
4
5
6
7Quality of Overall Infrastructure
0
1
2
3
4
5
6
7Quality of Electrical Supply
Source: The Global Competitiveness Report 2007 - 2008Source: The Global Competitiveness Report 2007 - 2008
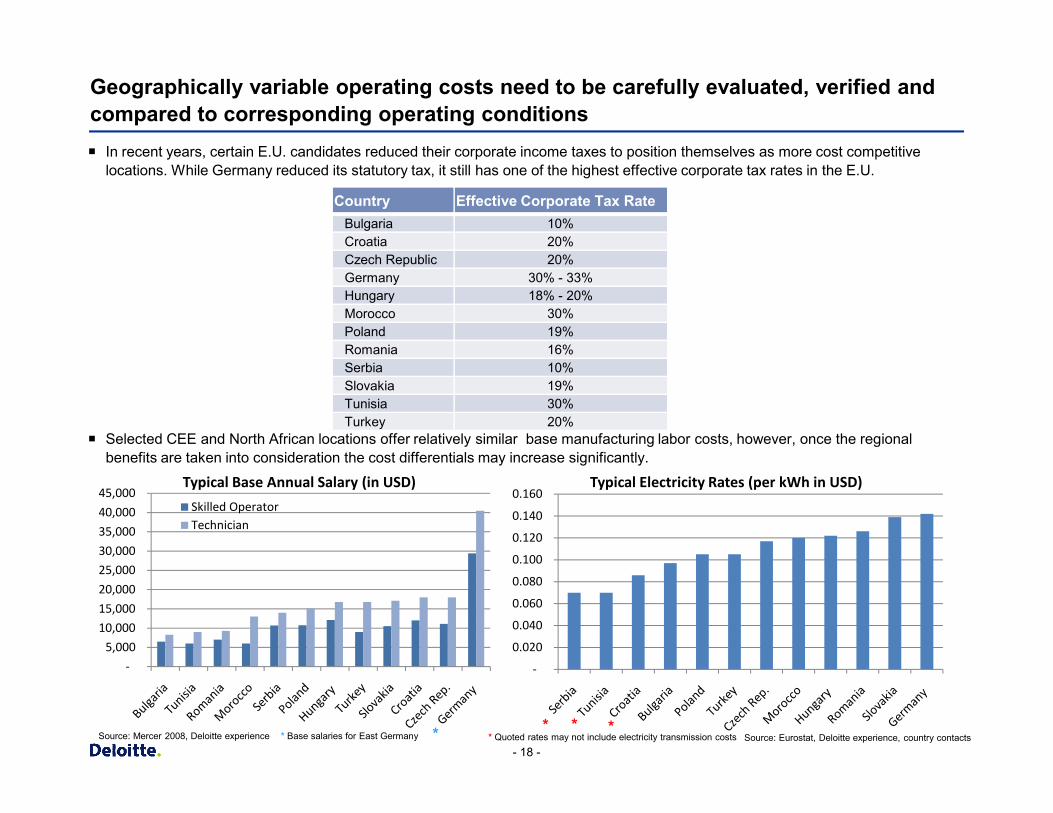
Geographically variable operating costs need to be carefully evaluated, verified and compared to corresponding operating conditions¡ In recent years, certain E.U. candidates reduced their corporate income taxes to position themselves as more cost competitive
locations. While Germany reduced its statutory tax, it still has one of the highest effective corporate tax rates in the E.U.
Country Effective Corporate Tax RateBulgaria 10%Croatia 20%Czech Republic 20%Germany 30% - 33%Hungary 18% - 20%Morocco 30%Poland 19%Romania 16%Serbia 10%Slovakia 19%Tunisia 30%
- 18 -
-
0.020
0.040
0.060
0.080
0.100
0.120
0.140
0.160 Typical Electricity Rates (per kWh in USD)
-
5,000
10,000
15,000
20,000
25,000
30,000
35,000
40,000
45,000 Typical Base Annual Salary (in USD)
Skilled OperatorTechnician
Tunisia 30%Turkey 20%
¡ Selected CEE and North African locations offer relatively similar base manufacturing labor costs, however, once the regional benefits are taken into consideration the cost differentials may increase significantly.
* ** Quoted rates may not include electricity transmission costs** Base salaries for East Germany
*Source: Mercer 2008, Deloitte experience Source: Eurostat, Deloitte experience, country contacts
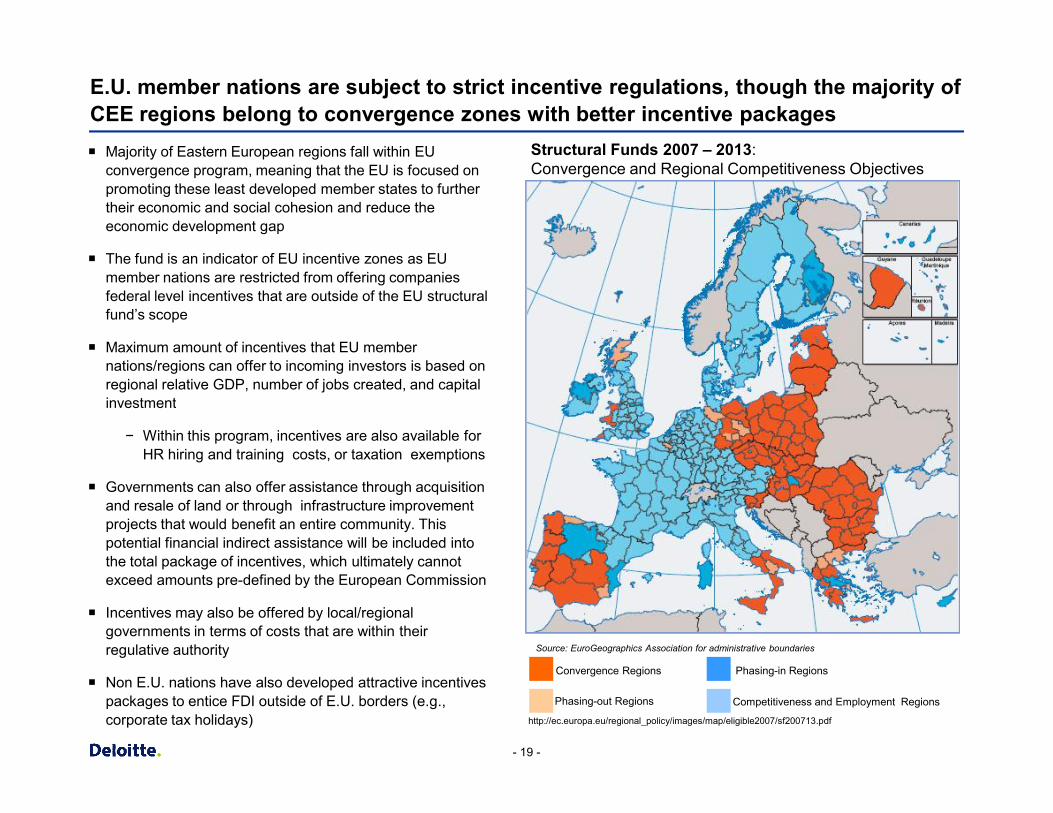
E.U. member nations are subject to strict incentive regulations, though the majority of CEE regions belong to convergence zones with better incentive packages
Structural Funds 2007 – 2013: Convergence and Regional Competitiveness Objectives
¡ Majority of Eastern European regions fall within EU convergence program, meaning that the EU is focused on promoting these least developed member states to further their economic and social cohesion and reduce the economic development gap
¡ The fund is an indicator of EU incentive zones as EU member nations are restricted from offering companies federal level incentives that are outside of the EU structural fund’s scope
¡ Maximum amount of incentives that EU member nations/regions can offer to incoming investors is based on regional relative GDP, number of jobs created, and capital investment
- 19 -
Source: EuroGeographics Association for administrative boundaries
Convergence Regions
Phasing-out Regions Competitiveness and Employment Regions
Phasing-in Regions
http://ec.europa.eu/regional_policy/images/map/eligible2007/sf200713.pdf
investment
− Within this program, incentives are also available for HR hiring and training costs, or taxation exemptions
¡ Governments can also offer assistance through acquisition and resale of land or through infrastructure improvement projects that would benefit an entire community. This potential financial indirect assistance will be included into the total package of incentives, which ultimately cannot exceed amounts pre-defined by the European Commission
¡ Incentives may also be offered by local/regional governments in terms of costs that are within their regulative authority
¡ Non E.U. nations have also developed attractive incentives packages to entice FDI outside of E.U. borders (e.g., corporate tax holidays)
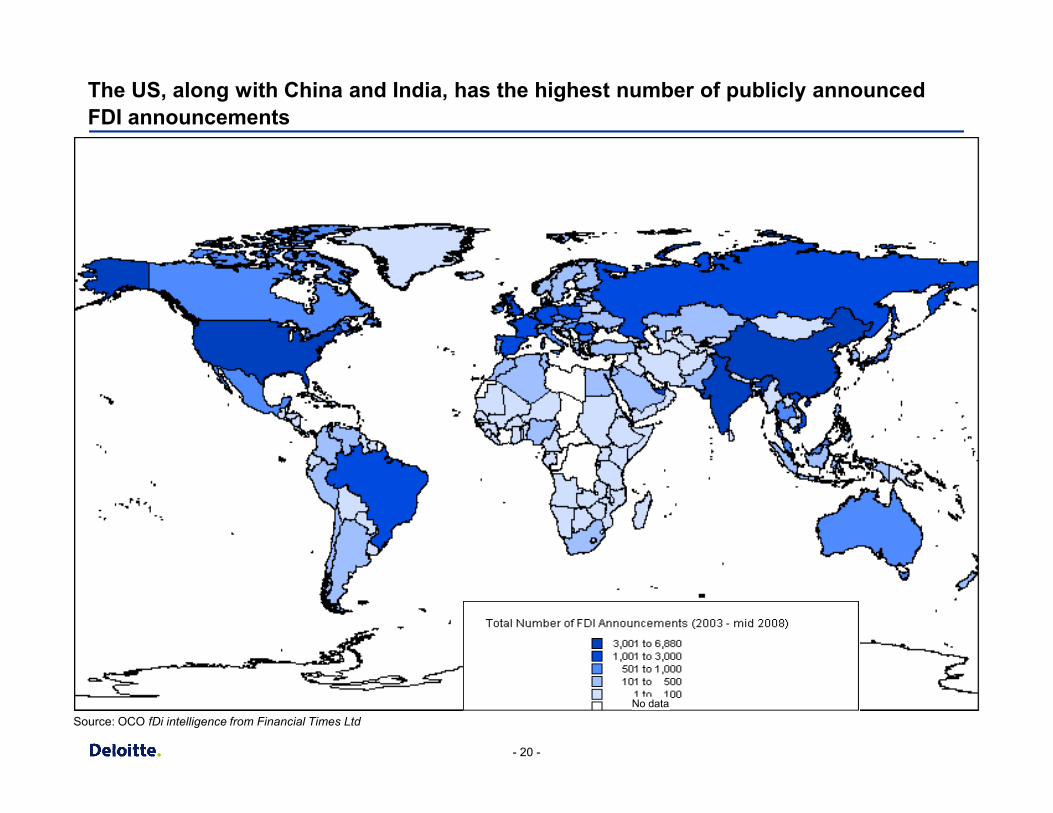
The US, along with China and India, has the highest number of publicly announced FDI announcements
- 20 -
Source: OCO fDi intelligence from Financial Times LtdNo data
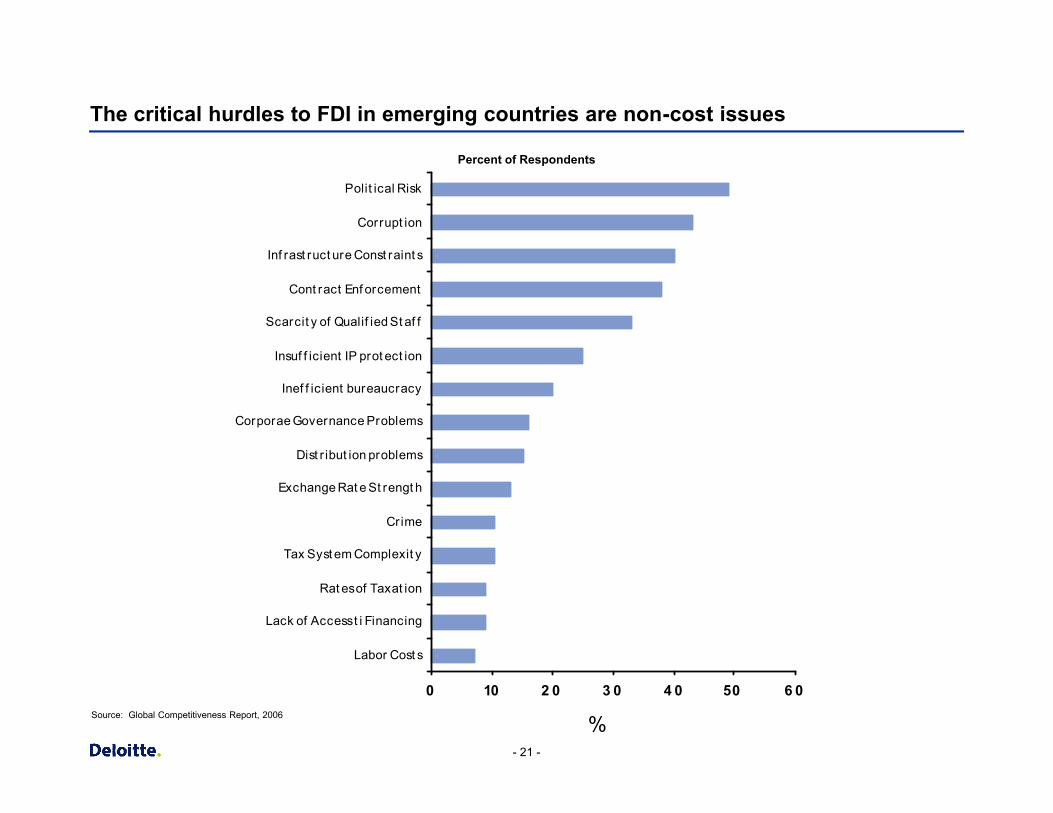
The critical hurdles to FDI in emerging countries are non-cost issues
Inef f icient bureaucracy
Insuf f icient IP prot ect ion
Scarcit y of Qualif ied St af f
Cont ract Enf orcement
Inf rast ruct ure Const raint s
Corrupt ion
Polit ical Risk
Percent of Respondents
- 21 -
0 10 2 0 3 0 4 0 50 6 0
Labor Cost s
Lack of Access t i Financing
Rat es of Taxat ion
Tax Syst em Complexit y
Crime
Exchange Rat e St rengt h
Dist r ibut ion problems
Corporae Governance Problems
%Source: Global Competitiveness Report, 2006
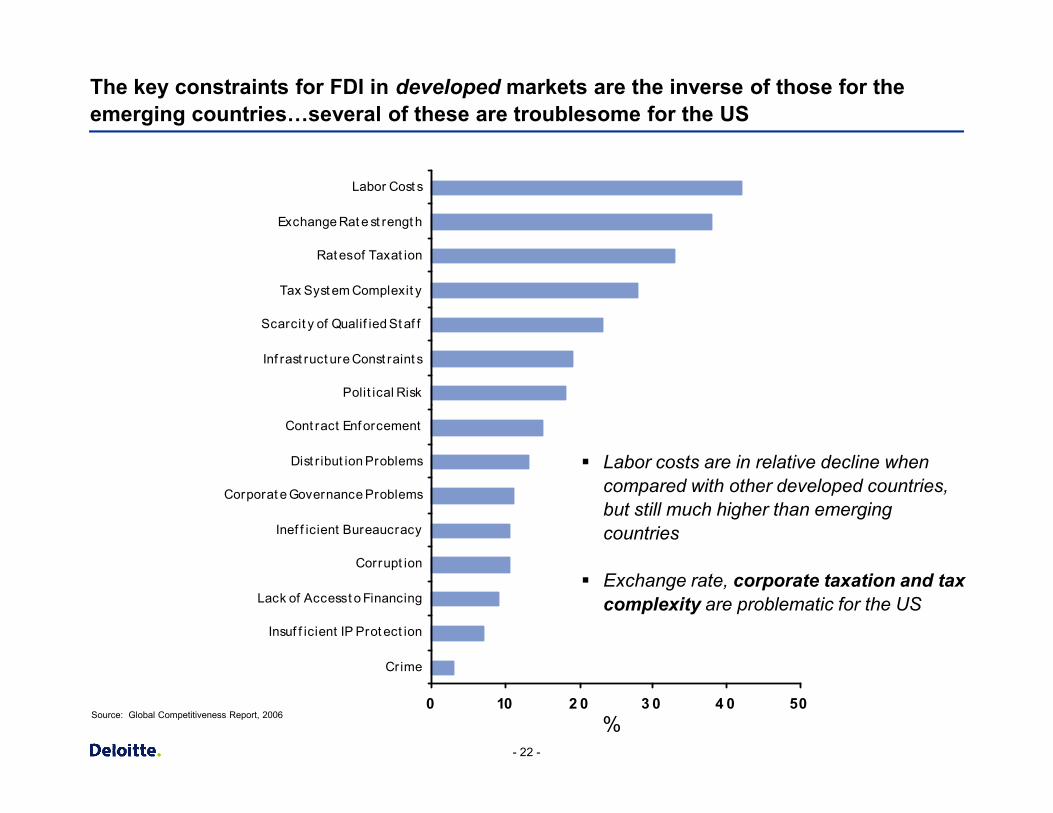
The key constraints for FDI in developed markets are the inverse of those for the emerging countries…several of these are troublesome for the US
Polit ical Risk
Inf rast ruct ure Const raint s
Scarcit y of Qualif ied St af f
Tax Syst em Complexit y
Rat es of Taxat ion
Exchange Rat e st rengt h
Labor Cost s
- 22 -
0 10 2 0 3 0 4 0 50
Crime
Insuf f icient IP Prot ect ion
Lack of Access t o Financing
Corrupt ion
Inef f icient Bureaucracy
Corporat e Governance Problems
Dist r ibut ion Problems
Cont ract Enf orcement
%
§ Labor costs are in relative decline when compared with other developed countries, but still much higher than emerging countries
§ Exchange rate, corporate taxation and tax complexity are problematic for the US
Source: Global Competitiveness Report, 2006
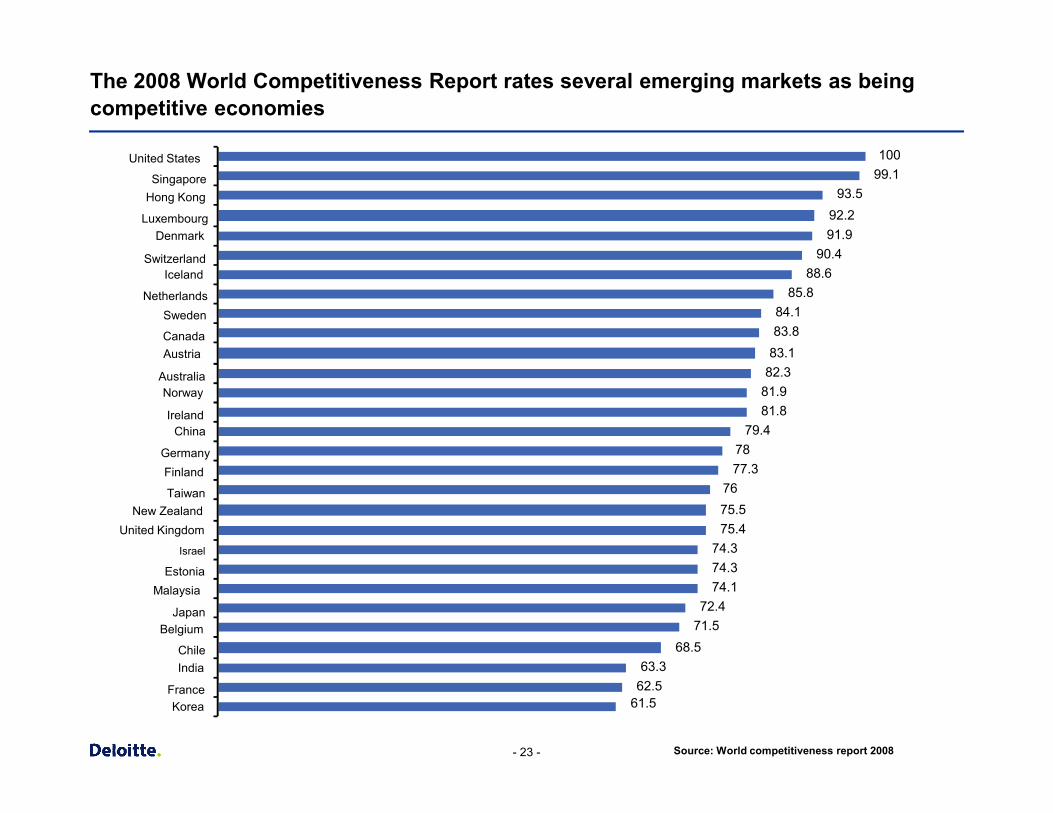
The 2008 World Competitiveness Report rates several emerging markets as being competitive economies
81.881.982.383.183.884.1
85.888.6
90.491.992.2
93.599.1100
Norway
Austria
Sweden
Iceland
Denmark
Hong Kong
United States
Singapore
Luxembourg
Switzerland
Netherlands
Canada
Australia
- 23 - Source: World competitiveness report 2008
61.562.563.3
68.571.572.4
74.174.374.3
75.475.576
77.378
79.481.8
Korea
India
Belgium
Malaysia
Israel
New Zealand
Finland
ChinaIreland
Germany
Taiwan
United Kingdom
Estonia
Japan
Chile
France
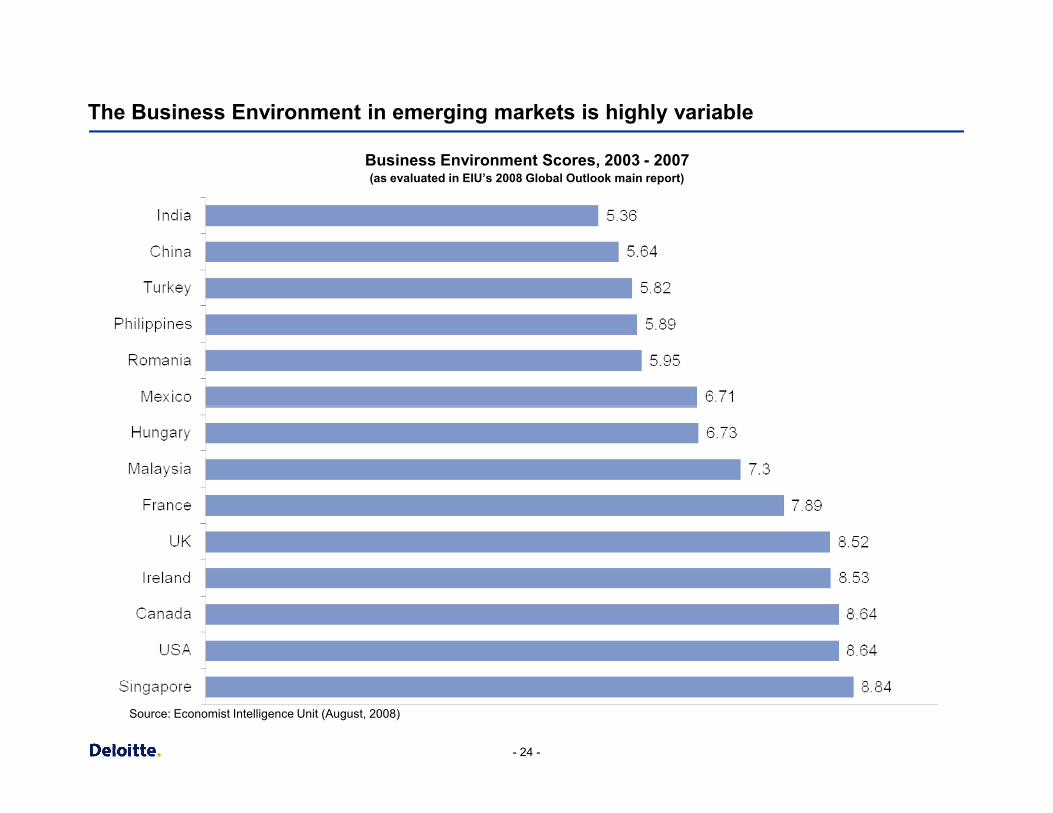
The Business Environment in emerging markets is highly variable
Business Environment Scores, 2003 - 2007(as evaluated in EIU’s 2008 Global Outlook main report)
- 24 -
Source: Economist Intelligence Unit (August, 2008)
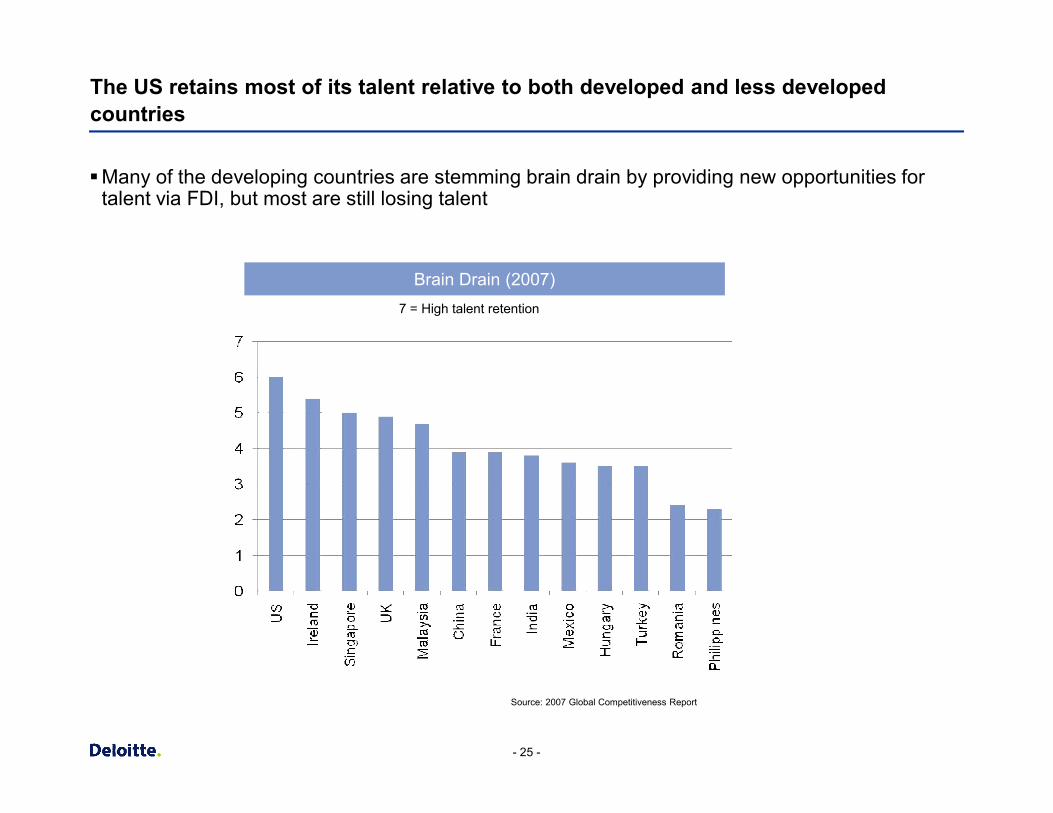
The US retains most of its talent relative to both developed and less developed countries
§Many of the developing countries are stemming brain drain by providing new opportunities for talent via FDI, but most are still losing talent
Brain Drain (2007)7 = High talent retention
- 25 -
Source: 2007 Global Competitiveness Report
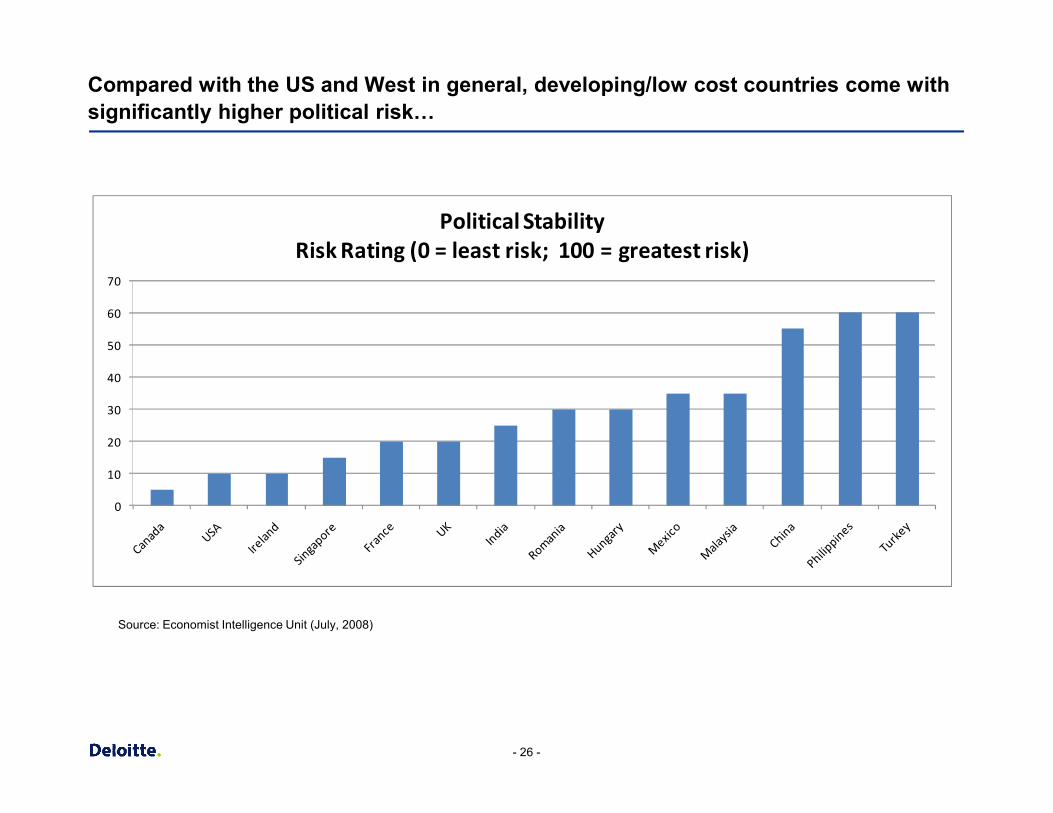
Compared with the US and West in general, developing/low cost countries come with significantly higher political risk…
30
40
50
60
70
Political StabilityRisk Rating (0 = least risk; 100 = greatest risk)
- 26 -
0
10
20
30
Source: Economist Intelligence Unit (July, 2008)
0
1
2
3
4
5
6
7
8
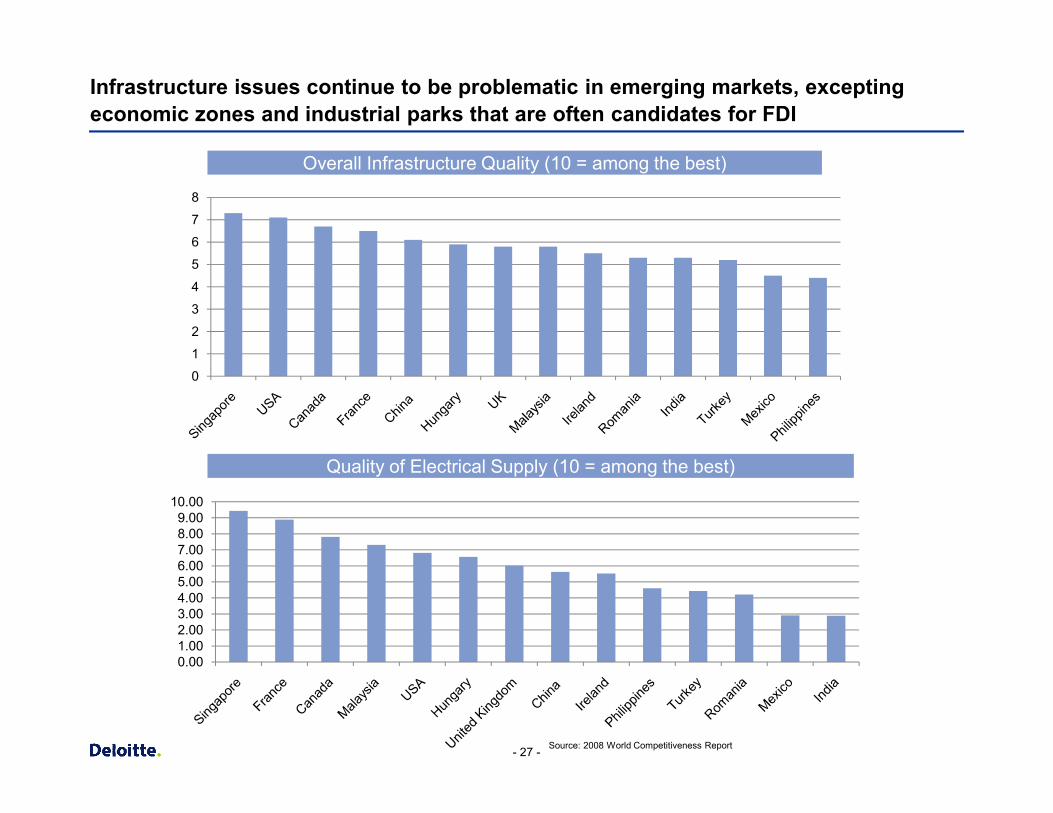
Overall Infrastructure Quality (10 = among the best)
Infrastructure issues continue to be problematic in emerging markets, excepting economic zones and industrial parks that are often candidates for FDI
- 27 -
0.001.002.003.004.005.006.007.008.009.00
10.00
Quality of Electrical Supply (10 = among the best)
Source: 2008 World Competitiveness Report
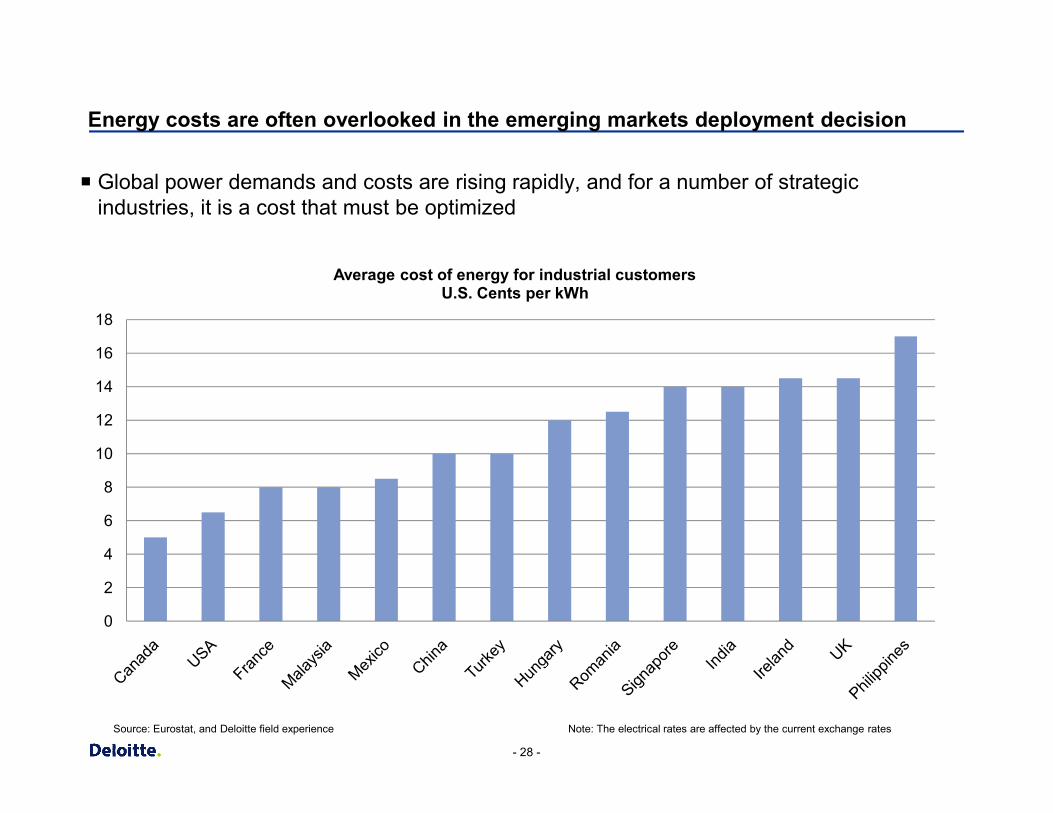
Energy costs are often overlooked in the emerging markets deployment decision
¡ Global power demands and costs are rising rapidly, and for a number of strategic industries, it is a cost that must be optimized
14
16
18
Average cost of energy for industrial customersU.S. Cents per kWh
- 28 -
0
2
4
6
8
10
12
Source: Eurostat, and Deloitte field experience Note: The electrical rates are affected by the current exchange rates
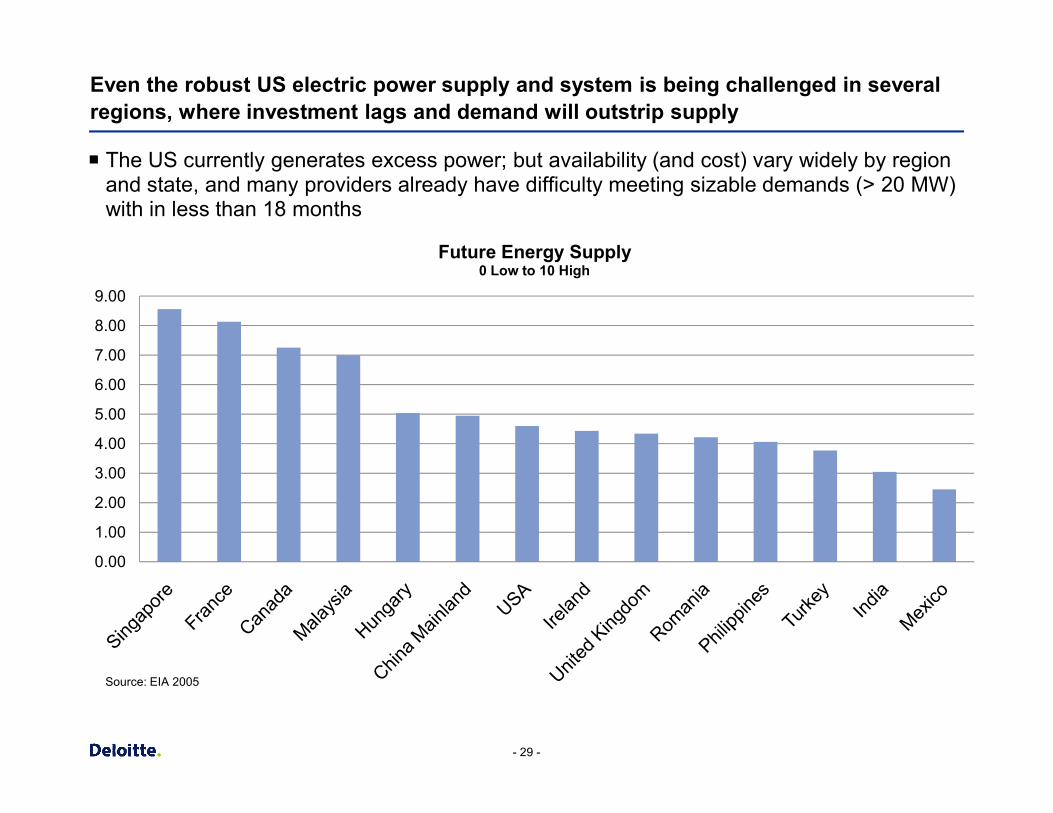
Even the robust US electric power supply and system is being challenged in several regions, where investment lags and demand will outstrip supply
¡ The US currently generates excess power; but availability (and cost) vary widely by region and state, and many providers already have difficulty meeting sizable demands (> 20 MW) with in less than 18 months
5.00
6.00
7.00
8.00
9.00
Future Energy Supply0 Low to 10 High
- 29 -
Source: EIA 2005
0.00
1.00
2.00
3.00
4.00
5.00
Implications for SCO and Site Selection
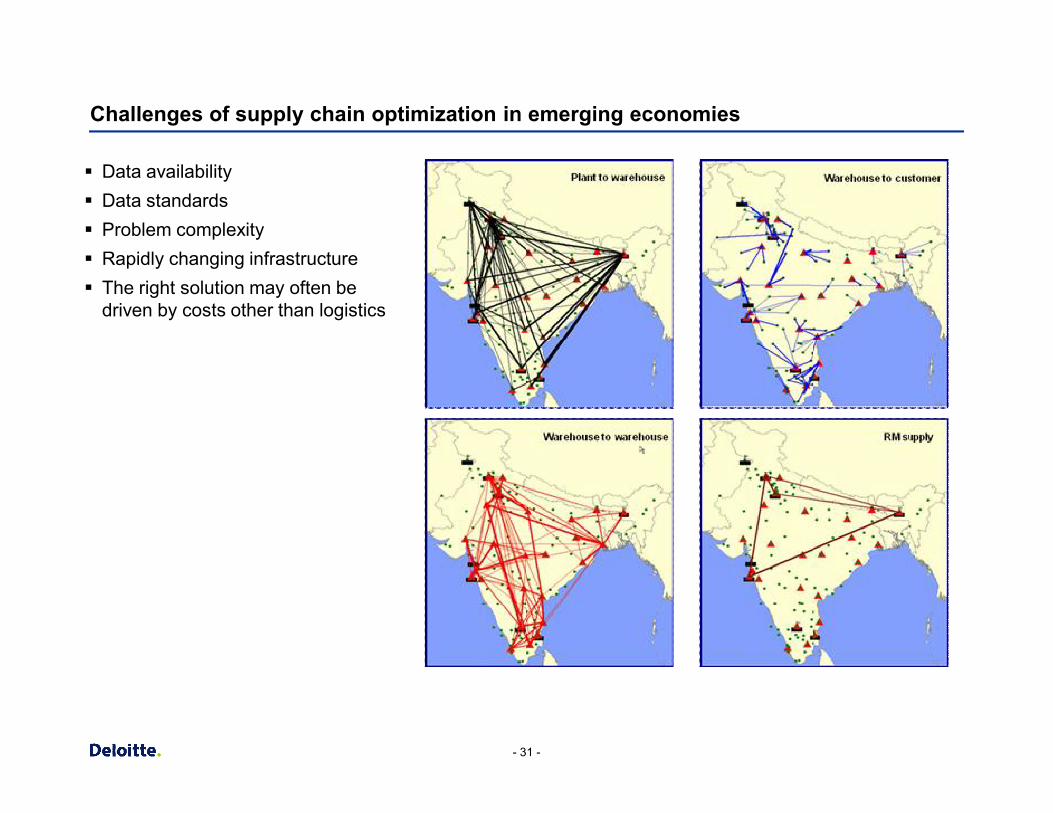
Challenges of supply chain optimization in emerging economies
§ Data availability§ Data standards§ Problem complexity§ Rapidly changing infrastructure§ The right solution may often be
driven by costs other than logistics
- 31 -
Challenges of site selection in emerging economies
§ Often more difficult negotiations§ Language and cultural barriers§ "Unknown" unknowns§ Typical problem areas
§ Transfer pricing§ Payroll taxes§ Corporate structuring§ Labor market (wage escalation, skill availability, language capability, training, local holidays,
cultural norms, etc.)
- 32 -
cultural norms, etc.)§ Customs/duties§ Investment zone reg's (investment density, allowable uses, permitting)§ Wage inflation§ Currency risk§ Repatriation of profits (corporate income tax)§ Supply chain infrastructure§ Unusual local taxes§ Incentives
Taking a total supply chain cost approach
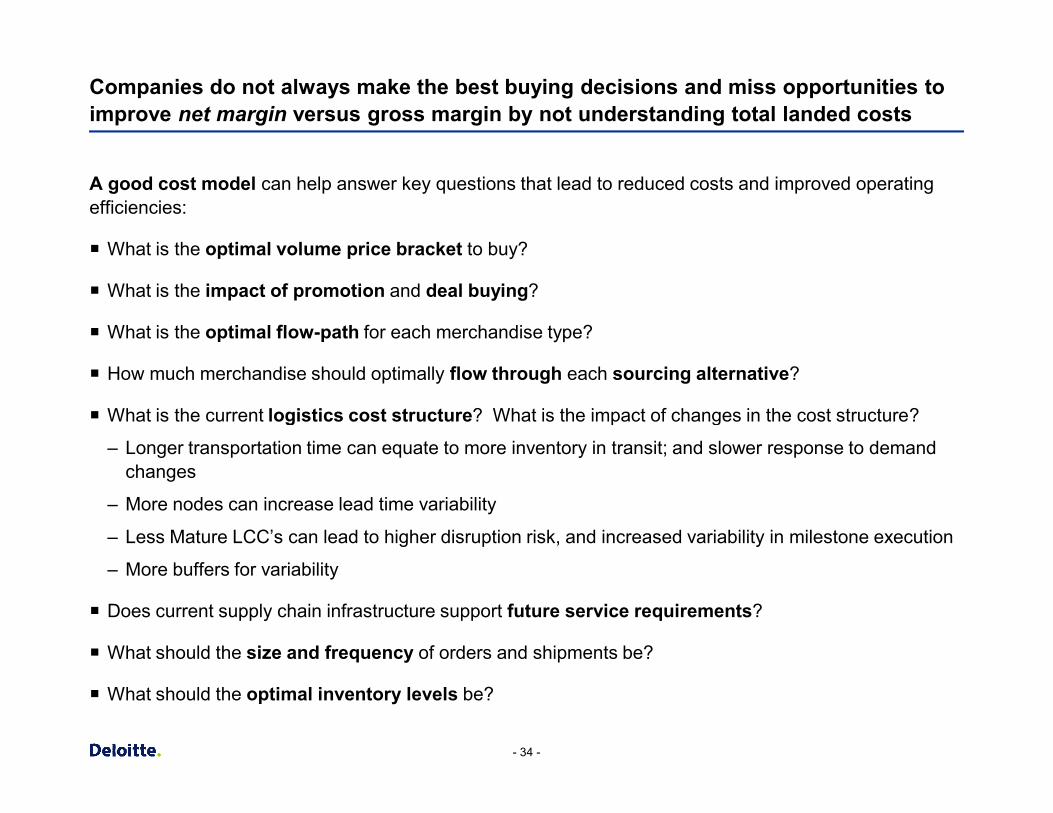
Companies do not always make the best buying decisions and miss opportunities to improve net margin versus gross margin by not understanding total landed costs
A good cost model can help answer key questions that lead to reduced costs and improved operating efficiencies:
¡ What is the optimal volume price bracket to buy?
¡ What is the impact of promotion and deal buying?
¡ What is the optimal flow-path for each merchandise type?
¡ How much merchandise should optimally flow through each sourcing alternative?
¡ What is the current logistics cost structure? What is the impact of changes in the cost structure?
- 34 -
¡ What is the current logistics cost structure? What is the impact of changes in the cost structure?
– Longer transportation time can equate to more inventory in transit; and slower response to demand changes
– More nodes can increase lead time variability
– Less Mature LCC’s can lead to higher disruption risk, and increased variability in milestone execution
– More buffers for variability
¡ Does current supply chain infrastructure support future service requirements?
¡ What should the size and frequency of orders and shipments be?
¡ What should the optimal inventory levels be?
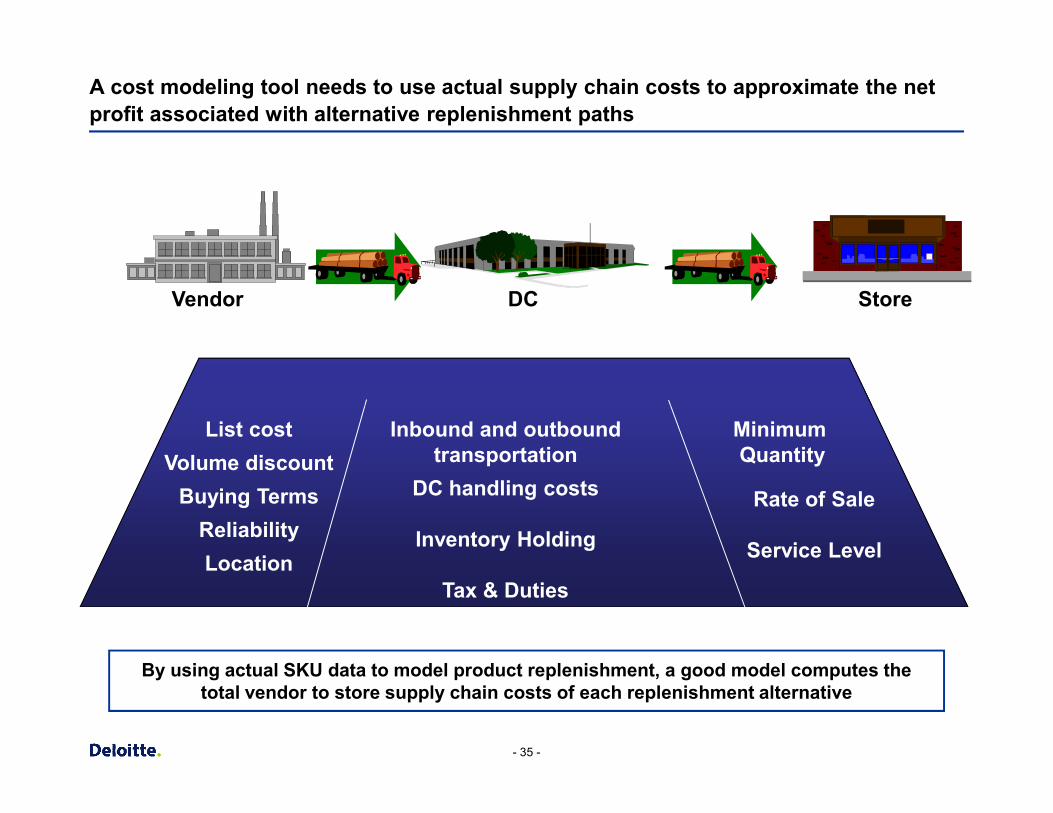
A cost modeling tool needs to use actual supply chain costs to approximate the net profit associated with alternative replenishment paths
StoreVendor DC
- 35 -
List cost Volume discount
Buying TermsReliabilityLocation
Inbound and outbound transportation
DC handling costs
Inventory Holding
Tax & Duties
Rate of Sale
Service Level
MinimumQuantity
By using actual SKU data to model product replenishment, a good model computes the total vendor to store supply chain costs of each replenishment alternative
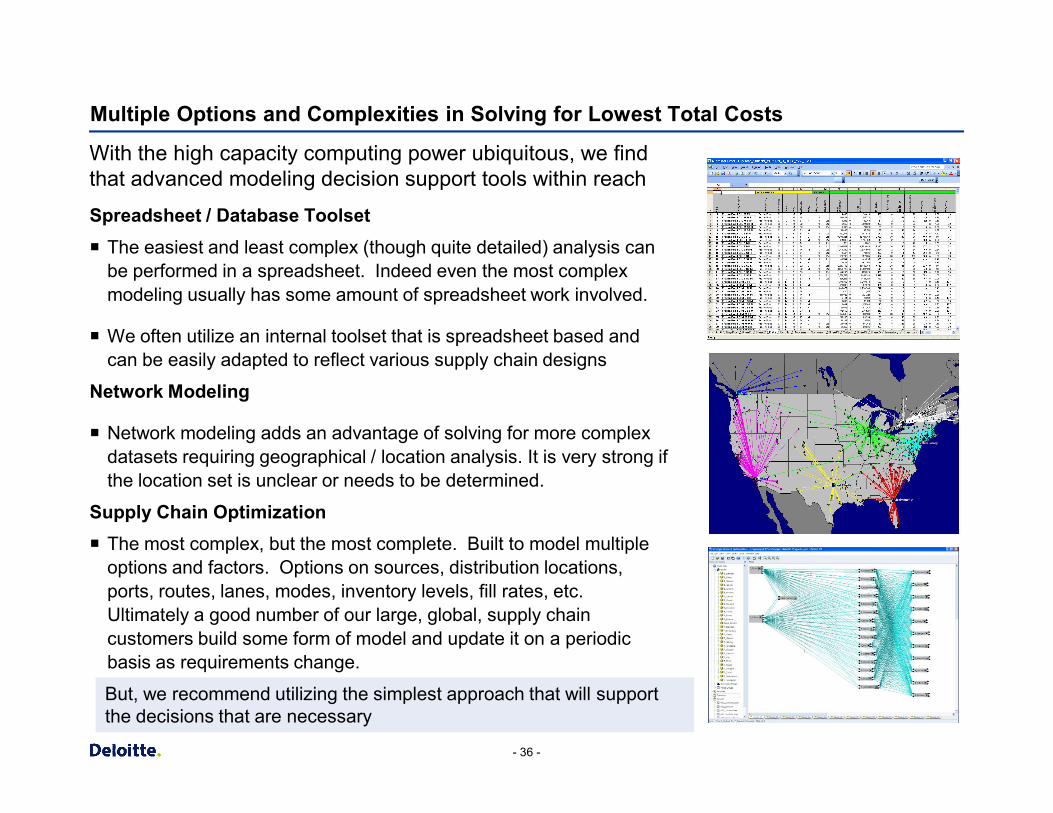
Multiple Options and Complexities in Solving for Lowest Total Costs
Spreadsheet / Database Toolset¡ The easiest and least complex (though quite detailed) analysis can
be performed in a spreadsheet. Indeed even the most complex modeling usually has some amount of spreadsheet work involved.
¡ We often utilize an internal toolset that is spreadsheet based and can be easily adapted to reflect various supply chain designs
Network Modeling
With the high capacity computing power ubiquitous, we find that advanced modeling decision support tools within reach
- 36 -
¡ Network modeling adds an advantage of solving for more complex datasets requiring geographical / location analysis. It is very strong if the location set is unclear or needs to be determined.
Supply Chain Optimization¡ The most complex, but the most complete. Built to model multiple
options and factors. Options on sources, distribution locations, ports, routes, lanes, modes, inventory levels, fill rates, etc. Ultimately a good number of our large, global, supply chain customers build some form of model and update it on a periodic basis as requirements change.
But, we recommend utilizing the simplest approach that will support the decisions that are necessary
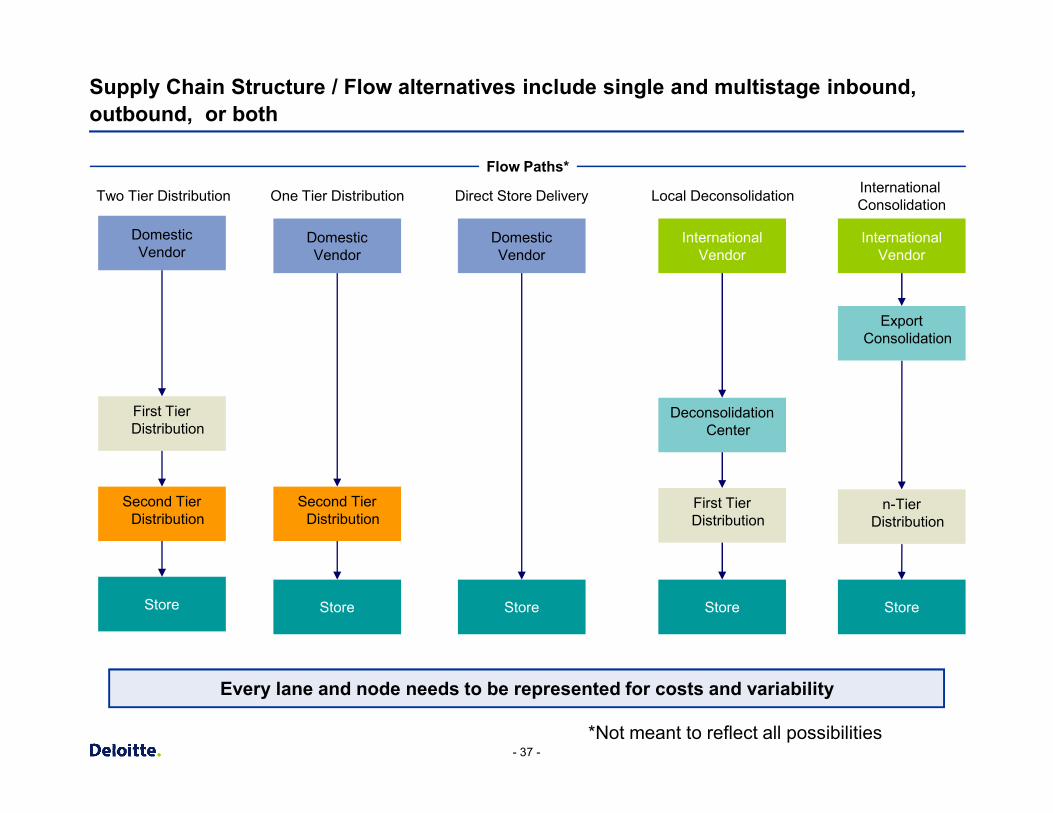
Supply Chain Structure / Flow alternatives include single and multistage inbound, outbound, or both
Flow Paths*
Domestic Vendor
First Tier
Two Tier Distribution
Domestic Vendor
One Tier Distribution
Domestic Vendor
Direct Store Delivery
International Vendor
Deconsolidation
Local Deconsolidation
International Vendor
Export Consolidation
International Consolidation
- 37 -
Every lane and node needs to be represented for costs and variability
First Tier Distribution
Second Tier Distribution
Store
Second Tier Distribution
Store Store
Deconsolidation Center
First Tier Distribution
Store
n-Tier Distribution
Store
*Not meant to reflect all possibilities
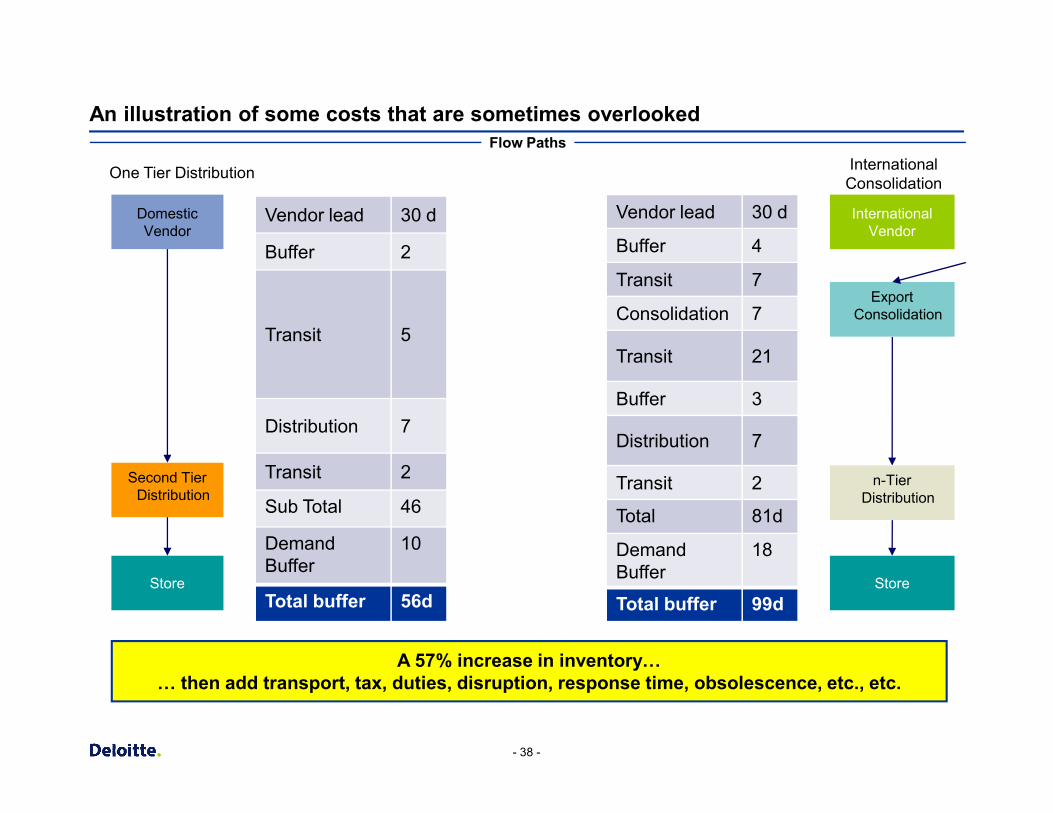
An illustration of some costs that are sometimes overlookedFlow Paths
Domestic Vendor
One Tier Distribution
International Vendor
Export Consolidation
International Consolidation
Vendor lead 30 d
Buffer 4
Transit 7
Consolidation 7
Transit 21
Buffer 3
Vendor lead 30 d
Buffer 2
Transit 5
- 38 -
A 57% increase in inventory… … then add transport, tax, duties, disruption, response time, obsolescence, etc., etc.
Second Tier Distribution
Store
n-Tier Distribution
Store
Buffer 3
Distribution 7
Transit 2
Total 81d
Demand Buffer
18
Total buffer 99d
Distribution 7
Transit 2
Sub Total 46
Demand Buffer
10
Total buffer 56d
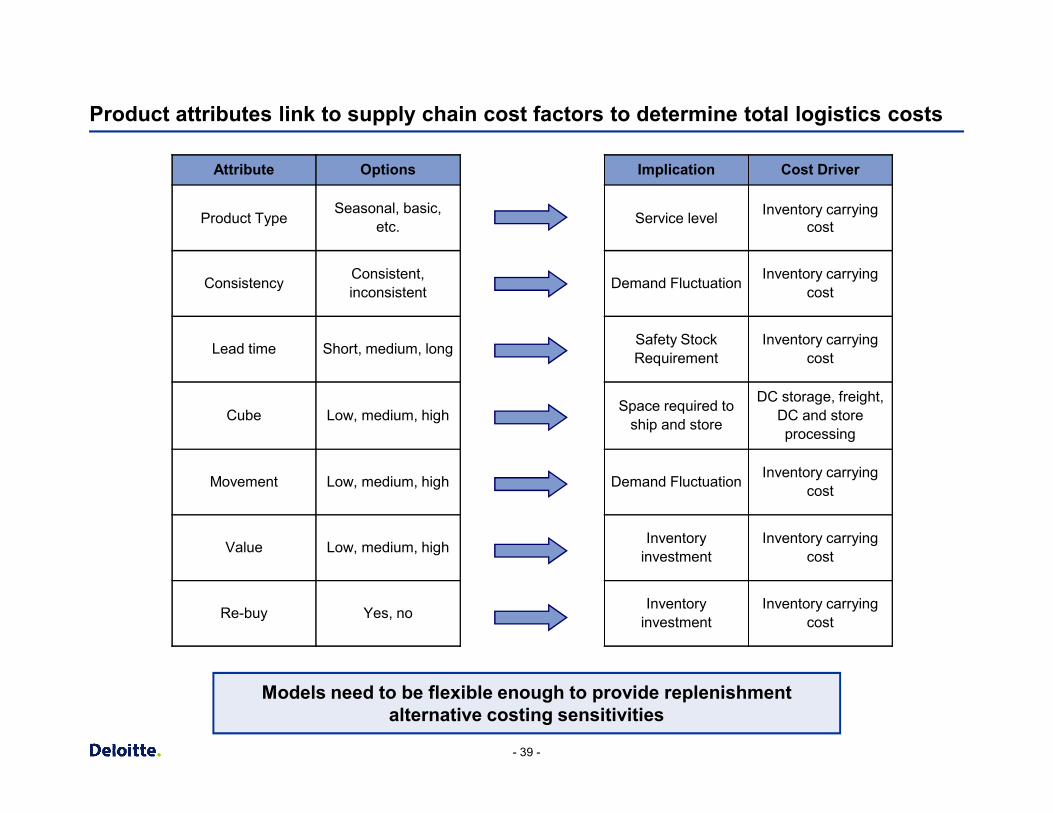
Product attributes link to supply chain cost factors to determine total logistics costs
Attribute Options Implication Cost Driver
Product TypeSeasonal, basic,
etc. Service level Inventory carrying cost
Consistency Consistent, inconsistent Demand Fluctuation Inventory carrying
cost
Lead time Short, medium, long Safety Stock Requirement
Inventory carrying cost
Space required to DC storage, freight,
- 39 -
Cube Low, medium, high Space required to ship and store DC and store
processing
Movement Low, medium, high Demand Fluctuation Inventory carrying cost
Value Low, medium, high Inventory investment
Inventory carrying cost
Re-buy Yes, no Inventory investment
Inventory carrying cost
Models need to be flexible enough to provide replenishment alternative costing sensitivities
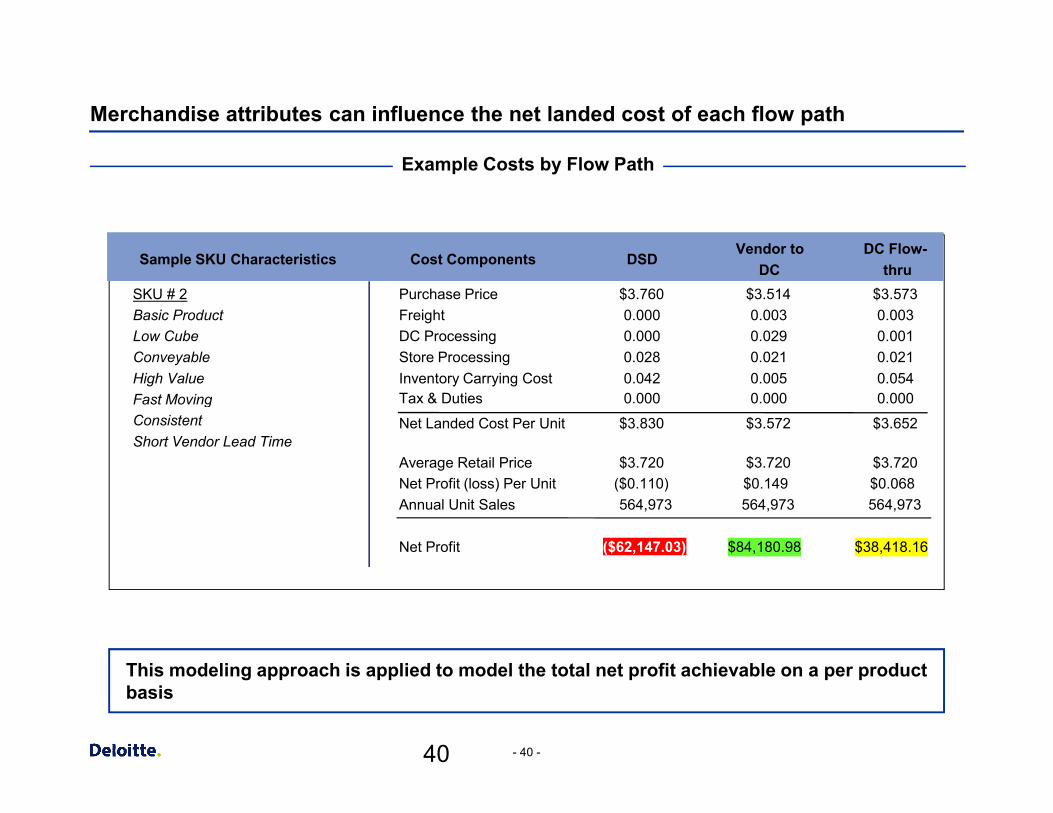
Merchandise attributes can influence the net landed cost of each flow path
Sample SKU Characteristics Cost Components DSDVendor to
DCDC Flow-
thruSKU # 2 Purchase Price $3.760 $3.514 $3.573Basic Product Freight 0.000 0.003 0.003Low Cube DC Processing 0.000 0.029 0.001Conveyable Store Processing 0.028 0.021 0.021High Value Inventory Carrying Cost 0.042 0.005 0.054Fast Moving
Example Costs by Flow Path
Tax & Duties 0.000 0.000 0.000
- 40 -40
This modeling approach is applied to model the total net profit achievable on a per product basis
Fast MovingNet Landed Cost Per Unit $3.830 $3.572 $3.652Consistent
Short Vendor Lead TimeAverage Retail Price $3.720 $3.720 $3.720Net Profit (loss) Per Unit ($0.110) $0.149 $0.068Annual Unit Sales 564,973 564,973 564,973
Net Profit ($62,147.03) $84,180.98 $38,418.16
Tax & Duties 0.000 0.000 0.000
Wrap-up and Discussion
§ Watch your step
§ Know the landscape
§ Build a cross-functional team to get it done
§ Take a total supply chain cost approach
- 41 -

Copyright © 2009 Deloitte Development LLC. All rights reserved.