when should i use simulation? - institute of industrial ... 11-5-2013.pdf · manufacturing...
TRANSCRIPT
When should I use simulation?
Prof. Brian Harrington
Introductions
Brittany Hagedorn, MBA, CSSBB
- SIMUL8’s Healthcare Lead for North America
- Experienced Six Sigma Blackbelt and Healthcare Consultant
- Here to answer your questions at the end
Introductions
Brian Harrington, CSSBB
- 20 years in simulation at Ford Motor Company
- Experienced Six Sigma Blackbelt and Manufacturing Consultant
- Teaches Stochastic Systems at Wayne State University
- Our presenter for today
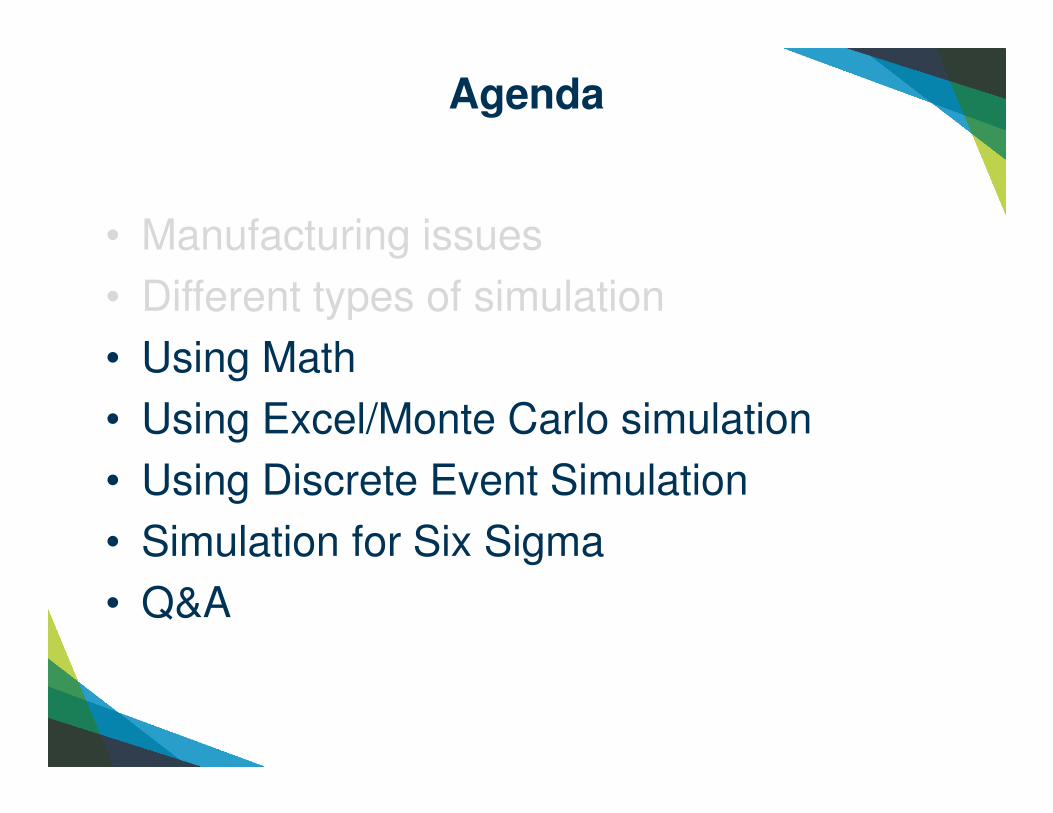
Agenda
• Manufacturing issues
• Different types of simulation
• Using Math
• Using Excel/Monte Carlo simulation
• Using Discrete Event Simulation
• Simulation for Six Sigma
• Q&A
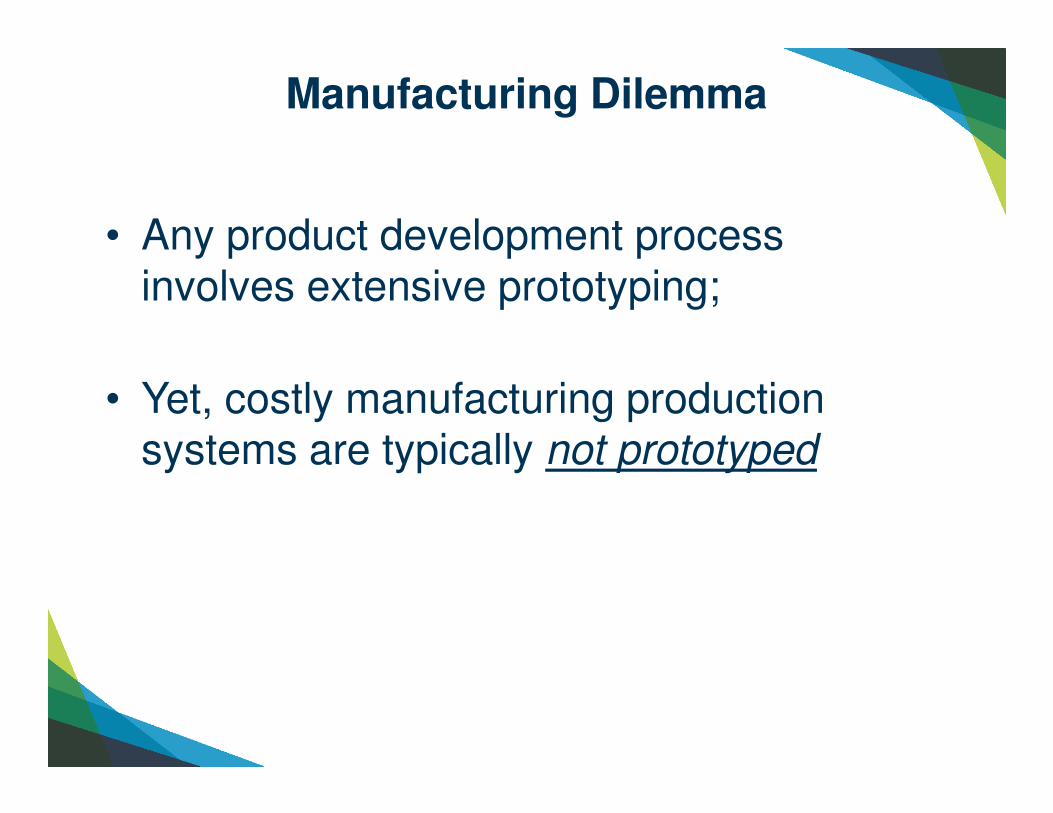
Manufacturing Dilemma
• Any product development process involves extensive prototyping;
• Yet, costly manufacturing production systems are typically not prototyped

Simulation in Manufacturing
• System Design
• Operational Procedures
• Performance Evaluation

System Design
• Plant Layout
• Effects of introducing new equipment
• Location and sizing of inventory buffers
• Location of inspection stations
• Optimal number of carriers, pallets
• Resource planning
• Protective capacity planning
Biggest Bang for the Dollar! Contains Operational Procedures &
Performance Metrics.
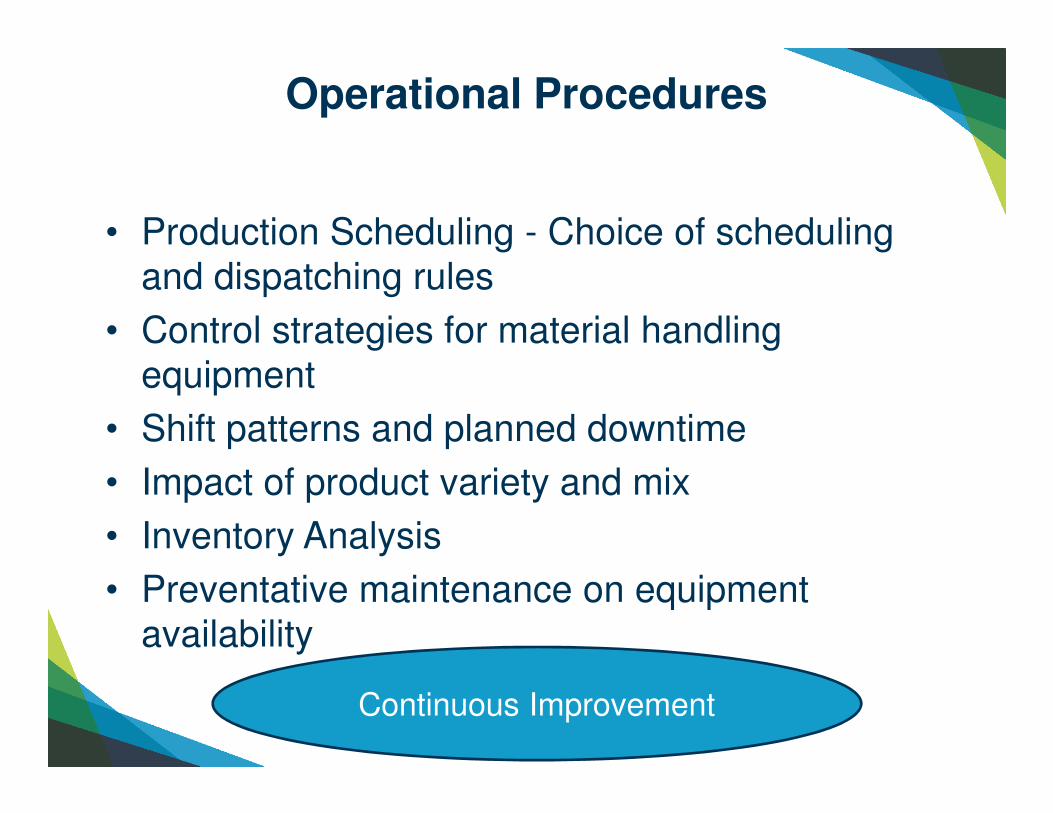
Operational Procedures
• Production Scheduling - Choice of scheduling and dispatching rules
• Control strategies for material handling equipment
• Shift patterns and planned downtime
• Impact of product variety and mix
• Inventory Analysis
• Preventative maintenance on equipment availability
Continuous Improvement
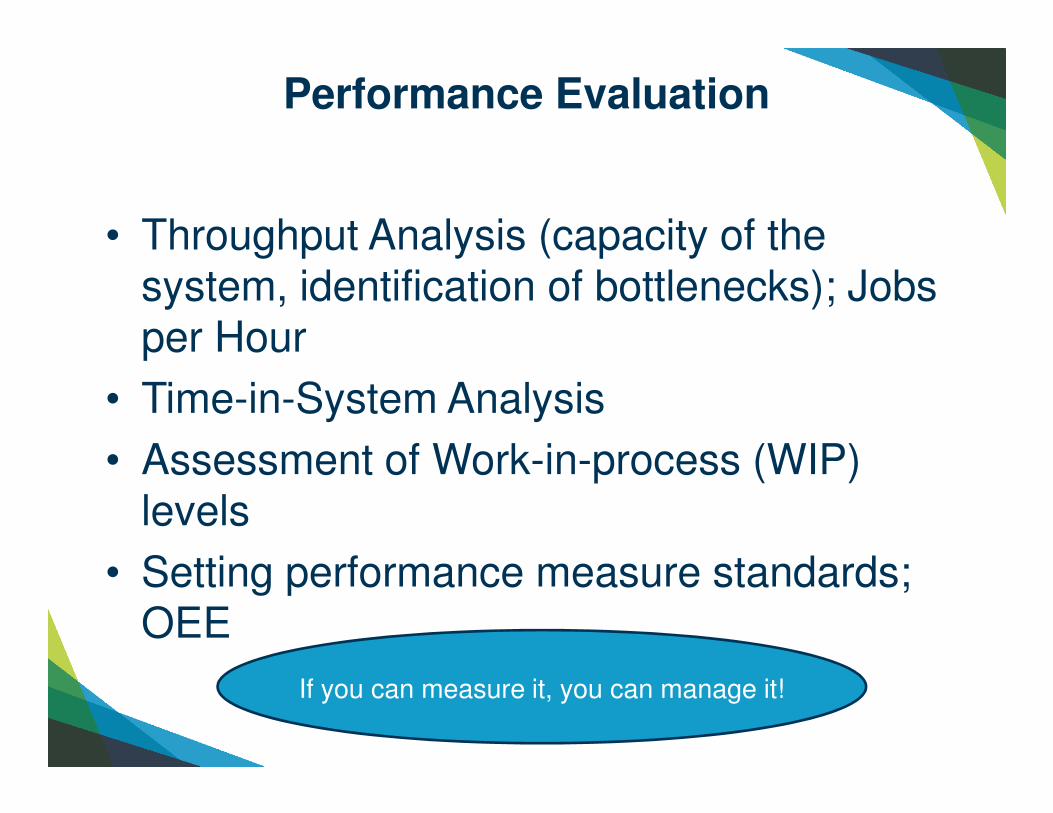
Performance Evaluation
• Throughput Analysis (capacity of the system, identification of bottlenecks); Jobs per Hour
• Time-in-System Analysis
• Assessment of Work-in-process (WIP) levels
• Setting performance measure standards; OEE
If you can measure it, you can manage it!
Agenda
• Manufacturing issues
• Different types of simulation
• Using Math
• Using Excel/Monte Carlo simulation
• Using Discrete Event Simulation
• Simulation for Six Sigma
• Q&A

Why Simulation?
• Competition drives the following:
• Leaner production environment
• Shorter product development cycles
• Narrower profit margins
• Flexible Manufacturing (1 Facility, 1 Process, Multiple Models)

Types of Simulation
• Mathematical Modeling
– e.g. Queuing Theory
• Monte Carlo Simulation
– e.g. Excel based models
• Discrete Event Simulation
– e.g. Using simulation software
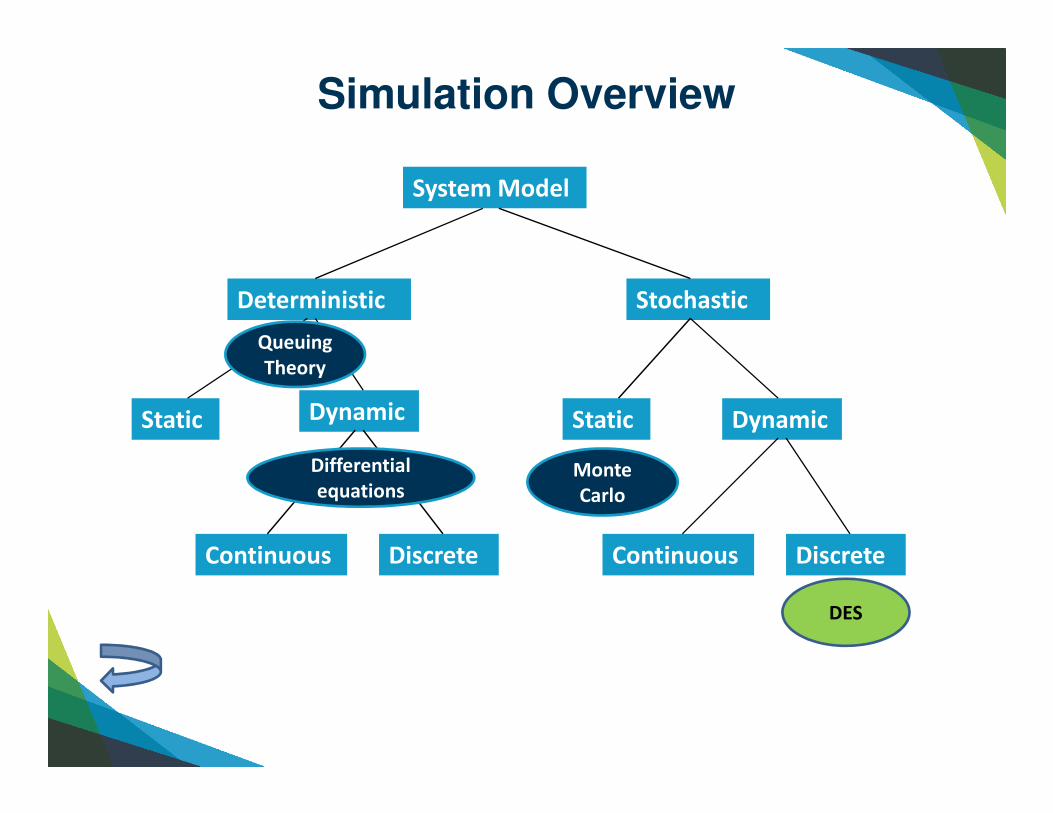
Simulation Overview
System Model
Deterministic Stochastic
Static Dynamic Static Dynamic
Continuous ContinuousDiscrete Discrete
DES
Monte
Carlo
Differential
equations
Queuing
Theory
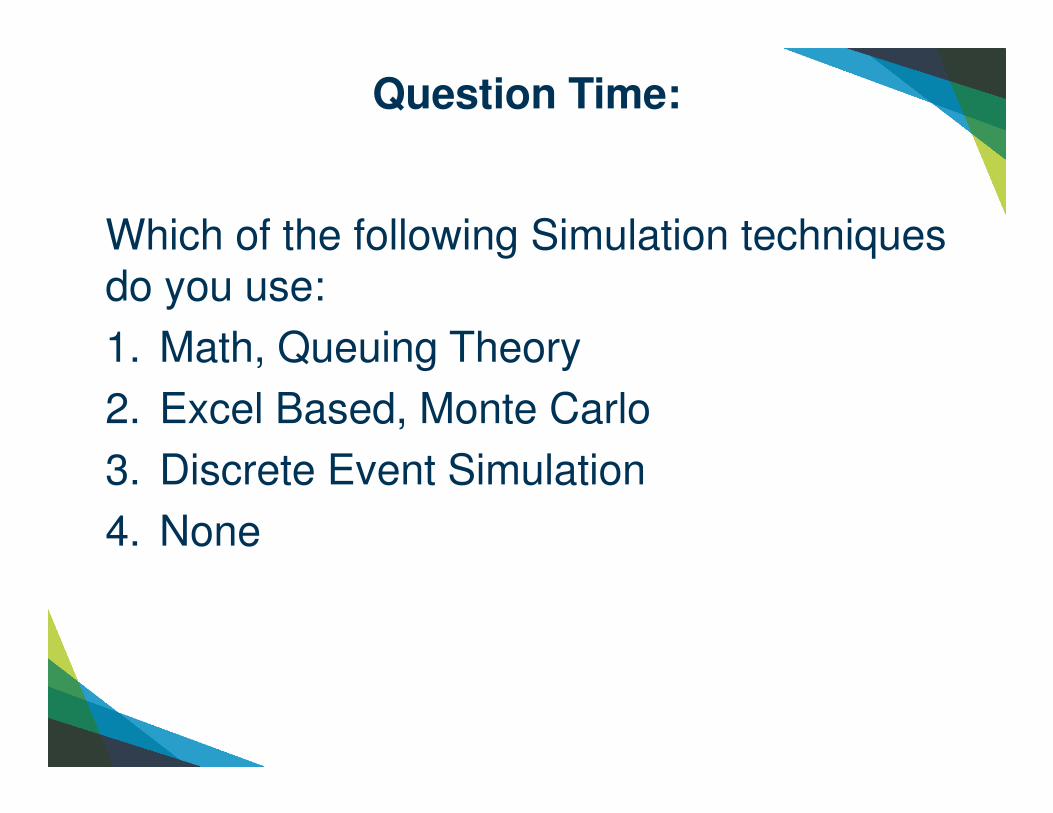
Question Time:
Which of the following Simulation techniques do you use:
1. Math, Queuing Theory
2. Excel Based, Monte Carlo
3. Discrete Event Simulation
4. None
Agenda
• Manufacturing issues
• Different types of simulation
• Using Math
• Using Excel/Monte Carlo simulation
• Using Discrete Event Simulation
• Simulation for Six Sigma
• Q&A
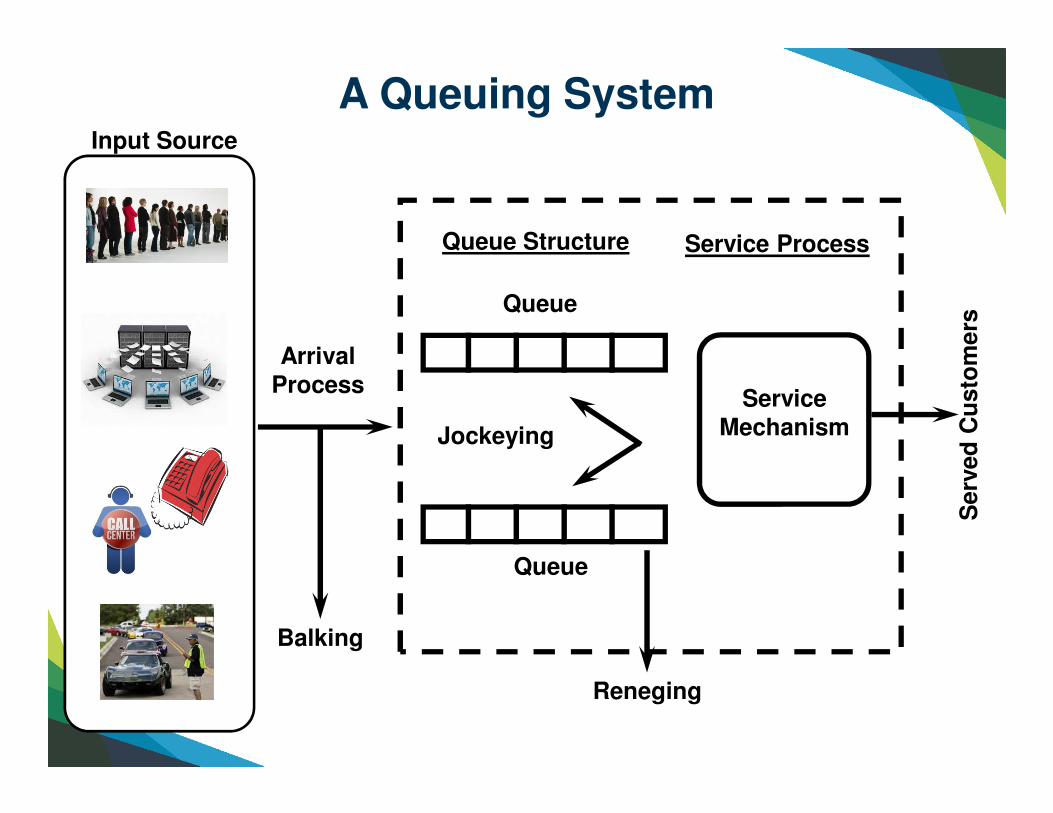
A Queuing System
Jockeying
Queue
Queue
Reneging
ServiceMechanism
Queue Structure Service Process
ArrivalProcess
Balking
Serv
ed
Cu
sto
mers
Input Source
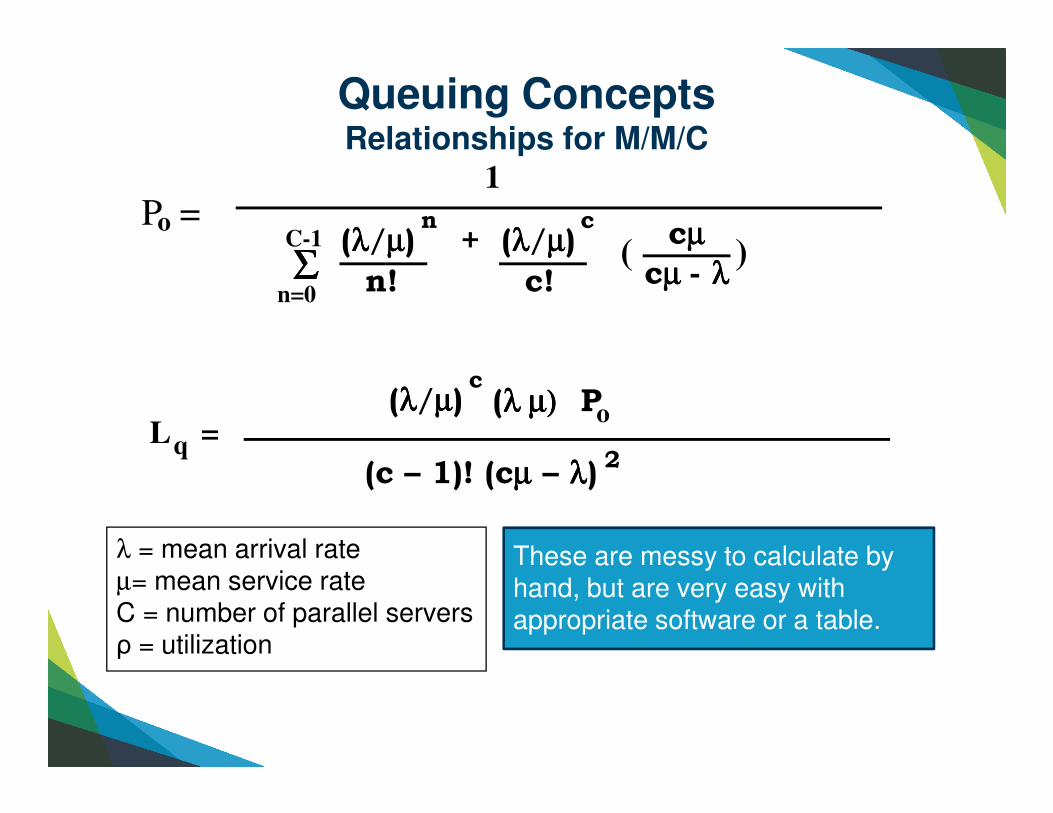
Queuing ConceptsRelationships for M/M/C
P = o
1
ΣΣΣΣn=0
C-1 (λλλλ/µµµµ)n
n!
c+ (λλλλ/µµµµ)
c!( )cµµµµ
cµ µ µ µ - λλλλ
L = q
(λλλλ/µµµµ)
2
c(λ µ)λ µ)λ µ)λ µ) oP
(c – 1)! (cµµµµ – λλλλ)
λ = mean arrival rateµ= mean service rateC = number of parallel serversρ = utilization
These are messy to calculate by hand, but are very easy with appropriate software or a table.
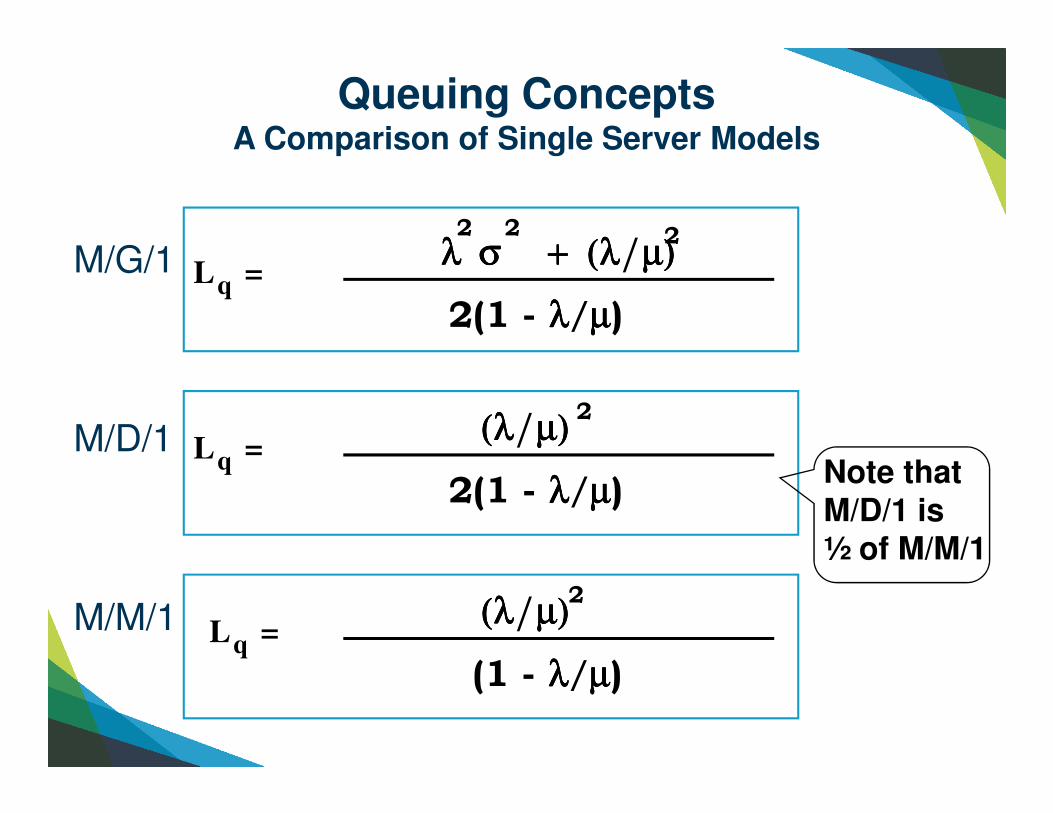
Queuing ConceptsA Comparison of Single Server Models
L = q
2(1 - λλλλ/µµµµ)
2λ λ λ λ σ + (λσ + (λσ + (λσ + (λ/µ)µ)µ)µ)
22
L = q
2(1 - λλλλ/µµµµ)
2(λ(λ(λ(λ/µ)µ)µ)µ)
L = q
(1 - λλλλ/µµµµ)
(λ(λ(λ(λ/µ)µ)µ)µ)2
M/G/1
M/D/1
M/M/1
Note that M/D/1 is ½ of M/M/1
Benefits & Common Uses
Proven mathematical models of queuing behavior; the underlying framework of more comprehensive models.
• Computer Networks – data buffering before loss of data transmission
• Healthcare – optimizing staffing levels according to patient arrivals
• Traffic & Parking lots – Traffic lights, toll booths
• Service Industry – Number of servers, check-outs, lanes, ATM machines, etc
Limitations on Queuing Models
• What if:
– we don’t have one of these basic models?
– we have a complex system that has segments of these basic models and has other segments that do not conform to these basic models?
• Then – simulate!
Agenda
• Manufacturing issues
• Different types of simulation
• Using Math
• Using Excel/Monte Carlo simulation
• Using Discrete Event Simulation
• Simulation for Six Sigma
• Q&A
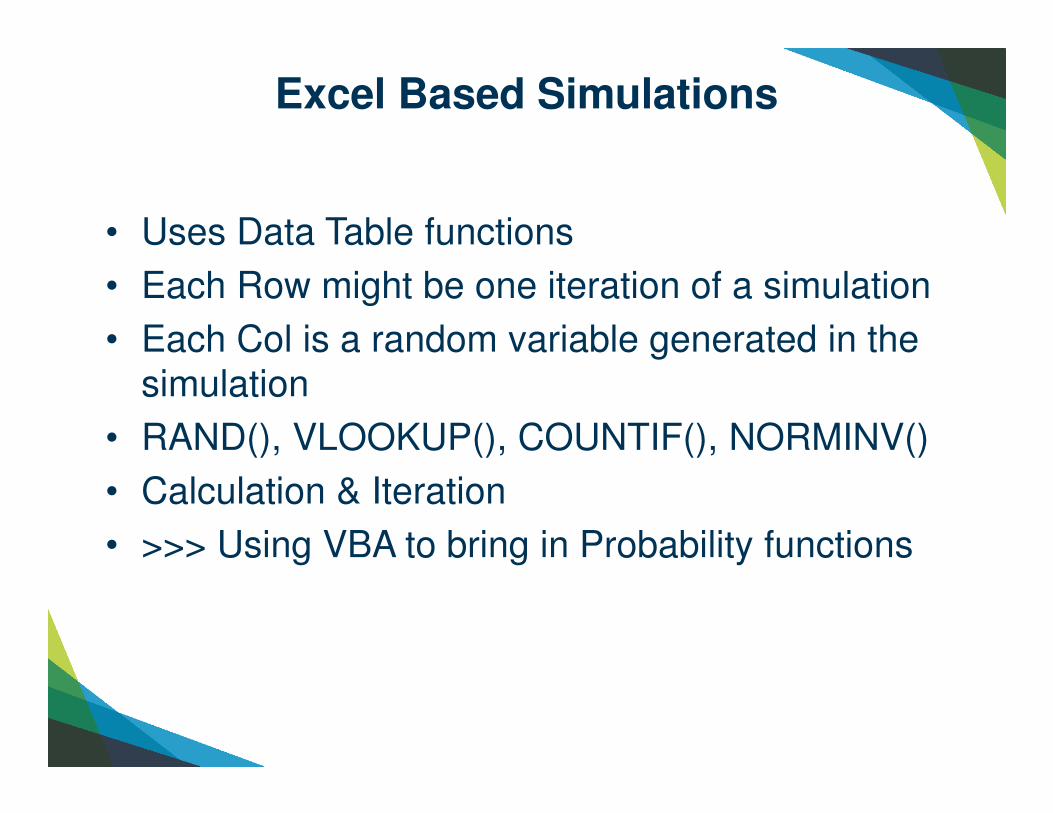
Excel Based Simulations
• Uses Data Table functions
• Each Row might be one iteration of a simulation
• Each Col is a random variable generated in the simulation
• RAND(), VLOOKUP(), COUNTIF(), NORMINV()
• Calculation & Iteration
• >>> Using VBA to bring in Probability functions

Monte Carlo Simulation
• Named after the gaming tables of Monte Carlo
• Also referred to as a Static Simulation Model in that it is a representation of a system at a particular point in time
• In contrast, a Dynamic Simulation is a representation of a system as it evolves over time
• Might be accomplished using Excel and the Random()
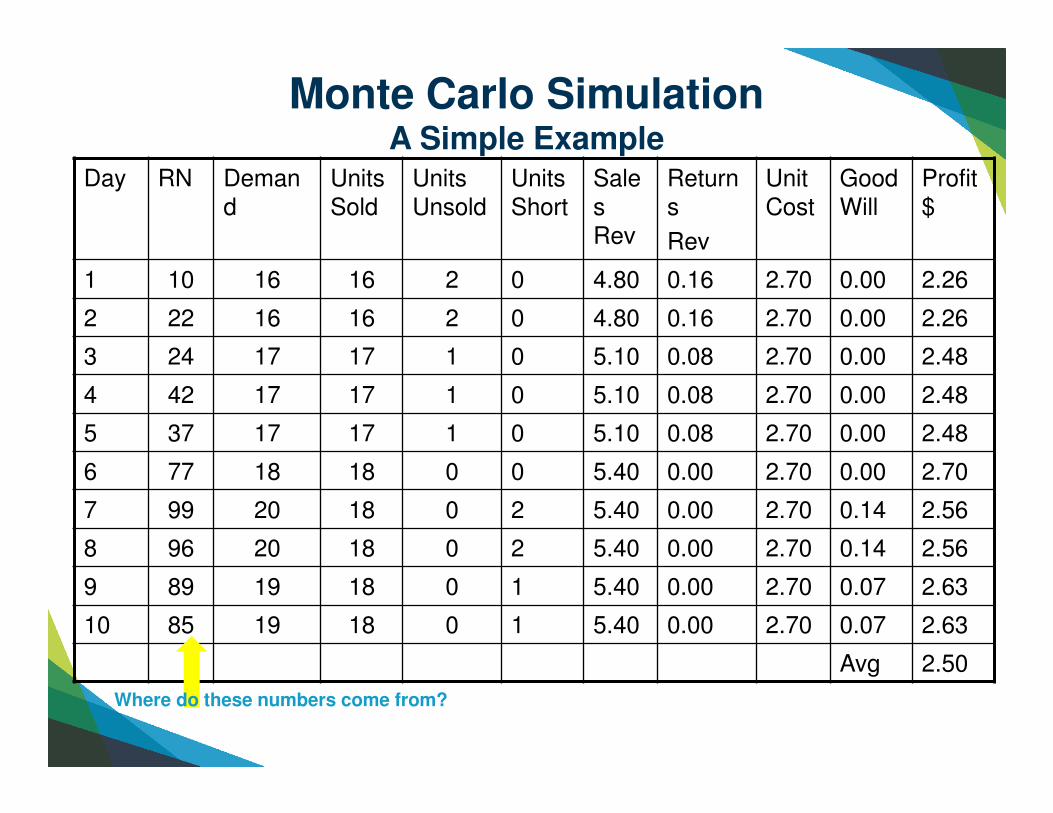
Monte Carlo SimulationA Simple Example
Day RN Demand
UnitsSold
Units Unsold
Units Short
Sales Rev
Returns
Rev
Unit Cost
Good Will
Profit $
1 10 16 16 2 0 4.80 0.16 2.70 0.00 2.26
2 22 16 16 2 0 4.80 0.16 2.70 0.00 2.26
3 24 17 17 1 0 5.10 0.08 2.70 0.00 2.48
4 42 17 17 1 0 5.10 0.08 2.70 0.00 2.48
5 37 17 17 1 0 5.10 0.08 2.70 0.00 2.48
6 77 18 18 0 0 5.40 0.00 2.70 0.00 2.70
7 99 20 18 0 2 5.40 0.00 2.70 0.14 2.56
8 96 20 18 0 2 5.40 0.00 2.70 0.14 2.56
9 89 19 18 0 1 5.40 0.00 2.70 0.07 2.63
10 85 19 18 0 1 5.40 0.00 2.70 0.07 2.63
Avg 2.50
Where do these numbers come from?

Benefits & Common Uses
Proven technique that captures random behavior (at a specific point in time); can go further than mathematical solutions.
• Business risk assessment
– Demand & Profit
• Sizing of a market place
– Consumption rate
• Project schedules (best case, worst case)
Limitations & Disadvantages
• Stochastic, but static! Usually the time evolution of a manufacturing system is significant!
• Excel based models, soon start to use VBA, and become very complicated
• Might require 1000’s of iterations; Data Tables become slow
• Difficult to communicate results to management.
Agenda
• Manufacturing issues
• Different types of simulation
• Using Math
• Using Excel/Monte Carlo simulation
• Using Discrete Event Simulation
• Simulation for Six Sigma
• Q&A
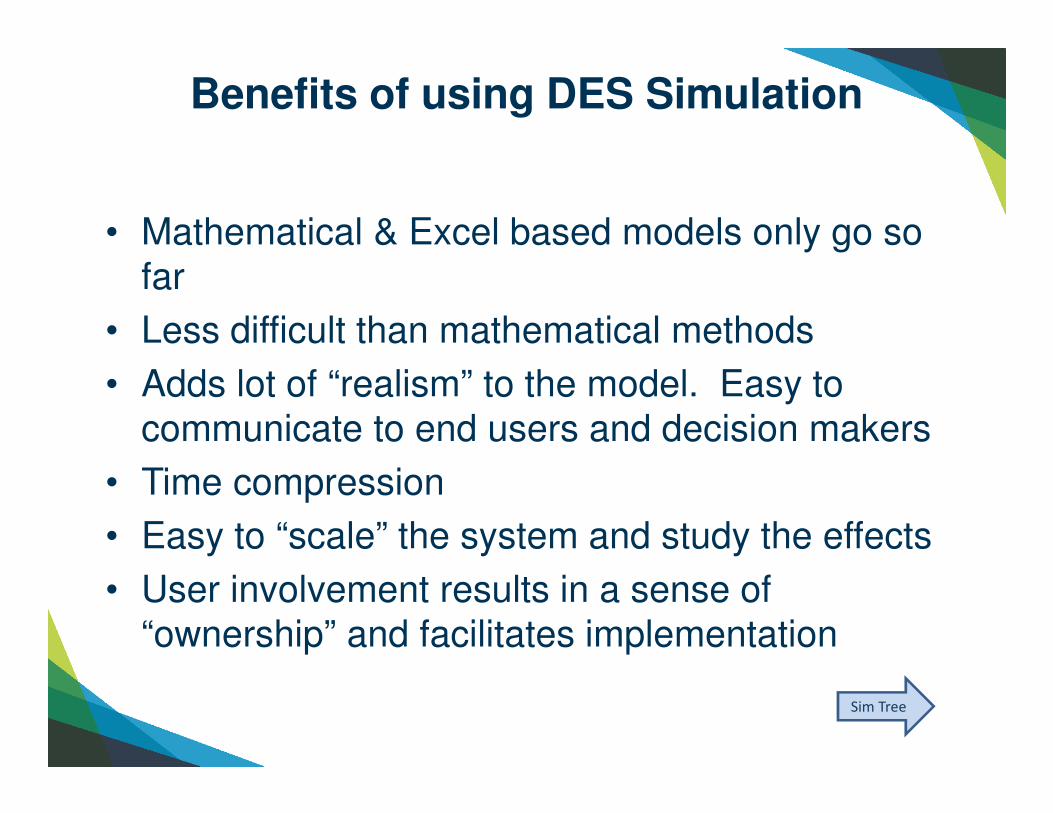
Benefits of using DES Simulation
• Mathematical & Excel based models only go so far
• Less difficult than mathematical methods
• Adds lot of “realism” to the model. Easy to communicate to end users and decision makers
• Time compression
• Easy to “scale” the system and study the effects
• User involvement results in a sense of “ownership” and facilitates implementation
Sim Tree
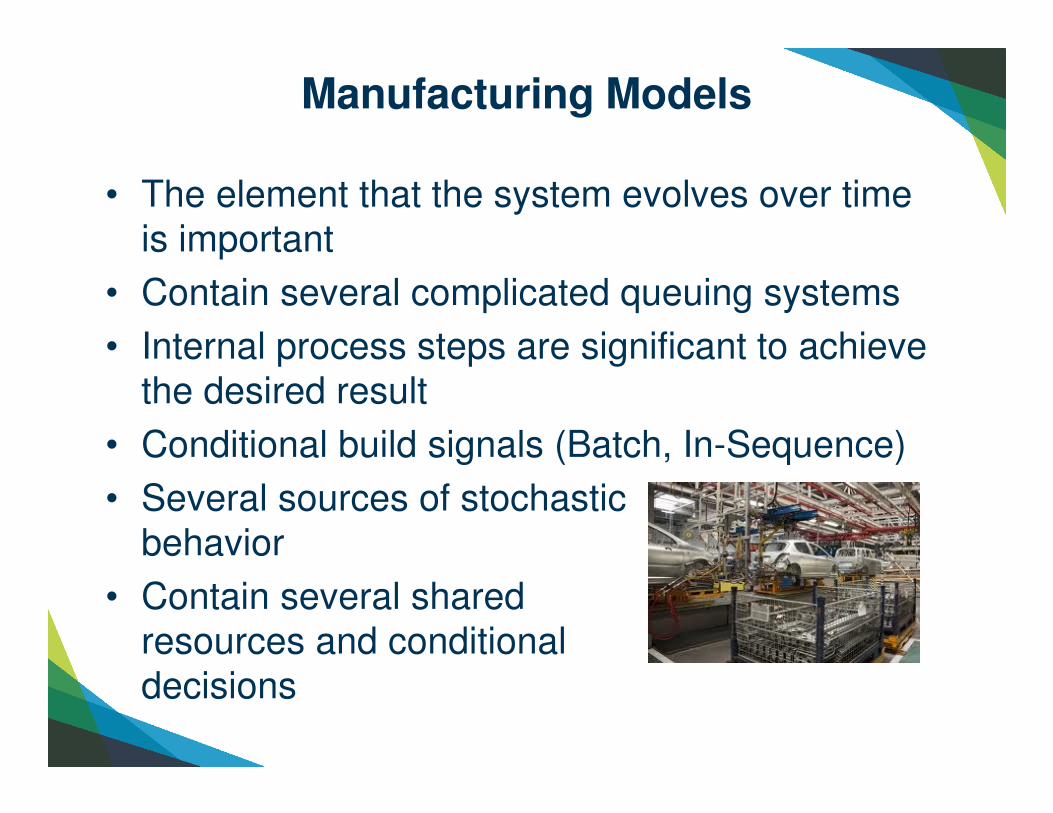
Manufacturing Models
• The element that the system evolves over time is important
• Contain several complicated queuing systems
• Internal process steps are significant to achieve the desired result
• Conditional build signals (Batch, In-Sequence)
• Several sources of stochastic behavior
• Contain several shared resources and conditional decisions
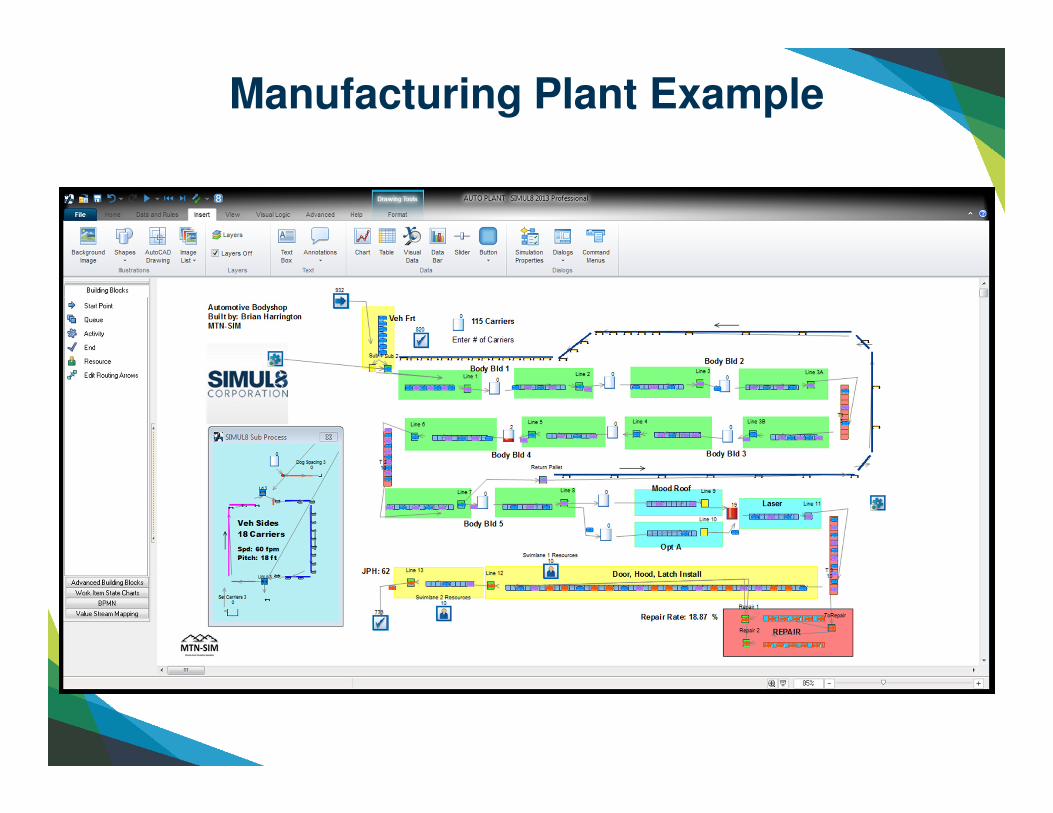
Manufacturing Plant Example
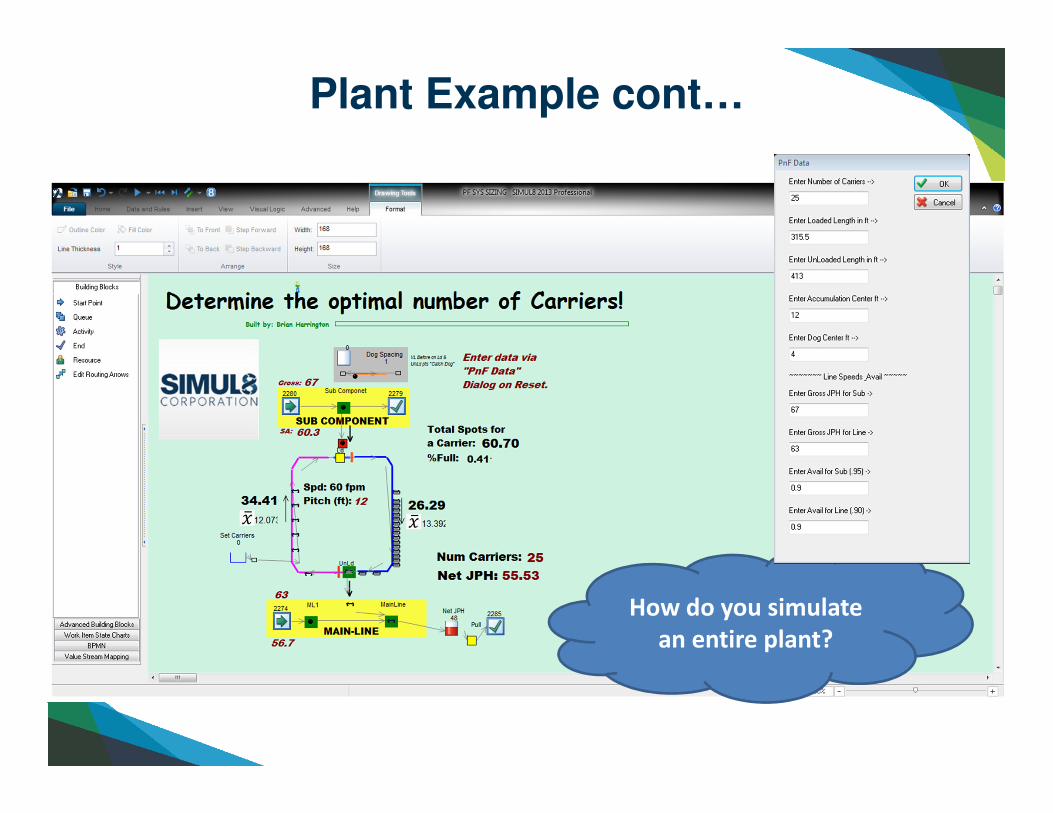
Plant Example cont…
How do you simulate
an entire plant?

DES Building Blocks
The 8 Core Building Blocks: Start Point, Queue, Activity, Conveyor, Resource, and End Point. Then the Logical aspect Labels & Conditional Statements.
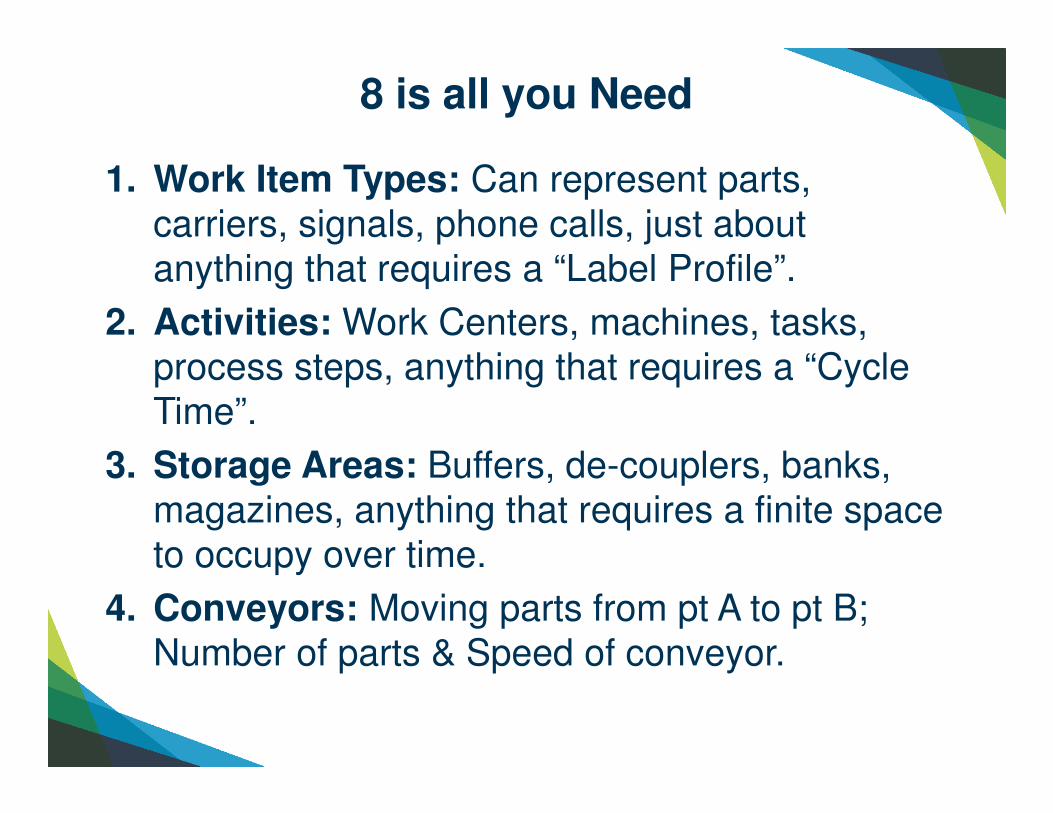
8 is all you Need
1. Work Item Types: Can represent parts, carriers, signals, phone calls, just about anything that requires a “Label Profile”.
2. Activities: Work Centers, machines, tasks, process steps, anything that requires a “Cycle Time”.
3. Storage Areas: Buffers, de-couplers, banks, magazines, anything that requires a finite space to occupy over time.
4. Conveyors: Moving parts from pt A to pt B; Number of parts & Speed of conveyor.
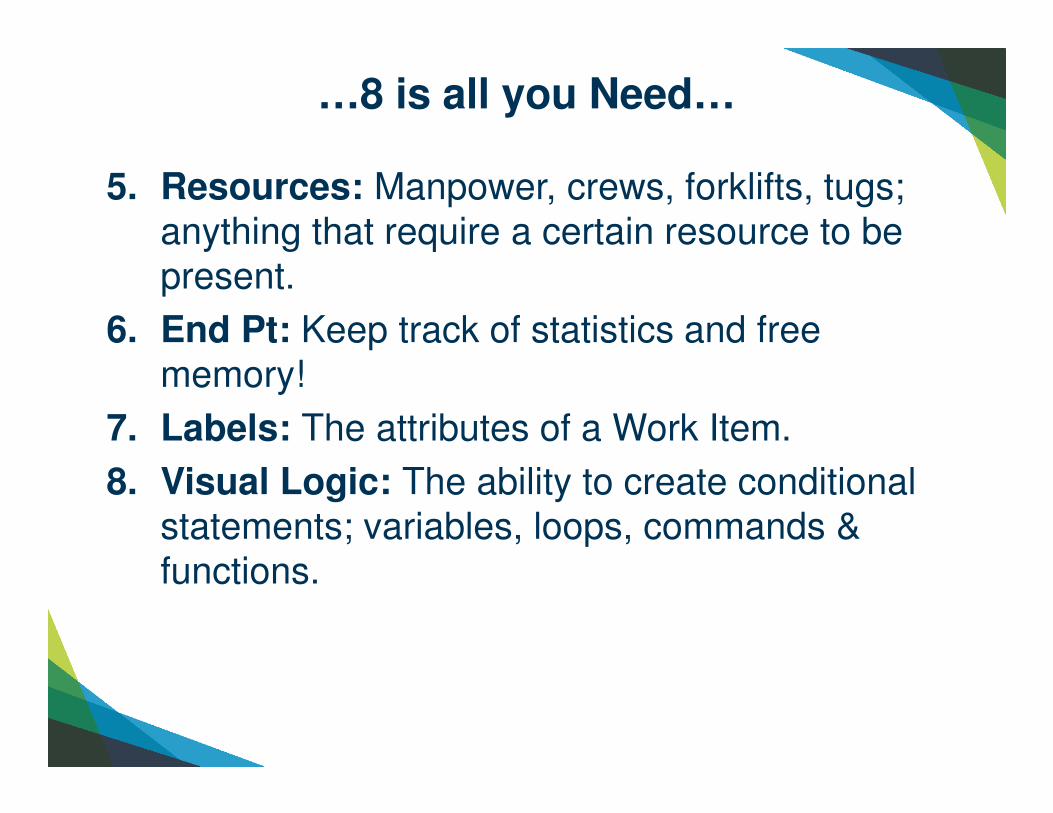
…8 is all you Need…
5. Resources: Manpower, crews, forklifts, tugs; anything that require a certain resource to be present.
6. End Pt: Keep track of statistics and free memory!
7. Labels: The attributes of a Work Item.
8. Visual Logic: The ability to create conditional statements; variables, loops, commands & functions.
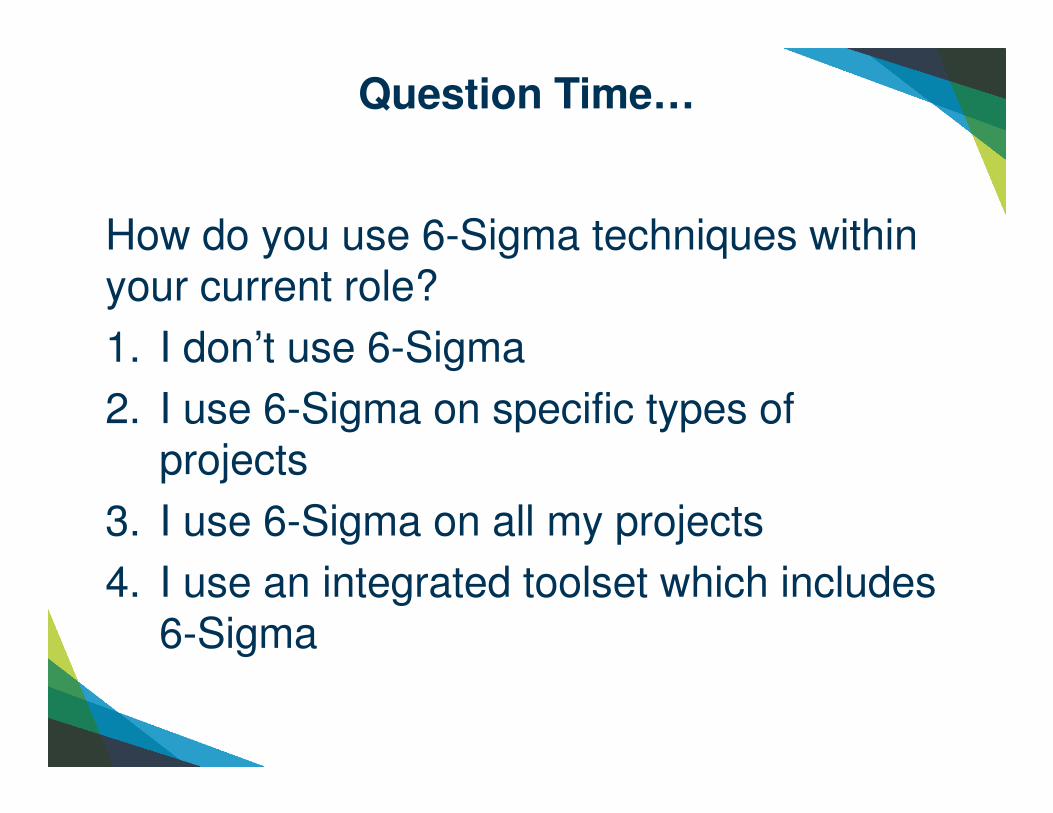
Question Time…
How do you use 6-Sigma techniques within your current role?
1. I don’t use 6-Sigma
2. I use 6-Sigma on specific types of projects
3. I use 6-Sigma on all my projects
4. I use an integrated toolset which includes 6-Sigma
Agenda
• Manufacturing issues
• Different types of simulation
• Using Math
• Using Excel/Monte Carlo simulation
• Using Discrete Event Simulation
• Simulation for Six Sigma
• Q&A

Less is More using 6-Sigma
DES Steps:• Objective, Assumptions, Data Collection, Build Model,
Verify, Validate, Experimentation, Results
DMAIC or DMADV steps:• Define, Measure, Analyze, Improve, Control
• Define, Measure, Analyze, Design, Verify
Very similar steps!
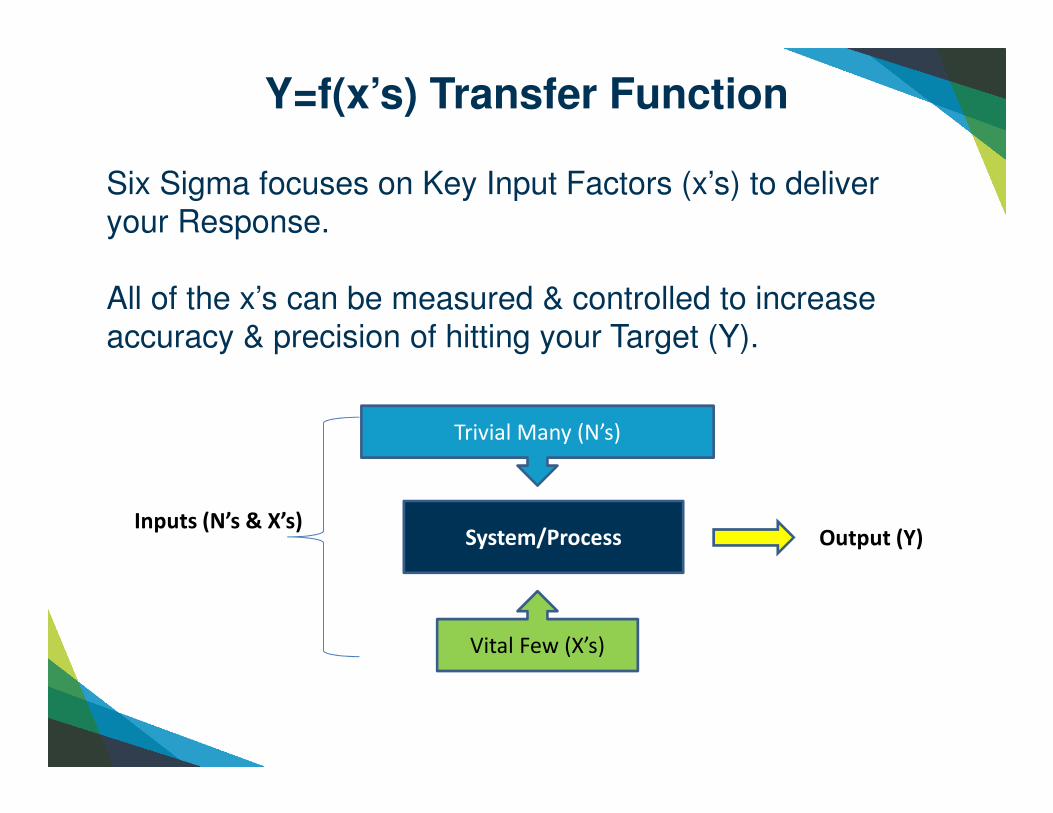
Y=f(x’s) Transfer Function
Six Sigma focuses on Key Input Factors (x’s) to deliver your Response.
All of the x’s can be measured & controlled to increase accuracy & precision of hitting your Target (Y).
System/Process
Trivial Many (N’s)
Vital Few (X’s)
Inputs (N’s & X’s)Output (Y)
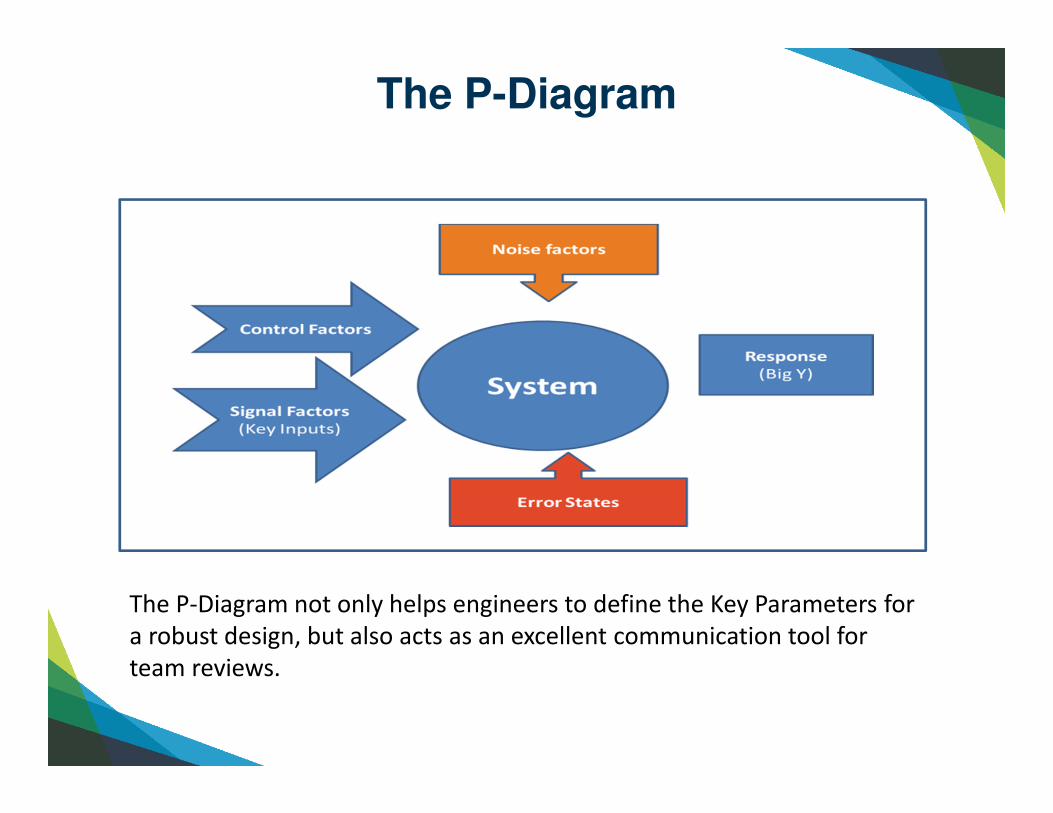
The P-Diagram
The P-Diagram not only helps engineers to define the Key Parameters for
a robust design, but also acts as an excellent communication tool for
team reviews.
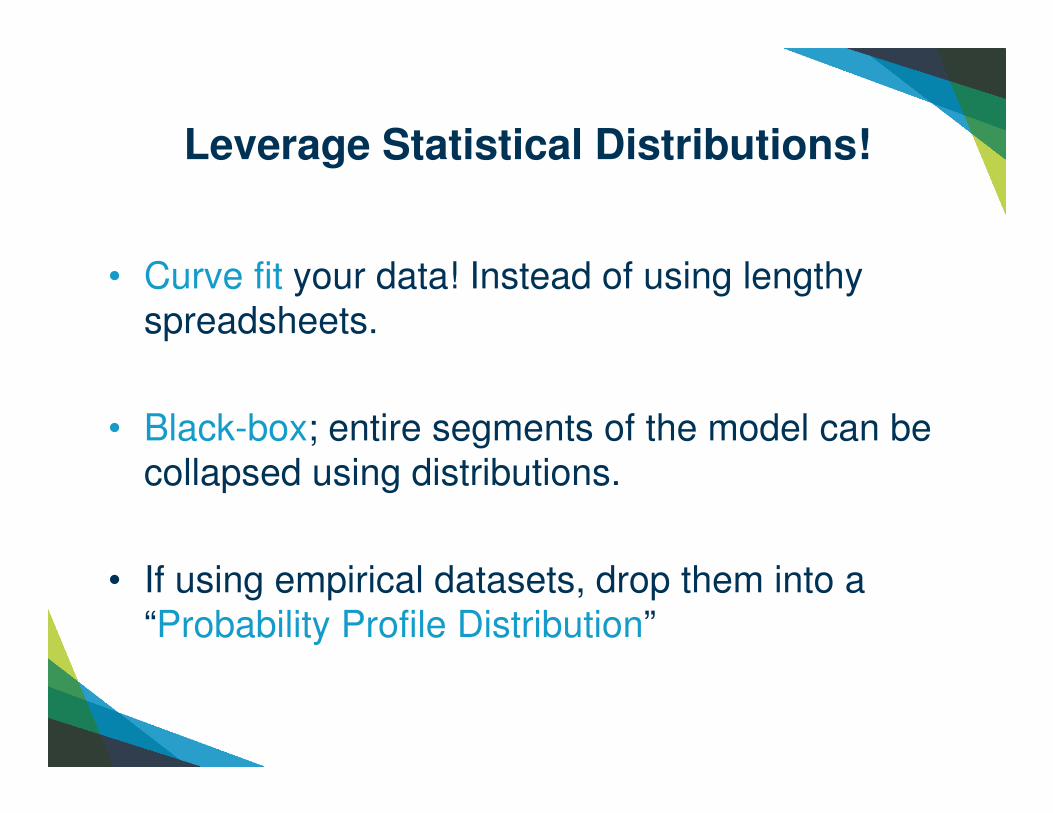
Leverage Statistical Distributions!
• Curve fit your data! Instead of using lengthy spreadsheets.
• Black-box; entire segments of the model can be collapsed using distributions.
• If using empirical datasets, drop them into a “Probability Profile Distribution”
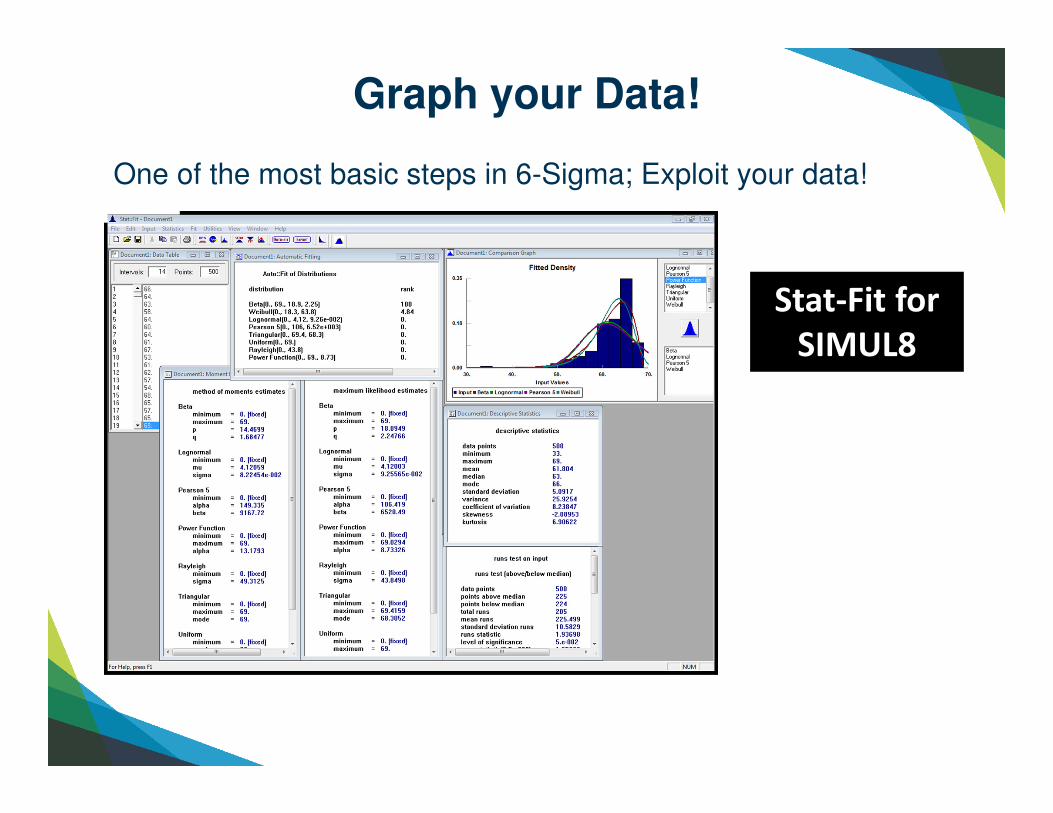
Graph your Data!
One of the most basic steps in 6-Sigma; Exploit your data!
Stat-Fit for
SIMUL8

Use Known Distributions
The data collection phase of modeling can be the lengthiest and most time consuming.
Downtime (MTBF & MTTR); such as Exponential & Erlang respectively.
Cycle times often use a Fixed distribution; that is the “Design Cycle Time”.
Steady State
A common data collection error is to capture all data points, and attempt to force them into one distribution.
– Filter out the outliers; usually catastrophic points are outside the scope of the steady state system.
43

Concluding Thoughts
• Queuing Theory & Monte Carlo Simulations can meet your specific objectives in certain applications. Yet, can become overwhelming when pulling them beyond their intent.
• Most Manufacturing, Healthcare objectives go much further beyond these capabilities. Where the dynamicaspects of time are critical!
• Discrete Event Simulation is a user friendly tool that is built on the foundations of queuing theory & statistical sampling.

Q & A