when more is more: toward higher impact ogp … · ogp print logo 9/1/2011 this version for all...
TRANSCRIPT
INDEPENDENT REPORTING MECHANISM
WHEN MORE IS MORE: TOWARD HIGHER IMPACT OGP COMMITMENTS
Laura VosslerJoseph Foti March 2018Independent Reporting Mechanism

This work is licensed under the Creative Commons Attribution 4.0 International License. To view a copy of this license, visit http://creativecommons.org/licenses/by/4.0/ or send a letter to Creative Commons, PO Box 1866, Mountain View, CA 94042, USA.
OGP print logo9/1/2011this version for all print publicationsfor online, use web version of logo
Preferred white space is 25% of logo width on all sides.
Letterhead sizing is 1 inch square. 1 in. sizing is preferred where appropriate.
Logo typeface is Gill Sans MT. Signage and headlines should use Gill Sans family or open source “Sans Guilt” adapatation.
Questions about usage? Contact [email protected]
WHEN MORE IS MORE: TOWARD HIGHER IMPACT OGP COMMITMENTS
INTRODUCTION .............................................................................................................. 3
I | COMMITMENT COMPLETION .............................................................................. 5
II | STARRED COMMITMENTS ................................................................................... 11
III | DO GOOD COMMITMENTS OPEN GOVERNMENT? ....................................... 20
ANNEX ........................................................................................................................... 22
2 | IRM | WHEN MORE IS MORE: TOWARD HIGHER IMPACT OGP COMMITMENTS
WHEN MORE IS MORE: TOWARD HIGHER IMPACT OGP COMMITMENTS
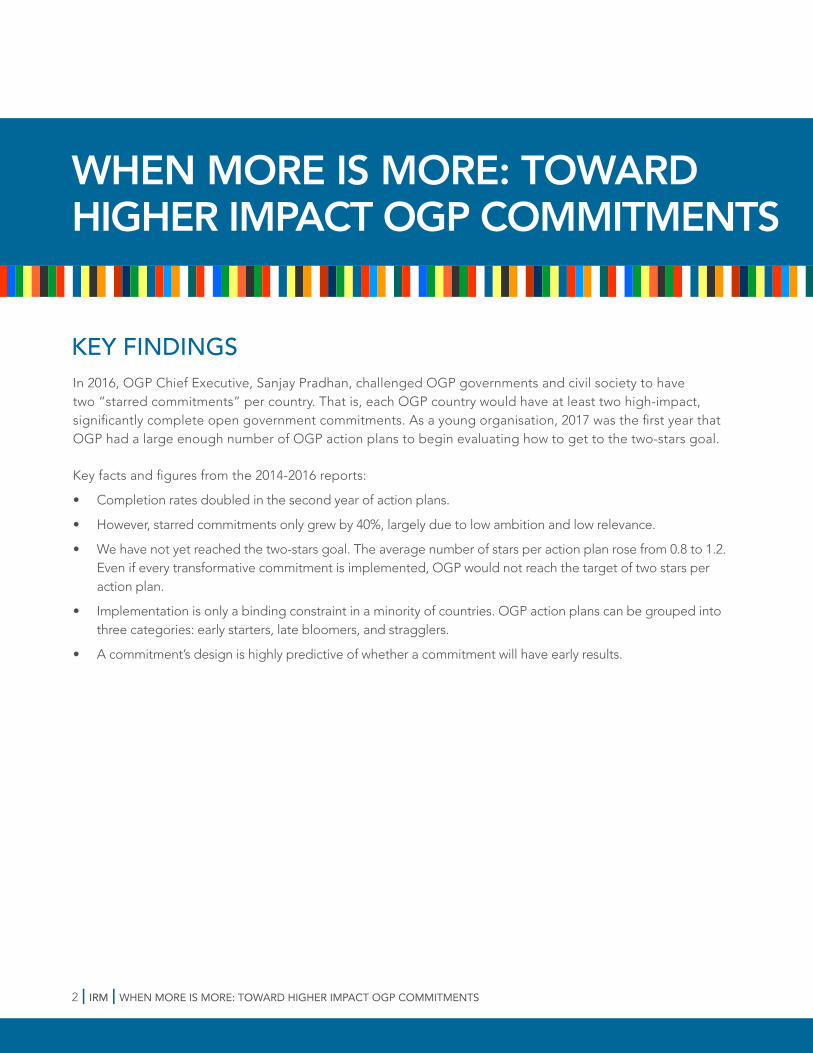
KEY FINDINGS In 2016, OGP Chief Executive, Sanjay Pradhan, challenged OGP governments and civil society to have two “starred commitments” per country. That is, each OGP country would have at least two high-impact, significantly complete open government commitments. As a young organisation, 2017 was the first year that OGP had a large enough number of OGP action plans to begin evaluating how to get to the two-stars goal.
Key facts and figures from the 2014-2016 reports:
• Completion rates doubled in the second year of action plans.
• However, starred commitments only grew by 40%, largely due to low ambition and low relevance.
• We have not yet reached the two-stars goal. The average number of stars per action plan rose from 0.8 to 1.2. Even if every transformative commitment is implemented, OGP would not reach the target of two stars per action plan.
• Implementation is only a binding constraint in a minority of countries. OGP action plans can be grouped into three categories: early starters, late bloomers, and stragglers.
• A commitment’s design is highly predictive of whether a commitment will have early results.
INTRODUCTION | 3
WHEN MORE IS MORE: TOWARD HIGHER IMPACT OGP COMMITMENTS
INTRODUCTIONThe Open Government Partnership is a learning organization. As a collection of governments, civil society, and multilateral partners, participants encourage each other to take ambitious commitments to open government. The reward for accomplishment is international and national recognition, and, in the best cases, innovative policies and programs spread and adapt to other contexts. OGP’s Independent Reporting Mechanism (IRM) gathers information on all OGP action plans. It has a dual role of promoting accountability and learning within OGP.
Before 2016, OGP did not track the final outcomes of most of its two-year action plans. This paper aims to update what we know about OGP action plans, starred commitments, and rates of implementation.
Prior analyses offer an incomplete picture of OGP’s accomplishments. They depended on findings from Year 1 IRM reports (“Progress Reports”), which are limited in scope to the first year of action plan implementation. These reports focused on midterm reporting in order to better inform the next action plan in a timely manner. The OGP Steering Committee, in 2014, acknowledging the primacy of the IRM Year 1 report, nonetheless requested that the IRM develop a Year 2 report to provide a final accounting of progress made over the full two-year action plan cycle. Only taking results from the first year could result in a skewed and overly critical assessment of OGP accomplishment. For that reason, we present this paper to provide a more complete, and thus, more accurate record.
The data for this paper comes primarily from action plans submitted in 2014. While the first Year 2 (or “End of Term reports”) covered a set of 2013-20151 action plans (Hungary, Netherlands, Finland, and Ghana), the 2014-20162 action plans represent the first time a significant population of action plans – 47 in all – are ready for publication and analysis all at once.
The findings of the paper will directly inform OGP intervention at both international and national levels.
At the international level, it is important for us to understand if OGP is achieving its goal of motivating and enabling transformational governance reforms. This paper provides the following insights:
• Health check: For governments, it is a final accounting of progress made on implementation of OGP commitments during the full two-year action plan cycle. For OGP cynics, it is an opportunity to see if OGP can ‘go the distance.’
• Calibrating country support: Since we now have data from both Year 1 and Year 2 of implementation, we can see whether OGP participants continue to make progress throughout the 2-year cycle or if they lose momentum and move on to new challenges. This helps us identify OGP’s efficacy. At year one, the current completion rate is one-in-eight, a fairly low rate.
At the national level, where action plans are implemented and civil society advocates for policy reform, we can explore:
• Commitment design: This is an opportunity to look at the full lifecycle of a commitment and identify which characteristics contribute to the successful implementation of meaningful commitments.
• Ambition-impact relationship: All actors within OGP often face a trade-off between ambition and feasibility to achieve meaningful changes in government. We can explore the degree to which OGP countries should chose incrementalism (“low hanging fruit”) over more radical reforms.
4 | IRM | WHEN MORE IS MORE: TOWARD HIGHER IMPACT OGP COMMITMENTS
The paper moves through the above themes, beginning with IRM-measured results of action plans, before tentatively exploring the relationship between commitment design and results. Recommendations are grouped by actors (e.g. OGP Support Unit, IRM, researchers, Steering Committee, strategic partners, international NGO networks, and governments.)
Box 1: About OGP and the IRMThe Open Government Partnership (OGP) is a voluntary international initiative that aims to secure commitments from government to their citizenry to promote transparency, empower citizens, fight corruption, and harness new technologies to strengthen governance. In pursuit of these open government goals, OGP provides an international forum for dialogue and sharing among governments, civil society organisations, and the private sector. As part of their participation in OGP, governments develop two-year action plans in collaboration with civil society organisations. Each action plan contains specific commitments to disclose information, improve citizen participation, and enhance public accountability.
The Independent Reporting Mechanism (IRM) is a key means by which stakeholders can track OGP progress in participating countries. The IRM produces annual reports for each OGP country. In addition to assessing the development and implementation of OGP action plans, these reports aim to stimulate dialogue and promote accountability for results.3
1 http://bit.ly/2hmRDkK.2 http://bit.ly/2hmRDkK.3 For more information on the IRM and its evaluation process, please see the IRM page on the OGP website, available at: https://www.opengovpartnership.org/about/independent-report-ing-mechanism.

I | COMMITMENT COMPLETION | 5
I | COMMITMENT COMPLETIONThe IRM assesses completion of commitments to ensure OGP’s efficacy.
There are three important reasons to look at completion in the second year of action plans:
1. Giving credit where credit is due: Some countries might be “late bloomers,” slow to start the race, but just as deserving of recognition as those “early bloomers” countries that get off to an early start. We can begin to get an idea of how many countries are “late bloomers” and whether “early bloomers” countries falter in their rate of implementation during the second year.
2. Assessing OGP as an initiative: The previous IRM technical paper put OGP’s median completion rate at 19% at Year 1.1 If there has been significant positive growth in the second year, it may suggest that OGP’s outcomes are better than previously thought. Alternately, if there is no growth, then we know that there are major flaws in commitment design or the political or technical resources dedicated to their completion. Comparing the differential progress of countries can also lay the groundwork to assess the impact of different strengths and weaknesses.
3. Public accounting: Finally, there is need to identify countries where commitments are undertaken and simply not completed. In these cases, some additional interventions may be needed to ensure that they are able to carry out their part in the OGP partnership. Indeed, the 2016 IRM Technical Paper found that 60% of commitments did not achieve “star” status due to low levels of completion.
The IRM codes all commitments for completion based on a close reading of the commitment text, stakeholder interviews, and a desk review of documents, using the following scale:
• Complete
• Substantial
• Limited
• Not started
• Withdrawn (officially)
• Unclear (based on government and civil society responses)
For additional details on how the IRM assesses the completion of commitments, please see the IRM Procedures Manual, available at: http://bit.ly/2xbIXjm.
We begin by asking two simple question: How many commitments were completed in Year 2 versus Year 1 and who completed their commitments?

6 | IRM | WHEN MORE IS MORE: TOWARD HIGHER IMPACT OGP COMMITMENTS
OGP COUNTRIES DOUBLED THEIR COMPLETE COMMITMENTS IN 2016As the chart below shows, there has been a significant positive shift toward greater implementation of commitments between Year 1 and Year 2. In Year 1, about one in six (15%) commitments of commitments were complete. In Year 2, this number doubled to about one in three (31%). The number of commitments that were not started also halved from 11% to about 5%. The principle takeaway is that past estimates have underestimated the rate of OGP commitment completion by half, a significant difference. Similarly, nearly two-thirds of commitments see substantial completion.
THE TYPICAL ACTION PLAN MORE THAN DOUBLES COMPLETE COMMITMENTS IN YEAR 2There is good news about OGP action plans. The rate of completion is much higher than reported in earlier papers. One in three commitments are completed, but this completion is still concentrated in particular countries. The median completion of action plans is lower than average completion of all commitments, but the improvement between the first and second years is higher. The median completion rate for the overall action plan more than doubles from 1 in 9 to 1 in 4 between Year 1 and Year 2. (See Figure 2 for an illustration.)
Year 1
Year 2
50%
40%
30%
20%
10%
0%
Figure 1. Level of completion at Year 1 and Year 2 for all commitments
Not Started Limited Substantial Complete
Perc
ent c
ompl
ete
Figure 1 | Level of completion at Year 1 and Year 2 for all commitments
I | COMMITMENT COMPLETION | 7
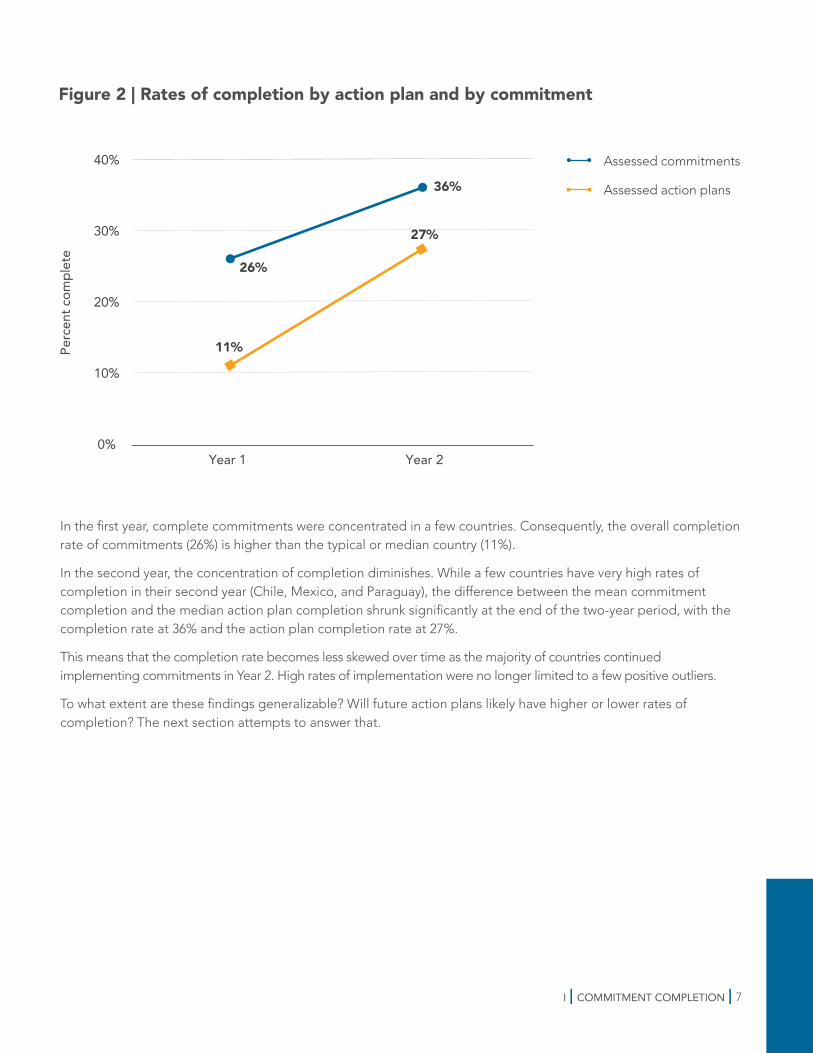
In the first year, complete commitments were concentrated in a few countries. Consequently, the overall completion rate of commitments (26%) is higher than the typical or median country (11%).
In the second year, the concentration of completion diminishes. While a few countries have very high rates of completion in their second year (Chile, Mexico, and Paraguay), the difference between the mean commitment completion and the median action plan completion shrunk significantly at the end of the two-year period, with the completion rate at 36% and the action plan completion rate at 27%.
This means that the completion rate becomes less skewed over time as the majority of countries continued implementing commitments in Year 2. High rates of implementation were no longer limited to a few positive outliers.
To what extent are these findings generalizable? Will future action plans likely have higher or lower rates of completion? The next section attempts to answer that.
Assessed commitments
Assessed action plans
40%
30%
20%
10%
0%
Figure 2. Rates of completion by action plan and by commitment
Year 1
26%
11%
27%
36%
Year 2
Perc
ent c
ompl
ete
Figure 2 | Rates of completion by action plan and by commitment

8 | IRM | WHEN MORE IS MORE: TOWARD HIGHER IMPACT OGP COMMITMENTS
ONE-QUARTER TO ONE-THIRD OF OGP COMMITMENTS ARE COMPLETED OVERALLCan we expect doubling in the second year in future OGP action plans? We probably can, based on this sample of 2016 reports. Here is why:
• Each year, completion rates are improving. (See “Beyond the Basics,” the second IRM technical paper).2
• The Year 2 reports represent a majority of OGP countries (47 of ___) with action plans and therefore, are a good an indication of total OGP country performance.
• The 2014-16 action plans (the group that is the subject of this paper) performs better than other action plans when measured at the commitment level. This can either be because the average performance rate is increasing over time (this group is among the most recent assessed by the IRM) or that this sample contains outliers with action plans of more than 30 commitments and high rates completion.
• In terms of the median action plan, these Year 2 reports are more typical, however. Here the overall (2011-16) median completion for an OGP action plan is 10% completion, but for this group (2014-2016 only) is 11%.
This suggests that we can safely generalise from the median of this group, but that we should exercise significantly more caution in predicting future, overall commitment completion.
With these caveats in mind, we provide overall linear projections of completion rates for OGP commitments and overall action plans. (See Figure 3 below.) We expect positive future trends in commitment completion rates (dotted blue line). We will not likely, however, see the median completion rates of 36% because the average Year 1 completion for OGP action plans is generally much lower than our sample group illustrates (26% vs 16%).
Assessed commitments
All commiments (projected)
Assessed action plans
All action plans (projected)
40%
30%
20%
10%
0%
Figure 3. At the action plan level, our sample is likely predictive of future trends
Year 1
26%
11%
27%
36%
Year 2
10%
16%25%
22%
Perc
ent c
ompl
ete
Figure 3 | At the action plan level, our sample is likely predictive of future trends
I | COMMITMENT COMPLETION | 9
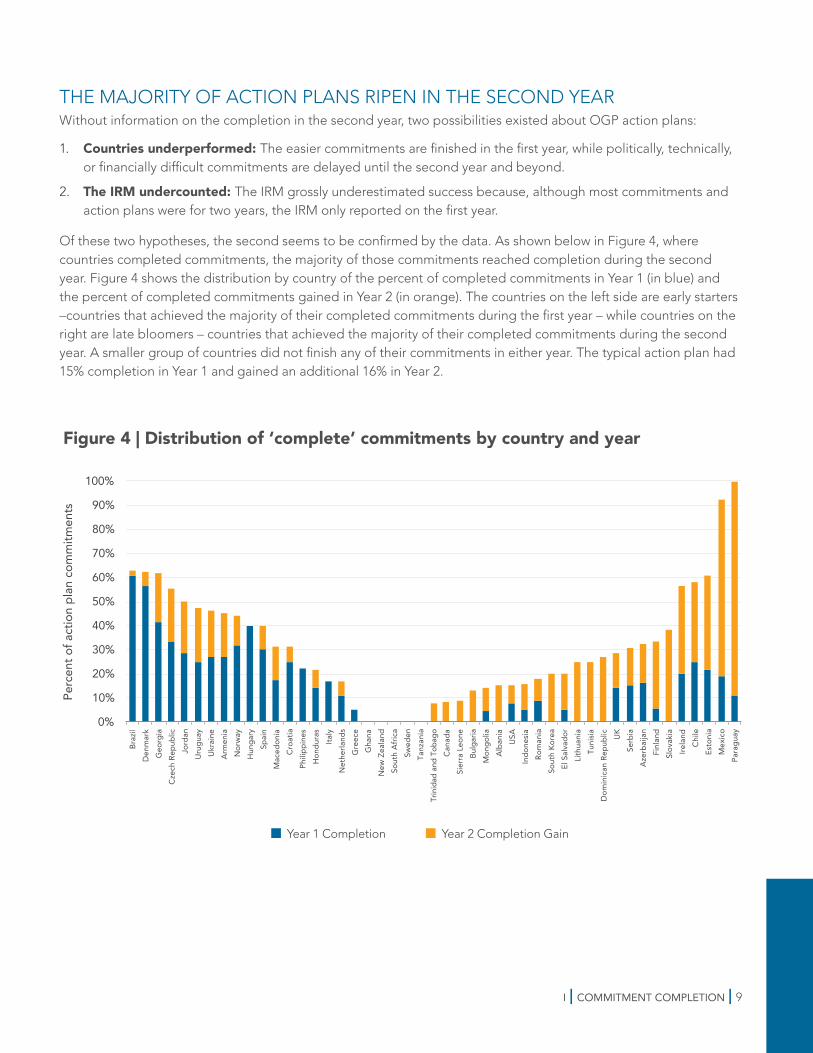
THE MAJORITY OF ACTION PLANS RIPEN IN THE SECOND YEARWithout information on the completion in the second year, two possibilities existed about OGP action plans:
1. Countries underperformed: The easier commitments are finished in the first year, while politically, technically, or financially difficult commitments are delayed until the second year and beyond.
2. The IRM undercounted: The IRM grossly underestimated success because, although most commitments and action plans were for two years, the IRM only reported on the first year.
Of these two hypotheses, the second seems to be confirmed by the data. As shown below in Figure 4, where countries completed commitments, the majority of those commitments reached completion during the second year. Figure 4 shows the distribution by country of the percent of completed commitments in Year 1 (in blue) and the percent of completed commitments gained in Year 2 (in orange). The countries on the left side are early starters –countries that achieved the majority of their completed commitments during the first year – while countries on the right are late bloomers – countries that achieved the majority of their completed commitments during the second year. A smaller group of countries did not finish any of their commitments in either year. The typical action plan had 15% completion in Year 1 and gained an additional 16% in Year 2.
Figure 4. Distribution of ‘complete’ commitments by country and year
Year 1 Completion Year 2 Completion Gain
0%
10%
20%
30%
40%
50%
60%
70%
80%
90%
100%
Braz
ilD
enm
ark
Geo
rgia
Cze
ch R
epub
licJo
rdan
Uru
guay
Ukr
aine
Arm
enia
Nor
way
Hun
gary
Spai
nM
aced
onia
Cro
atia
Phili
ppin
esH
ondu
ras
Italy
Net
herla
nds
Gre
ece
Gha
naN
ew Z
eala
ndSo
uth
Afri
caSw
eden
Tanz
ania
Trin
idad
and
Tob
ago
Can
ada
Sier
ra L
eone
Bulg
aria
Mon
golia
Alb
ania
USA
Indo
nesia
Rom
ania
Sout
h Ko
rea
El S
alva
dor
Lith
uani
aTu
nisia
Dom
inic
an R
epub
lic UK
Serb
iaA
zerb
aija
nFi
nlan
dSl
ovak
iaIre
land
Chi
leEs
toni
aM
exic
oPa
ragu
ay
Perc
ent o
f act
ion
plan
com
mitm
ents
Figure 4 | Distribution of ‘complete’ commitments by country and year

10 | IRM | WHEN MORE IS MORE: TOWARD HIGHER IMPACT OGP COMMITMENTS
The 16% increase in the average rate of completion is spread across countries and is not concentrated exclusively in a couple of ‘high achievers.’ 19 countries finished more commitments in the first year. Another 19 finished more in the second year and five countries made equal strides in implementation over both years.
Only four countries (Hungary, Philippines, Italy, and Greece) completed commitments in the first year of implementation and subsequently failed to complete any additional commitments during the second year of implementation. This begins to refute the concern that countries will make progress on implementation only during the first year of implementation and falter without the requirement of an IRM report.
POLICY CONSEQUENCESTwo policy consequences arise for the how OGP operates. The first is that it is absolutely essential that the IRM continue assessing completion at the end of the two-year action plan. To fail to do so would underestimate the work done by OGP countries and also would underestimate the achievements of OGP as a whole.
Secondly, it is unlikely that rates of completion will fall if the IRM does not carry out an assessment at the end of the first year. Most countries did not know that they would receive a Year 2 report, yet the completion rate doubled. Given that almost all countries continued implementation without knowledge of a Year 2 report, there is little evidence that removing this Year 1 assessment would cause a drastic performance reduction. The IRM could also strengthen incentives by better fulfilling the requirements in the OGP Articles of Governance to provide an easier means of comparison through executive summaries.
1 Foti, J. (2016). Beyond the Basics. OGP Action Plans 2012-2015. Open Government Partnership. Independent Reporting Mechanism. http://www.opengovpartnership.org/sites/default/files/IRM-Report_Technical-Paper_20161130_web.pdf.
2 Foti, Joseph “Beyond the Basics: OGP Action Plans 2012-2015” Fall 2016. http://bit.ly/2h0MGK5.
II | STARRED COMMITMENTS | 11
II | STARRED COMMITMENTSCompletion itself is not the only measure of OGP. We also assess whether complete commitments are high impact.
To do this, the IRM adopted the starred criteria to identify high-quality ambitious commitments that also achieved a high level of implementation. Starred commitments must meet the following criteria:
• Specific and measurable,
• Clearly relevant to opening government,
• Having a “transformative” potential impact, and
• “Substantial” or “complete” implementation.
Of these four, the first three criteria are “design” criteria. For the rest of this section, we will refer to commitments that meet the first three criteria as “well-designed.” The last criterion is based on “implementation.” (For additional details on how the IRM assesses each of these variables, please see the IRM Procedures Manual, available at: http://bit.ly/2xbIXjm.)
This section looks at the improvement in the number of stars as well as the distribution among countries. There are five main takeaways:
1. The 2014-16 action plans were broadly comparable to prior years.
2. The overall percentage of stars went up modestly between the first and second year (from 5% to 7%).
3. Although the rate of completed commitments doubled, the completion rate of well-designed commitments did not.
4. OGP would have seen more starred commitments (and by extension, higher impact) by supporting the writing of more clearly ambitious, specific and measurable commitments.
5. While most action plans achieved at least one starred commitment, we are a long way from the goal of two stars per plan.
POOR DESIGN DRIVES DOWN THE NUMBER OF STARSAfter the first year of our most recent action plans (2014-16), five percent of commitments met all four “star” criteria. After the second year, this number was seven percent. This raises a question: if completion rates doubled, why didn’t stars double?
First, this performance is consistent with prior years. Roughly 1 in 9 commitments is well-designed, meeting all three criteria. Design has been, and continues to be, the dominant constraint. The first two data columns of Figure 5 show that there are not wide variations between the first years of the 2013-2015 sample of action plans and those from 2014-2016.

12 | IRM | WHEN MORE IS MORE: TOWARD HIGHER IMPACT OGP COMMITMENTS
There are two reasons that the doubling of completion did not result in doubling of starred commitments. First, the completion rate of transformative commitments is slightly lower than non-transformative commitments – 48% substantial or complete progress for transformative versus 54% for non-transformative at the end of the second year. But there is little evidence that governments abandoned more difficult commitments in the second year of action plans; the total rate of substantial and complete commitments went from 45% in the first year to 63%, which actually seems relatively high (see Figure 5). In raw numbers, this is an increase of 16 starred commitments.
More pressing is the ceiling of 11% well-designed commitments. In practical terms, this means that there were only 87 commitments out of the 792 that were eligible for stars. Even if all 87 well-designed commitments were completed, the proportion of “starred” commitments would not exceed 11%. Further, the cost of achieving a 100% completion rate of well-designed commitments would be significantly higher than simply improving the wording and design of the commitments to expand the pool of “potentially starred” commitments. The stark difference between getting more stars by improving design versus improving implementation is shown in Figure 6 below.
STARRED COMMITMENTS2013-15 (n = 590)
2014-16 (n = 792)
Year 1 Year 1 Year 2
Well-designed 12% 11% ..
Implemented (percent of well-designed)
39% 45% 63%
Starred 5% 5% 7%
Figure 5 | Comparison of samples in the first and second years of action plans

II | STARRED COMMITMENTS | 13
What are the principle causes of poor design? Ambition is the most significant barrier. Roughly 7 in 10 (71%) of commitments are poorly designed due to low ambition, 2 in 10 (19%) were not clearly relevant to OGP, and the remaining 10% were not specific enough for assessment. (See Box 2 for a discussion on what the IRM has learned on how to better articulate the ambition of commitments.)
It is important to note:
• These commitments were written without an action plan template or sizeable support staff in the OGP Support Unit.
• The 2013 mandate from the Steering Committee to the IRM focussed only on assessing potential impact. Many governments and civil society groups had not yet internalised or applied the concept of “transformative commitments” into their action plans. This became more widely discussed in 2015 at the OGP Global Summit in Mexico City.
• Therefore, it is possible that this assessment is bleaker than reality and that governments have improved significantly in the intervening three years. Until we have the next large set of data, in 2019, we will not be able to assess whether the trends have improved overall.
Figure 6. The “Design Gap” is much larger than the “Implementation Gap”
100%
75%
50%
25%
0%
Stars
Potential stars
Not potential stars
Design gap (ambition, relevance, and specificity)
Implementation gap
Perc
ent o
f tot
al c
omm
itmen
ts
Figure 6 | The “Design Gap” is much larger than the “Implementation Gap”

14 | IRM | WHEN MORE IS MORE: TOWARD HIGHER IMPACT OGP COMMITMENTS
Nonetheless, there is clear room for improvement. The obvious means of obtaining a higher absolute number of stars is to focus efforts on action plan design over implementation. This has particular significance as the OGP Secretariat/ OGP Support Staff currently focuses energy on implementation (especially through the development of the OGP Multi-Donor Trust Fund)1 as opposed to core technical support of better designed commitments during action plan development.
TWO STARS PER COUNTRY?In 2017, OGP Chief Executive Officer, Sanjay Pradhan challenged OGP participants to meet the goal of two stars per country.2 While the results from the second year of action plans show that we are a long way from that goal, they do show that significant progress is made in the second year. A few key facts and figures:
• The mean number of stars grew by 50% (from 0.8 to 1.2 per country).
• Most countries now have at least one star. (The median went from 0 to 1.)
• The number of countries with no stars fell by almost half (from 74% to 39%).
• Even if countries had implemented 100% of the well-designed commitments, they would not have met the two-stars per country threshold. (On average there were only 2.1 well-designed commitments per county and they were not evenly distributed.)
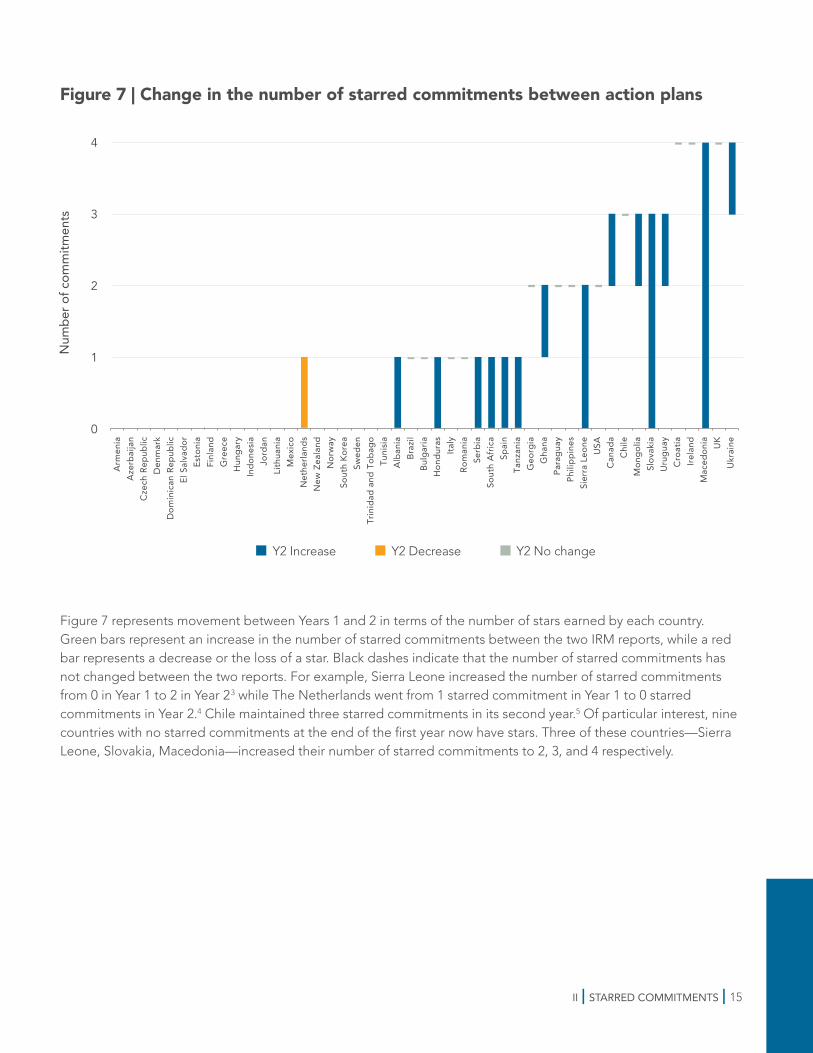
A summary of country improvement is shown in Figure 7 below.
Box 2: How to write a more ambitious commitmentBecause ambition is the biggest barrier to starred commitments, it is important to think about the design of commitments. While it may be difficult to develop ambitious commitments due to politics and resources, the largest immediate return on investment would be to improve articulation of commitments. There are three recommendations to improve the potential impact of a commitment in an action plan:
1. Describe the economic, social, political, or environmental problem rather than an administrative issue or tool (e.g. ‘Misallocation of welfare funds’ is more helpful than ‘lacking a website’.)
2. Describe the status quo of the policy issue at the beginning of an action plan. (e.g.: 26% of judicial corruption complaints are not processed currently.”)
3. Describe the targeted behaviour change rather than intermediary outputs (e.g. ‘doubling response rates to information requests’ is a stronger goal than ‘publishing a protocol for response.’)
II | STARRED COMMITMENTS | 15
Figure 7 represents movement between Years 1 and 2 in terms of the number of stars earned by each country. Green bars represent an increase in the number of starred commitments between the two IRM reports, while a red bar represents a decrease or the loss of a star. Black dashes indicate that the number of starred commitments has not changed between the two reports. For example, Sierra Leone increased the number of starred commitments from 0 in Year 1 to 2 in Year 23 while The Netherlands went from 1 starred commitment in Year 1 to 0 starred commitments in Year 2.4 Chile maintained three starred commitments in its second year.5 Of particular interest, nine countries with no starred commitments at the end of the first year now have stars. Three of these countries—Sierra Leone, Slovakia, Macedonia—increased their number of starred commitments to 2, 3, and 4 respectively.
Figure 7. Change in the number of starred commitments between action plans
Y2 Increase Y2 Decrease Y2 No change
Arm
enia
Aze
rbai
jan
Cze
ch R
epub
licD
enm
ark
Dom
inic
an R
epub
licEl
Sal
vado
rEs
toni
aFi
nlan
dG
reec
eH
unga
ryIn
done
siaJo
rdan
Lith
uani
aM
exic
oN
ethe
rland
sN
ew Z
eala
ndN
orw
aySo
uth
Kore
aSw
eden
Trin
idad
and
Tob
ago
Tuni
siaA
lban
iaBr
azil
Bulg
aria
Hon
dura
sIta
lyRo
man
iaSe
rbia
Sout
h A
frica
Spai
nTa
nzan
iaG
eorg
iaG
hana
Para
guay
Phili
ppin
esSi
erra
Leo
neU
SAC
anad
aC
hile
Mon
golia
Slov
akia
Uru
guay
Cro
atia
Irela
ndM
aced
onia UK
Ukr
aine
4
3
2
1
0
Num
ber o
f com
mitm
ents
Figure 7 | Change in the number of starred commitments between action plans
16 | IRM | WHEN MORE IS MORE: TOWARD HIGHER IMPACT OGP COMMITMENTS
NOT ALL STARRED COMMITMENTS ARE BEING COMPLETEDA commitment does not need to be complete to receive a star; it only needs substantial progress. Therefore, starred commitments that see “substantial” completion but aren’t complete might be over-counted. In some cases, critics have pointed out that it is the “last mile” of a commitment’s completion that would significantly increase its impact. For example, a commitment to publish auditing data may achieve “substantial” completion – but although the audit systems are established and operating, the last mile to completion would be publishing the audits. This means the government, however accountable, is not becoming more open as a result of the commitment and the IRM has celebrated an unfulfilled promise. In essence, critics might allege that the star criteria promotes “grade inflation.”
When we look at Year 1 data alone, it certainly seems like a problem:
• Of 38 starred commitments in Year 1, only 14 were complete (roughly 1 in 3).
In Year 2:
• Of 54 starred commitments, one-third (18) of stars reached completion.
• Roughly another third, which had been starred in the first year, stayed at substantial and did not improve.
• The final third were “new” commitments that hadn’t been starred before. Of those, only one-quarter were completed by the end of the action plan.
In conclusion, we do see evidence of some “grade inflation” with the star criteria. To address this problem and begin measuring actual opening of government, the IRM introduced the “Did it Open Government?” indicator which looks for early evidence of government being more open. We evaluate the early results of this indicator in the next section. The important longer-term implication for the IRM is that, when celebrating commitments in OGP, we consider separating design from implementation and early results.
1 https://www.opengovpartnership.org/ogp-trust-fund. 2 Open Government Partnership, “The Next Phase of OGP: A Call to Collective Action” (OGP: 8 Dec. 2016), https://www.opengovpartnership.org/stories/next-phase-of-ogp-call-collective-action.3 Charlie Hughes, “Sierra Leone End of Term Report 2014-2016” (OGP: 2016), http://bit.ly/2iIQRvj.4 Two countries, The Netherlands and Croatia, each ‘lost’ a star due to changes in commitment completion levels between Year 1 and Year 2. In the case of The Netherlands, this change in
coding was due to a misapplication of IRM methodology in the Year 1 report. In the case of Croatia, the commitment regressed in completion due to a change in government and subse-quent shift in policy priorities. However, between Year 1 and Year 2, Croatia earned an additional star –hence why Figure 5 does not appear to reflect a decrease in the number of starred commitments. For more information on the commitments referenced, please see “The Netherlands: 2013-2014 End of Term Report/ Nederland: 2013-2014 Eindrapport” (http://bit.ly/2zwUoqq) and “Croatia End of Term Report 2014-2016” (http://bit.ly/2jgcsiC).
5 Andrea Sanhueza Echevarria, “Chile End of Term Report 2014-2016” (OGP: 2016), http://bit.ly/2hZVXU7.

II | STARRED COMMITMENTS | 17
STARS BY THEMEThis paper is general in its approach, but some readers may be curious as to whether particular sectors or policy areas had better results in OGP than others. We explore that question here.
The themes that received the most stars were (number of commitments in parentheses): †
• Natural Resources†† (10)
• Fiscal Openness (10)
• Public Participation (10)
• Access to Information (8)
• Anti-Corruption (4)
• Elections & Political Finance (3)
• Whistleblower Protection (3)
• Record Management (3)
• Judicial Reform (2)
• Conflicts of Interest (2)
• Private Sector (2)
• Public Procurement (2)
† This list does not include commitments that are not policy areas but rather are instrumental to other commitments. These include: Legislation & regulation (18); eGovernment (14); Open data (11); Capacity building (7); and Subnational (4). These “tags” are not policy areas as much as policy instruments – how commitments are achieved. For example, a commitment may be about ensuring whistleblower protection ( the “what”) through legislation (the “how”).
†† “Natural resources” includes both environmental and extractive industries commitments.1
POLICY AREAS THAT BEAT THE CURVEIt is not only important to identify where there is successful action. It is also important to identify where there is disproportionately high performance.
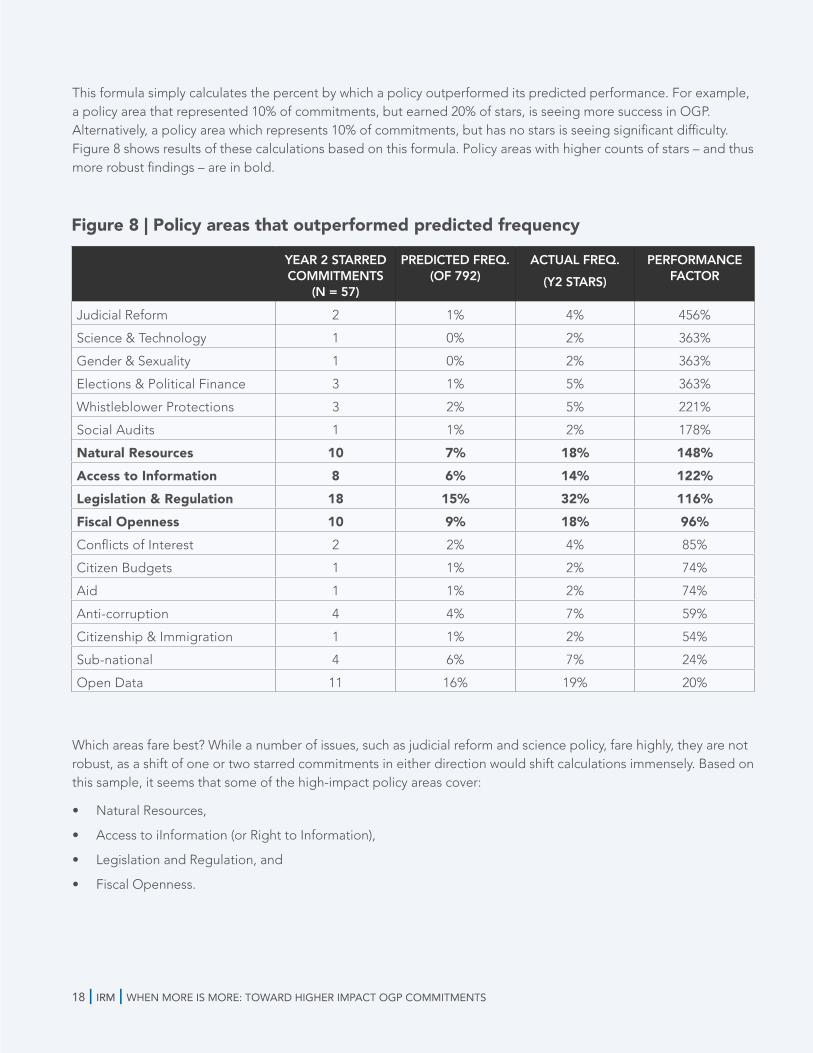
If a government wanted to take action in a policy area that would be most likely to meet the high-potential impact bar and to be feasible, what would it be? Figure 8 below calculates the performance factor of each policy area – the degree to which it outperformed the predicted performance based on frequency. If all commitments were equal and if 1% of commitments were relevant to a given policy area, and stars were evenly distributed, then 1% of starred commitments should be in that policy area. But they are not. Some policy areas are overrepresented. We can calculate a rough “performance factor” with the formula of:
Actual frequency – predicted frequency = Performance factor
Predicted frequency
18 | IRM | WHEN MORE IS MORE: TOWARD HIGHER IMPACT OGP COMMITMENTS
This formula simply calculates the percent by which a policy outperformed its predicted performance. For example, a policy area that represented 10% of commitments, but earned 20% of stars, is seeing more success in OGP. Alternatively, a policy area which represents 10% of commitments, but has no stars is seeing significant difficulty. Figure 8 shows results of these calculations based on this formula. Policy areas with higher counts of stars – and thus more robust findings – are in bold.
Which areas fare best? While a number of issues, such as judicial reform and science policy, fare highly, they are not robust, as a shift of one or two starred commitments in either direction would shift calculations immensely. Based on this sample, it seems that some of the high-impact policy areas cover:
• Natural Resources,
• Access to iInformation (or Right to Information),
• Legislation and Regulation, and
• Fiscal Openness.
YEAR 2 STARRED COMMITMENTS
(N = 57)
PREDICTED FREQ. (OF 792)
ACTUAL FREQ.(Y2 STARS)
PERFORMANCE FACTOR
Judicial Reform 2 1% 4% 456%
Science & Technology 1 0% 2% 363%
Gender & Sexuality 1 0% 2% 363%
Elections & Political Finance 3 1% 5% 363%
Whistleblower Protections 3 2% 5% 221%
Social Audits 1 1% 2% 178%
Natural Resources 10 7% 18% 148%Access to Information 8 6% 14% 122%Legislation & Regulation 18 15% 32% 116%Fiscal Openness 10 9% 18% 96%Conflicts of Interest 2 2% 4% 85%
Citizen Budgets 1 1% 2% 74%
Aid 1 1% 2% 74%
Anti-corruption 4 4% 7% 59%
Citizenship & Immigration 1 1% 2% 54%
Sub-national 4 6% 7% 24%
Open Data 11 16% 19% 20%
Figure 8 | Policy areas that outperformed predicted frequency

II | STARRED COMMITMENTS | 19
Interestingly, “Legislation and Regulation” is a means of achieving policy, rather than an end. Nonetheless, these commitments seem to have higher potential impact on average. In a generic OGP country, these would be the policy areas that have shown the biggest return on investment. OGP countries where Natural Resources, Access to Information, and Fiscal Openness are key (basically all OGP countries) would do well to make commitments in these areas for maximum feasibility and impact.
THE BIGGEST LOSERSA number of policy areas, some quite popular, did not receive any stars. Taken as a whole, these cover some of the areas that have been identified as important for OGP in its public strategic documents, such as The Paris Declaration on Open Government.1 They can be loosely bundled in three groups:
1. Public services
a. Health & Nutrition (29)
b. Infrastructure (11)
c. Water & Sanitation (7)
d. Defense (5)
e. Media & Telecommunications (4)
2. Justice, human rights, and civil liberties
a. Law Enforcement & Justice (15)
b. Nonprofits and laws on association (13)
c. Public Safety (13)
d. Human Rights (7)
3. Marginalised groups
a. Welfare & Social Security (9)
b. Marginalized Communities (1)
Three other categories did not receive stars:
1. Commitments to carry out OGP (15) – these commitments are considered redundant to basic participation in OGP,
2. Participatory Budgeting (6), and
3. E-petitions (3).
Because these are such strategically important areas for OGP, some work should be done to determine why there are so few stars in these areas. Possible explanations include inadequate ambition relative to the problem, difficult framing, lack of support from external partners, and a low number of attempts to address these issues. This is a critical question, as this analysis is not meant to dissuade OGP countries from undertaking commitments in these areas, but rather, how to ensure that OGP is helping countries achieve success in these important areas.
1 Independent Reporting Mechanism “Commitments Data Guide 2.5” http://bit.ly/2ApmsJm.

20 | IRM | WHEN MORE IS MORE: TOWARD HIGHER IMPACT OGP COMMITMENTS
III | DO GOOD COMMITMENTS OPEN GOVERNMENT?
The IRM introduced a new variable ‘Did it open government?’ in Year 2 reports. It aimed to address two criticisms of the starred commitment indicator: its reliance on transformative potential impact and a close reading of the commitment text. Often, OGP commitments that are vaguely worded or do not make a clear connection to opening government are found to be ineligible for starred status, despite achieving significant political reforms in actuality. Conversely, commitments with significant early progress may appear relevant and suitably ambitious in their formulation, but as implemented, fail to effect real change. This variable attempts to move beyond outputs and deliverables in measuring success. Whereas the ‘potential impact’ variable examines the commitment’s effect “if fully implemented,” (emphasis added) this variable looks at how the commitment has changed government practice in terms of either increasing access to information, civic participation, or public accountability.
The scale for the ‘Did it Open Government?’ variable is as follows:
• Worsens
• Did Not Change
• Marginal
• Major
• Outstanding
For additional details on how the IRM assesses the completion of commitments, please see the IRM Procedures Manual, available at: http://bit.ly/2xbIXjm.1
Readers should note the limitations of ‘Did it Open Government?’ as an explanatory variable. Year 2 IRM reports are prepared only a few months after the implementation cycle is concluded. The variable seeks to capture outcomes that can be observed in government openness practices at the end of the two-year implementation period. Both Year 1 and Year 2 IRM reports and the ‘Did it Open Government?’ variable do not intend to assess the ultimate impacts of open government reform due to the complex methodological implications and the early timeframe of the reports.
GOOD COMMITMENT DESIGN PRECEDES BEHAVIOR CHANGEGiven the close relationship between starred commitment criteria (including potential impact) and the ‘Did it Open Government?’ measurement, one question is whether ambitiously written commitments translate into significant changes in government practice. If there is a correlation between the variables, we would observe considerable overlap between “starred commitments” and “outstanding” commitments. On the other hand, if the correlation is weak or non-existent, the IRM may need to reconsider the emphasis of our methodology on ‘potential impact’ as it continues to be the most significant constraint for achieving “starred” status.
There is not a perfect correlation between the two measures. There were 20 outstanding commitments and 57 starred commitments out of a total 792 commitments. 15 fell into both categories. This is illustrated in Figure 9 below.

III | DO GOOD COMMITMENTS OPEN GOVERNMENT? | 21
This relationship is statistically significant. If a commitment receives a star in Year 1, it is highly predictive of it receiving an “outstanding” rating in Year 2. (See Figure 10 below.) This is possibly because it takes some time for commitments to “mature” and affect actual change in government practice.
These findings are robust. When we lower the bar to include commitments that received a “major” rating, we find that Year 1 completion matters less. (Smaller changes in behavior can occur more quickly, presumably.) We find an incredibly strong relationship between stars at the end of the process and “major” or “outstanding” commitments.
The policy implication of this finding is twofold:
• First, good design leads to better early outcomes. Continued investment in commitment design will pay off for the OGP community. This has particular import for the OGP Support Unit as it choses whether to put scarce resources into action plan development and review versus implementation.
• Second, the star criteria remain an important, if imperfect, “early detection” system and a means of rewarding thoughtful action plan design and positive risk-taking. This has particular import to the IRM and its potential introduction of earlier reports that focus on design.
Figure 9. Overlap between starred and outstanding commitments
OutstandingStarred
4215
5
Figure 9 | Overlap between starred and outstanding commitments
OUTSTANDING PEARSON’S r P DIRECTION OF RELATIONSHIP
Transformative Potential Impact
0.31 <.001 +
Starred (Y1) 0.45 <.001 +
Starred (Y2) 0.42 <.001 +
Figure 10 | Relationship between transformative and starred commitments and outstanding commitments
1 “IRM Procedures Manual v.4” September 2017 http://bit.ly/2xbIXjm.

22 | IRM | WHY OGP COMMITMENTS FALL BEHIND
RECOMMENDATIONSDespite strides in completion, if OGP is going to achieve its goal of two starred commitments per country and opening government practice, the critical constraint is commitment design. Countries have made significant strides in specificity. Other elements, like relevance and potential impact, remain elusive.
At times, capturing ambition in two-year action plan can be politically or technically difficult. However, significant progress may be achieved through stronger action plan design and a focus on improving commitments. The IRM recommends the following:
For OGP countries and subnationals:
• Articulate the necessary change implicit in each commitment by identifying the social, environmental, economic, or political problem being addressed. Identify current government performance and the intended result of the commitment.
• Consider action plans which focus on fewer, more transformative commitments to best leverage the international organisation of OGP.
• Consider developing action plans based on behaviour change rather than output of government documents and data. (e.g. “We will cut the backlog of Right to Information requests by 10% in the first year,” can be more effective and efficient than “We will publish a review of the causes of the backlog of Right to Information requests and form an executive panel to address the backlog.”)
• For OGP multistakeholder forums, take advantage of Support Unit reviews of action plans by incorporating adequate time to respond to comments.
• For civil society, assist government in developing strategies for change, particularly in identifying problems and solutions, as well as continued sharing of best practices.
For OGP Support Unit
• Devote knowledge, resources, and staff to support the above recommendations for countries. In particular, the action plan review can be emphasised earlier in the process.
• Consider mandating or publishing reviews to incentivise incorporating Support Unit comments.
For the IRM
• Consider phasing out, de-emphasizing, or re-designing star criteria to incentivize good commitment design separate from completion and early results.
• Consider phasing out completion assessments at the end of Year 1.
For Donors
• In order to get more ambitious commitments, invest more in action plan feedback design over implementation support. Specifically, invest in (1) OGP Support Unit country staff; (2) national multi-stakeholder forums; (3) partnerships with third-party expert organizations in critical policy areas.
III | DO GOOD COMMITMENTS OPEN GOVERNMENT? | 23
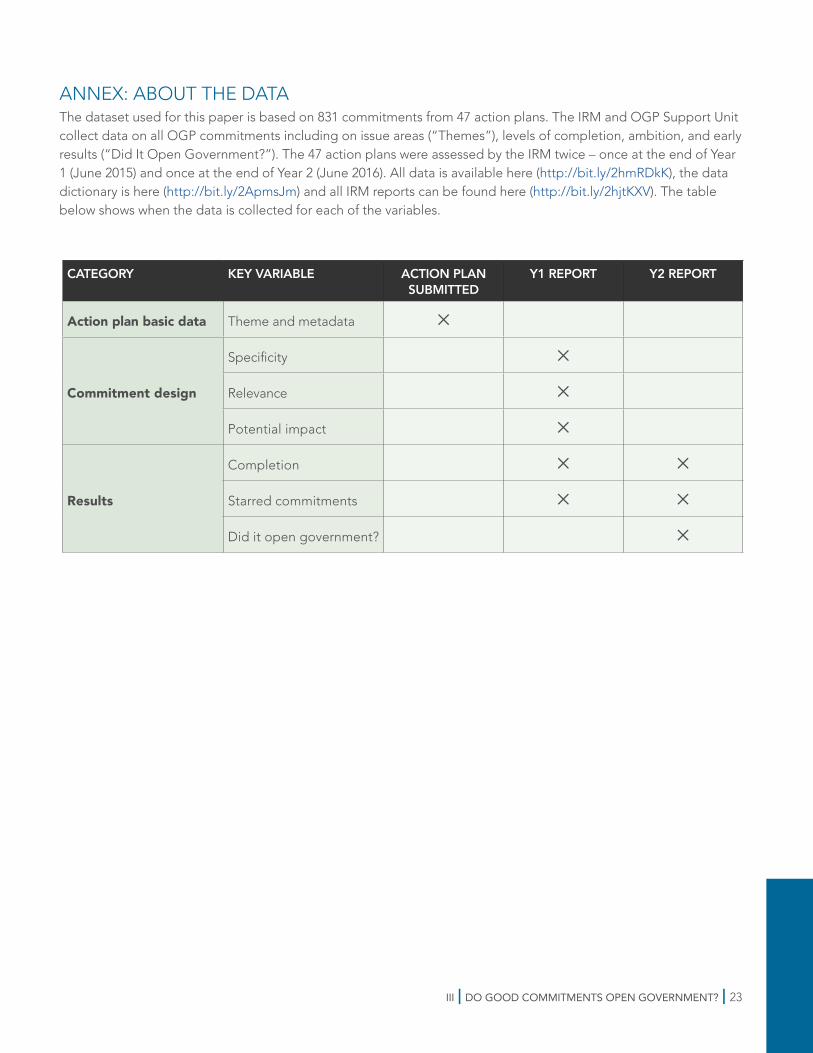
ANNEX: ABOUT THE DATAThe dataset used for this paper is based on 831 commitments from 47 action plans. The IRM and OGP Support Unit collect data on all OGP commitments including on issue areas (“Themes”), levels of completion, ambition, and early results (“Did It Open Government?”). The 47 action plans were assessed by the IRM twice – once at the end of Year 1 (June 2015) and once at the end of Year 2 (June 2016). All data is available here (http://bit.ly/2hmRDkK), the data dictionary is here (http://bit.ly/2ApmsJm) and all IRM reports can be found here (http://bit.ly/2hjtKXV). The table below shows when the data is collected for each of the variables.
CATEGORY KEY VARIABLE ACTION PLAN SUBMITTED
Y1 REPORT Y2 REPORT
Action plan basic data Theme and metadata ✕
Commitment design
Specificity ✕
Relevance ✕
Potential impact ✕
Results
Completion ✕ ✕
Starred commitments ✕ ✕
Did it open government? ✕

INDEPENDENT REPORTING MECHANISM
Independent Reporting MechanismOpen Government Partnershipc/o OpenGovHub1110 Vermont Ave NW Suite 500Washington, DC 20005