what's ahead for china? - william blair & company · justify, or at least explain, ......
TRANSCRIPT

June 2015
What's Ahead for China?
Casey K. Preyss, CFA Partner, Portfolio Manager
Olga Bitel Economist

What's Ahead for China? June 2015 | 2
China’s nascent equity markets are unique among major emerging markets economies, and so far their drivers remain largely unexplainable by either macroeconomic or company fun-damentals. Previous rallies, such as in 2000 and 2007, also had very little to do with macro and company fundamentals. What, if anything, has changed over the past year or so to justify, or at least explain, what has been going on recently? Since the global financial crisis and China’s massive credit and investment stimulus in response, concerns about China’s economy centered largely on the following question: Can the government restrain credit formation and fixed asset investment growth?
This is the same equity market that remained unchanged from the preceding five years, during which nominal GDP growth doubled and new credit was being injected into the economy at an annual rate in excess of 20%. In the face of even more credit used to generate lower marginal growth, the government continued to speak to what it knows: more infrastructure spending to stimulate growth. It looked like China was heading for a financial crisis and economic collapse, and about 12 to 18 months ago, Chinese equity markets were pricing in this outcome. Over the past year, concerns related to economic growth and the government’s ability to facilitate a rebalancing of the economy toward consumption have dissipated. Services sectors have been playing a greater role in the transition to a slower but more balanced growth profile that is well underway. As a result, the risks to the economy have been mitigated to the point that a financial crisis is no longer the only possible outcome.
Yesterday’s Economic Growth Engines Are Slowing Figure 1 shows that total fixed asset investment growth and residential building have both slowed dramatically, the latter even more precipitously.
China has been one of the strongest-performing markets over the past year. As of mid-June, China H-shares were up 36% and China A-shares were up 152%, far outpacing broad global equity market returns of just under 3%. During the eight-month period from October 2014 to June 2015, China’s Shanghai Composite Index more than doubled while the economy was slowing and monetary policy was being tightened.
Fig. 1: Fixed Asset Investment, YoY % Change
As of May 2015Source: CEIC
0
5
10
15
20
25
Jan-
13
Mar
-13
May
-13
Jul-1
3
Sep-
13
Nov
-13
Jan-
14
Mar
-14
May
-14
Jul-1
4
Sep-
14
Nov
-14
Jan-
15
Mar
-15
May
-15
totalresidential building

What's Ahead for China? June 2015 | 3
Growth of fixed asset investment halved from a 20%-plus annual pace to about 11% in May 2015. Growth associated with residential building declined from a 23% annual rate in early 2013 to barely 3.5% today. House prices are down 6% year-over-year and only a handful of big cities, such as Shenzhen and Shanghai, are experiencing year-over-year positive price trends.
The total amount of new credit being injected into the Chinese economy peaked in April 2013 and has been declining steadily ever since (figure 2). This also demonstrates that the massive deceleration in aggregate new credit formation and investment has had a relatively mild impact on overall growth so far.
Since 2013, nominal GDP has slowed by about 2% while real GDP growth decelerated by less than 1%, from about 7.8% to just under 7% in the first quarter of 2015. Reflecting the transitioning economy, traditional indicators of China’s growth such as industrial production, steel, cement volume growth, and electricity usage are all slowing dramatically, while consumers are doing remarkably well.
Real wages grew by more than 7% in 2014, indicating that consumption is well supported. Higher incomes, coupled with the proliferation of e-commerce, have taken many of the brick-and-mortar retailers by surprise, an indication that Chinese consumers are doing well. While many traditional retailers are complaining of a tough demand environment, this seems to be more the result of e-commerce competition rather than an overall decline in the pace of retail sales growth.
Moving forward, the more relevant high-frequency indicators for the Chinese economy may be online retail sales, money spent on travel and tourism, and movie box office receipts. The question of whether and how China can grow while rebalancing its economy away from infrastructure and property-led growth supported by a massive credit boom is no longer an academic exercise. Of course, the unfolding slowdown is not over and the transition to more balanced growth is fraught with challenges, but this transition is no longer a pipe dream.
New Government Leadership The Chinese government is managing this economic transition quite adroitly. Emerging signs of credible economic rebalancing have boosted the government’s credibility at home and abroad. At the start of 2013, the consensus view was that China’s government had only one solution to every problem: building more railways and airports. This perception seemed reasonable based on the experience of at least a decade. Barely 18 months on, the new Chinese government has formed a global infrastructure bank despite loud U.S. opposition, launched a regional infrastructure development plan, restrained investment at state-owned enterprises, and neutered the power base in the oil and gas sector just as oil prices fell by nearly half. It has achieved these accomplishments while managing a
“ Growth of fixed asset investment halved from a 20%-plus annual pace to about 11% in May 2015.”
“ The risks to the economy have been mitigated to the point that a financial crisis is no longer the only possible outcome.”
Fig. 2: Social Financing, TRN RMB, AR, 12-m ma
As of April 2015Sources: CEIC, William Blair Analysis
-5
0
5
10
15
20
25
Jan-
08
May
-08
Sep-
08
Jan-
09
May
-09
Sep-
09
Jan-
10
May
-10
Sep-
10
Jan-
11
May
-11
Sep-
11
Jan-
12
May
-12
Sep-
12
Jan-
13
May
-13
Sep-
13
Jan-
14
May
-14
Sep-
14
Jan-
15
equity issuance, non-fin'l corporates corporate bondsbank acceptance bills trust loansentrusted loans bank loans, foreign currencybank loans, CNY
What's Ahead for China? June 2015 | 4
gradual decline in the property and credit markets and slowing the economy just enough to facilitate a rebalancing. Chinese leaders are mere mortals, and mistakes have been and will continue to be made, but the scope and pace of progress are unmistakable.
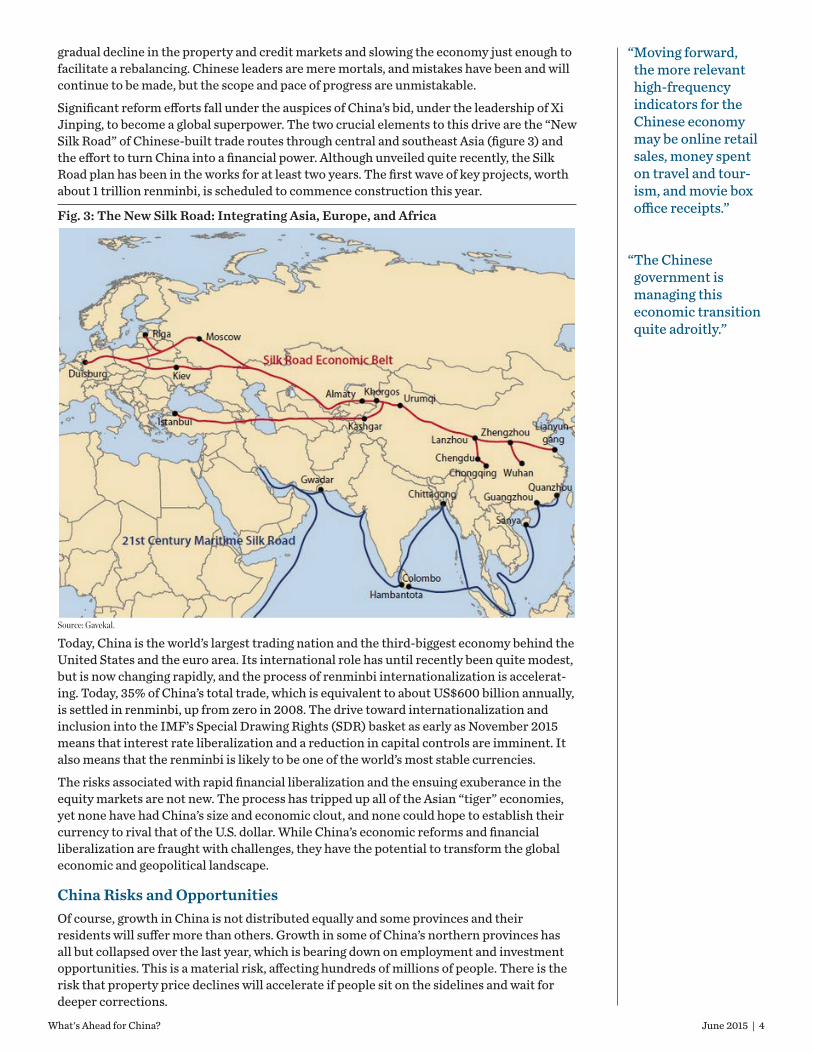
Significant reform efforts fall under the auspices of China’s bid, under the leadership of Xi Jinping, to become a global superpower. The two crucial elements to this drive are the “New Silk Road” of Chinese-built trade routes through central and southeast Asia (figure 3) and the effort to turn China into a financial power. Although unveiled quite recently, the Silk Road plan has been in the works for at least two years. The first wave of key projects, worth about 1 trillion renminbi, is scheduled to commence construction this year.
Today, China is the world’s largest trading nation and the third-biggest economy behind the United States and the euro area. Its international role has until recently been quite modest, but is now changing rapidly, and the process of renminbi internationalization is accelerat-ing. Today, 35% of China’s total trade, which is equivalent to about US$600 billion annually, is settled in renminbi, up from zero in 2008. The drive toward internationalization and inclusion into the IMF’s Special Drawing Rights (SDR) basket as early as November 2015 means that interest rate liberalization and a reduction in capital controls are imminent. It also means that the renminbi is likely to be one of the world’s most stable currencies.
The risks associated with rapid financial liberalization and the ensuing exuberance in the equity markets are not new. The process has tripped up all of the Asian “tiger” economies, yet none have had China’s size and economic clout, and none could hope to establish their currency to rival that of the U.S. dollar. While China’s economic reforms and financial liberalization are fraught with challenges, they have the potential to transform the global economic and geopolitical landscape.
China Risks and OpportunitiesOf course, growth in China is not distributed equally and some provinces and their residents will suffer more than others. Growth in some of China’s northern provinces has all but collapsed over the last year, which is bearing down on employment and investment opportunities. This is a material risk, affecting hundreds of millions of people. There is the risk that property price declines will accelerate if people sit on the sidelines and wait for deeper corrections.
Fig. 3: The New Silk Road: Integrating Asia, Europe, and Africa
Source: Gavekal.
“ Moving forward, the more relevant high-frequency indicators for the Chinese economy may be online retail sales, money spent on travel and tour-ism, and movie box office receipts.”
“ The Chinese government is managing this economic transition quite adroitly.”
What's Ahead for China? June 2015 | 5
Understanding the government’s objective is crucial when investing in China. For example, there has been a focus on correcting corruption, and we expect that to continue. While this remains a risk for some of the casinos in Macau and some of the higher-profile luxury goods companies, there are opportunities for more discreet high-end luxury brands. There are also risks to global, U.S., and European technology companies. The Chinese government is focused on developing its own software and hardware sector, with domestic companies owning and developing the technology. There are new policies coming out of Beijing every day promoting local software, whether it is bank, security, or other software. If there is a viable local product, the large state-owned enterprises are now purchasing that software. While this is a headwind for the global companies operating in China at the moment, it is an opportunity for many Chinese technology companies.
In terms of political risk, the ongoing reform and economic restructuring are billed in China as a nationalistic strategy that underpins the restoration of China’s greatness to its proper place in the global economy and in the geopolitical view of the world—“sacrificing a bit today for greatness tomorrow.” Much of the government’s political and geopolitical legitimacy rests on its ability to deliver rapid growth and opportunities for wealth creation. Examples include the dismantling of the significant legal and bureaucratic barriers to setting up business, and opportunities for growth, with private capital allowed in more and more industries.
An article in the South China Morning Post* detailed reforms in the legal sectors, something that foreign investors are very keen on. The article discussed two reforms, the first regarding establishing an appellate court, freeing the central Supreme Court to interpret laws. The second was jury-based hearings, similar to what exists in the United States. The fact that both of these systems are now already in operation in select southern provinces bodes indicates that Chinese leaders are serious about legal reform. These reforms are necessary for existing and prospective drivers of economic growth, where large data and new-economy-type models increasingly rely on robust intellectual property rights and protections in addition to private property protection.
*South China Morning Post “Pilot Programme Aims to Improve Quality of China’s Top Judges and Prosecutors” June 16, 2014.
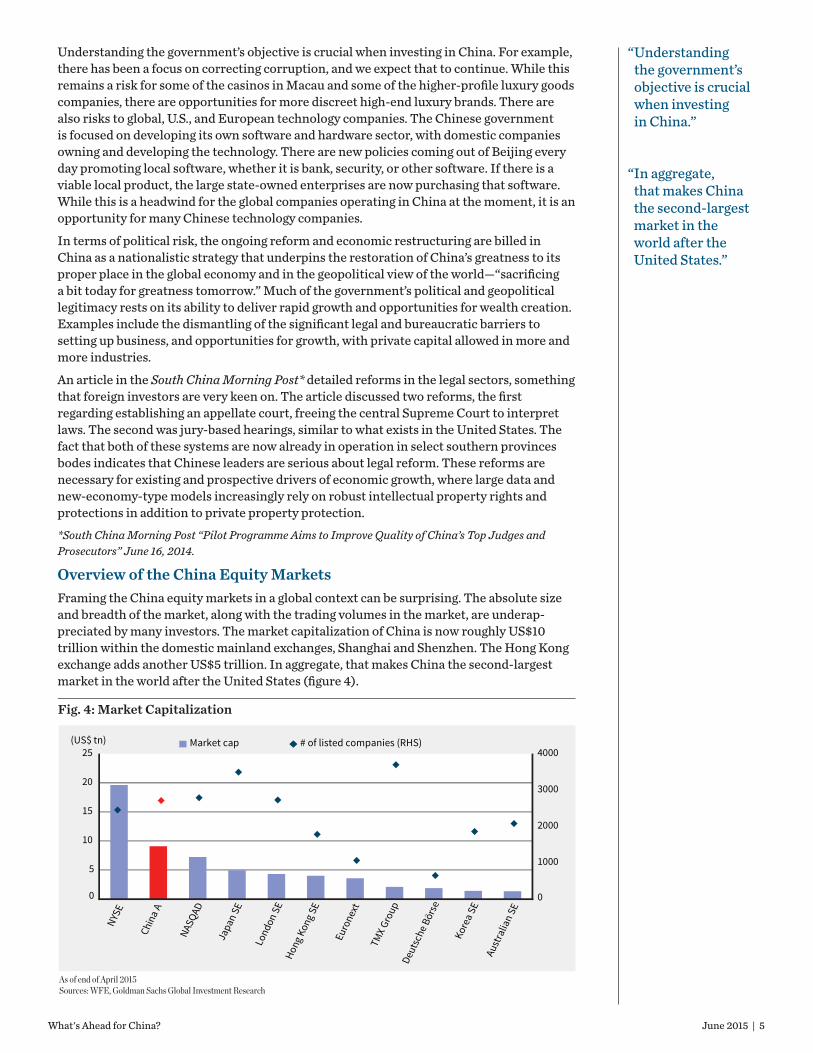
Overview of the China Equity MarketsFraming the China equity markets in a global context can be surprising. The absolute size and breadth of the market, along with the trading volumes in the market, are underap-preciated by many investors. The market capitalization of China is now roughly US$10 trillion within the domestic mainland exchanges, Shanghai and Shenzhen. The Hong Kong exchange adds another US$5 trillion. In aggregate, that makes China the second-largest market in the world after the United States (figure 4).
“ Understanding the government’s objective is crucial when investing in China.”
“ In aggregate, that makes China the second-largest market in the world after the United States.”
Fig. 4: Market Capitalization
As of end of April 2015Sources: WFE, Goldman Sachs Global Investment Research
0
1000
2000
3000
4000
0
5
10
15
20
25
NYSE
Chin
a A
NASQ
AD
Japa
n SE
Lond
on S
EHo
ng K
ong S
E
Euro
next
TMX G
roup
Deut
sche
Bör
se
Kore
a SE
Aust
ralia
n SE
Market cap # of listed companies (RHS)(US$ tn)
What's Ahead for China? June 2015 | 6
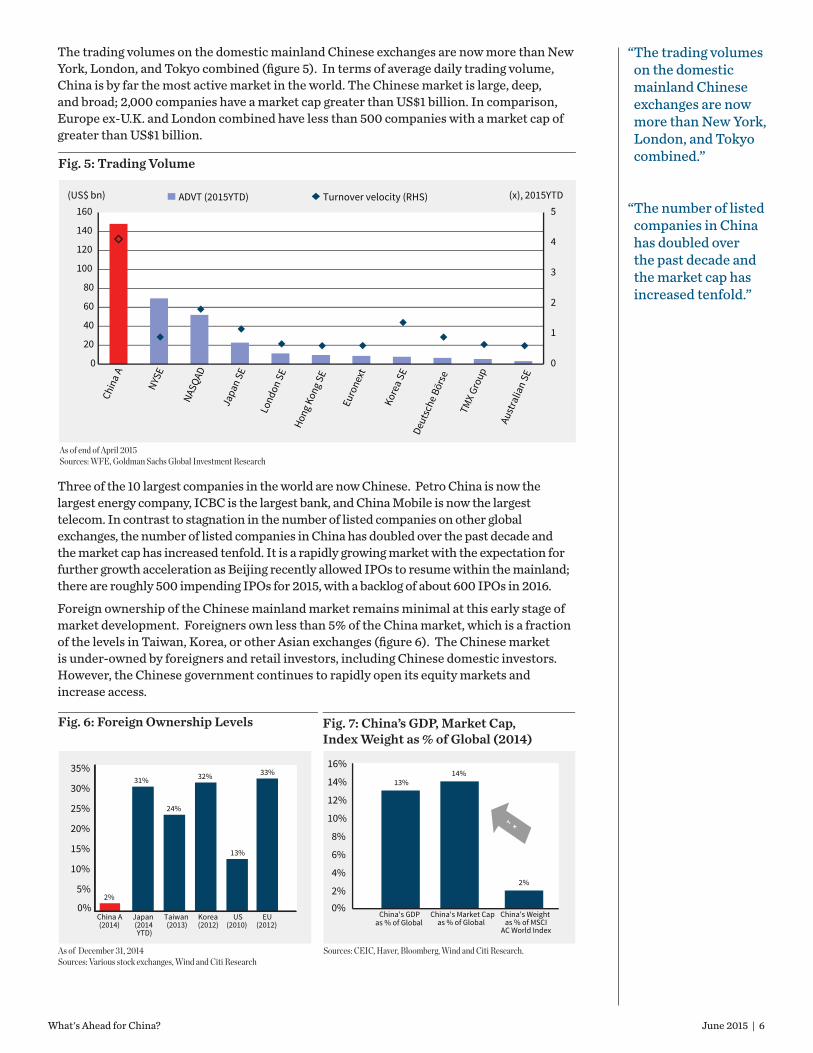
The trading volumes on the domestic mainland Chinese exchanges are now more than New York, London, and Tokyo combined (figure 5). In terms of average daily trading volume, China is by far the most active market in the world. The Chinese market is large, deep, and broad; 2,000 companies have a market cap greater than US$1 billion. In comparison, Europe ex-U.K. and London combined have less than 500 companies with a market cap of greater than US$1 billion.
Three of the 10 largest companies in the world are now Chinese. Petro China is now the largest energy company, ICBC is the largest bank, and China Mobile is now the largest telecom. In contrast to stagnation in the number of listed companies on other global exchanges, the number of listed companies in China has doubled over the past decade and the market cap has increased tenfold. It is a rapidly growing market with the expectation for further growth acceleration as Beijing recently allowed IPOs to resume within the mainland; there are roughly 500 impending IPOs for 2015, with a backlog of about 600 IPOs in 2016.
Foreign ownership of the Chinese mainland market remains minimal at this early stage of market development. Foreigners own less than 5% of the China market, which is a fraction of the levels in Taiwan, Korea, or other Asian exchanges (figure 6). The Chinese market is under-owned by foreigners and retail investors, including Chinese domestic investors. However, the Chinese government continues to rapidly open its equity markets and increase access.
Fig. 5: Trading Volume
As of end of April 2015Sources: WFE, Goldman Sachs Global Investment Research
0
1
2
3
4
5
0
20
40
60
80
100
120
140
160
Chin
a A
NYSE
NASQ
AD
Japa
n SE
Lond
on S
EHo
ng K
ong S
E
Euro
next
Kore
a SE
Deut
sche
Bör
se
TMX
Grou
p
Aust
ralia
n SE
ADVT (2015YTD) Turnover velocity (RHS)(US$ bn) (x), 2015YTD
“ The trading volumes on the domestic mainland Chinese exchanges are now more than New York, London, and Tokyo combined.”
“ The number of listed companies in China has doubled over the past decade and the market cap has increased tenfold.”
Fig. 6: Foreign Ownership Levels
As of December 31, 2014Sources: Various stock exchanges, Wind and Citi Research
2%
31%
24%
32%
13%
33%
5%
10%
15%
20%
25%
30%
35%
China A(2014)
Japan(2014 YTD)
Taiwan(2013)
Korea(2012)
US(2010)
EU(2012)
0%
Sources: CEIC, Haver, Bloomberg, Wind and Citi Research.
13%14%
2%
0%2%
4%
6%
8%
10%
12%
14%
16%
China's GDPas % of Global
China's Market Capas % of Global
China's Weight as % of MSCI
AC World Index
Fig. 7: China’s GDP, Market Cap, Index Weight as % of Global (2014)

What's Ahead for China? June 2015 | 7
The QFII and RQFII programs have rapidly expanded. These programs are designed to give foreign investors access to the local markets on a limited basis. The Chinese government doubled the quota for the QFII program 12 to 18 months ago. It recently announced the Shanghai–Hong Kong Connect, which enables foreign investors to buy mainland shares on the Hong Kong exchange. This activity has garnered the attention of global index providers FTSE and MSCI. China’s GDP and market cap weight, as a percent of the global totals, is roughly 15%. Yet because China A-shares are not included in the indices, China’s weight in the MSCI AC World Index is only about 2% (figure 7). China therefore remains significantly under-represented in the global indices. Both FTSE and MSCI have recently announced plans regarding China A-share inclusion in their emerging markets indices, acknowledging this misrepresentation.
FTSE has stated that it will create provisional indices that include the China A-shares at an initial 5% weight, with A-shares eventually constituting 25% of its emerging markets indices. A week following FTSE’s announcement, MSCI stated that A-shares will not be joining its indices in 2016, but could be an option in 2017, provided that China continues to increase market access and address other issues related to foreign ownership. Initially, China A-shares would account for roughly 1% of MSCI’s emerging markets indices and gradually increase to about 20%. That would make China roughly 45% of MSCI’s overall emerging markets index including U.S.-listed ADRs and China equities listed in Hong Kong (figure 8).
We expect funds will continue to move into the Chinese domestic market as investors in-creasingly look to diversify their China exposure and it becomes clear that A-shares will be included in indices over the coming years.
While the index providers have given market participants time to prepare, the size of the A-share market presents a challenge for global investors. The transition will be gradual, with A-shares initially representing a minimal percentage of the indices. Then, similar to Korea and Taiwan, over five to seven years, the weightings will gradually increase as access to the market improves. It is not unreasonable to assume that in 10 years A-shares will be the largest market in the emerging markets indices.
Fig. 8: MSCI EM Index Potential Full Inclusion (100%*)
Source: MSCI*The percentage number refers to the Inclusion Factor applied to the free float-adjusted market capitalization of China A-share constituents in the pro forma MSCI China Index. China A-share securities are subject to a foreign ownership limit of 30%.
China 20.3%
China A - Shares 20.5%
China Overseas 2.8%Korea 11.0%
Taiwan 9.8%
South Africa 5.6%
Brazil 5.5%
Mexico 3.5%
Russia 3.0%
Others 12.8%
India 5.2% China43.6%
EmergingMarket
“ China therefore remains significantly under-represented in the global indices.”
“ It is not unreasonable to assume that in 10 years A-shares will be the largest market in the emerging markets indices.”

What's Ahead for China? June 2015 | 8
Drivers of the Chinese Domestic MarketHousing still accounts for a vast majority of Chinese investment and Chinese wealth (figure 9).
This appears to be something that the government would like to change, although real estate has historically been a prime driver of investment in the Chinese economy. As the government transitions away from fixed asset investment and real estate and moves toward a more consumption-driven economy, there are significant implications for the composition of household balance sheets and growth in consumer-related companies.
Chinese households have less than 10% of their liquid assets invested in the equity market and nearly 75% in cash (figure 10).
Given that the economy is rebalancing, it is reasonable to expect Chinese households to move money out of real estate and cash. We would expect this to hold true for pension funds and insurance funds, since they also have very small equity market allocations that should gradually move higher.
“ Chinese households have less than 10% of their liquid assets invested in the equity market and nearly 75% in cash.”
Fig. 9: Housing Assets as % of Total Household Balance Sheets
Source: NomuraNote: OECD countries as of 2010; others as of 2000 except stated otherwise.
90
80
70
60
50
40
30
20
10
010,000 20,000 30,000 40,000 50,000 60,000
Korea (2006)
Japan (1990)
Spain
China (2010)
Indonesia
India
New Zealand USASingaporeFrance Germany
AustraliaJapan
ItalyTaiwan
Canada Netherlands
Fig. 10: Composition of Household Financial Balance Sheets
Source: Deutsche BankNote: China and Taiwan as of 2012; others as of 2013
100%
90%
80%
70%
60%
50%
40%
30%
20%
10%
0%
Currency
Others
Other Securities
Insurance & Pension
Mutual Fund
Equity
CN JP UK KR AU TW US
72%
7%
11%
7%2%
54%
3%
27%
9%5%
28%
3%
56%
10%2%
45%
5%
29%
17%
3%
45% 0%
59%
17%
22%
7%
22%
42%
6%
2%
21%
9%
11%
15%
31%
33%
What's Ahead for China? June 2015 | 9
China Sector ThemesWe continue to see a transition away from the traditional growth drivers of steel, cement, fixed asset investment, and real estate in China. Conversely, there has been significantly higher growth and strong demand for e-commerce–related companies. Reflecting these growth trends, William Blair has focused less on heavy machinery, building materials, building, cement, and other fixed asset investment related sectors. We are currently more positive on consumption, including the consumer staples, consumers discretionary, healthcare, and IT sectors.
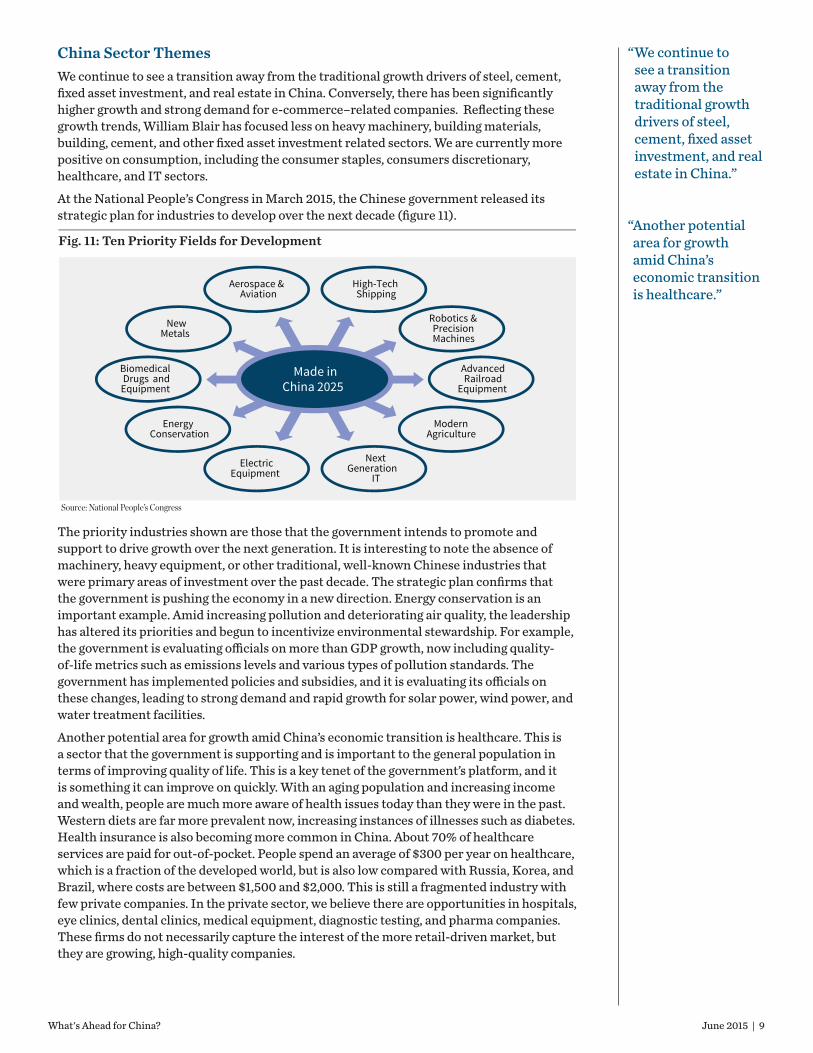
At the National People’s Congress in March 2015, the Chinese government released its strategic plan for industries to develop over the next decade (figure 11).
The priority industries shown are those that the government intends to promote and support to drive growth over the next generation. It is interesting to note the absence of machinery, heavy equipment, or other traditional, well-known Chinese industries that were primary areas of investment over the past decade. The strategic plan confirms that the government is pushing the economy in a new direction. Energy conservation is an important example. Amid increasing pollution and deteriorating air quality, the leadership has altered its priorities and begun to incentivize environmental stewardship. For example, the government is evaluating officials on more than GDP growth, now including quality-of-life metrics such as emissions levels and various types of pollution standards. The government has implemented policies and subsidies, and it is evaluating its officials on these changes, leading to strong demand and rapid growth for solar power, wind power, and water treatment facilities.
Another potential area for growth amid China’s economic transition is healthcare. This is a sector that the government is supporting and is important to the general population in terms of improving quality of life. This is a key tenet of the government’s platform, and it is something it can improve on quickly. With an aging population and increasing income and wealth, people are much more aware of health issues today than they were in the past. Western diets are far more prevalent now, increasing instances of illnesses such as diabetes. Health insurance is also becoming more common in China. About 70% of healthcare services are paid for out-of-pocket. People spend an average of $300 per year on healthcare, which is a fraction of the developed world, but is also low compared with Russia, Korea, and Brazil, where costs are between $1,500 and $2,000. This is still a fragmented industry with few private companies. In the private sector, we believe there are opportunities in hospitals, eye clinics, dental clinics, medical equipment, diagnostic testing, and pharma companies. These firms do not necessarily capture the interest of the more retail-driven market, but they are growing, high-quality companies.
Fig. 11: Ten Priority Fields for Development
New Metals
Robotics & Precision Machines
Biomedical Drugs and
Equipment
Advanced Railroad
Equipment
Aerospace & Aviation
High-TechShipping
Next Generation
ITElectric
Equipment
Modern Agriculture
Energy Conservation
Made in China 2025
Source: National People’s Congress
“ We continue to see a transition away from the traditional growth drivers of steel, cement, fixed asset investment, and real estate in China.”
“ Another potential area for growth amid China’s economic transition is healthcare.”

What's Ahead for China? June 2015 | 10
ValuationsFollowing the strong rally in the Chinese market, investors are understandably concerned about equity valuations. Looking at valuations in the H-share market (figure 12, top), we can see that China was at very depressed levels for a few years and has since experienced a strong recovery. Valuations for the H-share market on average are still relatively reasonable, at roughly 10x earnings. While valuations in Hong Kong–listed companies have recovered to their historical average levels, they are still at a discount relative to other emerging markets and global indices (figure 12, bottom).
Fig. 12: MSCI ACWI IMI: China - 6/30/2005 to 5/31/2015
Source: Summit - William Blair’s proprietary research management & investment process platform. As of May 31, 2015. Line charts represent the China portion of the MSCI ACWI IMI index. MSCI All Country World IMI Index is a free float-adjusted market capitalization index that is designed to measure equity market performance in the global developed and emerging markets. Past returns are no guarantee of future performance. A direct investment in an unmanaged index is not possible.
22.0x
20.0x
18.0x
16.0x
14.0x
12.0x
10.0x
8.0x
6.0x2006 2008 2010 2012 2014
60%
40%
20%
0%
-20%
-40%
2006 2008 2010 2012 2014
P/E
FY2
% D
i�er
ence
in P
/E F
Y2
FY2 P/E
Premium Discount to ROW
+/1 St Dev
Avg: -15%
+/1 St Dev-34%
+/1 St Dev
Avg: 10.8x
+/1 St Dev
10.2x
“ Following the strong rally in the Chinese market, investors are understandably concerned about equity valuations.”

What's Ahead for China? June 2015 | 11
However, when observing the A-share market, we see valuations that are more extended. The broad A-share market (figure 13) valuations are roughly 17x, which is slightly above the long-term average of 15x. This looks more reasonable when considering the broad A-share market’s prior peaks, especially in 2007, when valuations peaked at 35x.
Although the headline valuations may not appear overly extended, sector-level valuations tell a different story, with increasingly stretched multiples in areas such as software, healthcare, media, telecoms, and hardware (figure 14).
Many of these end-markets have the government’s support, and valuations have become extended at multiple standard deviations above their long-term averages. Conversely, traditional sectors such as banks and property are no longer growing and are being de-emphasized in the economy, with P/E multiples of 7.6x.
Fig. 13: 12-Month Forward P/E Multiple
As of May 2015Sources: Bloomberg Finance LP, Duetsche Bank Strategy Research
40x
35x
30x
25x
20x
15x
10x
5x
Jan-
06M
ay-0
6Se
p-06
Jan-
07M
ay-0
7Se
p-07
Jan-
08M
ay-0
8Se
p-08
Jan-
09M
ay-0
9Se
p-09
Jan-
10M
ay-1
0Se
p-10
Jan-
11M
ay-1
1Se
p-11
Jan-
12M
ay-1
2Se
p-12
Jan-
13M
ay-1
3Se
p-13
Jan-
14M
ay-1
4Se
p-14
Jan-
15M
ay-1
5
12 m fwd P/E35.5x
27.5x
8.9x
16.5x
7.6x
16.5xAverage = 14.7x
+1 std. dev. = 20.9x
-1 std. dev. = 8.5x
CSI 300 index
Fig. 14: 12-Month Forward P/E Multiple - Sector Level
As of June 5, 2015Sources: CSI, I/B/E/S, MSCI, Wind, Goldman Sachs Global Investment Research
80 70 60 50 40 30 20 10
0
CSI3
000
Met
als/
Min
ing
So�w
are
Hea
lth c
are
Med
ia
Stel
/alu
mi
Har
dwar
e
Tele
co
Insu
ranc
e
Chem
ical
s
Stap
les
Disc
retio
nary
Oil
and
gas
Tran
spor
tatio
n
Indu
stria
ls
Build
ing
mat
’ls
Util
ities
Auto
s
Prop
erty
Bank
s
12M
forw
ard
P/E
(x)
18.0
72.8 71.1
35.0
49.4 51.4
32.9
46.7
19.9
28.922.4 18.9
30.3
20.1
32.2
13.119.6
12.0 11.97.6
5 years historical data used
High/low +/- Std dev Current
“ When observing the A-share market, we see valuations that are more extended.”

What's Ahead for China? June 2015 | 12
It is also informative to look at valuations on an equal-weighted basis (figure 15, top), given the impact of less expensive large-cap banks, telecom, and energy companies on the market-cap-weighted indices. The SSE50 consists of the 50 largest companies, where the equal-weighted P/E multiple is a lofty 50x. The ChiNext, which is China’s version of NASDAQ, has a P/E multiple above 150x. The A-shares index P/E multiple is above 100x, indicating extended valuations in the small-/midcap segment of the market. Furthermore, about 1,700 of the 2,300 listed companies in China have a P/E multiple greater than 50x (figure 15, bottom).
“ About 1,700 of the 2,300 listed companies in China have a P/E multiple greater than 50x.”
Cumulative % of market cap (RHS)No. of A-shares by 12m trailing P/E
1882
346
20%11%
562 & 31%
51%
70%
95%
P/E @ 20-50x691 A-shrs & 19% cap
P/E @ 50-100x988 A-shrs & 25% cap
P/E @ > 100x
Fig. 15
Source: Wind, Deutsche Bank Strategy ResearchAs of May 15, 2015
180x
160x
140x
120x
100x
80x
60x
40x
20x
0x2006 2007 2008 2009 2010 2011 2012 2013 2014 2015
500
400
300
200
100
0
Valuation by Market Capitalization
Distribution of P/E Multiples
<10x
10-2
0x
20-3
0x
30-4
0x
40-5
0x
50-6
0x
60-7
0x
70-8
0x
80-9
0x
90-1
00x
100-
150x
150-
200x
200-
400x
400-
600x
600-
800x
800-
1000
x
>100
0x
Loss
mak
ing
SSE5053x
SSE50Equal-weight 12m trailing P/E(ex. negative and >1000x)
All A-share ChiNext CSI1500
ChiNext166x
CS1500106x
All A-shr137x
135x
123x111x

What's Ahead for China? June 2015 | 13
There has also been an increasing focus on the valuation disparity between A-share and H-shares, particularly with respect to dual-listed companies. Securities in the A-share market trade, on average, at a 50% premium to the H-share market, and that disparity is expected to continue. There were expectations that the Hong Kong–Shanghai Connect would close the valuation gap, but we have not seen that yet. There are still significant technical barriers to closing and arbitraging that gap in terms of investors’ ability to access the Connect. Some investors are trying to continue to arbitrage that opportunity, but the Chinese domestic investor market is over 50% retail-oriented, and they have not been interested in the large banks, utilities, steel, and cement companies listed in Hong Kong. The lack of investor interest has allowed the valuation gap to persist, and it has actually widened recently.
The strong rally in China has led to extended valuations that have coincided with additional market dynamics warranting investor caution in the near term, including a significant increase in new brokerage account openings and margin debt usage (figure 16).
While there is currently a disconnect between A-share and H-share valuations, figure 17 shows that over the past 10 years the markets have been highly correlated at 0.82.
Fig. 16: Margin Debt as % of Estimated Free Float
May 2015Source: Wind, Bloomberg, Macquarie Research
10%9%8%7%6%5%4%3%2%1%0%
Apr-3
0M
ay-8
1Ju
n-82
Jul-8
3Au
g-84
Sep-
85O
ct-8
6N
ov-8
7De
c-88
Jan-
90Fe
b-91
Mar
-92
Apr-9
3M
ay-9
4Ju
n-95
Jul-9
6Au
g-97
Sep-
98O
ct-9
9N
ov-0
0De
c-01
Jan-
03Fe
b-04
Mar
-05
Apr-0
6M
ay-0
7Ju
n-08
Jul-0
9Au
g-10
Sep-
11O
ct-1
2N
ov-1
3De
c-14
Taiwan (TWSE + Gre Tai) Japan (TSE) US (NYSE) China (SH+SZ)8.9%
Fig. 17: A and H-Shares are Highly Correlated
As of May 27, 2015Source: BofA Merrill Lynch Global Research, Bloomberg
20,000
18,500
17,000
15,500
14,000
12,500
11,000
9,500
8,000
6,500
5,0001/06 1/07 1/08 1/09 1/10 1/11 1/12 1/13 1/14 1/15
5,000
4,500
4,000
3,500
3,000
2,500
2,000
1,500
1,000
China H Share (HSCEI Index), RS
China A and B Share (SCHCOMP Index), LS
Correlation (2006 - 2015) = 0.82
“ The strong rally in China has led to extended valuations that have coincided with additional market dynamics warranting investor caution in the near term.”

What's Ahead for China? June 2015 | 14
SummaryWe believe that the strong Chinese equity market rally, extended valuations, and speculative activity warrant investor caution in the near term. For the longer term, we remain positive on the outlook for Chinese growth, policy initiatives/reforms, and economic rebalancing. From the perspective of active portfolio management, China is a large, under-researched market that has great long-term appeal given the prevalence of small, undiscovered companies that are favorably exposed to the improving environment for consumption and services. Ongoing financial market reforms have been acknowledged by global index providers, with significant implications for asset allocations and flows in the coming years as benchmarks begin to more accurately reflect China’s growing global footprint. We believe all of these factors will increase China’s relevance for global investors and demand increased attention going forward.

What's Ahead for China? June 2015 | 15
About the AuthorsCasey K. Preyss, CFA, PartnerCasey is a Portfolio Manager for the Emerging Markets Growth and China A-Shares strategies. Since joining William Blair in 2000, Casey has been a research analyst covering Industrials, IT and Resources and has also served as the Global Industrials Sector Team Leader. Prior to his fundamental research responsibilities Casey was a Quantitative Analyst with the team. Prior to joining the firm, Casey was with Thomas White International as an International Equity Research Sales Associate. Education: B.S. B.A., The Ohio State University; M.B.A., University of Chicago Booth School of Business.
Olga BitelOlga joined William Blair in 2009. She is responsible for economic research across all regions and sectors. Prior to joining the firm, Olga was a Senior Economist at the National Institute of Economic and Social Research in London, U.K., where she was responsible for macroeconomic forecasting and thematic research projects for international organizations and government bodies. Education: B.A., University of Chicago; M.Sc. Economics, London School of Economics and Political Science.

DisclosuresThis material is provided for information purposes only and is not intended as investment advice or a rec-ommendation to buy or sell any particular security. Any discussion of particular topics is not meant to be comprehensive and may be subject to change. Data shown does not represent the performance or charac-teristics of any William Blair product or strategy. Any investment or strategy mentioned herein may not be suitable for every investor. Factual information has been taken from sources we believe to be reliable, but its accuracy, completeness or interpretation cannot be guaranteed. Past performance is not indicative of future results. Information and opinions expressed are those of the author and may not reflect the opinions of other investment teams within William Blair Investment Management, LLC or the investment management division of William Blair & Company, L.L.C. Information is current as of the date appearing in this material only and subject to change without notice.
This material is distributed in the United Kingdom and European Economic Area (EEA) by William Blair International, Ltd., authorised and regulated by the Financial Conduct Authority (FCA), and is directed only at, and is only made available to, persons falling within Article 9, 38, 47, and 49 of the Financial Services and Markets Act 2000 (Financial Promotion) Order 2005 (all such persons being referred to as “relevant persons”). This document is intended for persons regarded as professional investors (or equivalent) and is not to be distributed or passed on to any “retail clients.” No persons other than persons to whom this document is directed should rely on it or its contents or use it as the basis to make an investment decision.
This document is distributed in Australia by William Blair & Company, LLC ("William Blair"), which is exempt from the requirement to hold an Australian financial services license under Australia’s Corpora-tions Act 2001 (Cth) pursuant to ASIC Class Order 03/1100. William Blair is registered as an investment advisor with the U.S. Securities and Exchange Commission ("SEC") and regulated by the SEC under the U.S. Investment Advisers Act of 1940, which differs from Australian laws. This document is distributed only to wholesale clients as that term is defined under Australia’s Corporations Act 2001 (Cth). This document is not intended for distribution or dissemination, directly or indirectly, to any other class of persons. It is being supplied to you solely for your information and may not be reproduced, forwarded to any other person or published, in whole or in part, for any purpose.