blair hamilton
DESCRIPTION
EFFICIENCY VERMONT COST-EFFECTIVENESS SCREENING PRESENTATION TO COST-EFFECTIVENESS SCREENING WORKSHOP WORKSHOP - JUNE 25, 2009. Blair Hamilton. A Brief Summary of Relevant PSB Orders. Docket 5270 (1990) - PowerPoint PPT PresentationTRANSCRIPT
1
EFFICIENCY VERMONT COST-EFFECTIVENESS SCREENING
PRESENTATION TO COST-EFFECTIVENESS SCREENING WORKSHOP
WORKSHOP - JUNE 25, 2009
Blair Hamilton
2
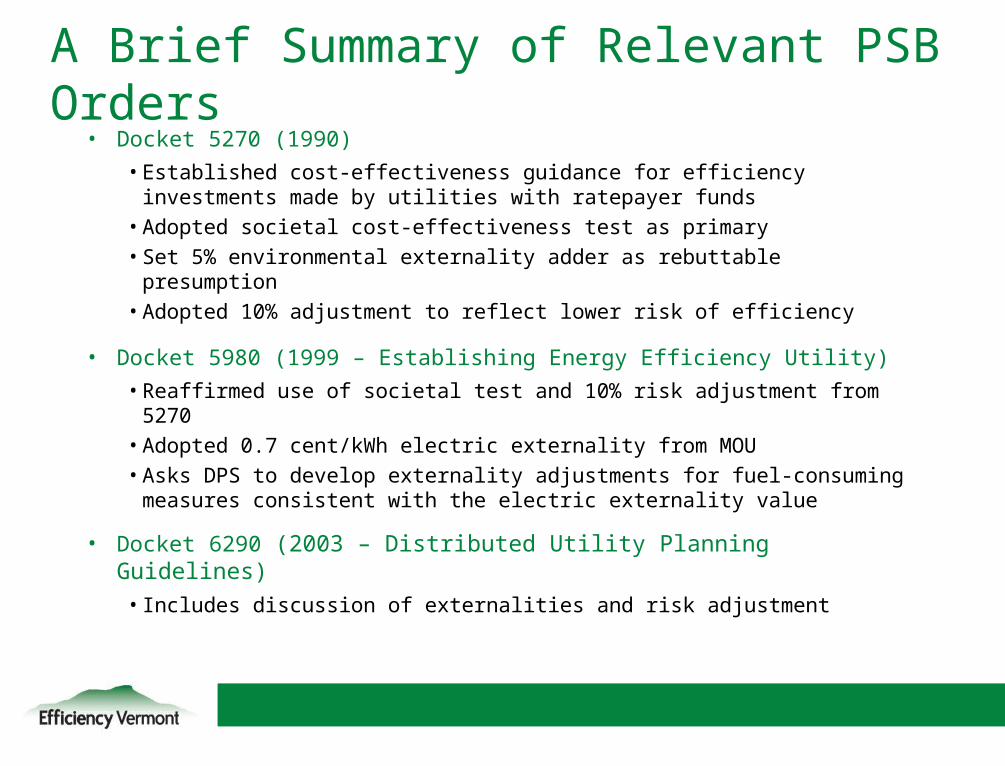
A Brief Summary of Relevant PSB Orders
• Docket 5270 (1990)• Established cost-effectiveness guidance for efficiency investments
made by utilities with ratepayer funds• Adopted societal cost-effectiveness test as primary • Set 5% environmental externality adder as rebuttable presumption• Adopted 10% adjustment to reflect lower risk of efficiency
• Docket 5980 (1999 – Establishing Energy Efficiency Utility)• Reaffirmed use of societal test and 10% risk adjustment from 5270• Adopted 0.7 cent/kWh electric externality from MOU• Asks DPS to develop externality adjustments for fuel-consuming
measures consistent with the electric externality value
• Docket 6290 (2003 – Distributed Utility Planning Guidelines)• Includes discussion of externalities and risk adjustment
3
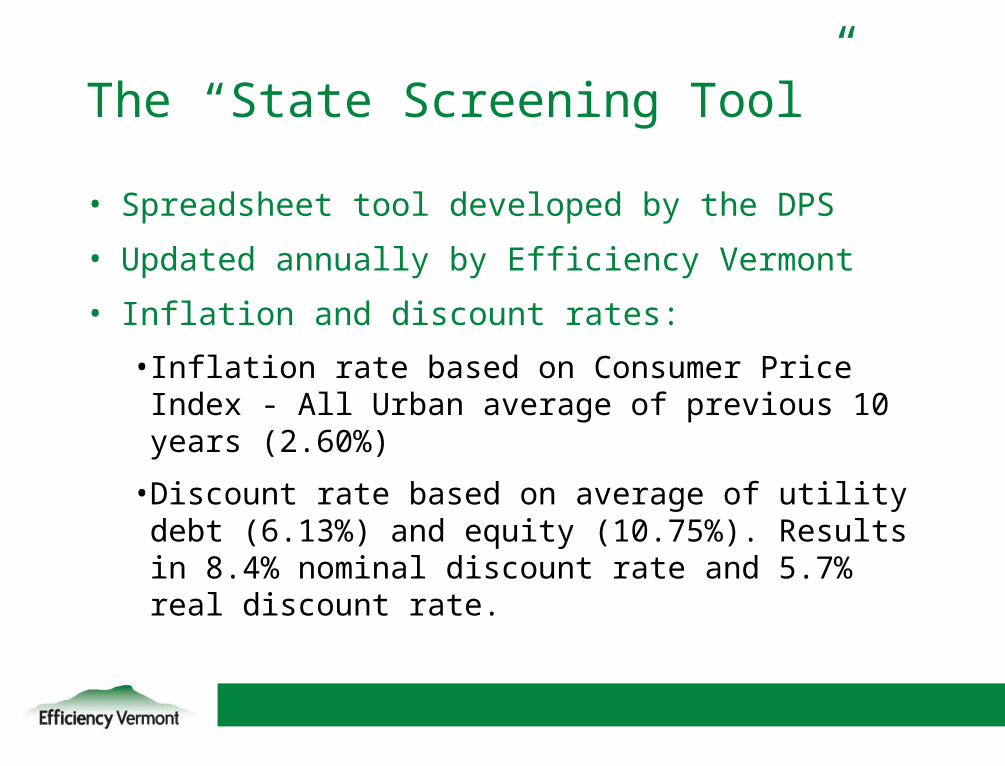
The “State Screening Tool”
• Spreadsheet tool developed by the DPS
• Updated annually by Efficiency Vermont
• Inflation and discount rates:
•Inflation rate based on Consumer Price Index - All Urban average of previous 10 years (2.60%)
•Discount rate based on average of utility debt (6.13%) and equity (10.75%). Results in 8.4% nominal discount rate and 5.7% real discount rate.
4
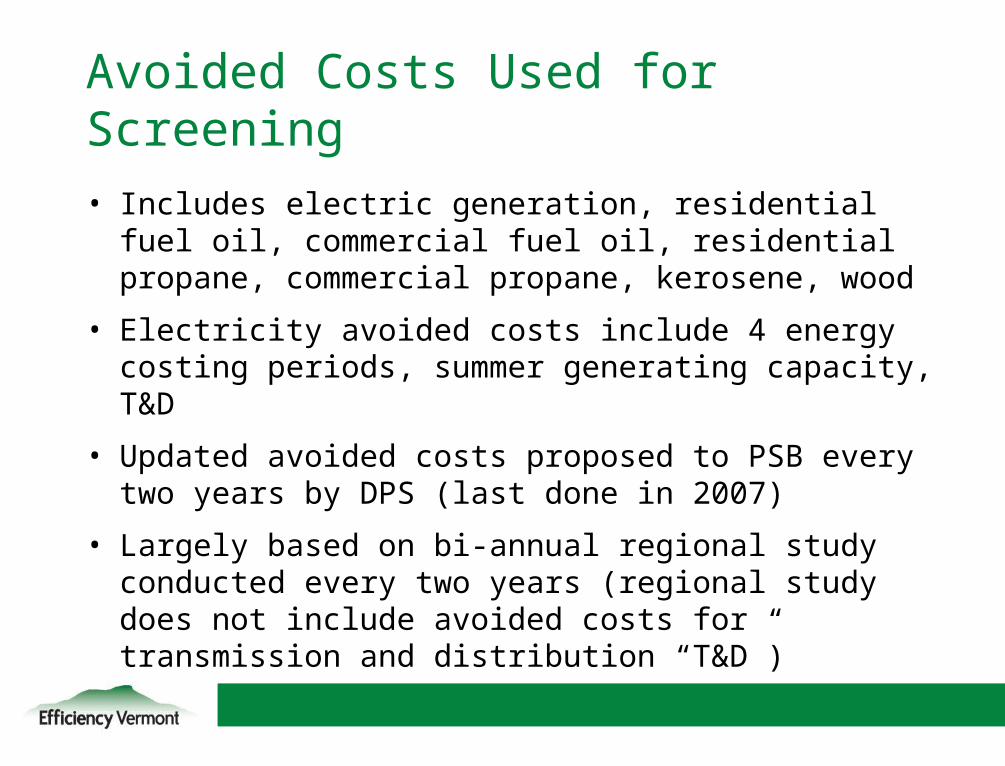
Avoided Costs Used for Screening
• Includes electric generation, residential fuel oil, commercial fuel oil, residential propane, commercial propane, kerosene, wood
• Electricity avoided costs include 4 energy costing periods, summer generating capacity, T&D
• Updated avoided costs proposed to PSB every two years by DPS (last done in 2007)
• Largely based on bi-annual regional study conducted every two years (regional study does not include avoided costs for transmission and distribution “T&D”)
5
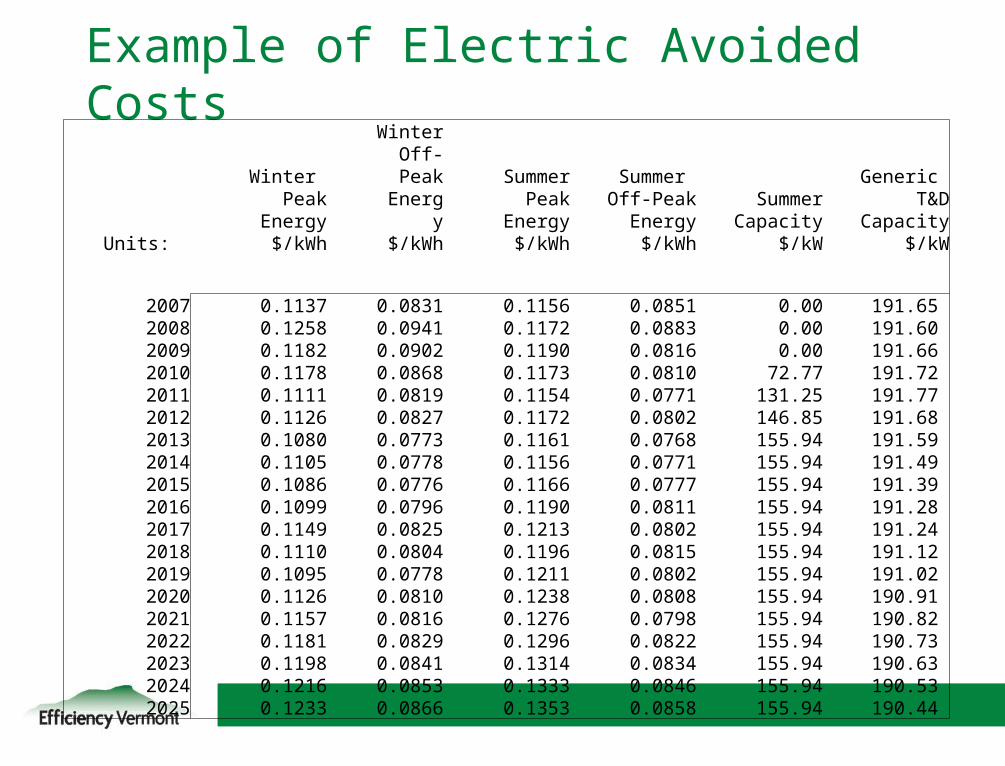
Example of Electric Avoided Costs
Winter Peak Energy
Winter Off-Peak
Energy
Summer Peak
Energy
Summer Off-Peak
EnergySummerCapacity
Generic T&D
CapacityUnits: $/kWh $/kWh $/kWh $/kWh $/kW $/kW
2007 0.1137 0.0831 0.1156 0.0851 0.00 191.65 2008 0.1258 0.0941 0.1172 0.0883 0.00 191.60 2009 0.1182 0.0902 0.1190 0.0816 0.00 191.66 2010 0.1178 0.0868 0.1173 0.0810 72.77 191.72 2011 0.1111 0.0819 0.1154 0.0771 131.25 191.77 2012 0.1126 0.0827 0.1172 0.0802 146.85 191.68 2013 0.1080 0.0773 0.1161 0.0768 155.94 191.59 2014 0.1105 0.0778 0.1156 0.0771 155.94 191.49 2015 0.1086 0.0776 0.1166 0.0777 155.94 191.39 2016 0.1099 0.0796 0.1190 0.0811 155.94 191.28 2017 0.1149 0.0825 0.1213 0.0802 155.94 191.24 2018 0.1110 0.0804 0.1196 0.0815 155.94 191.12 2019 0.1095 0.0778 0.1211 0.0802 155.94 191.02 2020 0.1126 0.0810 0.1238 0.0808 155.94 190.91 2021 0.1157 0.0816 0.1276 0.0798 155.94 190.82 2022 0.1181 0.0829 0.1296 0.0822 155.94 190.73 2023 0.1198 0.0841 0.1314 0.0834 155.94 190.63 2024 0.1216 0.0853 0.1333 0.0846 155.94 190.53 2025 0.1233 0.0866 0.1353 0.0858 155.94 190.44
6
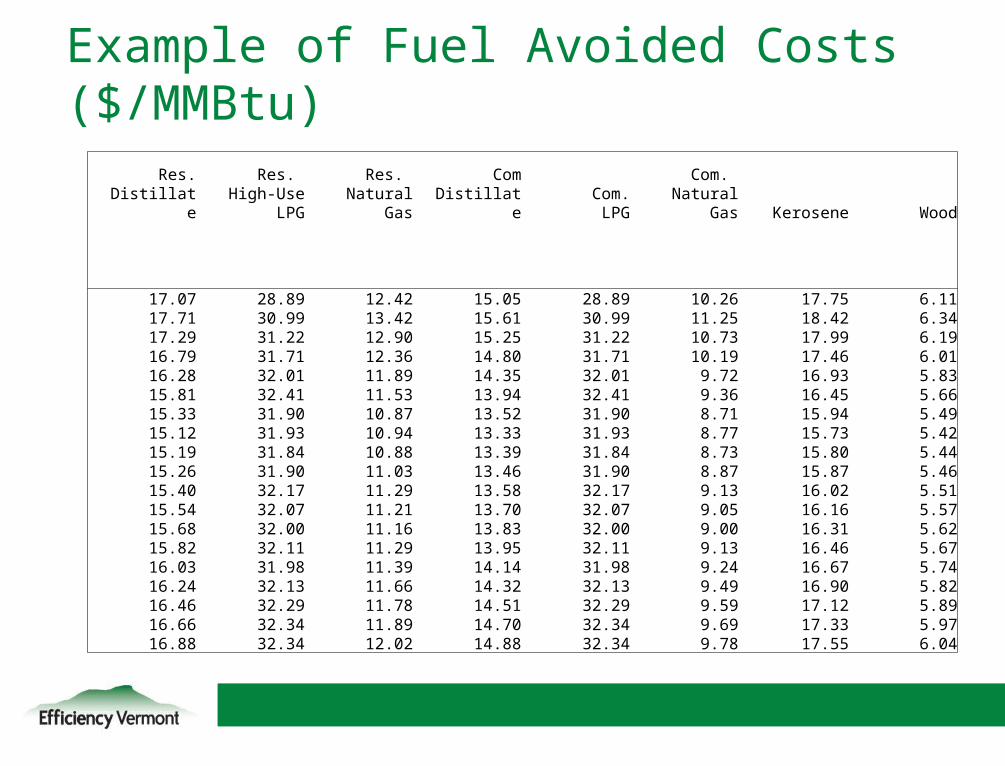
Res.Distillate
Res. High-Use
LPG
Res. Natural
GasCom
DistillateCom. LPG
Com. Natural
Gas Kerosene Wood
17.07 28.89 12.42 15.05 28.89 10.26 17.75 6.1117.71 30.99 13.42 15.61 30.99 11.25 18.42 6.3417.29 31.22 12.90 15.25 31.22 10.73 17.99 6.1916.79 31.71 12.36 14.80 31.71 10.19 17.46 6.0116.28 32.01 11.89 14.35 32.01 9.72 16.93 5.8315.81 32.41 11.53 13.94 32.41 9.36 16.45 5.6615.33 31.90 10.87 13.52 31.90 8.71 15.94 5.4915.12 31.93 10.94 13.33 31.93 8.77 15.73 5.4215.19 31.84 10.88 13.39 31.84 8.73 15.80 5.4415.26 31.90 11.03 13.46 31.90 8.87 15.87 5.4615.40 32.17 11.29 13.58 32.17 9.13 16.02 5.5115.54 32.07 11.21 13.70 32.07 9.05 16.16 5.5715.68 32.00 11.16 13.83 32.00 9.00 16.31 5.6215.82 32.11 11.29 13.95 32.11 9.13 16.46 5.6716.03 31.98 11.39 14.14 31.98 9.24 16.67 5.7416.24 32.13 11.66 14.32 32.13 9.49 16.90 5.8216.46 32.29 11.78 14.51 32.29 9.59 17.12 5.8916.66 32.34 11.89 14.70 32.34 9.69 17.33 5.9716.88 32.34 12.02 14.88 32.34 9.78 17.55 6.04
Example of Fuel Avoided Costs ($/MMBtu)
7
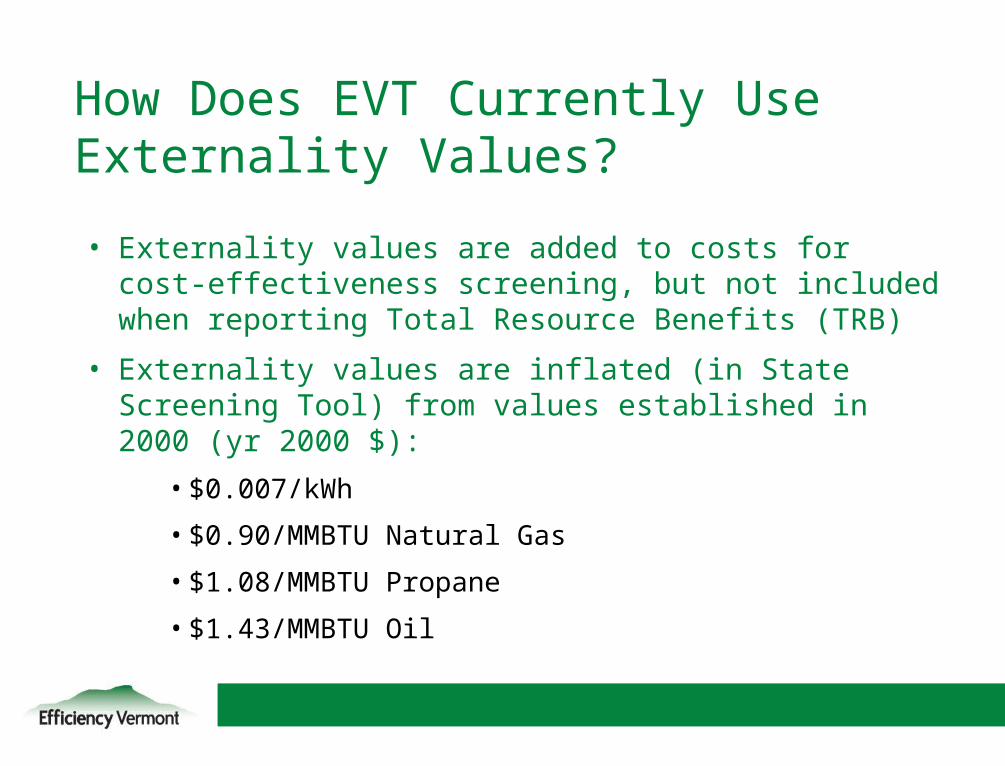
• Externality values are added to costs for cost-effectiveness screening, but not included when reporting Total Resource Benefits (TRB)
• Externality values are inflated (in State Screening Tool) from values established in 2000 (yr 2000 $):
• $0.007/kWh
• $0.90/MMBTU Natural Gas
• $1.08/MMBTU Propane
• $1.43/MMBTU Oil
How Does EVT Currently Use Externality Values?
8
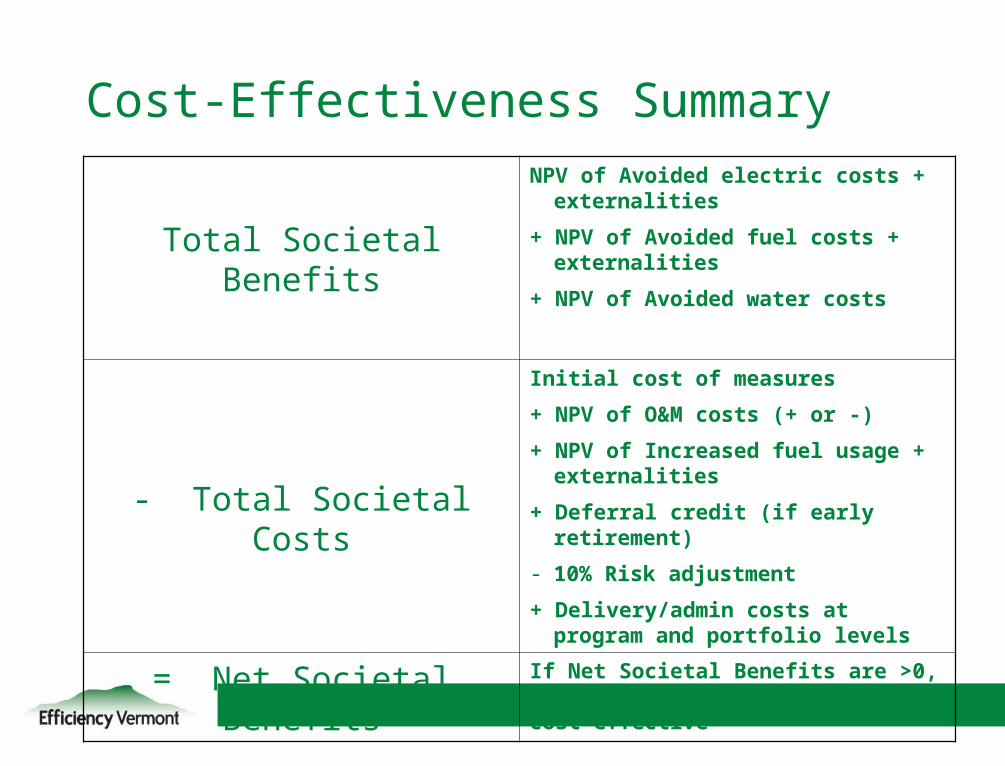
Cost-Effectiveness Summary
Total Societal Benefits
NPV of Avoided electric costs + externalities
+ NPV of Avoided fuel costs + externalities
+ NPV of Avoided water costs
- Total Societal Costs
Initial cost of measures
+ NPV of O&M costs (+ or -)
+ NPV of Increased fuel usage + externalities
+ Deferral credit (if early retirement)
- 10% Risk adjustment
+ Delivery/admin costs at program and portfolio levels
= Net Societal Benefits If Net Societal Benefits are >0, the measure/project/portfolio is cost effective
9
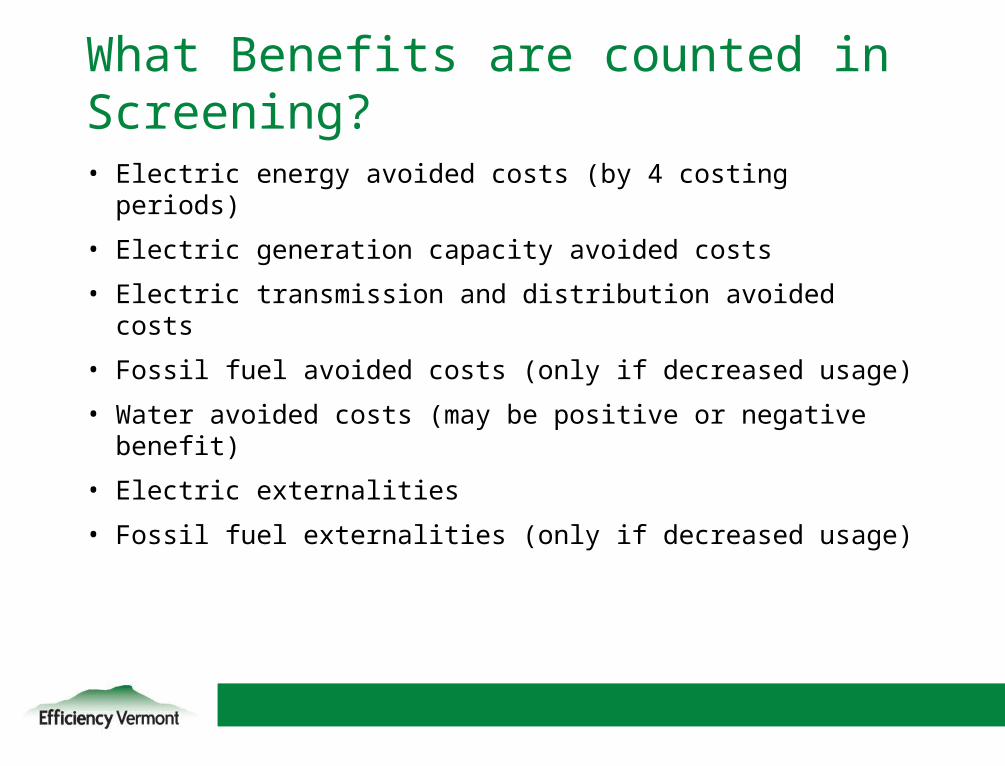
• Electric energy avoided costs (by 4 costing periods)
• Electric generation capacity avoided costs
• Electric transmission and distribution avoided costs
• Fossil fuel avoided costs (only if decreased usage)
• Water avoided costs (may be positive or negative benefit)
• Electric externalities
• Fossil fuel externalities (only if decreased usage)
What Benefits are counted in Screening?
10
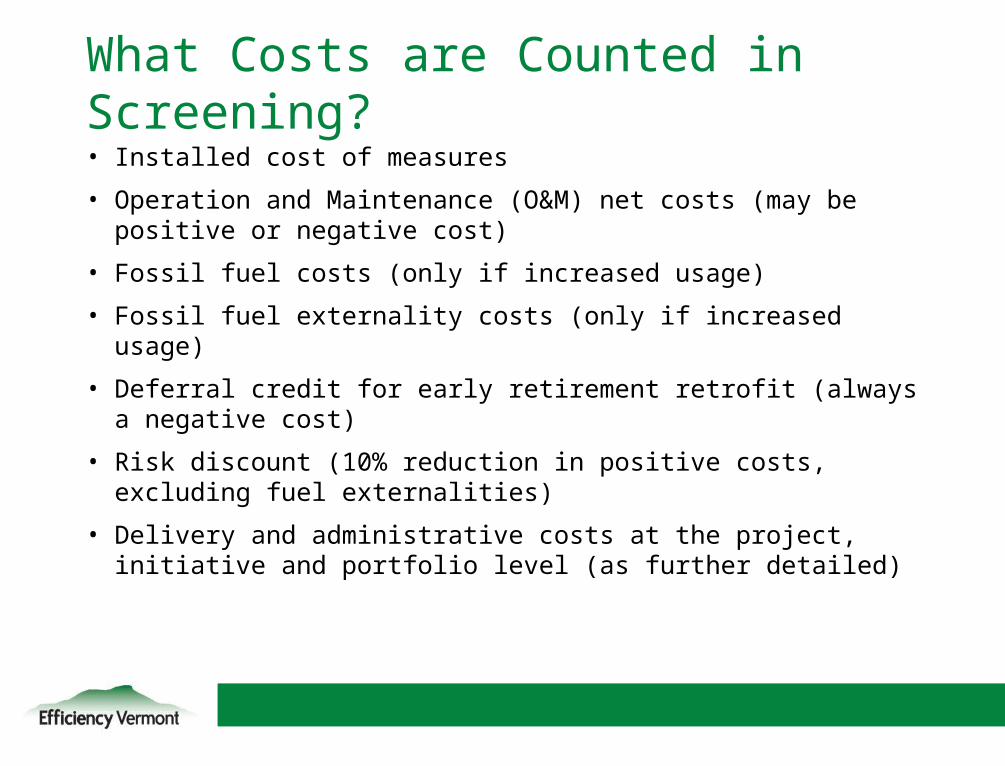
What Costs are Counted in Screening?• Installed cost of measures
• Operation and Maintenance (O&M) net costs (may be positive or negative cost)
• Fossil fuel costs (only if increased usage)
• Fossil fuel externality costs (only if increased usage)
• Deferral credit for early retirement retrofit (always a negative cost)
• Risk discount (10% reduction in positive costs, excluding fuel externalities)
• Delivery and administrative costs at the project, initiative and portfolio level (as further detailed)
11
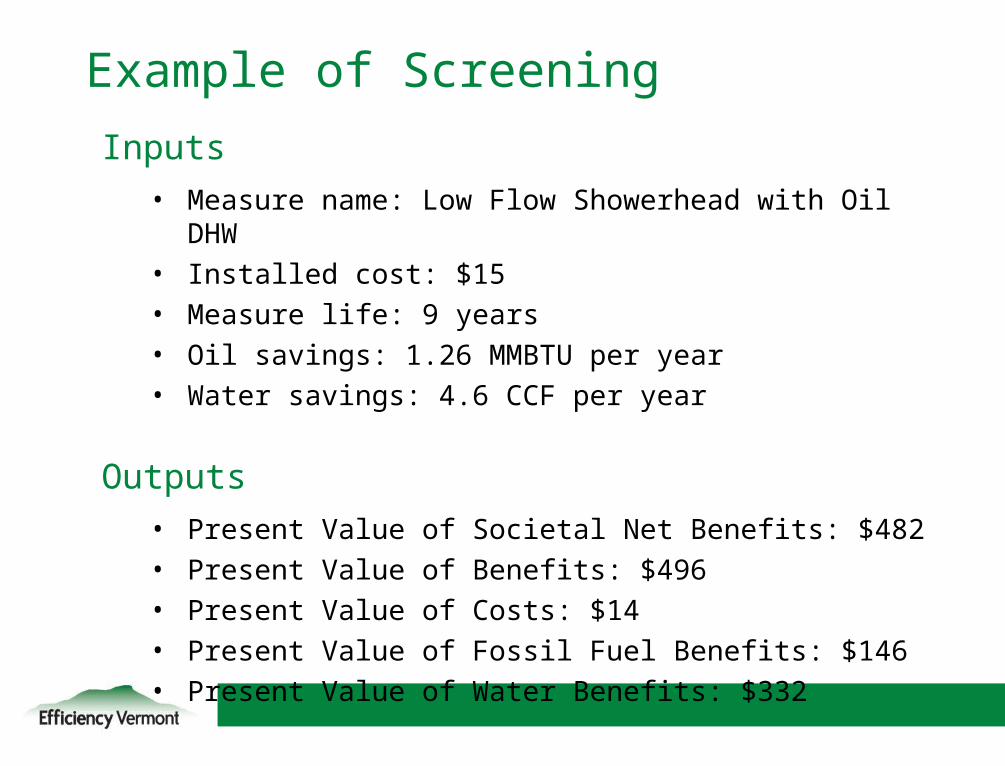
Example of Screening
Inputs• Measure name: Low Flow Showerhead with Oil DHW• Installed cost: $15• Measure life: 9 years• Oil savings: 1.26 MMBTU per year• Water savings: 4.6 CCF per year
Outputs• Present Value of Societal Net Benefits: $482• Present Value of Benefits: $496• Present Value of Costs: $14• Present Value of Fossil Fuel Benefits: $146• Present Value of Water Benefits: $332
12
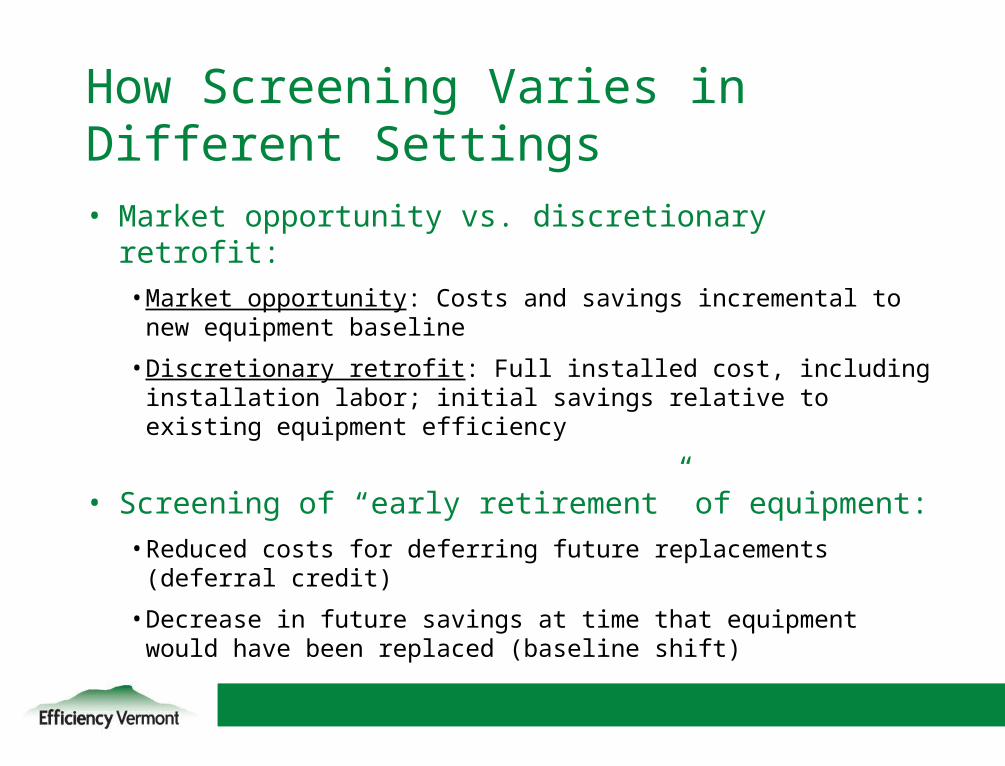
How Screening Varies in Different Settings• Market opportunity vs. discretionary retrofit:
•Market opportunity: Costs and savings incremental to new equipment baseline
•Discretionary retrofit: Full installed cost, including installation labor; initial savings relative to existing equipment efficiency
• Screening of “early retirement” of equipment:•Reduced costs for deferring future replacements
(deferral credit)
•Decrease in future savings at time that equipment would have been replaced (baseline shift)
13
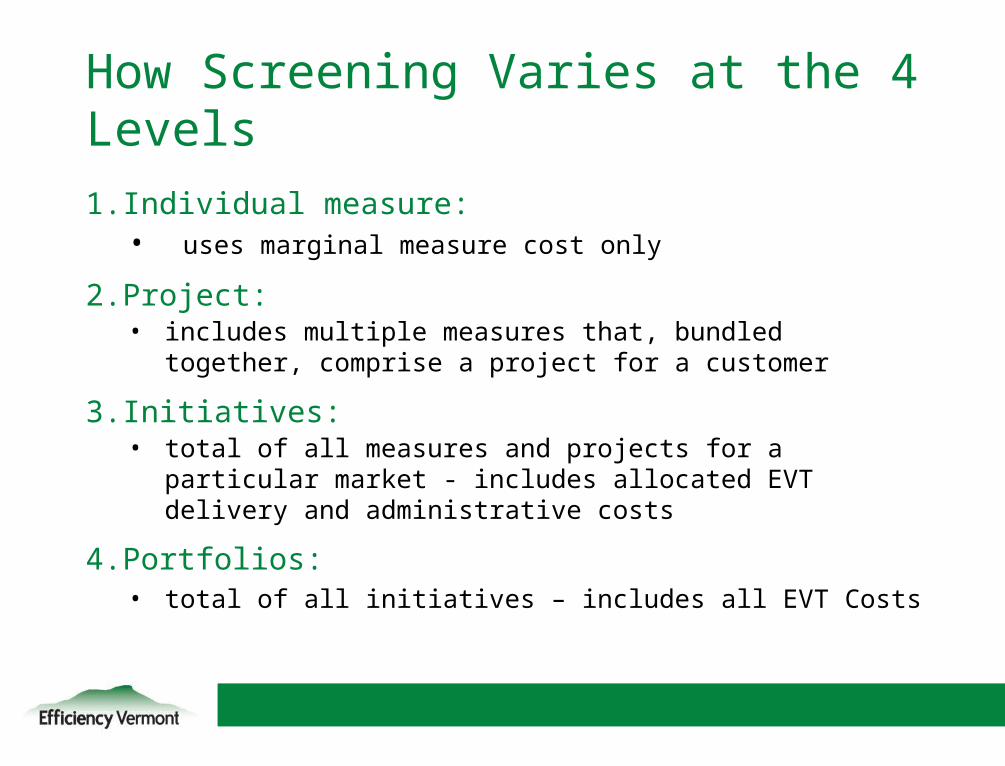
How Screening Varies at the 4 Levels
1. Individual measure:• uses marginal measure cost only
2. Project: • includes multiple measures that, bundled together,
comprise a project for a customer
3. Initiatives: • total of all measures and projects for a particular
market - includes allocated EVT delivery and administrative costs
4. Portfolios: • total of all initiatives – includes all EVT Costs
14
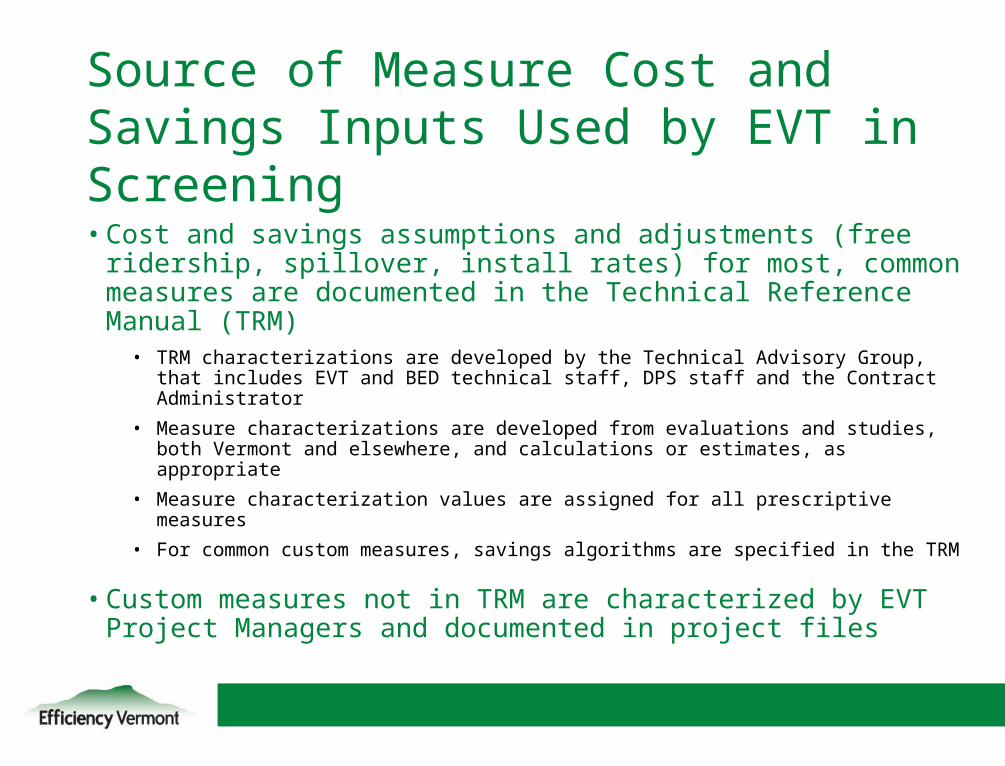
Source of Measure Cost and Savings Inputs Used by EVT in Screening
• Cost and savings assumptions and adjustments (free ridership, spillover, install rates) for most, common measures are documented in the Technical Reference Manual (TRM)• TRM characterizations are developed by the Technical Advisory Group, that
includes EVT and BED technical staff, DPS staff and the Contract Administrator
• Measure characterizations are developed from evaluations and studies, both Vermont and elsewhere, and calculations or estimates, as appropriate
• Measure characterization values are assigned for all prescriptive measures
• For common custom measures, savings algorithms are specified in the TRM
• Custom measures not in TRM are characterized by EVT Project Managers and documented in project files
15
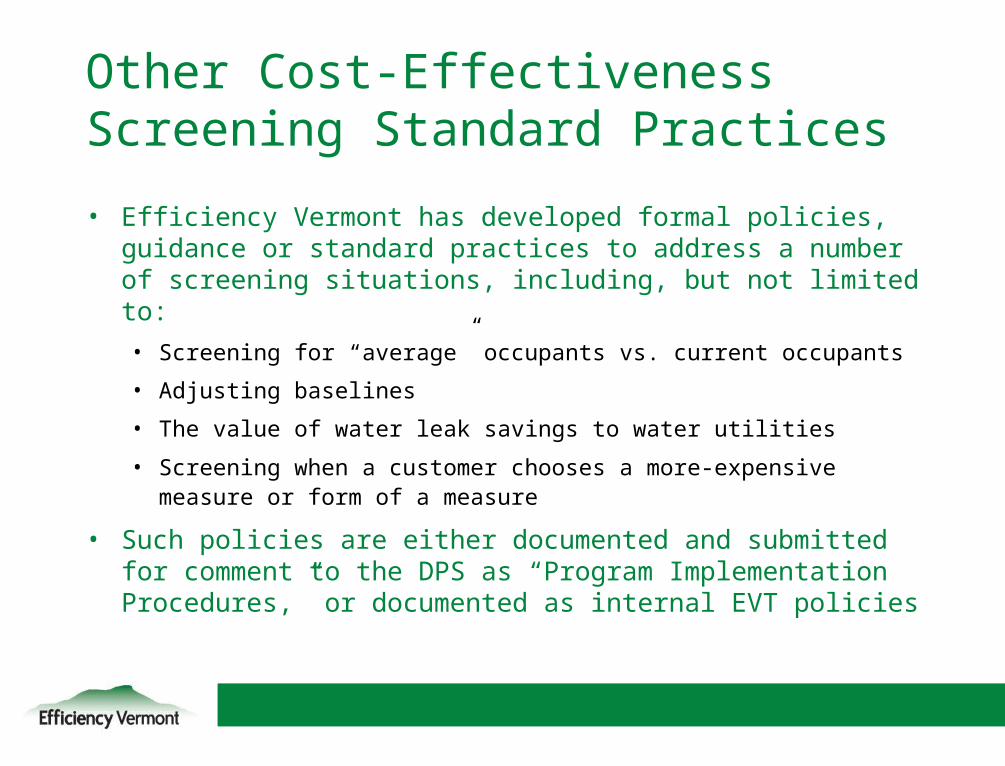
Other Cost-Effectiveness Screening Standard Practices
• Efficiency Vermont has developed formal policies, guidance or standard practices to address a number of screening situations, including, but not limited to:
• Screening for “average” occupants vs. current occupants
• Adjusting baselines
• The value of water leak savings to water utilities
• Screening when a customer chooses a more-expensive measure or form of a measure
• Such policies are either documented and submitted for comment to the DPS as “Program Implementation Procedures,” or documented as internal EVT policies
16
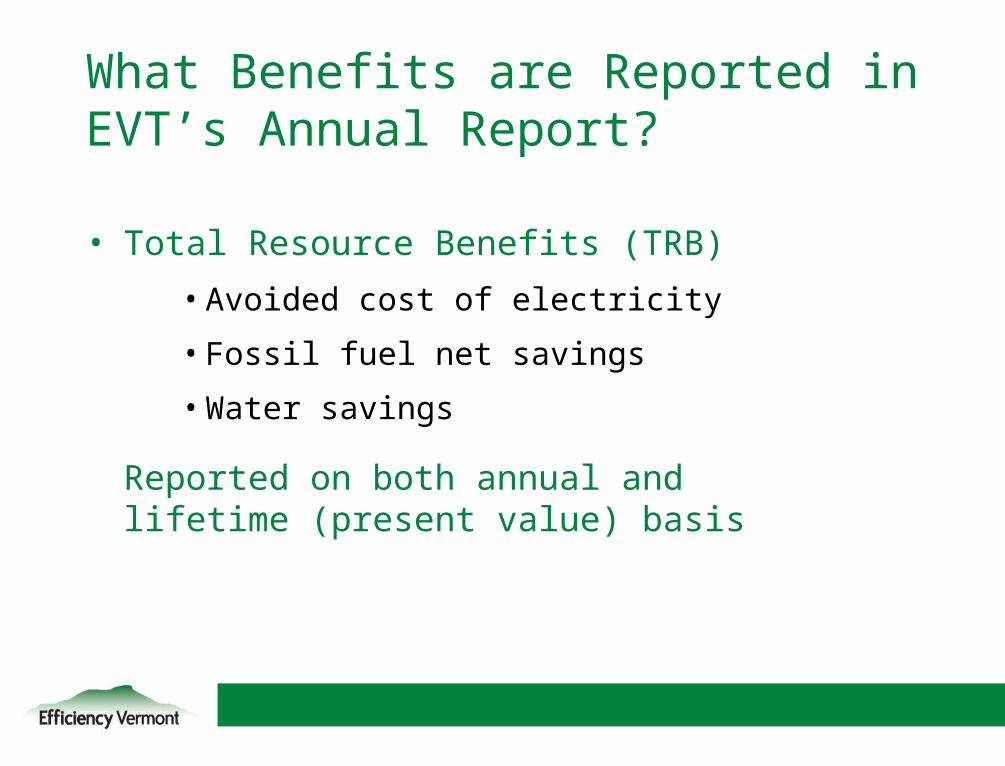
• Total Resource Benefits (TRB)
• Avoided cost of electricity
• Fossil fuel net savings
• Water savings
Reported on both annual and lifetime (present value) basis
What Benefits are Reported in EVT’s Annual Report?
17
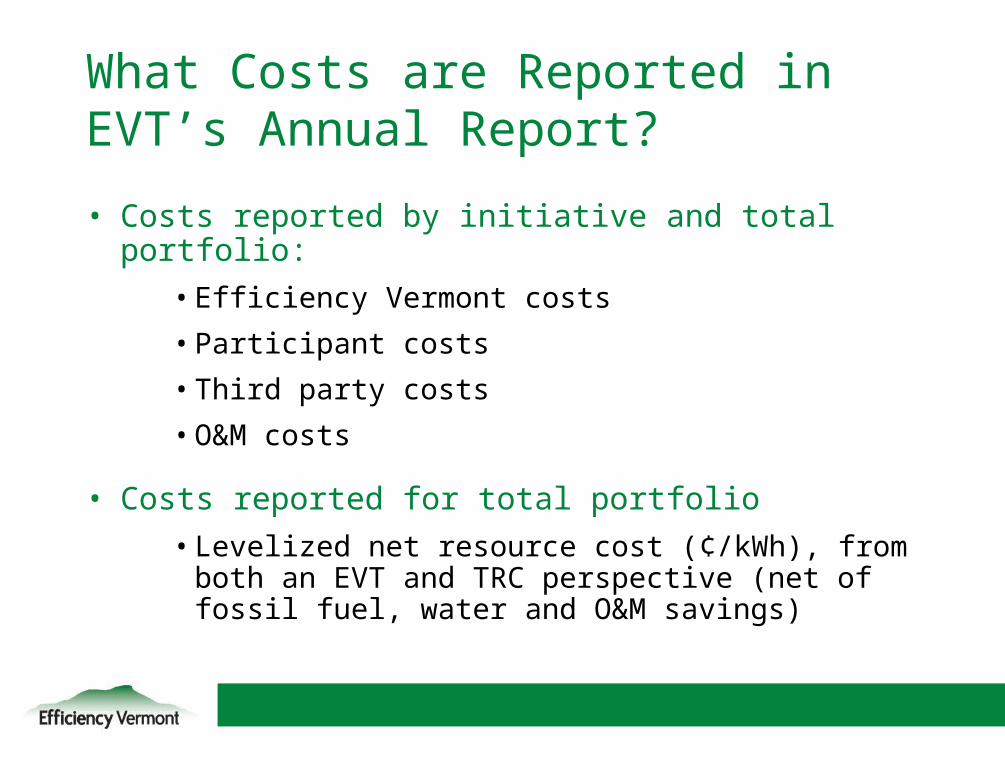
What Costs are Reported in EVT’s Annual Report?
• Costs reported by initiative and total portfolio:• Efficiency Vermont costs
• Participant costs
• Third party costs
• O&M costs
• Costs reported for total portfolio• Levelized net resource cost (¢/kWh), from
both an EVT and TRC perspective (net of fossil fuel, water and O&M savings)
18
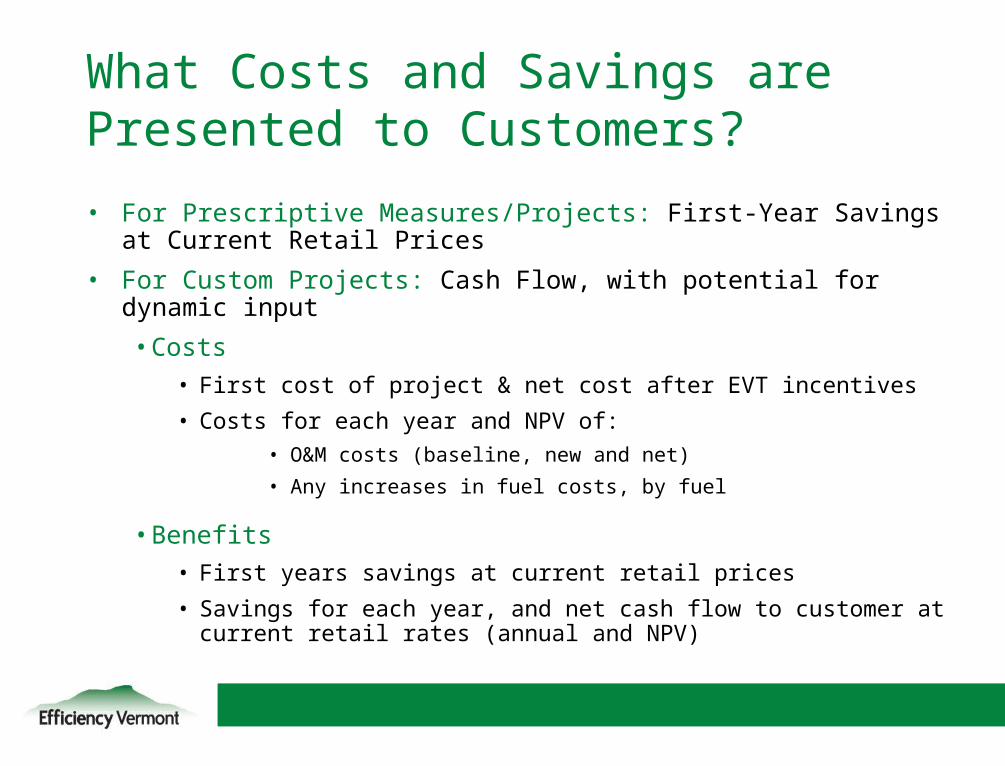
What Costs and Savings are Presented to Customers?
• For Prescriptive Measures/Projects: First-Year Savings at Current Retail Prices
• For Custom Projects: Cash Flow, with potential for dynamic input
• Costs• First cost of project & net cost after EVT incentives
• Costs for each year and NPV of:• O&M costs (baseline, new and net)
• Any increases in fuel costs, by fuel
• Benefits• First years savings at current retail prices
• Savings for each year, and net cash flow to customer at current retail rates (annual and NPV)
19
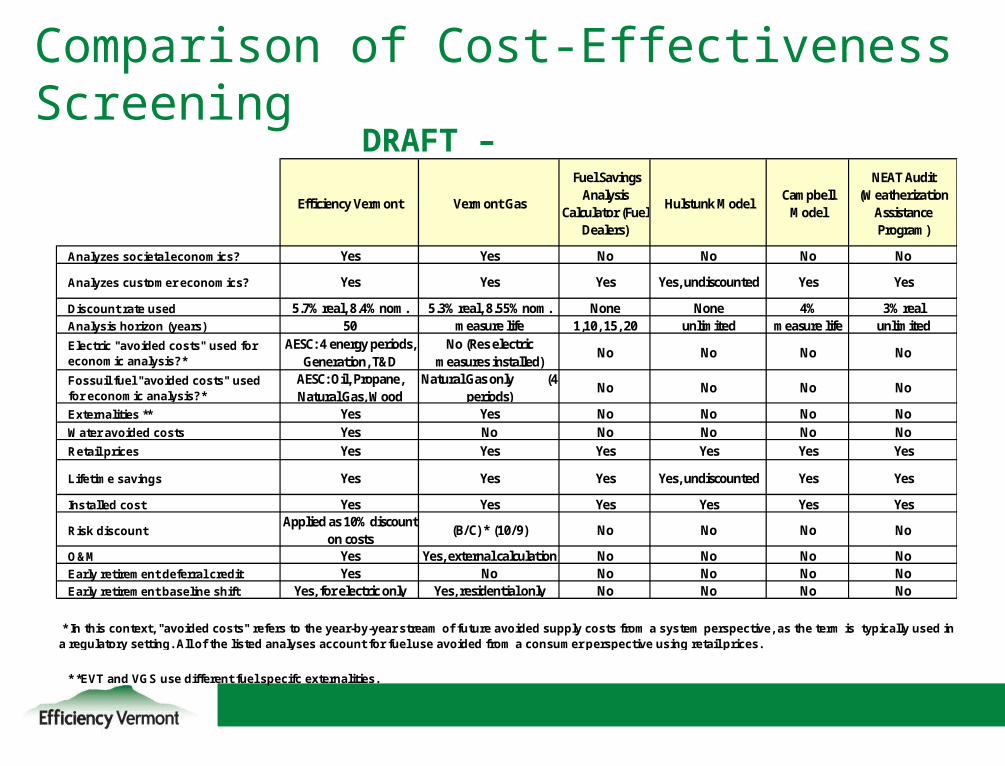
Comparison of Cost-Effectiveness Screening
DRAFT – 7/1/09
Efficiency Vermont Vermont Gas
Fuel Savings Analysis
Calculator (Fuel Dealers)
Hulstunk ModelCampbell
Model
NEAT Audit (Weatherization
Assistance Program)
Analyzes societal economics? Yes Yes No No No No
Analyzes customer economics? Yes Yes Yes Yes, undiscounted Yes Yes
Discount rate used 5.7% real, 8.4% nom. 5.3% real, 8.55% nom. None None 4% 3% realAnalysis horizon (years) 50 measure life 1,10, 15, 20 unlimited measure life unlimited
Electric "avoided costs" used for economic analysis?*
AESC: 4 energy periods, Generation, T&D
No (Res electric measures installed)
No No No No
Fossuil fuel "avoided costs" used for economic analysis?*
AESC: Oil, Propane, Natural Gas, Wood
Natural Gas only (4 periods)
No No No No
Externalities ** Yes Yes No No No No
Water avoided costs Yes No No No No No
Retail prices Yes Yes Yes Yes Yes Yes
Lifetime savings Yes Yes Yes Yes, undiscounted Yes Yes
Installed cost Yes Yes Yes Yes Yes Yes
Risk discountApplied as 10% discount
on costs(B/C) * (10/9) No No No No
O&M Yes Yes, external calculation No No No NoEarly retirement deferral credit Yes No No No No NoEarly retirement baseline shift Yes, for electric only Yes, residential only No No No No
* *EVT and VGS use different fuel specifc externalities.
* In this context, "avoided costs" refers to the year-by-year stream of future avoided supply costs from a system perspective, as the term is typically used in a regulatory setting. All of the listed analyses account for fuel use avoided from a consumer perspective using retail prices.
20
QUESTIONS OR COMMENTS ?
Efficiency Vermont255 S. Champlain St.Burlington, Vermont
888 – 921 – 5990www.efficiencyvermont.com
Blair Hamilton x [email protected]