what, why, how?cdn.cseindia.org/userfiles/thermal-power-sector.pdf · – cse’ lb d f d i i i i...
TRANSCRIPT

Green Rating ProjectWhat, why, How?

CSE’s Green Rating Project - what and why?
Started in 1997; Rated 6 sectors: 1 P l d P 1999 i it d 2004 20131. Pulp and Paper 1999, revisited 2004, 20132. Automobile, 20013 Chlor-alkali 20023. Chlor-alkali, 20024. Cement, 20055. Iron and steel, 2012,6. Thermal power, 2014
Centre for Science and Environment

Coal thermal powerpCore industrial sector; set to expand
- Resource intensive – water, coal and land- High pollution potential- half the country’s GHG emissions
Difficult issue; would like it to go but recognize that it will Difficult issue; would like it to go but recognize that it will stay for countries like India. So even as we push for renewables the question is how to p qclean coal thermal power- How?
Centre for Science and Environment

Research: Design & CoverageSample: geographically diversified, State, centre and private ones, wide unit sizes and age, g
Sample size: 47 plants, 54 GW; Over half the sector's capacity; Just under half participated; non-participating was also rated
Extensive questionnaireExtensive questionnaireSite surveys- plant, community, NGOs, media, PCBs, Photograph, Sample testsPhotograph, Sample tests2 years of rigorous assessment; 60 key parameters
Centre for Science and Environment

What we found ?• Top performers- scored 45-50%
1 CESC Budge Budge (West Bengal)1. CESC-Budge Budge (West Bengal)2. JSWEL-Toranagallu (Karnataka), 3. Tata-Trombay (Maharashtra) JSW-Ratnagiri (Maharashtra).
* Tata-Mundra (Gujarat)- highest energy efficiency Tata Mundra (Gujarat) highest energy efficiency* GIPCL- Surat- lowest water use
• Average score- 23% • 40% plants- <20% score (no award)• Inefficient resources use and technological backwardness
leading to high levels of pollutionleading to high levels of pollution
Centre for Science and Environment

What we found ?Among the least efficient in the world− Average 32.8%, Aus- 33.3%, China-35.7%, US- 35.8%− 14 plants <32%- almost all state-owned JSEB-Patratu 21%14 plants <32%- almost all state-owned, JSEB-Patratu 21%− 12 plants efficiency in excess of 36%, around Chinese avg.
Subcritical 90%, SC 10% ; USC not even introduced, ;− China subcritical 75%, SC/USC – 25%− <10 years and >300MW – less than 1/5th in India; while above 60% in China
Over half of GHG emissions avg 1 08 tCO /MWh Over half of GHG emissions – avg 1.08 tCO2/MWh − 45% higher than the global best; 14% higher than Chinese average
Centre for Science and Environment

What we found ?Needs 22 BCM water; >50% India’s domestic need− OTC plants: <20% electricity takes 90% water- almost all state owned
3 3− CT plants need 4 m3/MWh; China average 2.5 m3/MWh.
55% units- exceed air pollution norms ( / 3) C / 3− (already lax PM norm- 50-350 mg/Nm3); Chinese norm-30mg/Nm3
>76% plants failed to meet the MoEF&CC’s ash utilisation target O l 50 60% f th 170 MTPA d− Only 50-60% of the 170 MTPA used
− About a billion tonne dumped in these ponds, pollute land, air and water. 300 MTPA will be produced by 2021-22
Centre for Science and Environment

What we found ?20 plants were discharging ash slurry into water bodies, a serious violationEffluent samples taken by CSE show 39% violated TSS norm60% plants do not have ETP and STP NTPC Ltd.- Non-participating− The largest coal-power producing company in India: was found below par
The six plants received scores of 16 28%− The six plants received scores of 16-28%− Worst was Delhi’s Badarpur plant
Centre for Science and Environment

How does your state perform?
Centre for Science and Environment

ChhattisgarhgCapacity- 9GW; 30 in pipeline. 4 plants (above 60% capacity) assessed
O P Jindal Power plant Tamnar (participated); score 39%– O.P. Jindal Power plant, Tamnar (participated); score 39%– CSPGCL- Hasdeo thermal power plant (participated) score 15%– NTPC- Sipat ; score 28%– Lanco- Amarkantak thermal power station; score 22%Lanco Amarkantak thermal power station; score 22%
Korba- a critically polluted area has high conc. of power plants, mostly polluting, extremely poor ambient air qualityNone of the plants in state had-– SO2, NOx emission control
full compliance to the norms– full compliance to the norms– met ash utilisation norms of MoEF&CC
Social issues: Land acquisition, rehabilitation, compensationCentre for Science and Environment
q p− JPL has multiple complaints on irregularity in land acquisition, public hearing
Centre for Science and Environment

CSEB- Hasdeo- Air pollution JPL-Tamnar- Air pollution

JharkhandAround 4.5 GW capacity. GRP assessed 5 plants (around 75% of the state capacity): 1 JSEB Patratu thermal power station; score 6%1. JSEB- Patratu thermal power station; score 6%2. Tenughat Vidyut Nigam Limited, Lalpania (participated); score 9%3. Maithon Power Limited- Maithon; score 22%4 Tata- Jojobera thermal power station (participated); score 37%4. Tata Jojobera thermal power station (participated); score 37%5. DVC- Bokaro Thermal Power station ; score 8%
All state govt. owned: smaller size, outdated units, poor performer, highly polluting (JSEB-Patratu was worst)
None complied fully to: the pollution norms, ash utilisation normsE t T t J j b ll t f dExcept Tata-Jojobera, all sources enormous water from damsSocial issues: Land acquisition, rehabilitation, compensation- TVNL-Tenughat and JSEB- Patratu have severe land community issues
Centre for Science and Environment
TVNL Tenughat and JSEB Patratu have severe land community issues
Centre for Science and Environment

JSEB- Patratu- water pollution
Oil laden effluent released from discarded slurry pipeline
Effluent going to the river
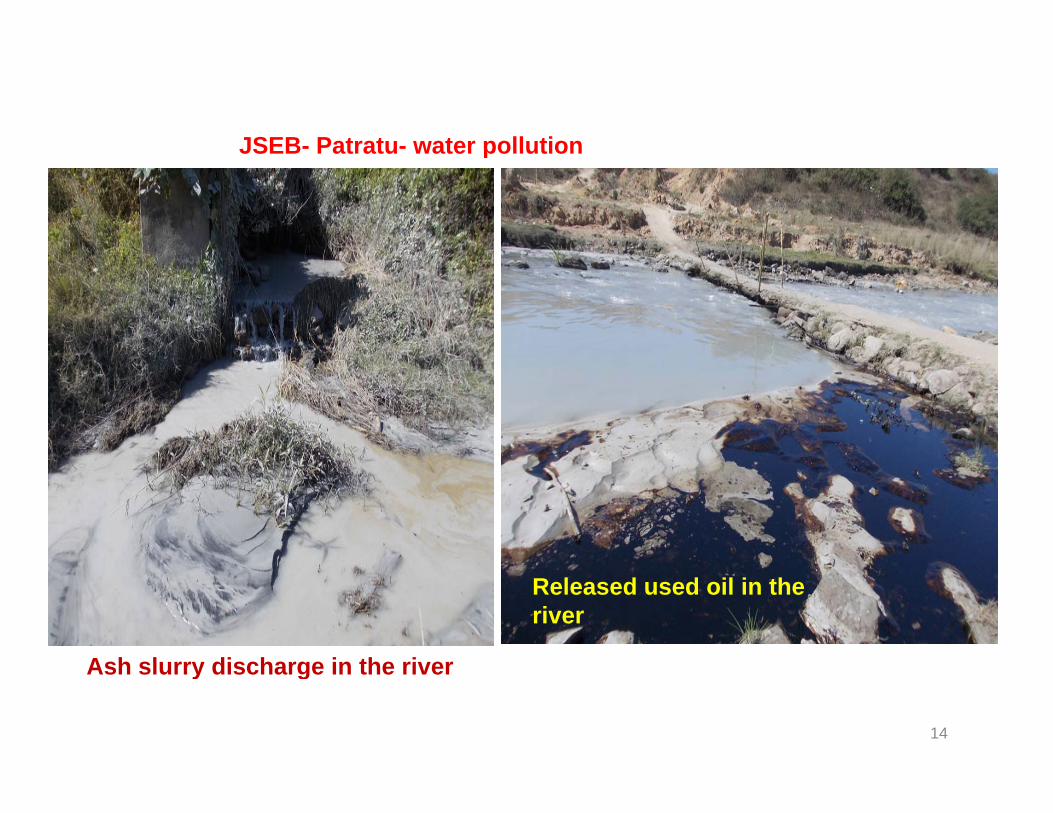
JSEB- Patratu- water pollutionJSEB Patratu water pollution
Ash slurry discharge in the river
Released used oil in the river
14
Ash slurry discharge in the river

TVNL Lalpania Air pollutionTVNL, Lalpania- Air pollution
15

TVNL, Lalpania- Water pollution
Ash slurry discharge from ash pond Katel river filled with ash
16

OdishaAround 7.7 GW. GRP assessed 2 plants, capturing around 45% of the state capacity. None agreed to participate 1 OPGCL Ib alle thermal po er station score 23%1. OPGCL-Ib valley thermal power station; score 23%2. NTPC- Talcher thermal power station, Kaniha; score 24%
Poor environment performance –high air and water pollution in Poor environment performance high air and water pollution in both plants. Ambient air was very polluted
None of the plants had-None of the plants had− SO2, NOx emission control− full compliance to the norms− met ash utilisation norms of MoEF&CCet as ut sat o o s o o &CC
Pollution related health issues, inadequate CSR are common issues
Centre for Science and Environment
Centre for Science and Environment
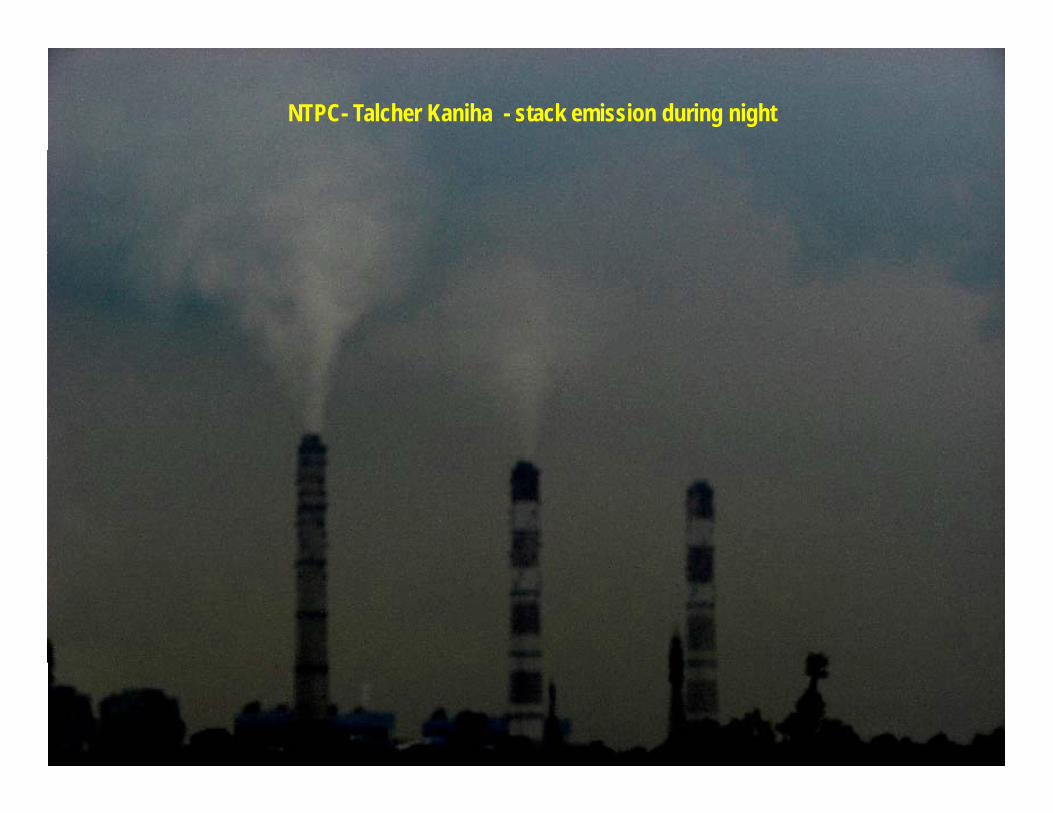
NTPC- Talcher Kaniha - stack emission during night

OPGCL- Ib valley air pollution
19
Bihar• Around 3 GW. GRP assessed only plant-
1. NTPC- Kahalgaon super thermal power station; score 26%• Not agreed to participate • No SO2, NOx emission control
f• Not full compliance to the norms• Not met ash utilisation norms of MoEF&CC• Poor ambient air quality was noted• Poor ambient air quality was noted• Land acquisition, rehabilitation & compensation- common
issues
Centre for Science and Environment
Centre for Science and Environment

Madhya Pradeshy• Around 9 GW. GRP assessed only plant-
1. MPPGCL- Birsinghpur thermal power station; score 23% (Participated )
• No SO2, NOx emission control• Not full compliance to the normsot u co p a ce to t e o s• Not met ash utilisation norms of MoEF&CC• High water consumption- an OTC plant• High water and air pollution• Social issues- damage of road, ash spillage and fugitive
i i d d i i ld d t h d l k f CSRemission on road, drop in crop yield due to ash and lack of CSR
Centre for Science and Environment
Centre for Science and Environment

MPPGCL- Birsinghpur- air pollution
22

Uttar Pradesh• Around 17 GW. GRP assessed 3 plants-
1. UPRVUNL- Anpara “A&B” thermal power plant; (participated); score 12%2 UPRVUNL Ob th l l t ( ti i t d) 8%2. UPRVUNL- Obra thermal power plant; (participated); score 8%3. NTPC- Singrauli super thermal power plant; score 21%.4. Reliance- Rosa thermal power plant; score 30%
• Except Reliance-Rosa, all three plants are from an identified critically polluted area– OTC type high water consuming and infamously polluting, yp g g y p g,– Discharging ash into dam
• Sonebhadra region- many power plants and coal mines CSE’ l b d f d i i i il fi h d l l – CSE’s lab study found mercury contamination in water, soil, fishes and local residents
• No SO2, NOx emission control
Centre for Science and Environment
• Not met ash utilisation norms of MoEF&CC
Centre for Science and Environment

UPRVUNL- Obra- Water pollution
Ash water discharge meeting Renuka rive
Hidden ash water discharge outlet from Obra TPS
24

UPRVUNL- Anpara- Air pollution UPRVUNL- Obra- Air pollution
25

What is the way ahead?
Centre for Science and Environment

Way aheadyOnly SC/USC plants to be allowed– Old inefficient plants to be scrapped at an aggressive pace– Regional carrying capacity assessment and tighter norms- critically polluted – Regional carrying capacity assessment and tighter norms- critically polluted
areasClearances to ensure best technology, practices
El t i it d d 2X b 2021 22 it ill i h lf f l b l – Electricity demand 2X by 2021-22; per capita will remain half of global avg.Regulations/incentives to improve capacity utilisation– Most efficient stocks are less efficiently utilised- Tata Mundra, Adani Mundra,
NTPC-Sipat ; 52-75% PLFCoal washing capacity- to be increased 2-3 timesWater tariffs to increase to curb excessive usePower dispatch order- to ensure polluting plants not called first to supply power as they are the cheaper– pollution control costs only about 10% of the operating and capital costs
Centre for Science and Environment
pollution control costs only about 10% of the operating and capital costs
Centre for Science and Environment

Way aheadyWeak national norms: to be strengthen like global standards Formulate norms for SO2, NOx and mercury
60 % PM 45 50% of SO 30% of NO emissions of ind strial sector comes – 60 % PM, 45-50% of SO2 , 30% of NOx emissions of industrial sector comes from coal power
– > 80 % of total mercury emissions– Pollution load can increase 2-3 time by 2021-22 (at current rate)– Pollution load can increase 2-3 time by 2021-22 (at current rate)
Ash utilisation policy- target high use, individual plants to keep in mind– Ash generation will be double by 2021-22 (160-305MTPA)
Regulators capacity building; monitoring to strengthen Massive surplus land with govt plants; policy to use surplusMassive surplus land with govt. plants; policy to use surplus55 GW of coastal capacity expected to come up– Potential impacts on marine biodiversity to be investigated
Centre for Science and Environment
Centre for Science and Environment