chap7 financial sector - puerto ricogis.jp.pr.gov/externo_econ/pde2014/chapter07 financial...
TRANSCRIPT

ECONOMIC DEVELOPMENT PLAN FOR THE FINANCIAL SECTOR
1
Chapter
First Draft
ECONOMIC DEVELOPMENT PLAN FOR THE FINANCIAL SECTOR
* Juan Lara, Ph.D.
* Affi liation: Advantage Business Consulting Inc. & University of Puerto Rico, Rio Piedras Campus
7

ECONOMIC DEVELOPMENT PLAN FOR THE FINANCIAL SECTOR
2

ECONOMIC DEVELOPMENT PLAN FOR THE FINANCIAL SECTOR
3
TABLE OF CONTENTS
I. Diagnostic for Puerto Rico’s Financial Sector .................................................................................... 1
INTRODUCTION ..................................................................................................................................... 1 OBJECTIVES .......................................................................................................................................... 1 SOURCES OF INFORMATION ............................................................................................................... 1 ORGANIZATION ...................................................................................................................................... 1 DIAGNOSIS OF THE FINANCIAL SECTOR IN PUERTO RICO ............................................................. 1 OVERVIEW OF THE FINANCIAL SECTOR IN PUERTO RICO’S ECONOMY ....................................... 1 HISTORICAL REVIEW ............................................................................................................................ 3 RECOMMENDATIONS OF PREVIOUS PLANS ..................................................................................... 6 SECTOR CHARACTERISTICS ............................................................................................................... 8 Relevance of the Financial Sector in the Economic Activity .................................................................... 9 Regional Trends ..................................................................................................................................... 21 INSURANCE INDUSTRY ...................................................................................................................... 30
II. SWOT Analysis .................................................................................................................................... 32
INTRODUCTION ................................................................................................................................... 32 OBJECTIVES ........................................................................................................................................ 32 SOURCE OF INFORMATION ............................................................................................................... 32 ORGANIZATION .................................................................................................................................... 32 TABLE AND DISCUSSION .................................................................................................................... 33
III. Mission, Goals, and Objectives .......................................................................................................... 42
IV. Action Plan ........................................................................................................................................... 49
V. Metrics .................................................................................................................................................. 66

ECONOMIC DEVELOPMENT PLAN FOR THE FINANCIAL SECTOR
4
ECONOMIC DEVELOPMENT PLAN FOR THE FINANCIAL SECTOR
1
I. DIAGNOSTIC FOR PUERTO RICO’S FINANCIAL SECTOR
INTRODUCTION
OBJECTIVES
This chapter focuses on the analysis of the fi nancial industry in Puerto Rico. The objective of this chapter is to obtain a comprehensive analysis on the matter, which will begin with a historical analysis and a conceptual framework and work up to an evaluation of current, local and regional, issues in the fi nancial sector. The current characteristics of the sector will also be evaluated, to determine the relevance of the fi nancial sector to the economic activity of the Island, and the risks associated with the sector.
SOURCES OF INFORMATION
The source of the information used for the purposes of this analysis is the Puerto Rico Planning Board, from the Offi ce of the Commissioner of Financial Institutions, (OCIF, for its Spanish acronym), the Comptroller’s Offi ce (OC, for its Spanish acronym) and the U.S. Census Bureau. The “Country Business Patterns” from the U.S. Census Bureau were also used for the sector characteristics analysis, the quotient for the fi nancial sector, comparisons of sector characteristics with other states, and for the salary, employment, and establishment number comparisons with other states.
ORGANIZATION
This chapter is divided into 3 sections: Introduction, Diagnosis of the Financial Sector in Puerto Rico, and Regional Tendencies.
The Introduction is composed of the following sub-sections: Objectives, Source of Information, and Road Map (Organization). The analysis for Puerto Rico’s fi nancial sector can be found in the Diagnosis of the Financial Sector in Puerto Rico. This section is composed of the sub-sections: Overview of the Financial Sector in Puerto Rico Historical Review, Recommendations of Previous Plans, Sector Characteristics, and Relevance of the Financial Sector in the economic activity.
The third section deals with Regional Trends and is composed of the sub-sections: Location Quotient (Puerto Rico/US) of wages, employment, and enterprises, Comparison of the Characteristics of the Sector with Selected States, Comparison of Wages, Employment, and Number of Enterprises with Selected States, and Regional Exports Opportunities.
DIAGNOSIS OF THE FINANCIAL SECTOR IN PUERTO RICO
OVERVIEW OF THE FINANCIAL SECTOR IN PUERTO RICO’S ECONOMY
Puerto Rico’s economy is often described as contradictory and paradoxical, and the fi nancial sector is not an exception to this. On one hand, there is no doubt that the Island boasts a developed and sophisticated fi nancial system, which operates within the practices and processes of the U.S., the most advanced in the world. On the other hand, it is just as true that Puerto Rico still has a fi nancial system which is incomplete and fragmented, in which there is no diversity or amplitude of institutions, markets and products which are characteristics of developed economies.

ECONOMIC DEVELOPMENT PLAN FOR THE FINANCIAL SECTOR
2
Even though the local fi nancial system has been established since the 19th Century, while still under Spanish political and economic rule, the fi nancial entities on the Island have been operating under U.S. institutional and regulation standards. And so, it has been an integration process which has taken over a century, even though Puerto Rico shares, not only the U.S.’s institutional and regulation framework, but also, the same currency, the same interest rate structure and, the same framework for monetary policy.
For all of these reasons, it is still puzzling that after a century of operating within the U.S. fi nancial framework, the local fi nancial system remains incomplete and fragmented. The Island’s fi nancial system is also a vulnerable one, due to the fi nancial crisis that has weakened it since the past decade. Many researches have pointed to the fact that Puerto Rico relies heavily on commercial banks for fi nancing businesses, since there are no alternative sources for fi nancing that are commonplace in the U.S. and other more developed fi nancial markets (Maldonado-Baer y Walter, 2005; FRBNY, 2012). This kind of dependency is risky for aneconomy, since commercial banks face structural and short-termchallenges which limit their capacity to fi nance economic activity.
In their analysis on Puerto Rican competitiveness, the Federal Reserve Bank of New York points out the following (2012, p.14):
“A sound fi nancial system that effi ciently transforms savings into productive investments is a crucial feature of a well-functioning economy and essential for competitiveness. However, both short-termand longer-term challenges are dampening credit availability to local businesses in Puerto Rico. Bank condition and performance deteriorated sharply in recent years following a boom and bust in real estate lending, leaving banks risk averse and poorly positioned to lend. Loan demand is tepid given Puerto Rico’s weak economic outlook, and collateral values have declined signifi cantly, making it more diffi cult for prospective borrowers to qualify for loans. Over the longer term, banks have faced challenges in growing their core deposit base, particularly given the crowding-out effects of the government’s substantial funding needs. As a result, banks have relied on non-core-deposit funding sources, the availability of which has become increasingly constrained. Together, these factors suggest a protracted period of bank deleveraging in Puerto Rico that will continue to weigh on economic activity. Limited alternatives to bank funding for local businesses raise the importance of a recovery in banking system condition and performance and of efforts to cultivate other private fi nancing mechanisms.”
In that same report, the following statement can be found: (p. 15):
“Alternatives to bank funding of local businesses in Puerto Rico are currently limited, underscoring the challenge that fi rms face obtaining fi nance against the backdrop of current and longer-term bank constraints. While investment companies and credit unions have gained market share over the past decade, these entities still represent a small percentage of fi nancial system assets, with the former largely deploying assets under management to government securities and the latter focused primarily on consumer lending. Venture capital and private equity are also relatively scarce on the Island. Both government and private sector initiatives-such as direct lending and guarantees by Puerto Rico’s two government banks,45 U.S. Small Business Administration and Export-Import Bank loan programs, and private sector capacity-building initiatives such as Grupo Guayacán, Inc.—have helped mitigate fi nancing constraints, but mainly at the margin.”
On the same subject, Maldonado-Baer and Walter point out the following (2005, p. 454):
“Commercial Banks appeared to have failed to allocate funds to economic development through commercial and industrial loans as much as would seem desirable in an economy such as Puerto Rico’s. Moreover, they have not generated suffi cient asset gathering in the form of savings and checking deposits from the household sector to underwrite he capital formation needed to create the kind of self-sustained economic development described in chapter 1 of this book.

ECONOMIC DEVELOPMENT PLAN FOR THE FINANCIAL SECTOR
3
[…] all banks on the island need to invest less in securities and instead to lend for commercial and industrial purposes at longer maturities. The trade-off between dedicating funds for development and form more liquid investments-securities issued mainly outside Puerto Rico—is a necessity if the banks are indeed going to do their job to stimulate development.”
HISTORICAL REVIEW
Conceptual Framework: Financial Intermediation
The service portfolio provided by the fi nancial sector is vital to the operation of the economy. In addition, in the case of developing countries, this sector plays a critical role in supporting the formation of capital, and its channeling towards strategic projects for economic development. It can be said that fi nancial activity is similar to an infrastructure service, since it is required in order to allow economic activity in all sectors of the economy.
The defi ning activity of the fi nancial sector is fi nancial intermediation. In essence, the intermediation consists of channeling funds from units with economic surplus (savers) to economic units with defi cits (investors), meanwhile, facilitating the saving process and its productive use in the economy. Without a specialized intermediation system, the interaction between the savers and investors would be very similar to trade, and would incur very high transaction costs.
The fi nancial system works as a bridge between savers and investors, however, this is not a passive bridge, but an active one. Intermediation is not simply about “being in the middle” to facilitate contact between savers and investors. What makes fi nancial intermediation so unique and necessary is that it is an active measure in which specialized institutions assume liabilities for the economy as a whole and rely on these liabilities in order to create assets which are then kept in their own balance sheets or transferred to other entities through operations with the fi nancial market. Throughout the constant handling of assets and liabilities, fi nancial entities provide essential services to the economy, which consist on the following:
• Manage and mitigate risk.• Correct or reduce information asymmetry.• Reduce the market distortions, such as adverse selection.
In the process of providing these services, fi nancial entities incur costs, derive income and, under normal circumstances, a profi t. In the case of commercial banks, the profi t comes from the “fi nancial margin”, also known as net interest income, which is the difference between the fi nancial cost of the liabilities (or cost of funds) and the fi nancial income of the assets. In other words, it is the difference between interests earned and interests paid.
The handling of assets and liabilities is the main source of profi ts for commercial banks (and similar entities), however, it is not the only source. Banking institutions also derive profi ts from other services provided to the community, which usually have established costs (for example, money orders).
Some fi nancial institutions, such as insurance companies, participate in the fi nancial intermediation process in a manner which varies from the bank’s approach. Insurance companies charge an insurance premium in order to assume another entity’s risk. Insurance companies pool their funds and draw from it when they have to pay out an insurance claim, and their profi ts come from the difference between income from premiums and payments made out for insurance claims.
The main role of these entities is to manage and mitigate risks that other economic entities are unable to manage on their own. The existence of the insurance market allows for the existence of other markets, contracts and products that would not be able to exist if the economic entities involved were not able to transfer risk to other specialized entities, which are better able to manage such risks.

ECONOMIC DEVELOPMENT PLAN FOR THE FINANCIAL SECTOR
4
In addition to financial intermediation, financial entities provide other essential services such as infrastructure services. Among these, two key functions in the banking system stand out: 1) the management of payment methods in the economy and, 2) serving as a channel for the operation of monetary policy.
In addition to the key functions already mentioned, commercial banks in Puerto Rico fulfill a function which has been essential to the economic development in the Island: serve as a channel in the process of importing short and long term from the U.S. financial market. Puerto Rico lacks a sustainable source of internal savings, for which it depends on having access to U.S. sources of financing. For decades, local banks have been the mechanism for “importing funds” in order to compensate for the financing inability in the local economy.
Structure of the Financial Sector in Puerto Rico
The financial sector in Puerto Rico is composed of more than a dozen industries of different sizes, characteristics and specialties. Some of these have a high level of interaction among themselves, while others work more or less independently from the rest of the sector. The industries are listed below:
Commercial BanksInternational Banking EntitiesCredit UnionsInvestment CompaniesMortgage Institutions Financial Companies Securities BrokersLeasing Companies Small Loans CompaniesGovernment BanksELA Employee AssociationInsurance Companies
Last on the list- the insurance companies- behave significantly different to the rest of the industries on the list, since they do not deal with financing (even though they handle large investment portfolios, for both Government and private securities). For this reason, the sector diagnosis will perform the insurance companies analysis separately, included at the end of this chapter.
Institutions categorized as “depository”- because they accept deposits from the general public- compose the majority of the financial system on the Island. The most notable of these institutions are commercial banks, international banking entities and, credit and loan unions. Some non-depository institutions with an important presence in the sector are the mortgage institutions, financial companies (which finance, for example, the purchasing of vehicles), leasing companies, and small loan companies, all of which provide important financing services in the local economy. Small loan companies provide an essential financing service to the low-income population in Puerto Rico.
A very notable gap in the local financial sector, is the lack of a local capital market, in which bonds and stocks are traded and supplied by local issuers. Another underdeveloped area is corporate financing and the financing of high risk new businesses (for example, venture capital funds).

ECONOMIC DEVELOPMENT PLAN FOR THE FINANCIAL SECTOR
5
Diagnosis
The diagnosis for the fi nancial sector in Puerto Rico should begin with a clear understanding of the difference between structural and short-termproblems within the system and its components. In almost 9 years since the economic recession began in the local economy (AF 2007), the fi nancial sector has suffered serious setbacks due to events associated with short-termevents and the economic cycle. It has, also, faced diffi culties of a structural nature that have been present for at least a couple of decades. Because the economic crisis has been so severe and prolonged in this past decade, the short-termand structural problems have come to overlap and interact. Hence, the importance of making a clear conceptual distinction to facilitate economic planning for the fi nancial sector in the short, medium and, long run.
1. SHORT-TERM PROBLEMS
This chapter focuses mostly on the discussion of short-termproblems, due to the current fi nancial crisis the Island is undergoing. The weakening of the fi nancial institutions due to the economic recession, poor loan repayment, high percentage of foreclosures and mortgage defaults, low deposit rate uptake and, the absence of good fi nancing alternatives, are some of the causes for these short-termproblems.
The root of the short-termproblems described above, can be traced to the bursting of the housing bubble about a decade ago and, the consequent collapse of the construction industry. But that is not the whole story, fi nancial entities have also been affected by the general decline of the economy, as well as the income reduction and the high unemployment.
2. STRUCTURAL PROBLEMS
The most salient of the structural problems Puerto Rico currently faces, rests on the inability of internal savings to sustain a healthy base of core deposits within the system. The areas most strongly affected by this structural problem are commercial banks and other depository entities which, as was mentioned earlier, constitute the majority of the fi nancial sector.
Because of this shortage in core deposits local banks have resorted to importing funds from abroad (mostly the U.S.). As a consequence, local banks have created a dependency on these funds in addition to becoming institutions whose principal function is to facilitate the import of foreign funding.
Current history of the Puerto Rican banking system can be broken down into four periods, based on how the structural problem has been handled.
• Pre-936 Period• 936 Funds Period• Post-936: Brokered Deposits Period• Actual Period
The pre-936 period, was one characterized by limited liquidity. During this time, access to funding from the U.S. was available yet limited and costly. For this reason, banking credit was comparatively more expensive and not easy to obtain.
Section 936 radically changed the commercial banking landscape in Puerto Rico. The Qualifi ed Possession Source Investment Income (QPSII), a provision in the legislation, created a powerful tax incentive for manufacturing fi rms to deposit substantial amounts of their basic earnings in Puerto Rico’s banking system. In addition to this, QPSII made these funds available to local commercial banks at very low cost. This enabled local businesses to obtain bank fi nancing at very competitive rates which, in turn, was refl ected in the local economy.

ECONOMIC DEVELOPMENT PLAN FOR THE FINANCIAL SECTOR
6
The elimination of section 936, meant the end of the funding that had been made available by this legislation. Some provisions disappeared gradually, while others, such as QPSII, immediately eliminated. It seemed like the local banking system would begin to deteriorate under the limited liquidity, however, an unexpected turn of events took place: the U.S. Federal Reserve enacted a policy of extremely low interest rates and high liquidity in the U.S. fi nancial system. Thanks to this fortuitous event, local commercial banks were able to able to effortlessly substitute 936 funds with deposits obtained by brokers (brokered deposits) from the extensive U.S. fi nancial market. And it was thus that a major credit contraction, following the elimination of Section 936, was avoided.
Currently, interest rates continue to be low, but the Federal Reserve has announced that it will adopt the policy of gradually raising interest rates in the near future, in order to return to a more normalized environment than what we have seen in the past 10 years. Hence, local banks will not be able to rely on deposits procured by brokers in the same extent that they had since the end of the 1990’s. The pressure to cultivate local sources of funding are increasing, particularly in the area of core deposits. The Federal Reserve, along with other regulators, insist that this should be the cornerstone of any economic development plan for the local fi nancial sector (See FRBNY, 2012).
Another structural issue that will play a relevant role in the medium and long run, will be the issue of regulation. Following the 2007 fi nancial crisis in the U.S. there has been a worldwide push for stricter regulation in order to avoid the excesses that allowed for the creation and later burst of the worldwide fi nancial bubble. This new regulation wave is expected to impact the fi nancial sector as a whole. Some industries will be impacted more severely, such as the mortgage loans industry. The Puerto Rican fi nancial system- which is subject to the federal legislation, regulation and, supervision- will have to adjust its practices and operations in order to meet the new requirements that will be entering into force. RECOMMENDATIONS OF PREVIOUS PLANS
The establishment of cooperatives in rural areas with training programs and productive economic activities focused on agriculture and manufacturing is one of the main objectives in the report titled Puerto Rico’s Economic Development: A Strategy for the Next Decade, authored by Miguel Echenique (1975). Other important objectives in this analysis were to increase public and private savings to increase national equity, as well as to review regulations. Some of the new regulations established included enacting a selective policy for bank regulation in favor of industry loan exempting them from contributions as well as eliminating contribution deductions over personal loans.
In 1994, the New Model of Economic Development, identifi es new strategies to follow, such as obtaining capital to work through the mobilization and channeling of fi nancial resources towards productive investments through effi cient capital markets.
Project Puerto Rico 2025 (PPR), a study published in 2004, seems to encompass a broader approach compared to previous economic development plans for the Island. The PPR provides in its recommendations for the development of educational and cultural activities and programs, as well as research and technological development programs. It also includes the development of local businesses, improvements in land transportation, the health sector, and the reduction in the process of utilities (water and power).
The last study performed, published in 2013, focuses on strategies to attract investments to Puerto Rico, both local and foreign, in addition to promoting that cooperatives play a bigger role in the Puerto Rican economy. This and other strategic economic plans can be found in the following table.

ECONOMIC DEVELOPMENT PLAN FOR THE FINANCIAL SECTOR
7
Strategy or Recommendation Paper
Increase public and private savings to increase national equity.
Create a private retirement plan complementary to the Social Security.
Issue new savings bonds with low denominations available to the public.
Fix maximum interests on saving deposits for commercial banks and credit unions.
Eliminate contribution deductions over personal loans.
Revise law regulations for investment companies.
Consider grants over guaranteed loans by the Government Development Bank.
Selective policy for bank regulation in favor of industry loan exempting them from contributions.
Allow wholesale banking to participate with international banks.
Establish cooperatives in rural areas with training programs and productive economic activities focused on agriculture and manufacturing.
Capital to Work - Propitiate the mobilization and channeling of financial resources towards productive investments through efficient capital markets.
Redefining Responsibilities - Obtain the fiscal resources that will stimulate business activities, and productivity with efficiency.
Improve financing for cultural activities in Puerto Rico
Reform University budget and incentive structure to promote research and development and technology transfer
Increase funding for laboratories, research centers and other research and development infrastructure at universities
Improve financial management of the education system
Expand direct government funding for independent research and development centers and initiatives
Enhance and expand indirect government support and incentives for private sector research and development
Expand the availability and effectiveness of private equity funding for start-up businesses and small and medium enterprises
Increase support to small and medium enterprises in accessing federal and other external funding sources
Fund major scientific infrastructure projects needed to attract more private sector research and development
Reduce the tax burden and other financial costs that government imposes on small and medium enterprises
Improve the effectiveness of existing entities designed to promote the growth and formation
Enhance use of public equity funding for local enterprises
Increase the agility and reduce the financial cost of government
Overhaul the systems for promoting investment in Puerto Rico
Raise participation of low-income populations in formal financial networks
Guarantee the effectiveness of programs that receive public funding through external assessment
Increase investment in electricity infrastructure and systems to improve efficiency and
Optimize the use of financial resources in promotion and prevention activities
Optimize the use of financial resources for health treatment
Invest in new land freight systems
Promote job creation by small and medium enterprises, community businesses and cooperatives
Redefine water and sewage pricing structure
Redefine electricity pricing structure
Enhance debt financing options available to small and medium enterprises
Public funds to provide financial assistance directly to students 2006 - Restoring Growth
Promote local businesses by providing support to local business owners in the form of financing alternatives, and access to internal and external markets.
Advance and upgrade infrastructure, facilitate private investments with a new financial method focused on efficiency and agility.
Promote a strong and healthy financial system to facilitate the efficient flow of capital to the economy and develop exporting capacities.
2009 - Strategies of a Strategic Model
Reducing the Costs of Doing Business
Streamline Business Regulation - Mobilizing Finance for Business Development and Growth
Promote and formalize a high quality entrepreneur and investor community that resides locally in Puerto Rico.
Promote change in the business and investment paradigm.
Allow cooperatives to be the motor of economic development.
Source: Puerto Rico Planning Board, 2014.
Finance and Insurance (NAICS - 52)
1975 - Puerto Rico’s Economic Development: A Strategy for the Next Decade (Informe Echenique)
1994 - New Model of Economic Development
2004 - Project Puerto Rico 2025
2006 -Economic Development And Government Transformation Plan For Puerto Rico
2012 - Report on the Competitiveness of Puerto Rico's Economy
2013 - A New Puerto Rico

ECONOMIC DEVELOPMENT PLAN FOR THE FINANCIAL SECTOR
8
SECTOR CHARACTERISTICS
1. GROSS NATIONAL PRODUCT/ GROSS DOMESTIC PRODUCT
As can be seen in the following graph, the GDP for the Financial and Insurance Sector in Puerto Rico for 2011 is approximately $5.3 billion, or around 16.4% less than the GDP for the year 2006 ($6.3 billions).
2. SIZE OF WAGES
In the Finance and Insurance Sector, even though there is a reduction in the GDP between 2006 and 2011, there is an increase in the Annual Payroll per Employee, for the period between 2006 and 2011, of approximately 20.6% (from $34,899 in 2006 to $42,093 in 2011). These fi gures can be seen in the following graph.

ECONOMIC DEVELOPMENT PLAN FOR THE FINANCIAL SECTOR
9
3. NUMBER OF PAID EMPLOYEES
The number of employees for the sector declines 14.1% between 2006 and 2011, as can be seen in the following graph.
3. NUMBER OF ESTABLISHMENTS
The Number of Establishments remains constant in the sector; there is only a small decline in the number of establishments of a total of 2% (37 establishments).
RELEVANCE OF THE FINANCIAL SECTOR IN THE ECONOMIC ACTIVITY
1. CURRENT TRENDS: ALL INDUSTRIES
In the decade that has transpired between 2004 and 2013, the banking system has suffered a severe contraction as a result of the economic crisis on the Island. There have been three notable exceptions to this rule- credit unions, AEELA and, government Banks- the sector industries have recorded a considerable fall in their total assets.

ECONOMIC DEVELOPMENT PLAN FOR THE FINANCIAL SECTOR
10
The fall in the fi nancial system’s assets is not part of or due to a normal process, which only serves to highlight the severity of the crisis that has plagued the Puerto Rican economy in the last decade. What normally occurs with assets in an economy is that the assets grow as time passes, and they grow faster than the economy itself, thus, increasing the fi nancial assets as a percentage of the GDP. This process is called “fi nancial deepening” and is considered fundamental to the economic development of a country.
With this said, it is important to note that Puerto Rico has been going through a fi nancial “decline in fi nancial deepening” in the past decade. One of the obligatory goals then for the economic plan is to revert this process and to reach acceptable metrics in the coming decade.
Commercial Banks** 39.0 41.2 43.1 41.2 -17.9International Banking Entities 35.1 35.5 24.2 28.5 -37.0Credit Unions 3.3 3.0 4.5 5.6 31.9Brokers Securities 1.3 0.6 2.2 1.0 -38.5Mortgage Institutions 5.5 2.8 2.8 1.2 -83.4Investment Companies 6.2 6.6 8.4 6.4 -19.4Leasing Companies 1.1 1.2 1.0 1.3 -10.7Financial Companies 2.5 2.2 2.3 2.6 -18.6Government Banks 4.5 5.2 9.8 10.4 80.7Small Loan Companies 0.7 0.7 0.4 0.3 -59.7AEELA 0.8 0.9 1.3 1.5 40.2
Total 100.0 100.0 100.0 100.0Total (in millions) $190,511 $213,301 $168,109 $148,125 -22.2
Source: OCFI* Updated December 31 every year** Internationals excluded
All Financial Institutions- Total Asset Percentage*
2004 2007 2010 2013 Cumulative GrowthType of Institution
NOTE: There is no mention of the number of assets in the alternative investments in Puerto Rico. Data for the fi nancial activity from Hedge Funds, Private Equities, etc. is currently unavailable due to the fact that it is not collected (according to OCIF offi cials). Some of the companies which operate in alternative investments in Puerto Rico are: Caribbean Property Group (CPG), Operating Partners Co. (OPC), Lone Star Funds, Encanto Group, among others. During the recession, many commercial banks sold non-performing loan portfolios to these private equities, which has caused the fi nancial asset market to be undervalued.
Another example of the decrease in activity in the sector- correlated with the decrease in assets- is the loss of profi tability of institutions in many fi nancial industries. The net income of commercial banks decreased by two thirds between 2005 and 2007, and became negative in 2010. Most recent data (2013) shows that the net income of the banking system was a little over $70 million, only 6% of the net income in 2004, before the crisis took place.
It’s important to note, also, that the commercial banking system has considerably shrunk in size, not only in terms of assets and profi tability, but also in the number of institutions. In the year 2010, Federal Deposit Insurance Corporation (FDIC) ordered the liquidation of three banking institutions.
Commercial banks were not the only entities affected as other entities have also suffered record profi tability losses, such as international banking entities, mortgage institutions, investment companies and, brokers. Particularly noteworthy, was the investment companies’ loss of over $2 billion in 2013, which can be partially attributed to the decline in investment funds with high quantities of offi cial bonds in Puerto Rico and other jurisdictions.

ECONOMIC DEVELOPMENT PLAN FOR THE FINANCIAL SECTOR
11
Commercial Banks $1,176,284 $402,557 ($747,041) $70,308International Banks Entities $650,065 $886,241 ($339,468) $100,036Credits Unions Brokers Securities ($5,196) $4,981 ($19,113) ($85,816)Mortgage Institutions $237,561 ($184,639) ($273,255) ($123,486)Investment Companies $403,283 $494,880 $425,781 ($2,382,047)Leasing Companies $36,258 $11,584 $39,483 $16,197Finance Companies $69,411 ($17,595) $115,824 $70,596Government Banks $403,043 ($78,245) $58,915 $129,547Small Loans Companies $12,694 ($24,534) $42,850 $37,601AEELA $29,236 $41,838 $41,011 $39,487
Total $3,012,639 $1,537,068 ($655,013) ($2,127,577)
Source: OCFI* Updated December 31 every year
Financial Sector Net Income by Type of Institution- in Millions
Type of Institution 2004 2007 2010 2013
2. CURRENT TRENDS: COMMERCIAL BANKS
An important indicator of the general condition of the economy’s credit is the total number of assets in commercial banks as a fraction of the GDP. In Puerto Rico, it has been steadily declining since 2005. From a maximum of 1.8 in 2005, this indicator went down to 1.01 in 2012. This is a clear example of the process which has been termed “fi nancial decline in fi nancial deepening”. In essence, the deep fall of this ratio indicates that credit has declined considerably and carries less weight in economic activity that what was the norm during more stable times.
The contraction of the total of assets, in addition to the number of active institutions, has led to a heightened concentration in the industry. In 2013, one entity controlled 40% of the assets, while the other 60% was split into almost even parts between another six institutions. For the same year, the Herfl indahl-Hirschman Index, which is used to calculate asset distribution for commercial banks, reached 2,248, which indicates a high level of asset concentration.
One important determination that has to be made when drafting an economic plan is what the optimal size of the commercial banking sector ought to be. Some analysts feel that the number of banks before the crisis was too high, and that it is a positive change for the number to be lower now. Others believe that once the economy begins to recover, there will be a need for more participants within the industry. This is an issue which is structural in nature and is one that needs to be explicitly addressed when formulating strategies and goals for this industry.

ECONOMIC DEVELOPMENT PLAN FOR THE FINANCIAL SECTOR
12
The decrease in business and income, in addition to the pressure from regulators, has forced banks to submit to a process of fi nancial and operational “improving their portfolios”. This can be seen, particularly, in the structure of liabilities and capital in institutions.
From the onset of the fi nancial crisis, commercial banks have signifi cantly reduced their debts to other entities- act termed “leverage”- and have substantially increased their capital base. This, in addition to the increase in the importance of deposits in the liabilities’ structure, denoted an important strengthening of the balance sheets.
In 2004, commercial banks’ capital represented less than 7% of total liabilities and capital, but by 2013 it was above 11%. On the other hand, short and long-term debts went from comprising 40% of liabilities in 2004, to represent less than 10% in 2013. Meanwhile, deposits went from constituting less than half of liabilities to over three quarters of the total. This constitutes a dramatic change in the in the balance sheet structure, which promises to bring more robustness to the banking industry.
Total Liabilities and Capital 100 100 100 100 -33.7 Total Liabilities 93.5 93.0 91.0 88.5 -37.3
Deposits 49.0 62.2 64.2 75.8 -33.7Short Term Debt 26.2 15.3 9.8 2.7 -93.1Long Term Debt 13.4 10.8 13.0 6.7 -66.8Other Liabilities 4.9 4.7 4.1 3.2 -56.7
Total Capital 6.5 7.0 9.0 11.5 18.1Preferred Stock 0.4 0.4 0.5 0.6 -8.3Common Stock 0.5 0.8 1.0 0.9 11.6Surplus 2 3 6 8 135.3Undistributed Profits 3.2 2.7 1.4 1.9 -60.6
Total Liabilities and Capital $95,487,153 $98,580,902 $75,473,752 $63,335,852 -33.7(thousands of dollars)
Source: OCFI* Updated December 31 every year
Commercial Banks Balance Sheet- Percentage of Total Liabilities and Capital *
2004 2007 2010 2013 Cumulative Growth
The “improving their portfolios” process in banking can also be seen in the industry effi ciency indicators. Since 2007 there has been a steady reduction of income resulting from interests as a percentage of the total assets, except for an upturn in 2013m which was a refl ection of decrease in loan yields caused by the deterioration in the quality of the loan portfolio (for example, the increase of late payment). This decrease in performance, added to the fact that banks cannot decrease their operational costs, has led to the increase of operational costs as a percentage of assets. The combination of both these trends, has inevitably led to the reduction of profi tability, which, as discussed, is evident in the evolution of net income.

ECONOMIC DEVELOPMENT PLAN FOR THE FINANCIAL SECTOR
13
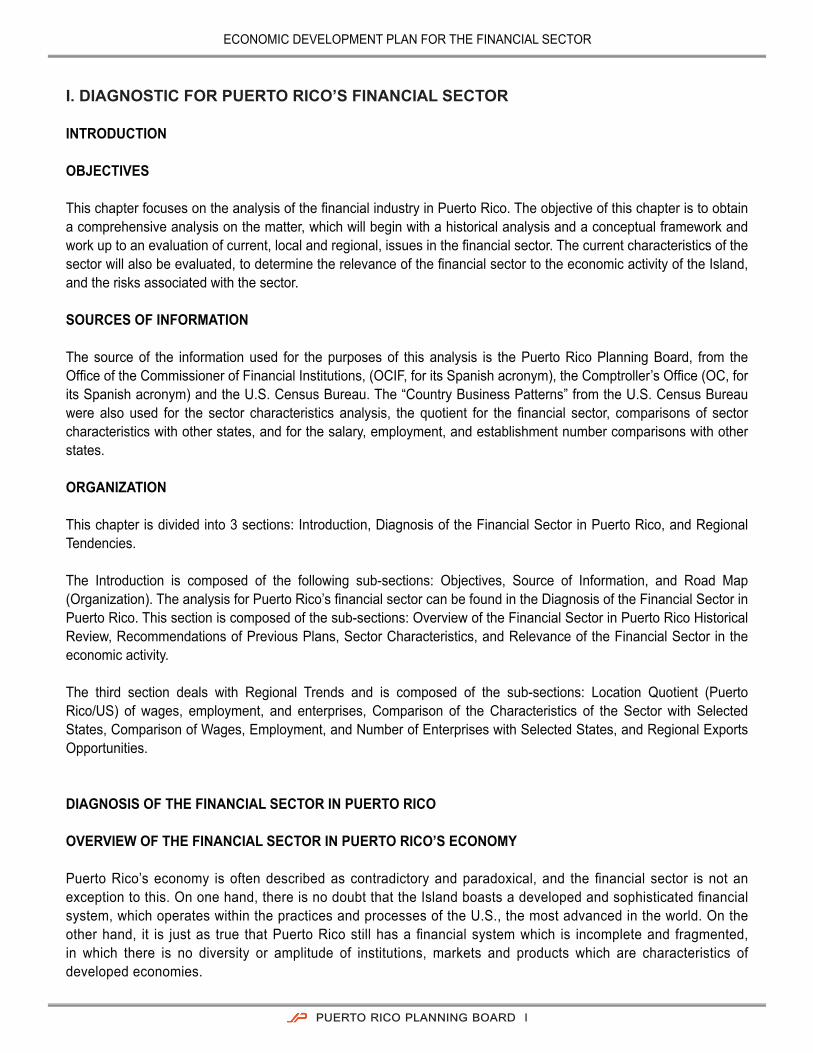
From the point of view of the general economy, this “improving their portfolios” process has had the effect of limiting credit availability and raising its cost. The past seven years have constituted a period of strong rationing of banking credit on the Island, which has had a negative impact on many businesses which depend on financing in order to meet their operational costs. Loans and financial leases in the banking industry have been limited on both ends, supply and demand. On the supply side, the lending capacity of banks has been reduced due to the need to clear failed loans from portfolios and strengthen the capital base of institutions. On the demand side, the credit of many firms and businesses has been negatively impacted as a result of the recession, thus, shrinking the eligible population (good candidates) for loans.
ECONOMIC DEVELOPMENT PLAN FOR THE FINANCIAL SECTOR
14
Lastly, the banking “improving their portfolios” process also signifi ed a thorough asset restructuring. One of the most notable results is the intense contraction of investment portfolios in securities, which have dropped from comprising 41% of the total assets in 2003, to representing only 9% of the total assets by 2013. The securities investment portfolios registered up to $38 billion in assets in 2004. Nine years later, in 2013, the volume of said portfolios was under $6 billion.
Conversely, there was a substantial increase in the relevance of other assets. These increased to 15% of the total in 2013, while, ten years earlier in 2003, they only constituted 4% of the assets. These trends are the refl ection of the strong process of deleveraging that is taking place in the sector.

ECONOMIC DEVELOPMENT PLAN FOR THE FINANCIAL SECTOR
15

ECONOMIC DEVELOPMENT PLAN FOR THE FINANCIAL SECTOR
16
3. CURRENT TRENDS: INTERNATIONAL BANKING ENTITIES
The international banking entities (IBEs) compose quite a large industry, judging by the amount of assets that they manage. Nevertheless, their impact on the local economy is much smaller than that of commercial banking, since the IBEs were designed to operate primarily, if not exclusively, in the international arena.
In broad terms, the recent behavior of these entities has been similar to commercial banking: they have both shown a sharp decline in their total assets and their profi tability. The industry indicators show that the IBE’s have also undergone a process of “deleveraging”.
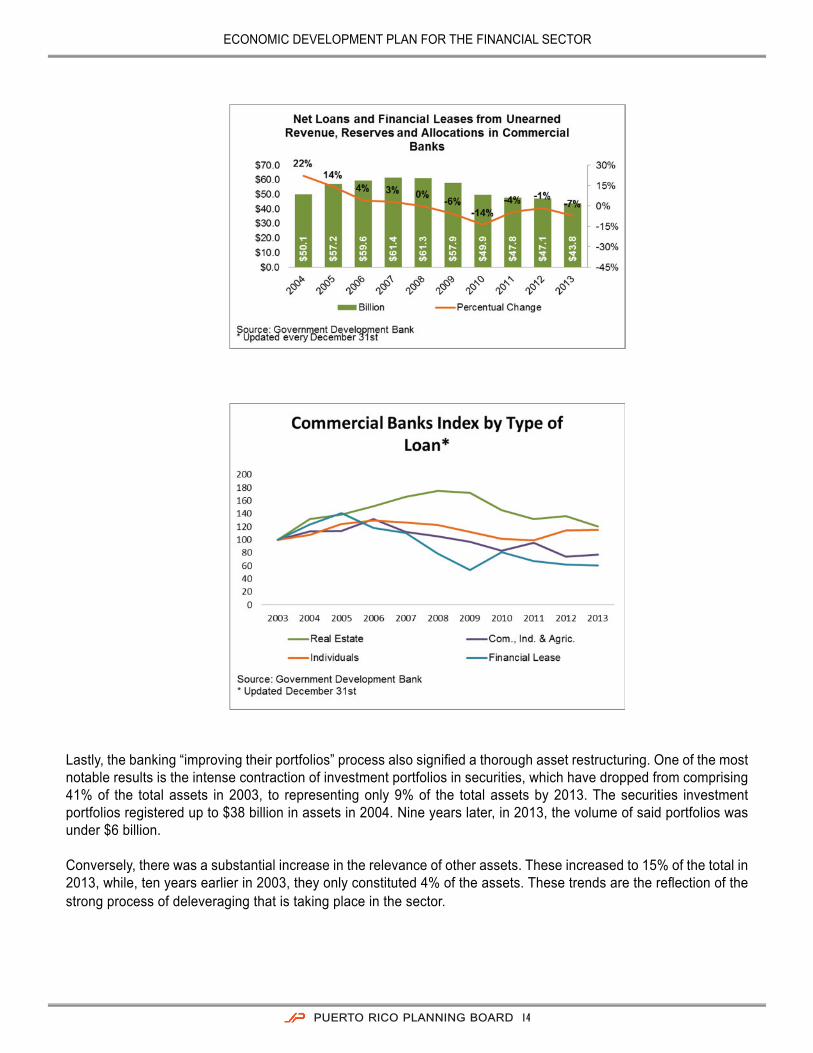
The total IBEs’ assets were $66.9 billion in 2004, and by 2013, they had been reduced to $42.2 billion. Even more noteworthy was the sharp decline in the net income as a percentage of the total assets. The ratio in 2007 was 5.5%, and by 2013 it declined to 0.7%, showing a sharp decline in the profi tability of investments.
AccumulatedGrowth
Total Assets 100 100 100 100 -37.0Cash 0.8 1.6 1.0 0.8 -33.4Bank Placements 1.1 0.7 1.5 0.6 -62.8Securities 42.3 33.3 17.5 7.5 -88.8Loans and Leases 27.4 23.3 20.4 4.2 -90.4Federal Funds Sold 0.7 1.5 0.4 1.8 66.2Due From Related Parties 23.3 34.3 51.1 79.4 114.6Other Assets 4.5 5.3 8.2 5.6 -20.9
Total Liabilities and Capital 100 100 100 100 -37.0 Total Liabilities 82.0 77.0 87.7 87.3 -33.0
Deposits 13.5 21.2 24.5 24.3 13.6Deposit Demand 1.3 1.5 2.3 0.9 -56.6Time Deposits 12.2 19.8 22.2 23.4 20.9
Liabilities 68.5 55.8 63.2 62.9Federal Funds Purchased 2.4 0.3 0.0 0.0 -100.0Borrowings 41.6 23.3 15.3 4.6 -93.0Due to Related Parties 23.3 31.6 47.4 58.2 57.1Other Liabilities 1.1 0.6 0.5 0.1 -95.3
Total Capital 18.0 23.0 12.3 12.7 -55.5
Total Assets (thousands of dollars) $66,947,590 $75,807,188 $40,607,688 $42,151,960 -37.0
Source: OCIF*Updated every December 31st
2004 2007 2010 2013
International Banking Entities Balance Sheet in Percentages*
ECONOMIC DEVELOPMENT PLAN FOR THE FINANCIAL SECTOR
17
4. CURRENT TRENDS: INVESTMENT COMPANIES
Investment companies were not as adversely affected as other fi nancial industries during the crisis. However, starting in 2013, a string of events occurred which affected this industry in particular. The investment companies’ assets maintained a slight yet sustained growth between 2005 and 2012, a period in which many other fi nancial industries suffered a decline in their assets. This could be attributed to savers choosing to place their funds in high-yield instruments- such as investment funds- at times when commercial banks and other entities were paying low interest rates for their deposits.
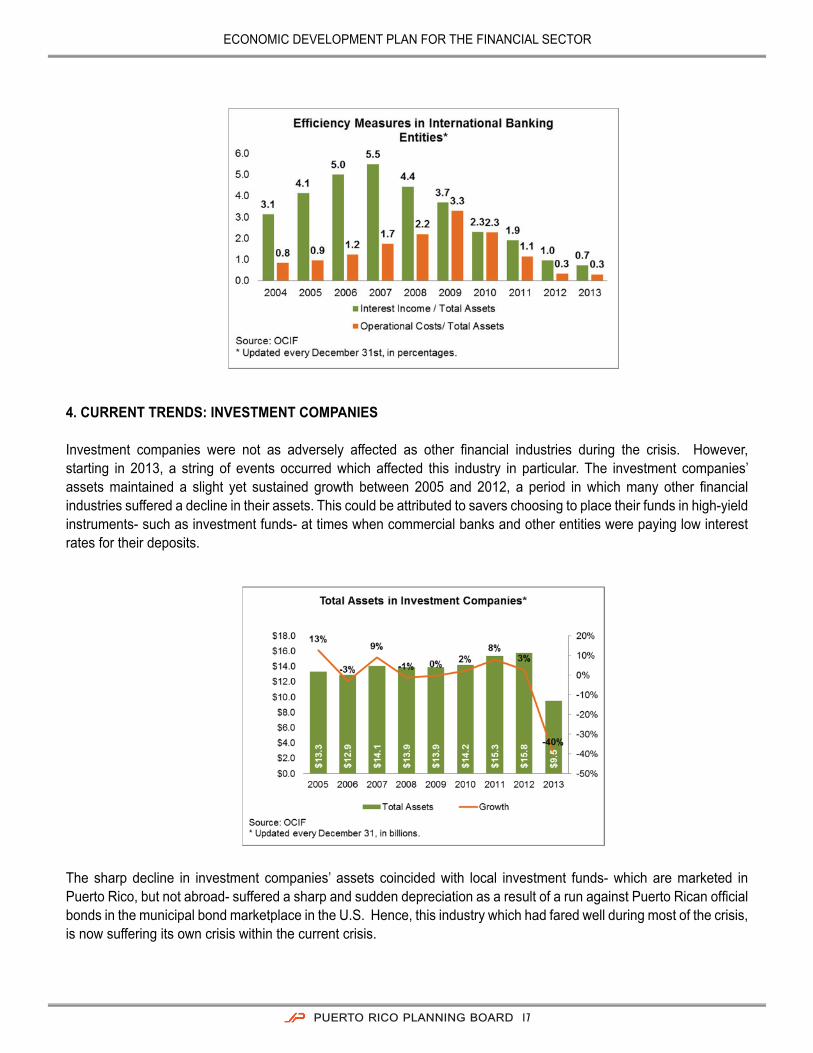
The sharp decline in investment companies’ assets coincided with local investment funds- which are marketed in Puerto Rico, but not abroad- suffered a sharp and sudden depreciation as a result of a run against Puerto Rican offi cial bonds in the municipal bond marketplace in the U.S. Hence, this industry which had fared well during most of the crisis, is now suffering its own crisis within the current crisis.
ECONOMIC DEVELOPMENT PLAN FOR THE FINANCIAL SECTOR
18
This phenomenon, particular to investment companies, can also be seen in the behavior of net income before taxes, which remained positive between 2004 and 2012- with the exception of 2008, when the worldwide fi nancial crisis exploded- but suffered a dramatic fall in 2013.

ECONOMIC DEVELOPMENT PLAN FOR THE FINANCIAL SECTOR
19
5. CURRENT TRENDS: CREDIT UNIONS
Credit unions are the fi nancial industry which has weathered the fi nancial crisis the best. This is not to say that the industry has been immune to the effects of the recession nor avoided a decrease in value of Puerto Rican offi cial bonds, however, it has shown sustained growth in all the main areas during the economic crisis.
Although the growth has not been marked, the credit unions’ assets have grown in all years between 2006 and 2013, with 2009 boasting a 7% increase, just when the global economy was going through a recession caused by the fi nancial crisis which exploded in 2008. Furthermore, credit unions have registered sustained growth in their capital base during this diffi cult period.
The most interesting characteristic of credit unions, is that they have been able to maintain, and even increase, their deposit base during the crisis. This is due to the nature of the relationship between credit unions and their depositors- credit unions work closely with their partners in order to create a stable base and loyal depositors in the communities in which they operate. This type of relationship could be emulated by other depository industries so that they may, too, strengthen their local deposits in the fi nancial sector.

ECONOMIC DEVELOPMENT PLAN FOR THE FINANCIAL SECTOR
20
6. CURRENT TRENDS: MORTGAGE INSTITUTIONS
Puerto Rico has a high number of mortgage institutions, due to the fact that most are small institutions and are grouped by regional areas. However, there are some that are affi liated to the major commercial banks and, hence, are very large in size.
As can be expected, the mortgage industry has been one of the most affl icted during the crisis, since it is directly tied to one of the areas most affected by the economy’s downturn. The construction and sale of new homes on the Island were practically paralyzed some six years ago, which, in turn, caused the industry to focus on refi nancing and reselling of existing housing units. The size of the industry has decreased to merely 16% of what is was back in 2004, in terms of assets.
In addition to the challenges mentioned, this industry also faces structural challenges related to the legal and regulatory arena as well as with the demographic transition that Puerto Rico is currently undergoing. These issues will be examined in detail at the moment of formulating strategies for the industry as part of the economic development plan.
Total Assets 100 100 100 100 -84.2Cash 7.4 5.8 3.2 7.0 -85.0Net Loans and Leases 53.2 47.5 59.0 31.8 -90.6Other Current Assets 11.5 18.0 11.9 2.1 -97.1Securities 11.7 6.9 4.7 2.7 -96.4Other Assets 16.2 21.8 21.2 56.5 -45.0
Total Assets (billions) $10,976,081 $5,916,728 $4,744,065 $1,735,590 -84.2
Source: OCIF* Updated every December 31st
Total Asset Balance Sheet for Mortgage Institutions in Percentages*
2004 2007 2010 2013 Accumulated Growth
7. CURRENT TRENDS: OTHER INDUSTRIES
There are other industries in the fi nancial sector aside from the ones examined up to now, which, although smaller in size, also play ann important role in the economy and should grow in size in the medium and long run. Among these are fi nancial companies and capital risk funds.
As with other industries, these also registered important decreases in their operational volume, which impacted their total assets as well as their profi tability. For fi nancial companies the decrease has not been as steep as in other fi nancial activities, but in the case of capital risk funds, the decrease was dramatic.

ECONOMIC DEVELOPMENT PLAN FOR THE FINANCIAL SECTOR
21
Financial companies specialize in the fi nancing of high value sales, such as, for example, the purchasing of automobiles. In general, they compete with commercial for the placement of loans to consumers and businesses, but they limit themselves to certain types of fi nancing. The fact that car sales have increased signifi cantly in the past four (4) years has been an important factor in the relatively favorable performance of this industry.
In terms of the capital risk funds, it is perfectly understandable that economic activity has slowed down as a result of the crisis, since one of the areas most affected by a recession- especially if it is prolonged and severe- is the launching of new business initiatives. Nevertheless, this industry should be focused on in the drafting of a development plan for the fi nancial sector, since it is a key fi nancial activity for the economy of entrepreneurship and knowledge. Currently, this is an underdeveloped industry in Puerto Rico, and it is necessary for it to become a bigger piece in the local economy in the medium and long run.
REGIONAL TRENDS
1. LOCATION QUOTIENT (PUERTO RICO/US) OF WAGES, EMPLOYMENT AND ENTERPRISES.
The Location Quotient (LQ) is a way of quantifying how concentrated an industry is in a region compared to a larger region, in this case Puerto Rico to the United States of America. LQ were calculated for the Number of Employees, Annual Payroll per Employee, and Number of Establishments based on P.R. and U.S. data from the U.S. Census Bureau, County Business Pattern for the year 2011. Tables 1 through 4 show the Industry Location Quotient (LQ) analysis performed for the Finance & Insurance Sector and Sub-sectors (NAICS 52), including the Number of Employees, Number of Establishments, and Total Annual Payroll sorted from largest to smallest values, and Annual Payroll per Employee sorted from smallest to largest value. Those tables show the sub-sectors according to the concentration value of Puerto Rico compared with the United States of America. The data for this analysis was obtained from the U.S Census Bureau, County Business Patterns for 2011.

ECONOMIC DEVELOPMENT PLAN FOR THE FINANCIAL SECTOR
22
The following graphs show the Finance & Insurance Sector (NAICS 52) LQ with respect to the Number of Paid Employees for this sector in 2011 was 0.99 meaning that P.R. has 0.99 paid employees for every 1 paid employee in the U.S. LQ with respect to the Annual Payroll per Employee for this sector in 2011 was 0.93 meaning that P.R. pays $0.93 per employee for every $1 paid per employee in the U.S.

ECONOMIC DEVELOPMENT PLAN FOR THE FINANCIAL SECTOR
23
The following graphs show LQ with respect to the Number of Establishments for this sector in 2011 was 0.68 meaning that P.R. has 0.68 establishments for every 1 establishment in the U.S. For the year 2011 the Annual Payroll per Employee in P.R. was $42,093 and in the U.S. $83,849. This means that, on average, the Annual Payroll per Employee in P.R. is 50.20 percent of what it is in the U.S. which represents a difference of -$41,755.

ECONOMIC DEVELOPMENT PLAN FOR THE FINANCIAL SECTOR
24
A number of maps have been included, which illustrate the changes in the Number of Establishments in the Finance and Insurance sector for Puerto Rico (NAICS 52) for the years 2006 and 2011, and for various other sub-sectors for the year 2011: Credit Intermediation and Other Related Activities (NAICS 522), Securities, Commodity Contracts, and Other Financial Investments and Related Activities (NAICS 523), Insurance Carriers and Related Activities (NAICS 524) and, Funds, Trusts, and Other Financial Vehicles (NAICS 525). The largest concentration of establishments can be observed in the metropolitan area, as well as the cities of Ponce and Mayaguez, as can be seen throughout the maps.
The following map shows a 2% decrease in the number of establishments in NAICS sector 52 between 2006 and 2011, particularly in the center and northeast of the Island.

ECONOMIC DEVELOPMENT PLAN FOR THE FINANCIAL SECTOR
25
The following map shows the number of establishments in Puerto Rico for the Credit Intermediation and Related Activities sub-sector (NAICS 522). The frequency and distribution of NAICS sub-sector 522 are similar to those of NAICS Finance and Insurance sector 52, as can be seen in the following map.

ECONOMIC DEVELOPMENT PLAN FOR THE FINANCIAL SECTOR
26
As can be seen in the following maps, the Securities, Commodity Contracts, and Other Financial Investments and Related and Activities sub-sector (NAICS 523), has a lesser number of establishments than other sub-sectors and are concentrated in the metropolitan area.
San Juan, Mayagüez, and Ponce are the municipalities with the highest number of establishments in the Insurance Carriers and Related Activities sub-sector (NAICS 524). Similarly to the Credit Intermediation and Related Activities sub-sector (NAICS 522), the establishments are concentrated in the metro and an absence of these can be noted in the center of the Island as can be seen in the following map.

ECONOMIC DEVELOPMENT PLAN FOR THE FINANCIAL SECTOR
27
A pattern similar to the one seen in the Insurance Carriers and Related Activities (NAICS 524) and Credit Intermediation and Related Activities (NAICS 522) sub-sector (where establishments are grouped are concentrated in the municipalities of San Juan, Ponce y Mayagüez) can be observed in the Funds, Trusts, and Other Financial Vehicles sub-sector (NAICS 525). However, the number of establishments in this sub-sector is less than in any other sub-sector, and all of them are located solely in the three municipalities mentioned.
2. COMPARISON OF THE CHARACTERISTICS OF THE SECTOR WITH SELECTED STATES (I.E., FLORIDA, HAWAII, SOUTH CAROLINA, MISSISSIPPI, MASSACHUSETTS, CONNECTICUT).
In this section, the Number of Establishments and the Annual Payroll per Employee sub-sectors, from the Finance and Insurance sector will be evaluated, for the 2003-2011 period. As shown in the following table, there is an increase in the number of establishments for the 2006-2008 period, with a 7.1 percentage change for 2006, 11.6 for 2007, and 0.9 for 2008, which is followed by a decrease to pre-2006 levels in establishments.
Year Establishments %Change Employees1 %Change Yearly Payroll2 %Change
2003 1,854 35,450 $1,270,2842004 1,977 6.6% 37,924 7.0% $1,403,673 10.5%2005 1,806 -8.6% 36,577 -3.6% $1,273,184 -9.3%2006 1,934 7.1% 40,304 10.2% $1,406,578 10.5%2007 2,159 11.6% 40,004 -0.7% $1,491,822 6.1%2008 2,178 0.9% 40,710 1.8% $1,565,957 5.0%2009 2,057 -5.6% 37,660 -7.5% $1,432,341 -8.5%2010 1,979 -3.8% 34,906 -7.3% $1,430,413 -0.1%2011 1,897 -4.1% 34,633 -0.8% $1,457,813 1.9%
Source County Business Patterns¹ In payroll by March 12th² In thousands
Finance and Insurance Sector (NAICS 52) Profile in Puerto Rico

ECONOMIC DEVELOPMENT PLAN FOR THE FINANCIAL SECTOR
28
A similar trend to the one seen for the Number of Establishments sub-sector can be seen in the Number of Paid Employees and Annual Payroll per Employee sub-sectors: a percentage increase for the 2006-2008 period, followed by a reduction to pre-2006 levels, as the following graphs indicate.
When the Number of Establishments sub-sector in Puerto Rico is compared to those in the states of Connecticut, Florida, Hawaii, Massachusetts, Mississippi the same patter previously identifi ed can be observed- there is an increase in the number of establishments for the 2006-2008 period, followed by a decrease to pre-2006 levels. This is shown in the following graph.

ECONOMIC DEVELOPMENT PLAN FOR THE FINANCIAL SECTOR
29
Year Connecticut Florida Hawaii South Carolina Massachusetts Mississippi
2003 5,907 29,822 1,495 6,690 9,572 4,4652004 6,212 31,626 1,519 6,854 9,688 4,6012005 6,145 32,974 1,600 6,827 9,731 4,7072006 6,351 34,734 1,640 7,162 9,836 4,6172007 6,540 35,716 1,674 7,596 10,073 4,9322008 6,629 33,957 1,602 7,731 10,018 4,9362009 6,399 32,301 1,528 7,689 9,695 4,8652010 6,339 31,305 1,450 7,332 9,437 4,7162011 6,178 30,500 1,425 7,201 9,359 4,698
Source County Business Patterns
Total Establishments in Finance and Insurance Sector (NAICS 52)
As can be observed, Florida boasts the greatest number of establishments with an average of 32,548 establishments, followed by Massachusetts (9,712), South Carolina (7,231), Connecticut (6,300), Mississippi (4,726) and lastly, Hawaii (1,548).Florida also has the greatest number of paid employees.
Year Connecticut Florida Hawaii South Carolina Massachusetts Mississippi
2003 145,393 357,834 19,218 70,662 209,576 34,5812004 137,330 372,380 19,256 66,961 213,848 34,6412005 133,285 370,990 19,707 65,591 206,327 35,6162006 169,053 388,417 20,097 69,745 211,046 34,5502007 128,497 370,797 20,608 67,432 214,822 35,2512008 128,897 386,983 19,363 69,830 221,263 35,8762009 124,950 338,098 19,220 67,278 209,550 35,1422010 121,304 328,994 19,171 67,508 197,247 33,7642011 115,490 331,921 18,783 65,516 196,755 33,593
Source: County Business Patterns
Number of Paid Employees in the PR Finance and Insurance Sector (NAICS 52)
The following graph shows the behavior for the number of establishments in the 2003-2011 period, using an index with 2003 as the base year. In 2005, Puerto Rico, South Carolina y Connecticut show a decrease in the number of establishments, for which Puerto Rico’s is the most signifi cant. Mississippi shows a marked decrease in the number of establishments for the year 2006. These trends become positive briefl y in 2007, and negative once again in 2009.

ECONOMIC DEVELOPMENT PLAN FOR THE FINANCIAL SECTOR
30
The following graph shows the index for the Number of Paid Employees by jurisdiction, in the Finance and Insurance sector (NAICS 52). As can be seen in the graph, all jurisdictions show varying patterns, however, they all show negative trends by 2011. Puerto Rico is the only jurisdiction which shows an increase with respect to 2003 (up until 2008, at which point the trend begins to show a decline).
INSURANCE INDUSTRY
As mentioned earlier, even though the insurance industry is part of the fi nance sector, it possesses very unique characteristics which sets it apart from the rest of the industries in the sector. For this reason, its behavior is not similar to commercial banking or other industries which have been severely affected in the economic crisis.
Industry indicators show that, as a response to the crisis, insurance operations have limited their growth. Assets have remained stable, for the most part, sustaining slight growth and remaining stable by avoiding sharp declines which seemed unavoidable in the rest of the fi nancial sector.
Also noteworthy, is the fact that insurance companies have been able to maintain positive profi tability throughout the duration of the crisis. Between 2005 and 2012, the industry’s income was negative only in one year (2006), and this was before the beginning of the crisis. In addition to this, there is a clear growth trend for the number of people paying insurance premiums for the 2005-2012 period, even though 2012 saw a regress in this indicator.

ECONOMIC DEVELOPMENT PLAN FOR THE FINANCIAL SECTOR
31
AccumulatedGrowth
Local Insurance CarriersHealth $2,128 $3,052 $4,150 $4,158 $4,737 $5,366 $6,123 $5,477 157.3
Property and Casualty $1,769 $1,794 $1,788 $1,742 $1,660 $1,620 $1,605 $1,636 -7.5Life and Disability $2,241 $2,671 $2,297 $2,586 $2,662 $2,636 $2,508 $2,586 15.4
Foreign Insurance CarriersProperty and Casualty $337 $245 $404 $251 $212 $208 $205 $214 -36.4Life and Disability $487 $560 $615 $560 $535 $598 $618 $664 36.4
Total Premiums and Losses $6,962 $8,322 $9,254 $9,297 $9,805 $10,427 $11,059 $10,577 51.9
Source: Office of the Puerto Rico Commissioner of Insurance*Updated every December 31, in millions of dollars
2010 2011 2012
Insurance Company Premiums*
2005 2006 2007 2008 2009
Net Revenue $161 -$587 $320 $295 $394 $391 $367 $338
Local Premiums $6,138 $7,517 $8,235 $8,486 $9,058 $9,622 $10,237 $9,699
Source: Office of the Puerto Rico Commissioner of Insurance*Updated every December 31, in millions of dollars
4.1%
2012
3.6%
2008 2009 2010 2011
3.5%Net Revenue/ Local Premiums
2.6% -7.8%
Local Insurance Company Revenues*
2005 2006 2007
3.9% 3.5% 4.3%

ECONOMIC DEVELOPMENT PLAN FOR THE FINANCIAL SECTOR
32
II. SWOT ANALYSIS
INTRODUCTIONOBJECTIVES
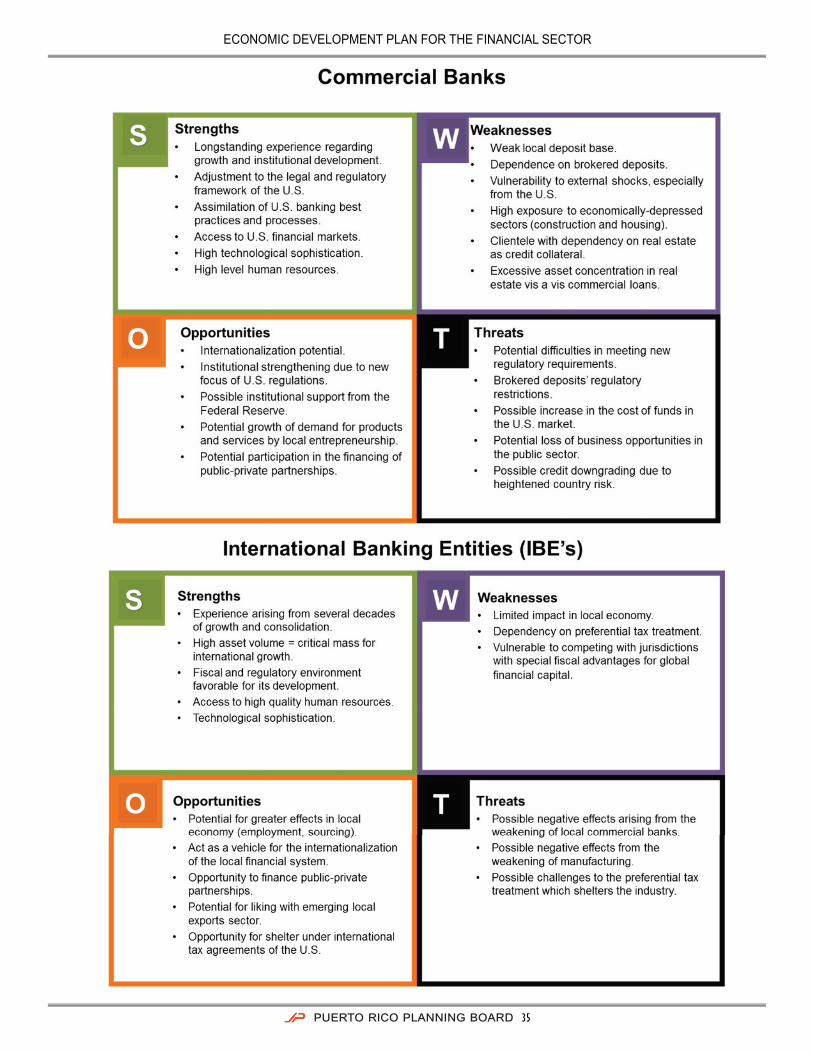
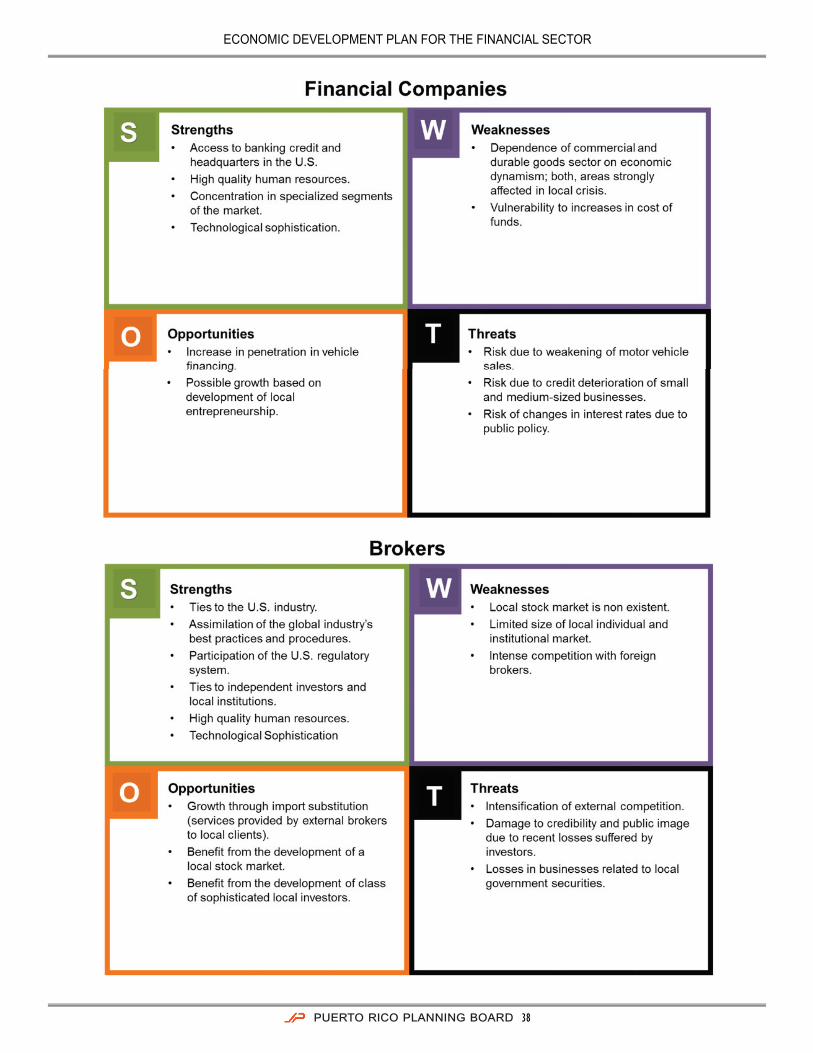
The objective of this chapter is to identify strengths, weaknesses, opportunities, and threats to the fi nancial sector in Puerto Rico and its sub-sectors.
SOURCE OF INFORMATION
The sources that were used for the analysis include the Report on the Competitiveness of Puerto Rico’s Economy, published by the Federal Reserve Bank of New (FED); the book titled The Economics of Puerto Rico: Restoring Growth edited by Collins, Bosworth and Soto-Class; interviews with people of interest within the industry, and previous analyses on the topic performed by Advantage Business Consulting.
ORGANIZATION
This chapter presents the analysis of the Strengths, Weaknesses, Opportunities, and Threats (SWOT) to the fi nancial sector and sub-sectors in Puerto Rico. The chapter begins with a broad fi nancial analysis of the whole sector, and then each sub-sector or industry is analyzed separately.

ECONOMIC DEVELOPMENT PLAN FOR THE FINANCIAL SECTOR
33
TABLE AND DISCUSSION

ECONOMIC DEVELOPMENT PLAN FOR THE FINANCIAL SECTOR
34
ECONOMIC DEVELOPMENT PLAN FOR THE FINANCIAL SECTOR
35

ECONOMIC DEVELOPMENT PLAN FOR THE FINANCIAL SECTOR
36

ECONOMIC DEVELOPMENT PLAN FOR THE FINANCIAL SECTOR
37
ECONOMIC DEVELOPMENT PLAN FOR THE FINANCIAL SECTOR
38

ECONOMIC DEVELOPMENT PLAN FOR THE FINANCIAL SECTOR
39

ECONOMIC DEVELOPMENT PLAN FOR THE FINANCIAL SECTOR
40

ECONOMIC DEVELOPMENT PLAN FOR THE FINANCIAL SECTOR
41