what we eat in america, nhanes 2001-2002: usual nutrient intakes
TRANSCRIPT
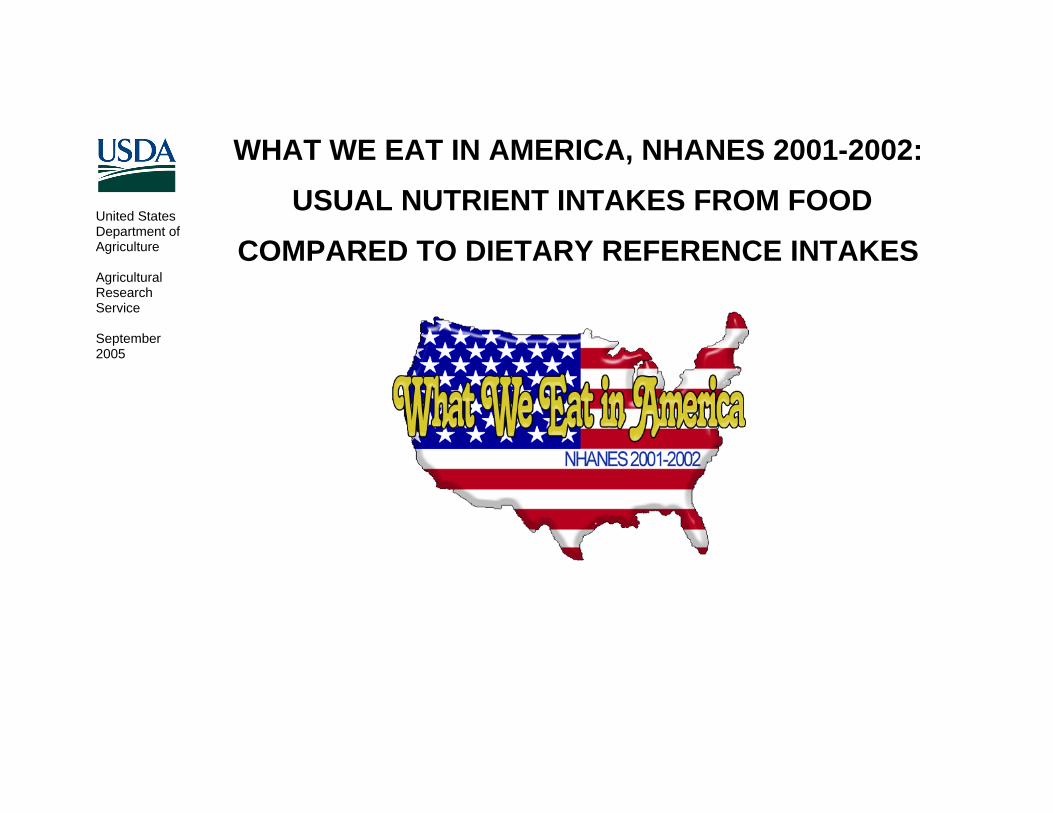
United States Department of Agriculture Agricultural Research Service September 2005
WHAT WE EAT IN AMERICA, NHANES 2001-2002: USUAL NUTRIENT INTAKES FROM FOOD
COMPARED TO DIETARY REFERENCE INTAKES
Suggested citation Moshfegh, Alanna; Goldman, Joseph; and Cleveland, Linda. 2005. What We Eat in America, NHANES 2001-2002: Usual Nutrient Intakes from Food Compared to Dietary Reference Intakes. U.S. Department of Agriculture, Agricultural Research Service.
Abstract This report presents national estimates of usual nutrient intake distributions from food for 24 nutrients and dietary components and compares those estimates to the Dietary Reference Intakes published by the Institute of Medicine. Data are based on 8,940 individuals ages 1 year and older (excluding breast-fed children and pregnant or lactating females) who completed a 24-hour dietary recall in What We Eat in America, the dietary interview component of the National Health and Nutrition Examination Survey, 2001-2002. Data include nutrient intakes from food only and do not cover intakes from dietary supplements or over-the-counter medicines. Statistics are reported for 17 gender/age groups. Nutrients identified as potential problems for most gender/age groups based on comparisons to Estimated Average Requirements include vitamins A, E, and C, and magnesium. Other nutrients that may be problems only for certain segments of the population are vitamin B6 for older adult females, zinc for older adult males and females and teenage females, and phosphorus for preteen and teenage females. Vitamin K, calcium, potassium, and dietary fiber, nutrients for which no Estimated Average Requirements have been established, may also be of concern. Most Americans had adequate intakes of carbohydrate, selenium, niacin, and riboflavin. In addition, children and males generally had adequate intakes of folate, copper, phosphorus, thiamin, iron, and protein. Proportions of females with adequate intakes of these nutrients were lower.
Acknowledgements The authors gratefully acknowledge the constructive contributions of the peer reviewers that included Kevin W. Dodd, National Cancer Institute, NIH, DHHS; Victor Fulgoni III, Nutriton Impact, LLC; Patricia M. Guenther, Center for Nutrition Policy and Promotion, USDA; Clifford L. Johnson, National Center for Health Statistics, CDC, DHHS; Linda D. Meyers, Food and Nutrition Board, Institute of Medicine, National Academies; Suzanne P. Murphy, Cancer Research Center of Hawaii, University of Hawaii; and Allison A. Yates, ENVIRON Health Sciences.
2
ARS Mission The Agricultural Research Service conducts research to develop and transfer solutions to agricultural problems of high national priority and provides information access and dissemination to ensure high-quality, safe food and other agricultural products; assess the nutritional needs of Americans; sustain a competitive agricultural economy; and enhance the natural resource base and the environment; and provide economic opportunities for rural citizens, communities, and society as a whole.
To ensure timely distribution, this report has been reproduced essentially as supplied by the authors. It has received minimal publications editing and design. The authors views are their own and do not necessarily reflect those of the U.S. Department of Agriculture.
____________________________________________________________________________________________________________ The U.S. Department of Agriculture prohibits discrimination in all its programs and activities on the basis of race, color, national origin, sex, religion, age, disability, political beliefs, or marital or family status. (Not all prohibited bases apply to all programs.) Persons with disabilities who require alternative means for communication of program information (Braille, large print, audiotape, etc.) should contact USDA’s TARGET Center at (202) 720-2600 (voice and TDD). To file a complaint of discrimination, write: USDA, Director, Office of Civil Rights, 1400 Independence Avenue, SW, Washington D.C. 20250-9410, or call (202) 720-5964 (voice and TDD). USDA is an equal opportunity provider and employer. Mention of trade names or commercial products in this report is solely for the purpose of providing specific information and does not imply recommendation or endorsement by the U.S. Department of Agriculture.
3

Use of Dietary Reference Intakes for Nutrient Assessment of Groups The Food and Nutrition Board of the Institute of Medicine, National Academies, established a set of reference values for nutrients called Dietary Reference Intakes (DRIs) for use in planning and assessing diets of apparently healthy people (1-7). The DRIs used in this report are those appropriate for assessing intakes of population groups, and include the Estimated Average Requirement (EAR), Adequate Intake (AI) for those nutrients without an EAR, and Tolerable Upper Intake Level (UL). The assessments presented in this report cover nutrient intakes from foods only. They do not cover intake from dietary supplements or over-the-counter medicines.
The data in this report are estimated from 24-hour dietary recall interviews conducted in What We Eat in America (WWEIA), NHANES 2001-2002 (8). Dietary recalls were conducted by trained interviewers using automated data collection systems that included multiple passes. The day 1 recalls were conducted in-person in the NHANES Mobile Examination Center. The day 2 recalls were conducted by telephone approximately 3-10 days after the day 1 recall. The intake information was coded using the USDA Food and Nutrient Database for Dietary Studies 1.0 to produce nutrient intake values (9).
This report presents estimates of usual nutrient intakes, including the mean, standard error of the mean, and intakes at the 5th, 10th, 25th, 50th, 75th, 90th, and 95th percentiles for gender/age groups for which DRIs have been established: children ages 1-3 and 4-8 years, males and females ages 9-13, 14-18, 19-30, 31-50, 51-70, and over 70 years. Additionally, summary estimates are presented for males and for females 19 years and older, and all individuals. Infants and pregnant and lactating females were excluded because of sample sizes that were not large enough for comparison to their unique DRIs. Breast-fed children were excluded because breast milk was not quantified in their dietary intakes. Sample sizes for all gender/age groups from WWEIA, NHANES 2001-2002 are provided in Appendix A.
The data are presented in tables grouped into three sections defined by the DRI reference value used to assess the nutrient intake. Section A includes usual intake estimates for nutrients for which an EAR has been established, Section B includes usual intake estimates for nutrients for which an AI has been established, and Section C includes estimates of the proportion of the population with usual intakes from food greater than the UL.
4
Section A. Usual Nutrient Intakes from Food, 2001-2002, Compared to Estimated Average Requirements.
This section presents estimated usual daily intakes for those nutrients for which an EAR has been established and for which food composition data are available: vitamin A, vitamin E, thiamin, riboflavin, niacin, vitamin B6, folate, vitamin B12, vitamin C, phosphorus, magnesium, iron, zinc, copper, selenium, carbohydrate, and protein. It also presents percentages of individuals with intakes less than the EAR as estimates of the prevalence of inadequacy. The EAR is the average daily nutrient intake level estimated to meet the requirement of half of the healthy individuals in a particular life stage and gender group. It is used to estimate the prevalence of inadequate intakes in a population group.
For all nutrients except iron, the EAR cut-point method was used to determine the prevalence of inadequacy (7). For iron, one of the assumptions required for use of the cut-point method was not met. Because the distribution of requirements for some of the gender/age groups is not symmetrical, the probability approach was used to determine the prevalence of inadequate iron intake (4,7).
Section B. Usual Nutrient Intakes from Food, 2001-2002, Compared to Adequate Intakes.
This section presents estimated usual daily intakes for those nutrients for which an AI has been established and for which food composition data are available: vitamin K, calcium, potassium, sodium, dietary fiber, linoleic acid, and linolenic acid. The Institute of Medicine establishes an AI for nutrients when insufficient data are available for setting an EAR. The AI is the recommended average daily intake level based on observed or experimentally determined approximations or estimates of nutrient intake by a group (or groups) of apparently healthy people that are assumed to be adequate. This definition is conceptually different from that for an EAR. Mean usual intake at or greater than the AI implies a low prevalence of inadequate intakes, especially when the AI is based on the mean intake of a healthy group. Unlike an EAR, an AI cannot be used to estimate the prevalence of inadequacy in a population. This report presents the percentages of individuals with intakes at or greater than the AI (not less than the AI), but this percentage should not be interpreted as a prevalence of “adequacy”. If at least 50% of the gender/age group has intakes greater than the AI, then the prevalence of inadequacy should be low. If less than 50% have intakes greater than the AI, then no assumption about the prevalence of inadequacy can be made.
Section C. Proportion of Population with Usual Nutrient Intakes from Food, 2001-2002, Greater Than Tolerable Upper Intake
Levels (UL).
This section presents estimates of the proportion of the population with usual intakes from food greater than the ULs for nutrients for which ULs have been established and appropriate food composition data are available: vitamin A, vitamin B6, folate, vitamin C, calcium, phosphorus, iron, zinc, copper, selenium, and sodium. The UL is the maximum level of daily nutrient intake that is likely to
5
pose no risk of adverse health effects for almost all individuals in the general population. As intake increases above the UL, the potential risk of adverse effects may increase.
• For most nutrients, the UL is based on the contribution from food, dietary supplements, and water. However, the tables cover intake from food only.
• For vitamin A and folate, the UL applies to certain forms of the nutrient: preformed vitamin A (retinol) and folic acid (the synthetic form of folate found in fortified foods and in dietary supplements) (2,4). The tables cover intake of these forms from food only.
• For some nutrients, including niacin, magnesium, and vitamin E, the UL applies to intake from dietary supplements and over-the-counter medicines, but not intake from food (1-3). Those nutrients are not included in these tables.
It is important to note that the proportions of the population with intakes greater than the ULs, as shown in these tables, may be underestimated because they do not include nutrient intakes from dietary supplements or water which were not available when these analyses were done.
Method for Estimating Usual Intakes Usual intakes were computed for this report based on the recommendation of the Institute of Medicine regarding the need to determine the distributions of usual nutrient intakes for assessing diets of population groups in relation to the DRIs (10). Nutrient intakes for an individual vary from day-to-day. This variation is referred to as within-individual variation. To determine usual nutrient intake for an individual, a large number of days of intake data is typically needed. It is seldom practical to collect long-term data for each person in a large group such as the sample from WWEIA, NHANES. Therefore, a statistical modeling method that accounts for within-individual variation in nutrient intakes while requiring relatively few days of intake per sampled individual was needed. The statistical method used for estimating usual intake distributions and the proportion below or above defined cutoff values was developed at Iowa State University (10, 11). The software program used to carry out the method was Software for Intake Distribution Estimation (C-SIDE) (12). The usual intake estimation procedure requires a minimum of two 24-hour dietary recalls for at least a representative sample of the individuals in the group in order to separate the total variability in intakes into within- and between-individual components. While
6

WWEIA, NHANES respondents were asked to provide only one 24-hour recall in 2001, respondents were asked to provide two 24-hour recalls in 2002. For this report, the two 24-hour recalls collected from respondents in 2002 were used to estimate the variance components. Working under the assumption that the proportion of total variation attributable to within-individual effects is relatively stable over time, the usual intake distributions were estimated from the entire collection of day 1 intakes from 2001-2002. Evaluation of each population subgroup in relation to the DRIs was carried out using these estimated distributions that reflect only the estimated between-individual variation. The within-individual variance estimates produced for this report from the WWEIA, NHANES 2002 are available on the Food Surveys Research Group website at www.ars.usda.gov/ba/bhnrc/fsrg. Further discussion of the procedures used for estimating usual intake distributions and making the comparison to the DRIs is provided in Appendix B.
7
Selected Results on the Adequacy of American Diets
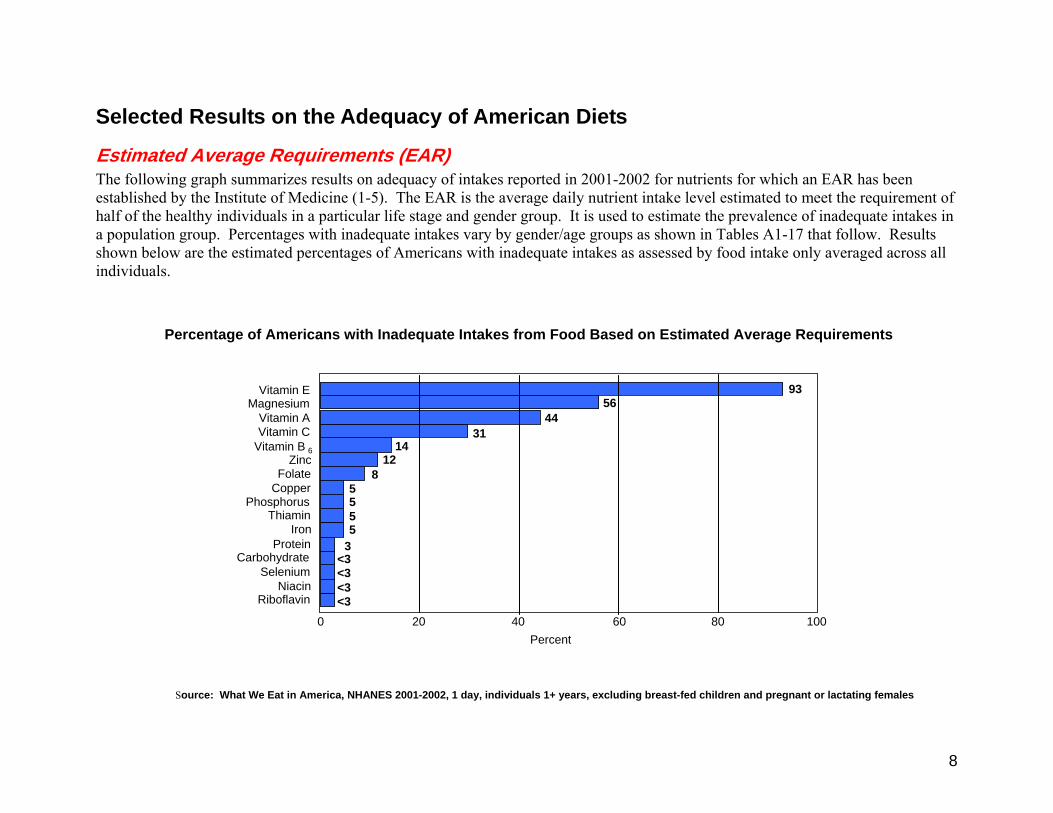
Estimated Average Requirements (EAR) The following graph summarizes results on adequacy of intakes reported in 2001-2002 for nutrients for which an EAR has been established by the Institute of Medicine (1-5). The EAR is the average daily nutrient intake level estimated to meet the requirement of half of the healthy individuals in a particular life stage and gender group. It is used to estimate the prevalence of inadequate intakes in a population group. Percentages with inadequate intakes vary by gender/age groups as shown in Tables A1-17 that follow. Results shown below are the estimated percentages of Americans with inadequate intakes as assessed by food intake only averaged across all individuals.
Percentage of Americans with Inadequate Intakes from Food Based on Estimated Average Requirements
Source: What We Eat in America, NHANES 2001-2002, 1 day, individuals 1+ years, excluding breast-fed children and pregnant or lactating females
5
Percent
Riboflavin Niacin
Selenium Carbohydrate
Protein Iron
Thiamin Phosphorus
Copper Folate
Zinc Vitamin B Vitamin C Vitamin A
Magnesium Vitamin E 93
56 44
3114
128
55
53
<3<3<3<3
6
0 20 40 60 80 100
8
Estimated Average Requirements (EAR) (continued) • In 2001-2002, most Americans had inadequate dietary intakes of vitamin E. The prevalence of inadequacy was also high for
magnesium, vitamin A, and vitamin C with one-third to more than one-half of the population having inadequate intakes from food.
• For some nutrients, intakes were inadequate only for certain segments of the population: vitamin B6 for females over 50 years of age, and zinc for males and females over 70 years of age and females 14-18 years of age.
• Most Americans had adequate intakes from food for carbohydrate, selenium, niacin, and riboflavin.
• Children ages 1-8 years and males age 9 years and older generally had adequate dietary intakes of folate, copper, phosphorus, thiamin, iron, and protein. The proportion of females with adequate intakes was lower. In particular, only about half of females ages 9-18 years had adequate intakes of phosphorus.
Adequate Intakes (AI) The following bullets summarize results on intakes reported in 2001-2002 for selected nutrients for which an Adequate Intake has been established: vitamin K, calcium, potassium, and dietary fiber (1,4-6). The AI for a nutrient is the recommended average daily intake level that is assumed to be adequate. It is important to note that, unlike an EAR, an AI cannot be used to estimate the prevalence of inadequacy in a population. Further, the percentages of the population above the AI may underestimate the true percentage with adequate intakes. Percentages with intakes above the AI vary by gender-age groups as shown in Tables B18-20 and B22 that follow. The summary below is based on the estimated percentage of Americans with intakes from food only at or greater than the AI averaged across all individuals.
• For vitamin K and calcium, just over 1 in 4 Americans met their AI. For calcium, females were even less likely than males to have intakes above their AI.
• For dietary fiber and potassium, less than 5% had intakes above their AI.
9
List of Tables and Appendices Section A. Usual Nutrient Intakes from Food, 2001-2002, Compared to Estimated Average Requirements Page Table A 1. Vitamin A (RAE)...................................................................................................................................................13 Table A 2 Vitamin E (mg α-tocopherol) .................................................................................................................. ..............14Table A 3. Thiamin (mg) .........................................................................................................................................................15 Table A 4. Riboflavin (mg) ......................................................................................................................................................16Table A 5. Niacin (mg) ............................................................................................................................................................17 Table A 6. Vitamin B6 (mg)......................................................................................................................................................18 Table A 7. Folate (DFE) ...........................................................................................................................................................19Table A 8. Vitamin B12 (µg) .....................................................................................................................................................20 Table A 9.1 Vitamin C (mg) .......................................................................................................................................................21 Table A 9.2 Vitamin C (mg), Adults 20 and older by smoking status .......................................................................................22Table A 10. Phosphorus (mg) .....................................................................................................................................................23Table A 11. Magnesium (mg).....................................................................................................................................................24Table A 12. Iron (mg) .................................................................................................................................................................25Table A 13. Zinc (mg) ................................................................................................................................................................26 Table A 14. Copper (mg) ............................................................................................................................................................27Table A 15. Selenium (µg) .........................................................................................................................................................28Table A 16. Carbohydrate (g) .....................................................................................................................................................29 Table A 17. Protein (g/kg body weight) .....................................................................................................................................30
Section B. Usual Nutrient Intakes from Food, 2001-2002, Compared to Adequate Intakes Table B 18. Vitamin K (µg)........................................................................................................................................................32 Table B 19. Calcium (mg) .........................................................................................................................................................33Table B 20. Potassium (mg) .......................................................................................................................................................34Table B 21. Sodium (mg) ...........................................................................................................................................................35Table B 22. Dietary Fiber (g) .....................................................................................................................................................36Table B 23. Linoleic Acid 18:2 (g).............................................................................................................................................37 Table B 24. Linolenic Acid 18:3 (g) ..........................................................................................................................................38
10
Section C. Proportion of Population with Usual Nutrient Intakes from Food Only, 2001-2002, Greater than Tolerable Upper Intake Levels Page
Table C 25.1 Vitamin A (retinol), Folate (folic acid)...................................................................................................................40Table C 25.2 Vitamin B6 , Vitamin C...........................................................................................................................................41Table C 25.3 Calcium, Phosphorus, Iron, Zinc ............................................................................................................................42Table C 25.4 Copper, Selenium, Sodium .....................................................................................................................................43
Appendixes Appendix A. Sample Counts and Weighted Population Estimates, What We Eat In America, NHANES 2001-2002..............44 Appendix B. Procedure for Usual Nutrient Intake Estimation.....................................................................................................45 Appendix C. Explanation of Table Footnotes ..............................................................................................................................54 Appendix D. References...............................................................................................................................................................55
11
Section A. Tables
Usual Nutrient Intakes from Food, 2001-2002, Compared to Estimated Average Requirements Page Table A 1. Vitamin A (RAE)...................................................................................................................................................13Table A 2. Vitamin E (mg α-tocopherol) .................................................................................................................................14Table A 3. Thiamin (mg) ..........................................................................................................................................................15 Table A 4. Riboflavin (mg).......................................................................................................................................................16 Table A 5. Niacin (mg) .............................................................................................................................................................17 Table A 6. Vitamin B6 (mg)......................................................................................................................................................18 Table A 7. Folate (DFE) ...........................................................................................................................................................19 Table A 8. Vitamin B12 (µg) .....................................................................................................................................................20 Table A 9.1 Vitamin C (mg) .......................................................................................................................................................21 Table A 9.2 Vitamin C (mg), Adults 20 and older by smoking status .......................................................................................22 Table A 10. Phosphorus (mg) .....................................................................................................................................................23 Table A 11. Magnesium (mg).....................................................................................................................................................24 Table A 12. Iron (mg) .................................................................................................................................................................25 Table A 13. Zinc (mg) ................................................................................................................................................................26 Table A 14. Copper (mg) ............................................................................................................................................................27 Table A 15. Selenium (µg) .........................................................................................................................................................28 Table A 16. Carbohydrate (g) .....................................................................................................................................................29 Table A 17. Protein (g/kg body weight) .....................................................................................................................................30
12
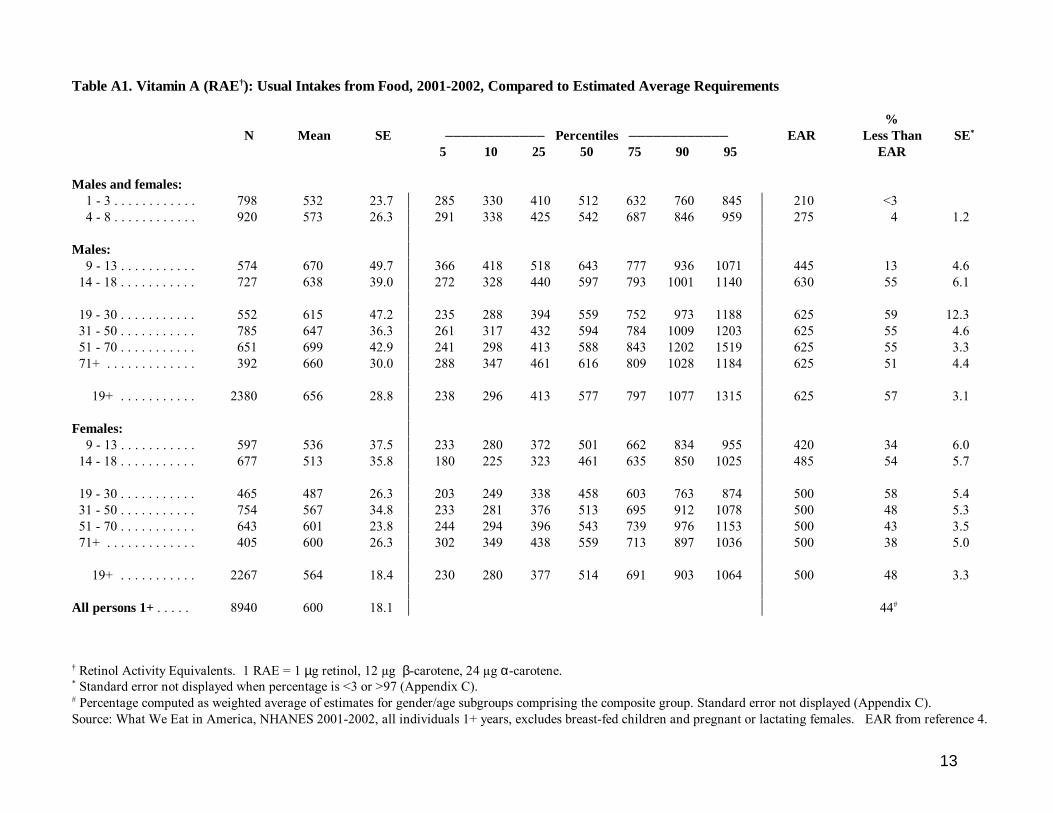
Table A1. Vitamin A (RAE†): Usual Intakes from Food, 2001-2002, Compared to Estimated Average Requirements
%N Mean SE )))))))))))) Percentiles )))))))))))) EAR Less Than SE*
5 10 25 50 75 90 95 EAR
Males and females: 1 - 3 . . . . . . . . . . . . 798 532 23.7 * 285 330 410 512 632 760 845 * 210 <3 4 - 8 . . . . . . . . . . . . 920 573 26.3 * 291 338 425 542 687 846 959 * 275 4 1.2
* *
Males: * *
9 - 13 . . . . . . . . . . . 574 670 49.7 * 366 418 518 643 777 936 1071 * 445 13 4.6 14 - 18 . . . . . . . . . . . 727 638 39.0 * 272 328 440 597 793 1001 1140 * 630 55 6.1
* *
19 - 30 . . . . . . . . . . . 552 615 47.2 * 235 288 394 559 752 973 1188 * 625 59 12.3 31 - 50 . . . . . . . . . . . 785 647 36.3 * 261 317 432 594 784 1009 1203 * 625 55 4.6 51 - 70 . . . . . . . . . . . 651 699 42.9 * 241 298 413 588 843 1202 1519 * 625 55 3.3 71+ . . . . . . . . . . . . . 392 660 30.0 * 288 347 461 616 809 1028 1184 * 625 51 4.4
* *
19+ . . . . . . . . . . . 2380 656 28.8 * 238 296 413 577 797 1077 1315 * 625 57 3.1* *
Females: * *
9 - 13 . . . . . . . . . . . 597 536 37.5 * 233 280 372 501 662 834 955 * 420 34 6.0 14 - 18 . . . . . . . . . . . 677 513 35.8 * 180 225 323 461 635 850 1025 * 485 54 5.7
* *
19 - 30 . . . . . . . . . . . 465 487 26.3 * 203 249 338 458 603 763 874 * 500 58 5.4 31 - 50 . . . . . . . . . . . 754 567 34.8 * 233 281 376 513 695 912 1078 * 500 48 5.3 51 - 70 . . . . . . . . . . . 643 601 23.8 * 244 294 396 543 739 976 1153 * 500 43 3.5 71+ . . . . . . . . . . . . . 405 600 26.3 * 302 349 438 559 713 897 1036 * 500 38 5.0
* *
19+ . . . . . . . . . . . 2267 564 18.4 * 230 280 377 514 691 903 1064 * 500 48 3.3* *
All persons 1+ . . . . . 8940 600 18.1 * * 44#
† Retinol Activity Equivalents. 1 RAE = 1 µg retinol, 12 µg β-carotene, 24 µg α-carotene.* Standard error not displayed when percentage is <3 or >97 (Appendix C).# Percentage computed as weighted average of estimates for gender/age subgroups comprising the composite group. Standard error not displayed (Appendix C).Source: What We Eat in America, NHANES 2001-2002, all individuals 1+ years, excludes breast-fed children and pregnant or lactating females. EAR from reference 4.
13

Table A2. Vitamin E (mg α-tocopherol): Usual Intakes from Food, 2001-2002, Compared to Estimated Average Requirements
%N Mean SE )))))))))))) Percentiles )))))))))))) EAR Less Than SE*
5 10 25 50 75 90 95 EAR
Males and females: 1 - 3 . . . . . . . . . . . . 798 4.0 0.14 * 2.1 2.4 3.0 3.7 4.7 5.8 6.6 * 5 80 3.3 4 - 8 . . . . . . . . . . . . 920 5.0 0.17 * 3.2 3.5 4.1 4.8 5.7 6.7 7.4 * 6 80 4.1
* *
Males: * *
9 - 13 . . . . . . . . . . . 574 6.0 0.23 * 4.0 4.4 5.1 5.9 6.8 7.8 8.5 * 9 97 1.8 14 - 18 . . . . . . . . . . . 727 7.3 0.31 * 4.5 4.9 5.9 7.0 8.4 10.0 11.1 * 12 >97
* *
19 - 30 . . . . . . . . . . . 552 8.1 0.42 * 4.1 4.8 6.0 7.6 9.8 12.1 13.8 * 12 89 4.4 31 - 50 . . . . . . . . . . . 785 8.5 0.37 * 4.9 5.5 6.6 8.1 10.1 12.1 13.5 * 12 90 3.5 51 - 70 . . . . . . . . . . . 651 7.9 0.36 * 3.8 4.4 5.6 7.3 9.5 12.1 14.1 * 12 90 2.6 71+ . . . . . . . . . . . . . 392 6.9 0.33 * 3.3 3.8 4.8 6.3 8.3 10.8 12.7 * 12 94 1.9
* *
19+ . . . . . . . . . . . 2380 8.2 0.22 * 4.1 4.7 5.9 7.6 9.8 12.3 14.2 * 12 89 1.8* *
Females: * *
9 - 13 . . . . . . . . . . . 597 5.6 0.35 * 3.3 3.6 4.3 5.2 6.4 7.8 8.9 * 9 95 3.6 14 - 18 . . . . . . . . . . . 677 5.6 0.17 * 3.1 3.5 4.3 5.3 6.6 7.9 8.8 * 12 >97
* *
19 - 30 . . . . . . . . . . . 465 6.2 0.30 * 2.8 3.4 4.4 5.8 7.5 9.4 10.8 * 12 >97 31 - 50 . . . . . . . . . . . 754 6.4 0.28 * 3.3 3.7 4.7 6.0 7.6 9.5 10.9 * 12 >97 51 - 70 . . . . . . . . . . . 643 6.5 0.31 * 3.2 3.7 4.7 6.0 7.8 9.8 11.3 * 12 96 1.4 71+ . . . . . . . . . . . . . 405 5.6 0.31 * 2.9 3.3 4.0 5.1 6.5 8.3 9.8 * 12 >97
* *
19+ . . . . . . . . . . . 2267 6.3 0.20 * 3.1 3.6 4.5 5.8 7.5 9.5 11.0 * 12 97 0.8* *
All persons 1+ . . . . . 8940 6.7 0.14 * * 93#
* Standard error not displayed when percentage is <3 or >97 (Appendix C).# Percentage computed as weighted average of estimates for gender/age subgroups comprising the composite group. Standard error not displayed (Appendix C).Source: What We Eat in America, NHANES 2001-2002, all individuals 1+ years, excludes breast-fed children and pregnant or lactating females. EAR from reference 3.
14
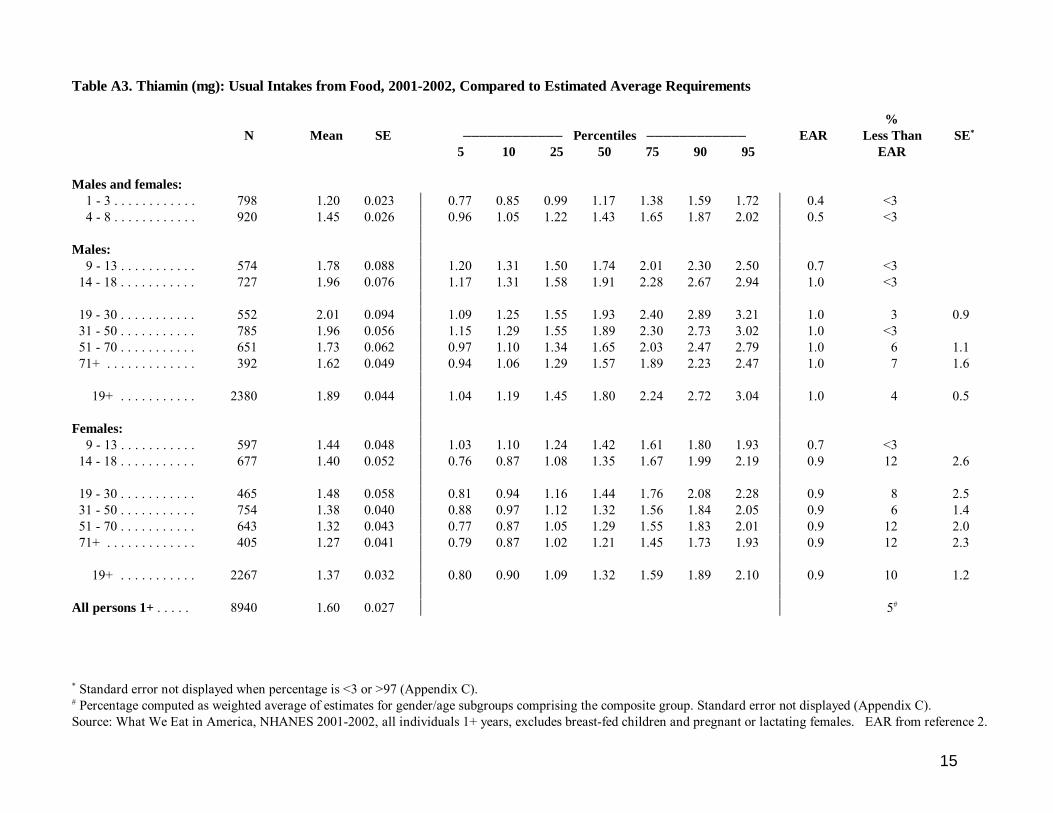
Table A3. Thiamin (mg): Usual Intakes from Food, 2001-2002, Compared to Estimated Average Requirements
%N Mean SE )))))))))))) Percentiles )))))))))))) EAR Less Than SE*
5 10 25 50 75 90 95 EAR
Males and females: 1 - 3 . . . . . . . . . . . . 798 1.20 0.023 * 0.77 0.85 0.99 1.17 1.38 1.59 1.72 * 0.4 <3 4 - 8 . . . . . . . . . . . . 920 1.45 0.026 * 0.96 1.05 1.22 1.43 1.65 1.87 2.02 * 0.5 <3
* *
Males: * *
9 - 13 . . . . . . . . . . . 574 1.78 0.088 * 1.20 1.31 1.50 1.74 2.01 2.30 2.50 * 0.7 <3 14 - 18 . . . . . . . . . . . 727 1.96 0.076 * 1.17 1.31 1.58 1.91 2.28 2.67 2.94 * 1.0 <3
* *
19 - 30 . . . . . . . . . . . 552 2.01 0.094 * 1.09 1.25 1.55 1.93 2.40 2.89 3.21 * 1.0 3 0.9 31 - 50 . . . . . . . . . . . 785 1.96 0.056 * 1.15 1.29 1.55 1.89 2.30 2.73 3.02 * 1.0 <3 51 - 70 . . . . . . . . . . . 651 1.73 0.062 * 0.97 1.10 1.34 1.65 2.03 2.47 2.79 * 1.0 6 1.1 71+ . . . . . . . . . . . . . 392 1.62 0.049 * 0.94 1.06 1.29 1.57 1.89 2.23 2.47 * 1.0 7 1.6
* *
19+ . . . . . . . . . . . 2380 1.89 0.044 * 1.04 1.19 1.45 1.80 2.24 2.72 3.04 * 1.0 4 0.5* *
Females: * *
9 - 13 . . . . . . . . . . . 597 1.44 0.048 * 1.03 1.10 1.24 1.42 1.61 1.80 1.93 * 0.7 <3 14 - 18 . . . . . . . . . . . 677 1.40 0.052 * 0.76 0.87 1.08 1.35 1.67 1.99 2.19 * 0.9 12 2.6
* *
19 - 30 . . . . . . . . . . . 465 1.48 0.058 * 0.81 0.94 1.16 1.44 1.76 2.08 2.28 * 0.9 8 2.5 31 - 50 . . . . . . . . . . . 754 1.38 0.040 * 0.88 0.97 1.12 1.32 1.56 1.84 2.05 * 0.9 6 1.4 51 - 70 . . . . . . . . . . . 643 1.32 0.043 * 0.77 0.87 1.05 1.29 1.55 1.83 2.01 * 0.9 12 2.0 71+ . . . . . . . . . . . . . 405 1.27 0.041 * 0.79 0.87 1.02 1.21 1.45 1.73 1.93 * 0.9 12 2.3
* *
19+ . . . . . . . . . . . 2267 1.37 0.032 * 0.80 0.90 1.09 1.32 1.59 1.89 2.10 * 0.9 10 1.2* *
All persons 1+ . . . . . 8940 1.60 0.027 * * 5#
* Standard error not displayed when percentage is <3 or >97 (Appendix C).# Percentage computed as weighted average of estimates for gender/age subgroups comprising the composite group. Standard error not displayed (Appendix C).Source: What We Eat in America, NHANES 2001-2002, all individuals 1+ years, excludes breast-fed children and pregnant or lactating females. EAR from reference 2.
15

Table A4. Riboflavin (mg): Usual Intakes from Food, 2001-2002, Compared to Estimated Average Requirements
%N Mean SE )))))))))))) Percentiles )))))))))))) EAR Less Than SE*
5 10 25 50 75 90 95 EAR
Males and females: 1 - 3 . . . . . . . . . . . . 798 1.97 0.042 * 1.18 1.33 1.61 1.94 2.29 2.64 2.89 * 0.4 <3 4 - 8 . . . . . . . . . . . . 920 2.10 0.051 * 1.27 1.43 1.71 2.05 2.43 2.83 3.10 * 0.5 <3
* *
Males: * *
9 - 13 . . . . . . . . . . . 574 2.51 0.131 * 1.53 1.70 2.02 2.43 2.91 3.41 3.76 * 0.8 <3 14 - 18 . . . . . . . . . . . 727 2.57 0.106 * 1.44 1.63 1.99 2.46 3.03 3.64 4.06 * 1.1 <3
* *
19 - 30 . . . . . . . . . . . 552 2.55 0.117 * 1.36 1.56 1.94 2.44 3.03 3.67 4.12 * 1.1 <3 31 - 50 . . . . . . . . . . . 785 2.67 0.072 * 1.51 1.72 2.11 2.59 3.14 3.72 4.11 * 1.1 <3 51 - 70 . . . . . . . . . . . 651 2.44 0.067 * 1.29 1.48 1.84 2.31 2.87 3.52 4.02 * 1.1 <3 71+ . . . . . . . . . . . . . 392 2.22 0.067 * 1.14 1.32 1.66 2.11 2.66 3.25 3.67 * 1.1 4 1.1
* *
19+ . . . . . . . . . . . 2380 2.55 0.057 * 1.34 1.55 1.94 2.44 3.01 3.66 4.14 * 1.1 <3* *
Females: * *
9 - 13 . . . . . . . . . . . 597 1.94 0.072 * 1.21 1.34 1.58 1.89 2.25 2.61 2.83 * 0.8 <3 14 - 18 . . . . . . . . . . . 677 1.80 0.079 * 0.86 1.02 1.32 1.72 2.19 2.66 2.98 * 0.9 6 1.5
* *
19 - 30 . . . . . . . . . . . 465 1.80 0.071 * 0.89 1.06 1.36 1.75 2.19 2.62 2.90 * 0.9 5 1.5 31 - 50 . . . . . . . . . . . 754 1.92 0.052 * 1.12 1.26 1.51 1.84 2.23 2.66 2.97 * 0.9 <3 51 - 70 . . . . . . . . . . . 643 1.86 0.042 * 1.05 1.20 1.48 1.82 2.19 2.57 2.80 * 0.9 <3 71+ . . . . . . . . . . . . . 405 1.74 0.052 * 0.98 1.11 1.35 1.65 2.02 2.47 2.81 * 0.9 <3
* *
19+ . . . . . . . . . . . 2267 1.86 0.040 * 1.02 1.17 1.44 1.79 2.19 2.62 2.92 * 0.9 <3* *
All persons 1+ . . . . . 8940 2.18 0.038 * * <3#
* Standard error not displayed when percentage is <3 or >97 (Appendix C).# Percentage computed as weighted average of estimates for gender/age subgroups comprising the composite group. Standard error not displayed (Appendix C).Source: What We Eat in America, NHANES 2001-2002, all individuals 1+ years, excludes breast-fed children and pregnant or lactating females. EAR from reference 2.
16
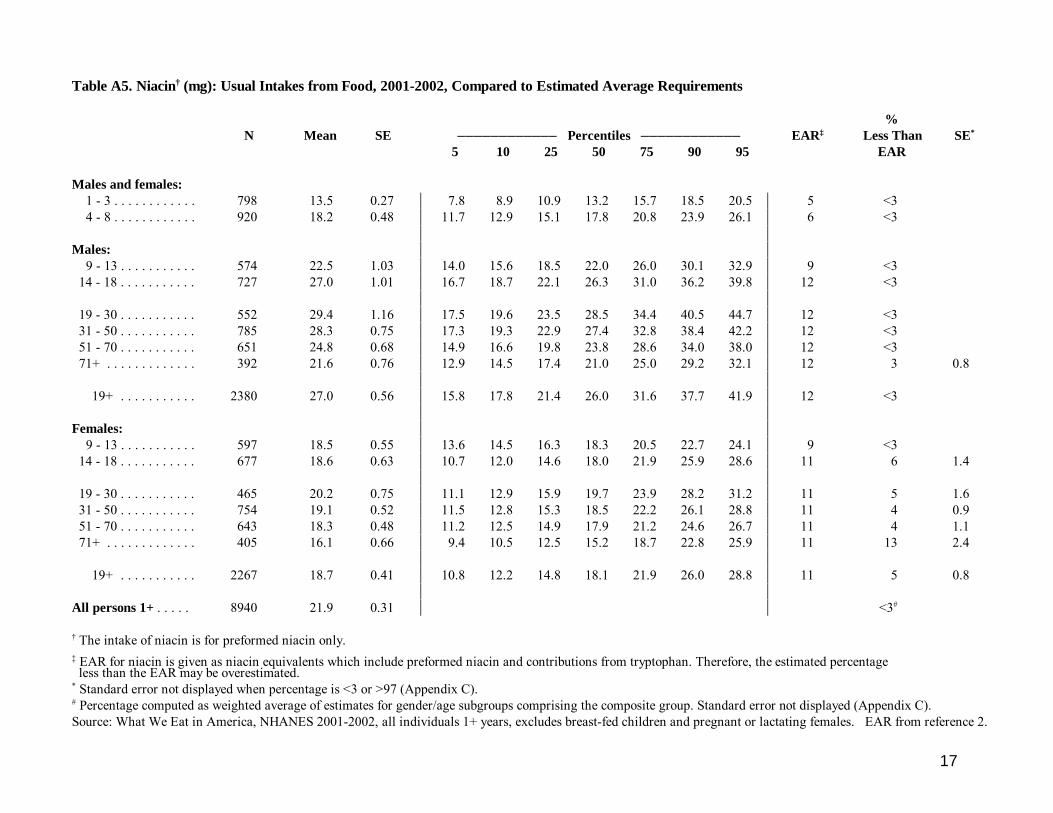
Table A5. Niacin† (mg): Usual Intakes from Food, 2001-2002, Compared to Estimated Average Requirements
%N Mean SE )))))))))))) Percentiles )))))))))))) EAR‡ Less Than SE*
5 10 25 50 75 90 95 EAR
Males and females: 1 - 3 . . . . . . . . . . . . 798 13.5 0.27 * 7.8 8.9 10.9 13.2 15.7 18.5 20.5 * 5 <3 4 - 8 . . . . . . . . . . . . 920 18.2 0.48 * 11.7 12.9 15.1 17.8 20.8 23.9 26.1 * 6 <3
* *
Males: * *
9 - 13 . . . . . . . . . . . 574 22.5 1.03 * 14.0 15.6 18.5 22.0 26.0 30.1 32.9 * 9 <3 14 - 18 . . . . . . . . . . . 727 27.0 1.01 * 16.7 18.7 22.1 26.3 31.0 36.2 39.8 * 12 <3
* *
19 - 30 . . . . . . . . . . . 552 29.4 1.16 * 17.5 19.6 23.5 28.5 34.4 40.5 44.7 * 12 <3 31 - 50 . . . . . . . . . . . 785 28.3 0.75 * 17.3 19.3 22.9 27.4 32.8 38.4 42.2 * 12 <3 51 - 70 . . . . . . . . . . . 651 24.8 0.68 * 14.9 16.6 19.8 23.8 28.6 34.0 38.0 * 12 <3 71+ . . . . . . . . . . . . . 392 21.6 0.76 * 12.9 14.5 17.4 21.0 25.0 29.2 32.1 * 12 3 0.8
* *
19+ . . . . . . . . . . . 2380 27.0 0.56 * 15.8 17.8 21.4 26.0 31.6 37.7 41.9 * 12 <3* *
Females: * *
9 - 13 . . . . . . . . . . . 597 18.5 0.55 * 13.6 14.5 16.3 18.3 20.5 22.7 24.1 * 9 <3 14 - 18 . . . . . . . . . . . 677 18.6 0.63 * 10.7 12.0 14.6 18.0 21.9 25.9 28.6 * 11 6 1.4
* *
19 - 30 . . . . . . . . . . . 465 20.2 0.75 * 11.1 12.9 15.9 19.7 23.9 28.2 31.2 * 11 5 1.6 31 - 50 . . . . . . . . . . . 754 19.1 0.52 * 11.5 12.8 15.3 18.5 22.2 26.1 28.8 * 11 4 0.9 51 - 70 . . . . . . . . . . . 643 18.3 0.48 * 11.2 12.5 14.9 17.9 21.2 24.6 26.7 * 11 4 1.1 71+ . . . . . . . . . . . . . 405 16.1 0.66 * 9.4 10.5 12.5 15.2 18.7 22.8 25.9 * 11 13 2.4
* *
19+ . . . . . . . . . . . 2267 18.7 0.41 * 10.8 12.2 14.8 18.1 21.9 26.0 28.8 * 11 5 0.8* *
All persons 1+ . . . . . 8940 21.9 0.31 * * <3#
† The intake of niacin is for preformed niacin only.‡ EAR for niacin is given as niacin equivalents which include preformed niacin and contributions from tryptophan. Therefore, the estimated percentage less than the EAR may be overestimated.* Standard error not displayed when percentage is <3 or >97 (Appendix C).# Percentage computed as weighted average of estimates for gender/age subgroups comprising the composite group. Standard error not displayed (Appendix C).Source: What We Eat in America, NHANES 2001-2002, all individuals 1+ years, excludes breast-fed children and pregnant or lactating females. EAR from reference 2.
17

Table A6. Vitamin B6 (mg): Usual Intakes from Food, 2001-2002, Compared to Estimated Average Requirements
%N Mean SE )))))))))))) Percentiles )))))))))))) EAR Less Than SE*
5 10 25 50 75 90 95 EAR
Males and females: 1 - 3 . . . . . . . . . . . . 798 1.34 0.039 * 0.79 0.89 1.07 1.30 1.57 1.84 2.02 * 0.4 <3 4 - 8 . . . . . . . . . . . . 920 1.50 0.048 * 0.87 0.98 1.19 1.46 1.76 2.06 2.27 * 0.5 <3
* *
Males: * *
9 - 13 . . . . . . . . . . . 574 1.81 0.105 * 1.10 1.23 1.46 1.76 2.10 2.46 2.70 * 0.8 <3 14 - 18 . . . . . . . . . . . 727 2.17 0.097 * 1.27 1.42 1.70 2.08 2.53 3.04 3.40 * 1.1 <3
* *
19 - 30 . . . . . . . . . . . 552 2.36 0.127 * 1.24 1.42 1.76 2.24 2.83 3.44 3.85 * 1.1 <3 31 - 50 . . . . . . . . . . . 785 2.31 0.071 * 1.30 1.47 1.79 2.21 2.71 3.26 3.67 * 1.1 <3 51 - 70 . . . . . . . . . . . 651 2.09 0.063 * 1.10 1.27 1.58 2.00 2.50 3.02 3.38 * 1.4 16 2.2 71+ . . . . . . . . . . . . . 392 1.96 0.074 * 0.94 1.11 1.43 1.83 2.32 2.92 3.39 * 1.4 23 3.2
* *
19+ . . . . . . . . . . . 2380 2.23 0.056 * 1.17 1.35 1.68 2.11 2.65 3.25 3.68 * 7#
* *
Females: * *
9 - 13 . . . . . . . . . . . 597 1.52 0.061 * 0.89 1.00 1.21 1.48 1.78 2.09 2.29 * 0.8 <3 14 - 18 . . . . . . . . . . . 677 1.48 0.049 * 0.78 0.90 1.11 1.41 1.78 2.16 2.41 * 1.0 16 2.7
* *
19 - 30 . . . . . . . . . . . 465 1.54 0.064 * 0.73 0.87 1.13 1.47 1.86 2.24 2.58 * 1.1 23 3.5 31 - 50 . . . . . . . . . . . 754 1.53 0.053 * 0.82 0.93 1.16 1.45 1.81 2.21 2.50 * 1.1 21 3.0 51 - 70 . . . . . . . . . . . 643 1.56 0.045 * 0.85 0.98 1.21 1.50 1.84 2.21 2.46 * 1.3 33 3.4 71+ . . . . . . . . . . . . . 405 1.44 0.061 * 0.73 0.84 1.04 1.32 1.69 2.17 2.56 * 1.3 49 4.0
* *
19+ . . . . . . . . . . . 2267 1.53 0.036 * 0.79 0.92 1.15 1.45 1.81 2.22 2.51 * 28#
* *
All persons 1+ . . . . . 8940 1.81 0.034 * * 14#
* Standard error not displayed when percentage is <3 or >97 (Appendix C).# Percentage computed as weighted average of estimates for gender/age subgroups comprising the composite group. Standard error not displayed (Appendix C).Source: What We Eat in America, NHANES 2001-2002, all individuals 1+ years, excludes breast-fed children and pregnant or lactating females. EAR from reference 2.
18

Table A7. Folate (DFE†): Usual Intakes from Food, 2001-2002, Compared to Estimated Average Requirements
%N Mean SE )))))))))))) Percentiles )))))))))))) EAR Less Than SE*
5 10 25 50 75 90 95 EAR
Males and females: 1 - 3 . . . . . . . . . . . . 798 416 12.4 * 221 254 315 369 493 602 679 * 120 <3 4 - 8 . . . . . . . . . . . . 920 528 18.8 * 308 343 411 501 615 745 840 * 160 <3
* *
Males: * *
9 - 13 . . . . . . . . . . . 574 644 33.4 * 380 424 509 619 752 895 996 * 250 <3 14 - 18 . . . . . . . . . . . 727 683 32.4 * 351 405 508 647 817 1004 1135 * 330 4 1.2
* *
19 - 30 . . . . . . . . . . . 552 696 32.7 * 312 366 476 641 855 1098 1273 * 320 6 1.2 31 - 50 . . . . . . . . . . . 785 655 24.2 * 356 403 493 616 773 955 1088 * 320 <3 51 - 70 . . . . . . . . . . . 651 576 20.2 * 300 342 426 537 684 868 982 * 320 7 1.0 71+ . . . . . . . . . . . . . 392 556 24.3 * 269 312 399 515 658 839 986 * 320 11 2.3
* *
19+ . . . . . . . . . . . 2380 636 17.7 * 313 361 455 586 762 972 1126 * 320 6 0.7* *
Females‡: * *
9 - 13 . . . . . . . . . . . 597 512 25.1 * 359 385 435 501 577 652 700 * 250 <3 14 - 18 . . . . . . . . . . . 677 500 41.0 * 242 281 360 473 607 751 851 * 330 19 4.8
* *
19 - 30 . . . . . . . . . . . 465 519 27.1 * 245 291 376 491 636 786 882 * 320 14 3.3 31 - 50 . . . . . . . . . . . 754 472 21.3 * 259 293 357 444 553 684 783 * 320 16 2.8 51 - 70 . . . . . . . . . . . 643 482 21.3 * 264 300 369 461 571 691 773 * 320 14 2.5 71+ . . . . . . . . . . . . . 405 452 19.3 * 242 272 333 418 532 671 777 * 320 21 3.2
* *
19+ . . . . . . . . . . . 2267 483 16.9 * 251 288 359 455 575 711 810 * 320 16 1.9* *
All persons 1+ . . . . . 8940 554 13.0 * * 8#
† Dietary Folate Equivalents. 1 DFE = 1 µg food folate = 0.6 µg of folic acid from fortified food.‡ It is recommended that all women capable of becoming pregnant consume 400 µg from supplements or fortified foods in addition to intake of food folate from a varied diet (2).* Standard error not displayed when percentage is <3 or >97 (Appendix C).# Percentage computed as weighted average of estimates for gender/age subgroups comprising the composite group. Standard error not displayed (Appendix C).Source: What We Eat in America, NHANES 2001-2002, all individuals 1+ years, excludes breast-fed children and pregnant or lactating females. EAR from reference 2.
19
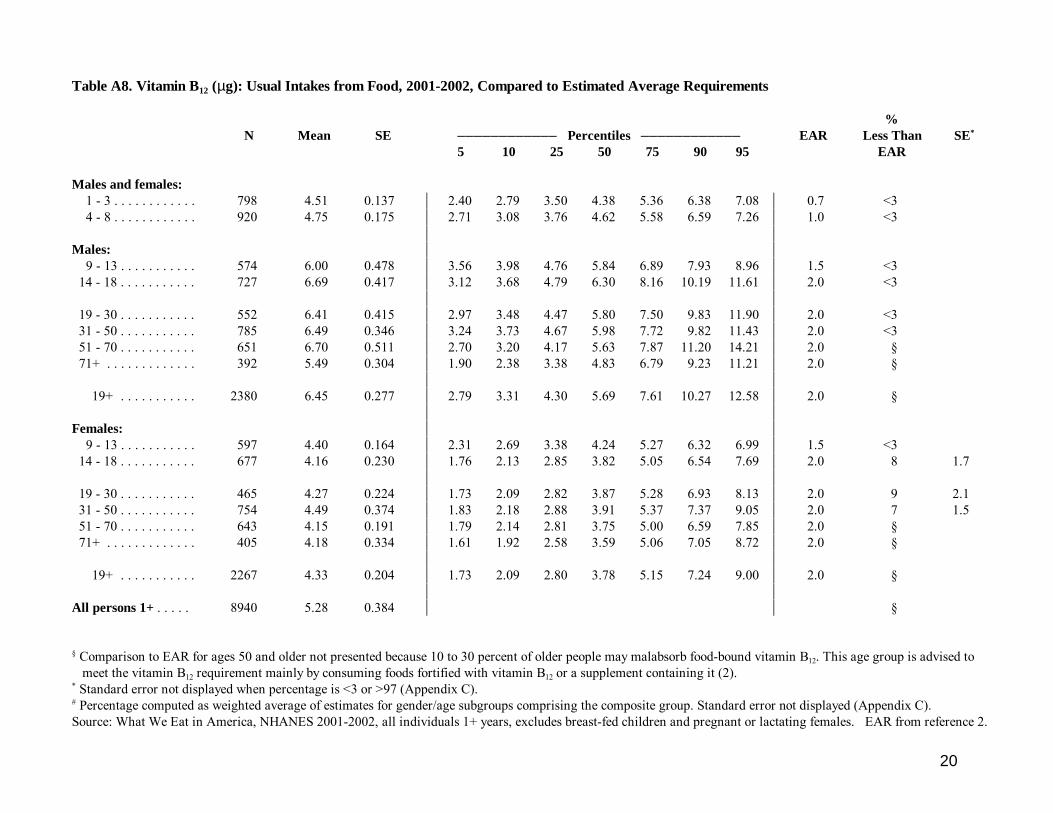
Table A8. Vitamin B12 (µg): Usual Intakes from Food, 2001-2002, Compared to Estimated Average Requirements
%N Mean SE )))))))))))) Percentiles )))))))))))) EAR Less Than SE*
5 10 25 50 75 90 95 EAR
Males and females: 1 - 3 . . . . . . . . . . . . 798 4.51 0.137 * 2.40 2.79 3.50 4.38 5.36 6.38 7.08 * 0.7 <3 4 - 8 . . . . . . . . . . . . 920 4.75 0.175 * 2.71 3.08 3.76 4.62 5.58 6.59 7.26 * 1.0 <3
* *
Males: * *
9 - 13 . . . . . . . . . . . 574 6.00 0.478 * 3.56 3.98 4.76 5.84 6.89 7.93 8.96 * 1.5 <3 14 - 18 . . . . . . . . . . . 727 6.69 0.417 * 3.12 3.68 4.79 6.30 8.16 10.19 11.61 * 2.0 <3
* *
19 - 30 . . . . . . . . . . . 552 6.41 0.415 * 2.97 3.48 4.47 5.80 7.50 9.83 11.90 * 2.0 <3 31 - 50 . . . . . . . . . . . 785 6.49 0.346 * 3.24 3.73 4.67 5.98 7.72 9.82 11.43 * 2.0 <3 51 - 70 . . . . . . . . . . . 651 6.70 0.511 * 2.70 3.20 4.17 5.63 7.87 11.20 14.21 * 2.0 § 71+ . . . . . . . . . . . . . 392 5.49 0.304 * 1.90 2.38 3.38 4.83 6.79 9.23 11.21 * 2.0 §
* *
19+ . . . . . . . . . . . 2380 6.45 0.277 * 2.79 3.31 4.30 5.69 7.61 10.27 12.58 * 2.0 §* *
Females: * *
9 - 13 . . . . . . . . . . . 597 4.40 0.164 * 2.31 2.69 3.38 4.24 5.27 6.32 6.99 * 1.5 <3 14 - 18 . . . . . . . . . . . 677 4.16 0.230 * 1.76 2.13 2.85 3.82 5.05 6.54 7.69 * 2.0 8 1.7
* *
19 - 30 . . . . . . . . . . . 465 4.27 0.224 * 1.73 2.09 2.82 3.87 5.28 6.93 8.13 * 2.0 9 2.1 31 - 50 . . . . . . . . . . . 754 4.49 0.374 * 1.83 2.18 2.88 3.91 5.37 7.37 9.05 * 2.0 7 1.5 51 - 70 . . . . . . . . . . . 643 4.15 0.191 * 1.79 2.14 2.81 3.75 5.00 6.59 7.85 * 2.0 § 71+ . . . . . . . . . . . . . 405 4.18 0.334 * 1.61 1.92 2.58 3.59 5.06 7.05 8.72 * 2.0 §
* *
19+ . . . . . . . . . . . 2267 4.33 0.204 * 1.73 2.09 2.80 3.78 5.15 7.24 9.00 * 2.0 §* *
All persons 1+ . . . . . 8940 5.28 0.384 * * §
§ Comparison to EAR for ages 50 and older not presented because 10 to 30 percent of older people may malabsorb food-bound vitamin B12. This age group is advised to meet the vitamin B12 requirement mainly by consuming foods fortified with vitamin B12 or a supplement containing it (2).* Standard error not displayed when percentage is <3 or >97 (Appendix C).# Percentage computed as weighted average of estimates for gender/age subgroups comprising the composite group. Standard error not displayed (Appendix C).Source: What We Eat in America, NHANES 2001-2002, all individuals 1+ years, excludes breast-fed children and pregnant or lactating females. EAR from reference 2.
20

Table A9.1. Vitamin C (mg): Usual Intakes from Food, 2001-2002, Compared to Estimated Average Requirements
%N Mean SE )))))))))))) Percentiles )))))))))))) EAR† Less Than SE*
5 10 25 50 75 90 95 EAR
Males and females: 1 - 3 . . . . . . . . . . . . 798 92.1 3.87 * 33 41 59 84 116 153 180 * 13 <3 4 - 8 . . . . . . . . . . . . 920 80.7 4.27 * 29 36 51 74 103 134 156 * 22 <3
* *
Males: * *
9 - 13 . . . . . . . . . . . 574 80.2 5.77 * 35 41 55 75 100 126 144 * 39 8 2.9 14 - 18 . . . . . . . . . . . 727 100.0 8.53 * 36 44 62 89 127 171 201 * 63 26 5.8
* *
19 - 30 . . . . . . . . . . . 552 116.2 14.10 * 28 37 58 97 153 222 271 * 75 37 5.9 31 - 50 . . . . . . . . . . . 785 102.8 7.78 * 29 38 57 89 133 186 225 * 75 40 4.7 51 - 70 . . . . . . . . . . . 651 101.8 5.22 * 29 38 58 90 132 181 216 * 75 39 3.5 71+ . . . . . . . . . . . . . 392 93.4 5.63 * 25 34 54 84 122 164 193 * 75 42 4.7
* *
19+ . . . . . . . . . . . 2380 105.2 36.87 * 27 36 56 89 136 194 238 * 75 40 9.7* *
Females: * *
9 - 13 . . . . . . . . . . . 597 81.0 6.09 * 33 40 54 74 102 132 152 * 39 9 2.5 14 - 18 . . . . . . . . . . . 677 75.6 6.40 * 20 27 41 64 97 139 170 * 56 42 4.8
* *
19 - 30 . . . . . . . . . . . 465 82.3 6.67 * 24 31 46 70 105 148 180 * 60 40 3.9 31 - 50 . . . . . . . . . . . 754 77.0 4.88 * 26 32 47 68 98 133 158 * 60 41 4.3 51 - 70 . . . . . . . . . . . 643 93.7 4.80 * 29 38 56 84 121 162 192 * 60 29 3.3 71+ . . . . . . . . . . . . . 405 81.6 4.24 * 20 27 44 72 110 149 176 * 60 40 4.0
* *
19+ . . . . . . . . . . . 2267 83.6 2.62 * 24 31 47 73 108 150 179 * 60 38 2.2* *
All persons 1+ . . . . . 8940 91.8 2.77 * * 31#
† The EAR for vitamin C for smokers is 35 mg greater than that for nonsmokers (3). The EAR used in this table is that for nonsmokers. Smoking status was not considered in these estimates, but is considered in the estimates shown in Table A9.2.* Standard error not displayed when percentage is <3 or >97 (Appendix C).# Percentage computed as weighted average of estimates for gender/age subgroups comprising the composite group. Standard error not displayed (Appendix C).Source: What We Eat in America, NHANES 2001-2002, all individuals 1+ years, excludes breast-fed children and pregnant or lactating females. EAR from reference 3.
21
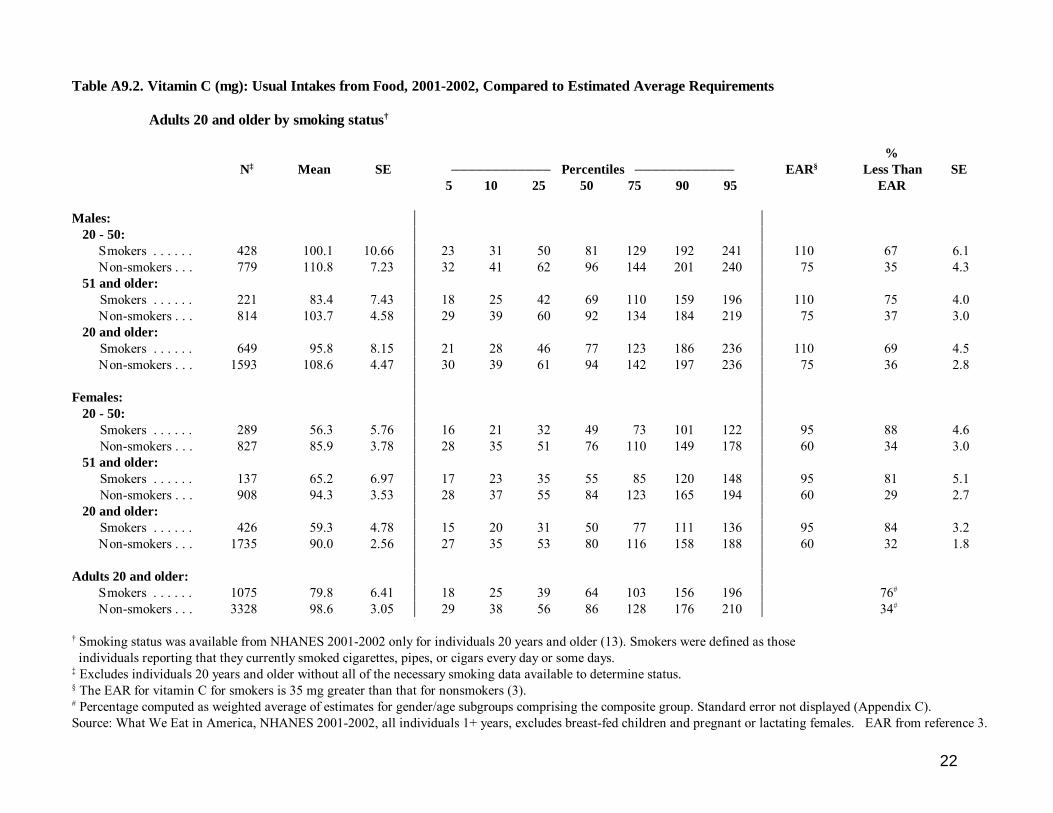
Table A9.2. Vitamin C (mg): Usual Intakes from Food, 2001-2002, Compared to Estimated Average Requirements
Adults 20 and older by smoking status†
%N‡ Mean SE )))))))))))) Percentiles )))))))))))) EAR§ Less Than SE
5 10 25 50 75 90 95 EAR
Males: * *
20 - 50: * *
Smokers . . . . . . 428 100.1 10.66 * 23 31 50 81 129 192 241 * 110 67 6.1 Non-smokers . . . 779 110.8 7.23 * 32 41 62 96 144 201 240 * 75 35 4.3 51 and older: * *
Smokers . . . . . . 221 83.4 7.43 * 18 25 42 69 110 159 196 * 110 75 4.0 Non-smokers . . . 814 103.7 4.58 * 29 39 60 92 134 184 219 * 75 37 3.0 20 and older: * *
Smokers . . . . . . 649 95.8 8.15 * 21 28 46 77 123 186 236 * 110 69 4.5 Non-smokers . . . 1593 108.6 4.47 * 30 39 61 94 142 197 236 * 75 36 2.8 * *
Females: * *
20 - 50: * *
Smokers . . . . . . 289 56.3 5.76 * 16 21 32 49 73 101 122 * 95 88 4.6 Non-smokers . . . 827 85.9 3.78 * 28 35 51 76 110 149 178 * 60 34 3.0 51 and older: * *
Smokers . . . . . . 137 65.2 6.97 * 17 23 35 55 85 120 148 * 95 81 5.1 Non-smokers . . . 908 94.3 3.53 * 28 37 55 84 123 165 194 * 60 29 2.7 20 and older: * *
Smokers . . . . . . 426 59.3 4.78 * 15 20 31 50 77 111 136 * 95 84 3.2 Non-smokers . . . 1735 90.0 2.56 * 27 35 53 80 116 158 188 * 60 32 1.8
* *
Adults 20 and older: * *
Smokers . . . . . . 1075 79.8 6.41 * 18 25 39 64 103 156 196 * 76#
Non-smokers . . . 3328 98.6 3.05 * 29 38 56 86 128 176 210 * 34#
† Smoking status was available from NHANES 2001-2002 only for individuals 20 years and older (13). Smokers were defined as those individuals reporting that they currently smoked cigarettes, pipes, or cigars every day or some days.‡ Excludes individuals 20 years and older without all of the necessary smoking data available to determine status.§ The EAR for vitamin C for smokers is 35 mg greater than that for nonsmokers (3).# Percentage computed as weighted average of estimates for gender/age subgroups comprising the composite group. Standard error not displayed (Appendix C).Source: What We Eat in America, NHANES 2001-2002, all individuals 1+ years, excludes breast-fed children and pregnant or lactating females. EAR from reference 3.
22

Table A10. Phosphorus (mg): Usual Intakes from Food, 2001-2002, Compared to Estimated Average Requirements
%N Mean SE )))))))))))) Percentiles )))))))))))) EAR Less Than SE*
5 10 25 50 75 90 95 EAR
Males and females: 1 - 3 . . . . . . . . . . . . 798 1065 23.7 * 639 721 867 1044 1236 1431 1563 * 380 <3 4 - 8 . . . . . . . . . . . . 920 1172 21.5 * 730 818 970 1148 1346 1553 1696 * 405 <3
* *
Males: * *
9 - 13 . . . . . . . . . . . 574 1431 67.2 * 987 1066 1211 1399 1618 1838 1982 * 1055 9 3.3 14 - 18 . . . . . . . . . . . 727 1575 48.5 * 954 1066 1271 1529 1827 2139 2349 * 1055 9 2.0
* *
19 - 30 . . . . . . . . . . . 552 1658 58.0 * 966 1097 1328 1612 1938 2277 2502 * 580 <3 31 - 50 . . . . . . . . . . . 785 1644 31.4 * 979 1097 1321 1600 1911 2243 2468 * 580 <3 51 - 70 . . . . . . . . . . . 651 1419 43.0 * 809 917 1111 1352 1642 1985 2251 * 580 <3 71+ . . . . . . . . . . . . . 392 1240 36.7 * 719 818 994 1216 1461 1690 1834 * 580 <3
* *
19+ . . . . . . . . . . . 2380 1552 25.0 * 874 994 1215 1497 1823 2174 2421 * 580 <3* *
Females: * *
9 - 13 . . . . . . . . . . . 597 1141 38.7 * 719 795 935 1112 1315 1526 1663 * 1055 42 5.5 14 - 18 . . . . . . . . . . . 677 1099 34.8 * 585 676 847 1065 1314 1566 1730 * 1055 49 4.1
* *
19 - 30 . . . . . . . . . . . 465 1160 36.1 * 606 717 911 1136 1385 1630 1785 * 580 4 1.5 31 - 50 . . . . . . . . . . . 754 1167 28.7 * 715 798 952 1142 1345 1556 1709 * 580 <3 51 - 70 . . . . . . . . . . . 643 1062 21.2 * 605 689 842 1036 1253 1467 1607 * 580 4 0.8 71+ . . . . . . . . . . . . . 405 946 21.4 * 583 650 770 918 1090 1274 1403 * 580 5 1.1
* *
19+ . . . . . . . . . . . 2267 1109 18.0 * 630 718 879 1080 1303 1528 1684 * 580 3 0.5* *
All persons 1+ . . . . . 8940 1304 14.0 * * 5#
* Standard error not displayed when percentage is <3 or >97 (Appendix C).# Percentage computed as weighted average of estimates for gender/age subgroups comprising the composite group. Standard error not displayed (Appendix C).Source: What We Eat in America, NHANES 2001-2002, all individuals 1+ years, excludes breast-fed children and pregnant or lactating females. EAR from reference 1.
23

Table A11. Magnesium (mg): Usual Intakes from Food, 2001-2002, Compared to Estimated Average Requirements
%N Mean SE )))))))))))) Percentiles )))))))))))) EAR Less Than SE*
5 10 25 50 75 90 95 EAR
Males and females: 1 - 3 . . . . . . . . . . . . 798 188 3.7 * 118 132 156 185 216 247 267 * 65 <3 4 - 8 . . . . . . . . . . . . 920 212 5.0 * 137 151 177 209 243 277 300 * 110 <3
* *
Males: * *
9 - 13 . . . . . . . . . . . 574 250 9.5 * 179 193 217 246 279 313 336 * 200 14 4.2 14 - 18 . . . . . . . . . . . 727 284 8.1 * 167 188 226 274 332 391 431 * 340 78 3.3
* *
19 - 30 . . . . . . . . . . . 552 328 12.1 * 188 213 259 317 385 457 506 * 330 55 4.9 31 - 50 . . . . . . . . . . . 785 334 8.0 * 209 232 273 325 386 448 489 * 350 61 3.6 51 - 70 . . . . . . . . . . . 651 310 9.4 * 166 190 235 294 366 446 506 * 350 70 3.3 71+ . . . . . . . . . . . . . 392 279 9.1 * 152 175 217 271 332 393 433 * 350 81 3.1
* *
19+ . . . . . . . . . . . 2380 322 6.2 * 181 206 251 309 378 452 505 * 64#
* *
Females: * *
9 - 13 . . . . . . . . . . . 597 215 8.5 * 131 146 173 208 251 294 322 * 200 44 6.2 14 - 18 . . . . . . . . . . . 677 206 8.1 * 112 128 158 197 244 295 329 * 300 91 2.6
* *
19 - 30 . . . . . . . . . . . 465 235 9.6 * 113 136 176 226 284 345 386 * 255 64 4.2 31 - 50 . . . . . . . . . . . 754 245 7.2 * 135 154 189 235 290 348 389 * 265 65 3.6 51 - 70 . . . . . . . . . . . 643 246 6.8 * 138 157 191 236 292 350 389 * 265 64 3.1 71+ . . . . . . . . . . . . . 405 213 6.6 * 127 142 168 203 246 296 333 * 265 82 3.2
* *
19+ . . . . . . . . . . . 2267 240 5.0 * 128 148 184 229 284 345 386 * 67#
* *
All persons 1+ . . . . . 8940 265 4.1 * * 56#
* Standard error not displayed when percentage is <3 or >97 (Appendix C).# Percentage computed as weighted average of estimates for gender/age subgroups comprising the composite group. Standard error not displayed (Appendix C).Source: What We Eat in America, NHANES 2001-2002, all individuals 1+ years, excludes breast-fed children and pregnant or lactating females. EAR from reference 1.
24
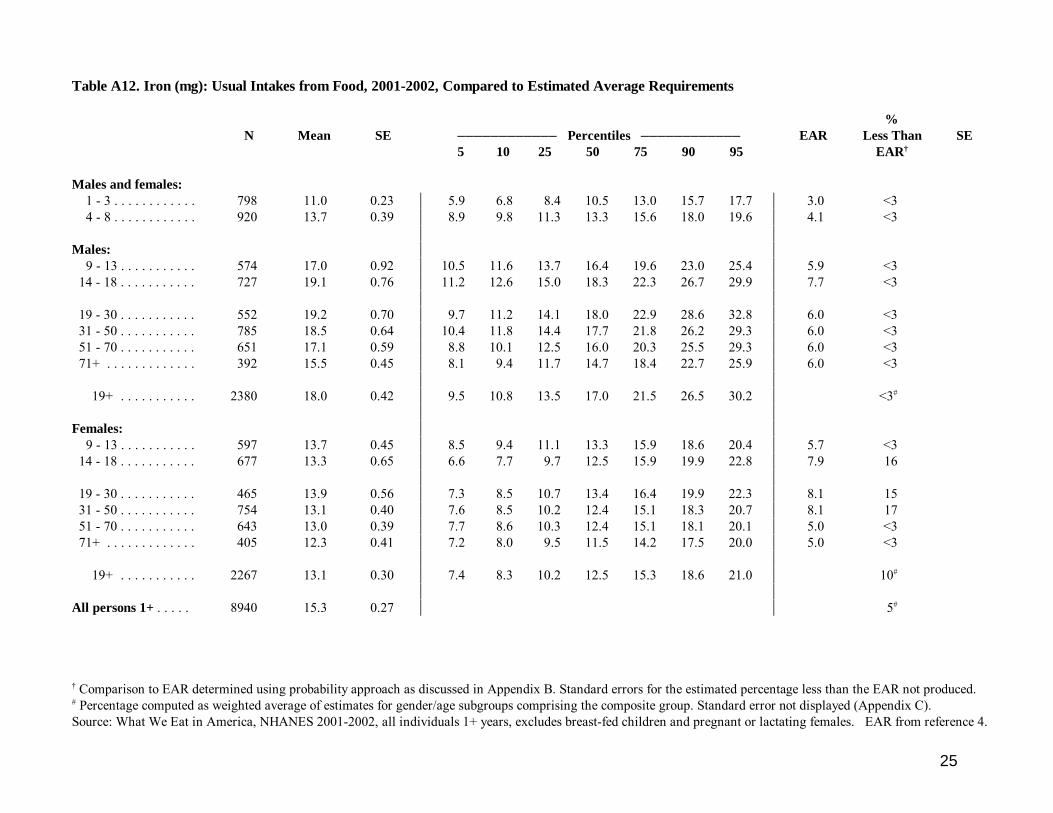
Table A12. Iron (mg): Usual Intakes from Food, 2001-2002, Compared to Estimated Average Requirements
%N Mean SE )))))))))))) Percentiles )))))))))))) EAR Less Than SE
5 10 25 50 75 90 95 EAR†
Males and females: 1 - 3 . . . . . . . . . . . . 798 11.0 0.23 * 5.9 6.8 8.4 10.5 13.0 15.7 17.7 * 3.0 <3 4 - 8 . . . . . . . . . . . . 920 13.7 0.39 * 8.9 9.8 11.3 13.3 15.6 18.0 19.6 * 4.1 <3
* *
Males: * *
9 - 13 . . . . . . . . . . . 574 17.0 0.92 * 10.5 11.6 13.7 16.4 19.6 23.0 25.4 * 5.9 <3 14 - 18 . . . . . . . . . . . 727 19.1 0.76 * 11.2 12.6 15.0 18.3 22.3 26.7 29.9 * 7.7 <3
* *
19 - 30 . . . . . . . . . . . 552 19.2 0.70 * 9.7 11.2 14.1 18.0 22.9 28.6 32.8 * 6.0 <3 31 - 50 . . . . . . . . . . . 785 18.5 0.64 * 10.4 11.8 14.4 17.7 21.8 26.2 29.3 * 6.0 <3 51 - 70 . . . . . . . . . . . 651 17.1 0.59 * 8.8 10.1 12.5 16.0 20.3 25.5 29.3 * 6.0 <3 71+ . . . . . . . . . . . . . 392 15.5 0.45 * 8.1 9.4 11.7 14.7 18.4 22.7 25.9 * 6.0 <3
* *
19+ . . . . . . . . . . . 2380 18.0 0.42 * 9.5 10.8 13.5 17.0 21.5 26.5 30.2 * <3#
* *
Females: * *
9 - 13 . . . . . . . . . . . 597 13.7 0.45 * 8.5 9.4 11.1 13.3 15.9 18.6 20.4 * 5.7 <3 14 - 18 . . . . . . . . . . . 677 13.3 0.65 * 6.6 7.7 9.7 12.5 15.9 19.9 22.8 * 7.9 16
* *
19 - 30 . . . . . . . . . . . 465 13.9 0.56 * 7.3 8.5 10.7 13.4 16.4 19.9 22.3 * 8.1 15 31 - 50 . . . . . . . . . . . 754 13.1 0.40 * 7.6 8.5 10.2 12.4 15.1 18.3 20.7 * 8.1 17 51 - 70 . . . . . . . . . . . 643 13.0 0.39 * 7.7 8.6 10.3 12.4 15.1 18.1 20.1 * 5.0 <3 71+ . . . . . . . . . . . . . 405 12.3 0.41 * 7.2 8.0 9.5 11.5 14.2 17.5 20.0 * 5.0 <3
* *
19+ . . . . . . . . . . . 2267 13.1 0.30 * 7.4 8.3 10.2 12.5 15.3 18.6 21.0 * 10#
* *
All persons 1+ . . . . . 8940 15.3 0.27 * * 5#
† Comparison to EAR determined using probability approach as discussed in Appendix B. Standard errors for the estimated percentage less than the EAR not produced.# Percentage computed as weighted average of estimates for gender/age subgroups comprising the composite group. Standard error not displayed (Appendix C).Source: What We Eat in America, NHANES 2001-2002, all individuals 1+ years, excludes breast-fed children and pregnant or lactating females. EAR from reference 4.
25

Table A13. Zinc (mg): Usual Intakes from Food, 2001-2002, Compared to Estimated Average Requirements
%N Mean SE )))))))))))) Percentiles )))))))))))) EAR Less Than SE*
5 10 25 50 75 90 95 EAR
Males and females: 1 - 3 . . . . . . . . . . . . 798 8.3 0.22 * 5.0 5.6 6.7 8.0 9.5 11.3 12.6 * 2.5 <3 4 - 8 . . . . . . . . . . . . 920 10.0 0.30 * 6.1 6.8 8.1 9.7 11.7 13.7 15.0 * 4.0 <3
* *
Males: * *
9 - 13 . . . . . . . . . . . 574 13.0 0.76 * 8.5 9.3 10.8 12.8 15.0 17.1 18.5 * 7.0 <3 14 - 18 . . . . . . . . . . . 727 15.1 0.63 * 8.8 9.8 11.8 14.4 17.7 21.2 23.8 * 8.5 4 1.2
* *
19 - 30 . . . . . . . . . . . 552 14.5 0.53 * 9.2 10.1 11.9 14.2 16.6 19.3 21.3 * 9.4 6 1.6 31 - 50 . . . . . . . . . . . 785 15.1 0.46 * 9.7 10.6 12.4 14.7 17.3 20.1 21.9 * 9.4 4 0.9 51 - 70 . . . . . . . . . . . 651 13.2 0.50 * 7.1 8.1 9.9 12.4 15.5 19.3 22.1 * 9.4 20 2.7 71+ . . . . . . . . . . . . . 392 12.0 0.51 * 6.7 7.5 9.0 11.1 13.8 17.4 20.4 * 9.4 30 3.9
* *
19+ . . . . . . . . . . . 2380 14.2 0.28 * 8.2 9.3 11.1 13.6 16.6 19.9 22.3 * 9.4 11 1.0* *
Females: * *
9 - 13 . . . . . . . . . . . 597 9.8 0.34 * 6.4 7.0 8.1 9.6 11.2 13.0 14.1 * 7.0 10 2.8 14 - 18 . . . . . . . . . . . 677 9.5 0.44 * 5.2 5.8 7.2 9.0 11.3 13.7 15.3 * 7.3 26 4.6
* *
19 - 30 . . . . . . . . . . . 465 10.3 0.36 * 5.6 6.4 7.9 9.8 12.2 14.8 16.4 * 6.8 13 3.1 31 - 50 . . . . . . . . . . . 754 10.0 0.31 * 6.0 6.6 7.9 9.6 11.7 14.0 15.6 * 6.8 11 2.3 51 - 70 . . . . . . . . . . . 643 9.4 0.25 * 5.3 6.0 7.3 9.0 11.0 13.3 14.8 * 6.8 18 2.2 71+ . . . . . . . . . . . . . 405 8.2 0.39 * 4.7 5.2 6.2 7.6 9.5 11.9 13.8 * 6.8 36 4.1
* *
19+ . . . . . . . . . . . 2267 9.7 0.19 * 5.4 6.1 7.5 9.2 11.3 13.9 15.7 * 6.8 17 1.6* *
All persons 1+ . . . . . 8940 11.6 0.15 * * 12#
* Standard error not displayed when percentage is <3 or >97 (Appendix C).# Percentage computed as weighted average of estimates for gender/age subgroups comprising the composite group. Standard error not displayed (Appendix C).Source: What We Eat in America, NHANES 2001-2002, all individuals 1+ years, excludes breast-fed children and pregnant or lactating females. EAR from reference 4.
26
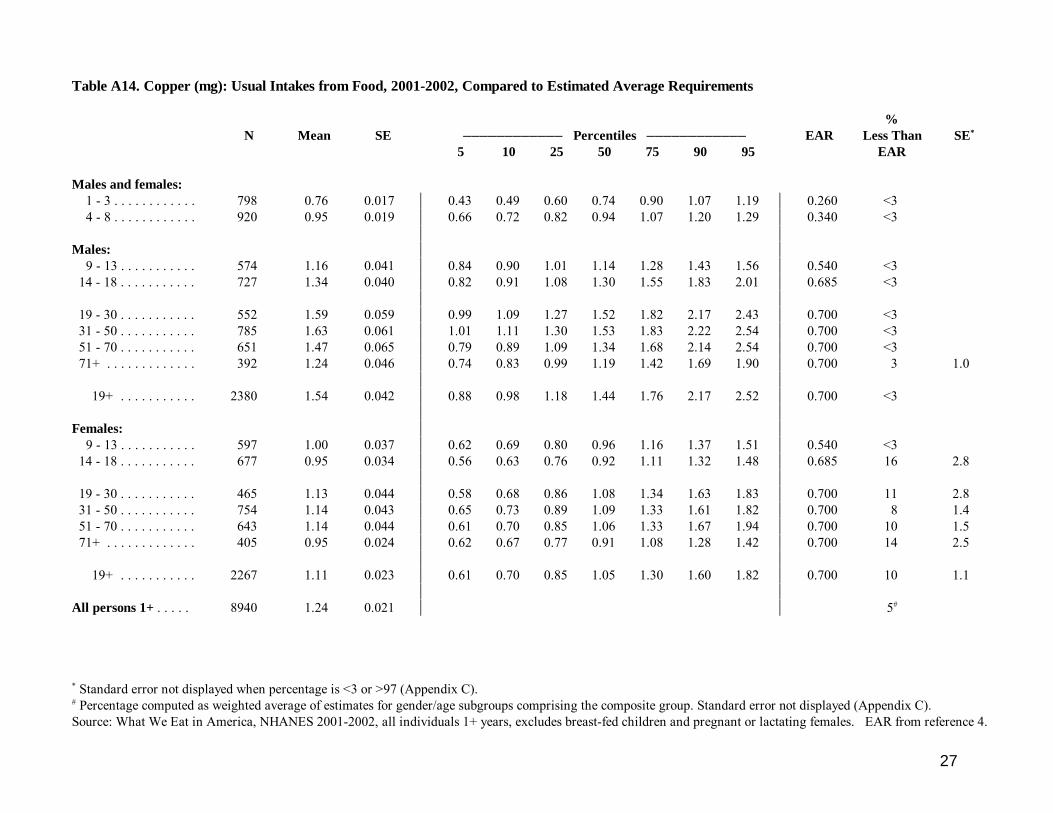
Table A14. Copper (mg): Usual Intakes from Food, 2001-2002, Compared to Estimated Average Requirements
%N Mean SE )))))))))))) Percentiles )))))))))))) EAR Less Than SE*
5 10 25 50 75 90 95 EAR
Males and females: 1 - 3 . . . . . . . . . . . . 798 0.76 0.017 * 0.43 0.49 0.60 0.74 0.90 1.07 1.19 * 0.260 <3 4 - 8 . . . . . . . . . . . . 920 0.95 0.019 * 0.66 0.72 0.82 0.94 1.07 1.20 1.29 * 0.340 <3
* *
Males: * *
9 - 13 . . . . . . . . . . . 574 1.16 0.041 * 0.84 0.90 1.01 1.14 1.28 1.43 1.56 * 0.540 <3 14 - 18 . . . . . . . . . . . 727 1.34 0.040 * 0.82 0.91 1.08 1.30 1.55 1.83 2.01 * 0.685 <3
* *
19 - 30 . . . . . . . . . . . 552 1.59 0.059 * 0.99 1.09 1.27 1.52 1.82 2.17 2.43 * 0.700 <3 31 - 50 . . . . . . . . . . . 785 1.63 0.061 * 1.01 1.11 1.30 1.53 1.83 2.22 2.54 * 0.700 <3 51 - 70 . . . . . . . . . . . 651 1.47 0.065 * 0.79 0.89 1.09 1.34 1.68 2.14 2.54 * 0.700 <3 71+ . . . . . . . . . . . . . 392 1.24 0.046 * 0.74 0.83 0.99 1.19 1.42 1.69 1.90 * 0.700 3 1.0
* *
19+ . . . . . . . . . . . 2380 1.54 0.042 * 0.88 0.98 1.18 1.44 1.76 2.17 2.52 * 0.700 <3* *
Females: * *
9 - 13 . . . . . . . . . . . 597 1.00 0.037 * 0.62 0.69 0.80 0.96 1.16 1.37 1.51 * 0.540 <3 14 - 18 . . . . . . . . . . . 677 0.95 0.034 * 0.56 0.63 0.76 0.92 1.11 1.32 1.48 * 0.685 16 2.8
* *
19 - 30 . . . . . . . . . . . 465 1.13 0.044 * 0.58 0.68 0.86 1.08 1.34 1.63 1.83 * 0.700 11 2.8 31 - 50 . . . . . . . . . . . 754 1.14 0.043 * 0.65 0.73 0.89 1.09 1.33 1.61 1.82 * 0.700 8 1.4 51 - 70 . . . . . . . . . . . 643 1.14 0.044 * 0.61 0.70 0.85 1.06 1.33 1.67 1.94 * 0.700 10 1.5 71+ . . . . . . . . . . . . . 405 0.95 0.024 * 0.62 0.67 0.77 0.91 1.08 1.28 1.42 * 0.700 14 2.5
* *
19+ . . . . . . . . . . . 2267 1.11 0.023 * 0.61 0.70 0.85 1.05 1.30 1.60 1.82 * 0.700 10 1.1* *
All persons 1+ . . . . . 8940 1.24 0.021 * * 5#
* Standard error not displayed when percentage is <3 or >97 (Appendix C).# Percentage computed as weighted average of estimates for gender/age subgroups comprising the composite group. Standard error not displayed (Appendix C).Source: What We Eat in America, NHANES 2001-2002, all individuals 1+ years, excludes breast-fed children and pregnant or lactating females. EAR from reference 4.
27
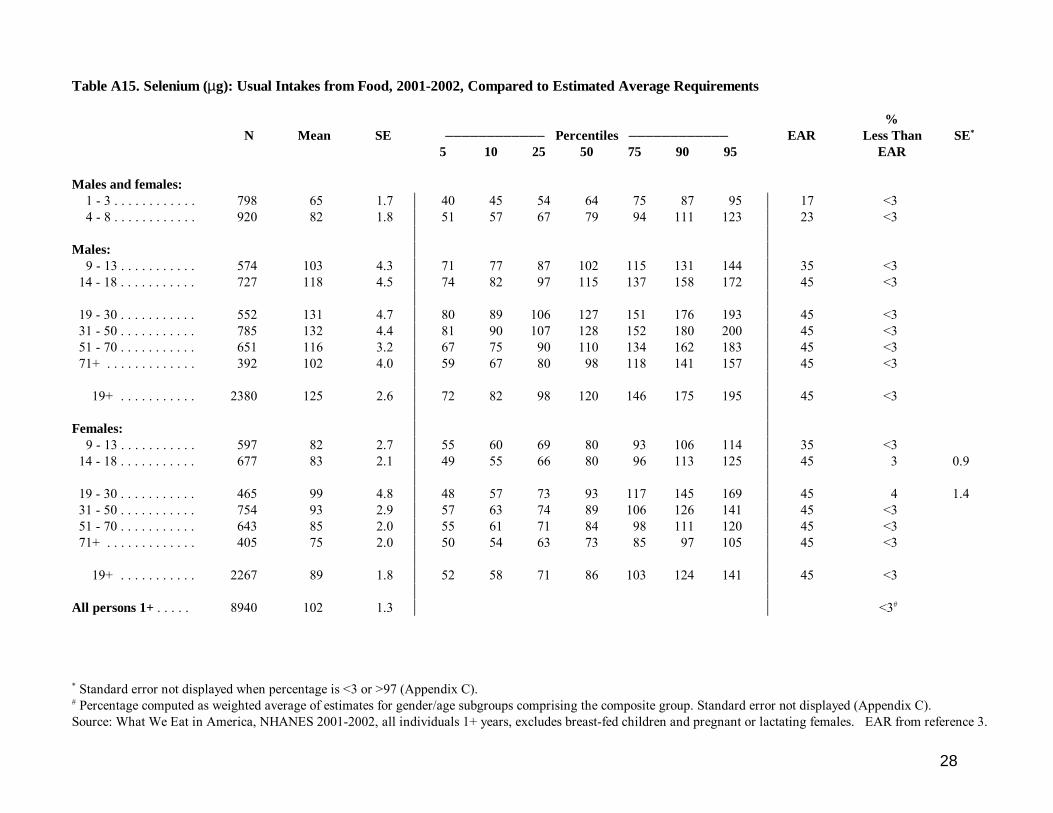
Table A15. Selenium (µg): Usual Intakes from Food, 2001-2002, Compared to Estimated Average Requirements
%N Mean SE )))))))))))) Percentiles )))))))))))) EAR Less Than SE*
5 10 25 50 75 90 95 EAR
Males and females: 1 - 3 . . . . . . . . . . . . 798 65 1.7 * 40 45 54 64 75 87 95 * 17 <3 4 - 8 . . . . . . . . . . . . 920 82 1.8 * 51 57 67 79 94 111 123 * 23 <3
* *
Males: * *
9 - 13 . . . . . . . . . . . 574 103 4.3 * 71 77 87 102 115 131 144 * 35 <3 14 - 18 . . . . . . . . . . . 727 118 4.5 * 74 82 97 115 137 158 172 * 45 <3
* *
19 - 30 . . . . . . . . . . . 552 131 4.7 * 80 89 106 127 151 176 193 * 45 <3 31 - 50 . . . . . . . . . . . 785 132 4.4 * 81 90 107 128 152 180 200 * 45 <3 51 - 70 . . . . . . . . . . . 651 116 3.2 * 67 75 90 110 134 162 183 * 45 <3 71+ . . . . . . . . . . . . . 392 102 4.0 * 59 67 80 98 118 141 157 * 45 <3
* *
19+ . . . . . . . . . . . 2380 125 2.6 * 72 82 98 120 146 175 195 * 45 <3* *
Females: * *
9 - 13 . . . . . . . . . . . 597 82 2.7 * 55 60 69 80 93 106 114 * 35 <3 14 - 18 . . . . . . . . . . . 677 83 2.1 * 49 55 66 80 96 113 125 * 45 3 0.9
* *
19 - 30 . . . . . . . . . . . 465 99 4.8 * 48 57 73 93 117 145 169 * 45 4 1.4 31 - 50 . . . . . . . . . . . 754 93 2.9 * 57 63 74 89 106 126 141 * 45 <3 51 - 70 . . . . . . . . . . . 643 85 2.0 * 55 61 71 84 98 111 120 * 45 <3 71+ . . . . . . . . . . . . . 405 75 2.0 * 50 54 63 73 85 97 105 * 45 <3
* *
19+ . . . . . . . . . . . 2267 89 1.8 * 52 58 71 86 103 124 141 * 45 <3* *
All persons 1+ . . . . . 8940 102 1.3 * * <3#
* Standard error not displayed when percentage is <3 or >97 (Appendix C).# Percentage computed as weighted average of estimates for gender/age subgroups comprising the composite group. Standard error not displayed (Appendix C).Source: What We Eat in America, NHANES 2001-2002, all individuals 1+ years, excludes breast-fed children and pregnant or lactating females. EAR from reference 3.
28
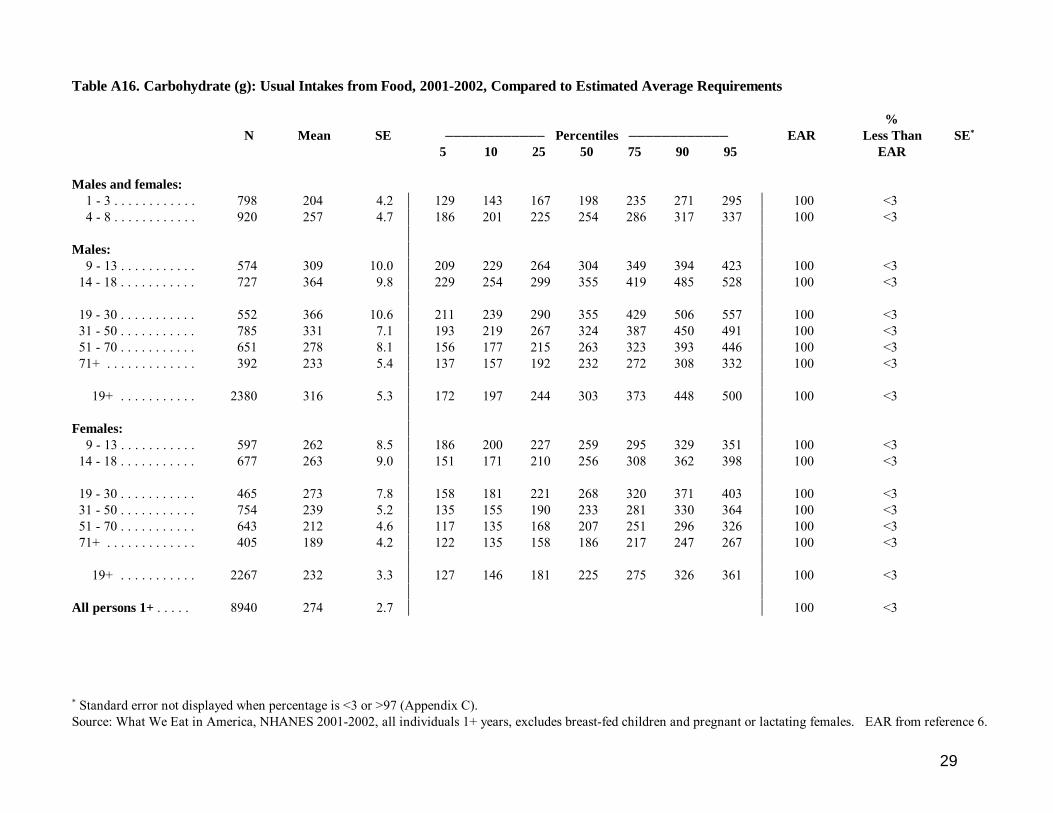
Table A16. Carbohydrate (g): Usual Intakes from Food, 2001-2002, Compared to Estimated Average Requirements
%N Mean SE )))))))))))) Percentiles )))))))))))) EAR Less Than SE*
5 10 25 50 75 90 95 EAR
Males and females: 1 - 3 . . . . . . . . . . . . 798 204 4.2 * 129 143 167 198 235 271 295 * 100 <3 4 - 8 . . . . . . . . . . . . 920 257 4.7 * 186 201 225 254 286 317 337 * 100 <3
* *
Males: * *
9 - 13 . . . . . . . . . . . 574 309 10.0 * 209 229 264 304 349 394 423 * 100 <3 14 - 18 . . . . . . . . . . . 727 364 9.8 * 229 254 299 355 419 485 528 * 100 <3
* *
19 - 30 . . . . . . . . . . . 552 366 10.6 * 211 239 290 355 429 506 557 * 100 <3 31 - 50 . . . . . . . . . . . 785 331 7.1 * 193 219 267 324 387 450 491 * 100 <3 51 - 70 . . . . . . . . . . . 651 278 8.1 * 156 177 215 263 323 393 446 * 100 <3 71+ . . . . . . . . . . . . . 392 233 5.4 * 137 157 192 232 272 308 332 * 100 <3
* *
19+ . . . . . . . . . . . 2380 316 5.3 * 172 197 244 303 373 448 500 * 100 <3* *
Females: * *
9 - 13 . . . . . . . . . . . 597 262 8.5 * 186 200 227 259 295 329 351 * 100 <3 14 - 18 . . . . . . . . . . . 677 263 9.0 * 151 171 210 256 308 362 398 * 100 <3
* *
19 - 30 . . . . . . . . . . . 465 273 7.8 * 158 181 221 268 320 371 403 * 100 <3 31 - 50 . . . . . . . . . . . 754 239 5.2 * 135 155 190 233 281 330 364 * 100 <3 51 - 70 . . . . . . . . . . . 643 212 4.6 * 117 135 168 207 251 296 326 * 100 <3 71+ . . . . . . . . . . . . . 405 189 4.2 * 122 135 158 186 217 247 267 * 100 <3
* *
19+ . . . . . . . . . . . 2267 232 3.3 * 127 146 181 225 275 326 361 * 100 <3* *
All persons 1+ . . . . . 8940 274 2.7 * * 100 <3
* Standard error not displayed when percentage is <3 or >97 (Appendix C).Source: What We Eat in America, NHANES 2001-2002, all individuals 1+ years, excludes breast-fed children and pregnant or lactating females. EAR from reference 6.
29
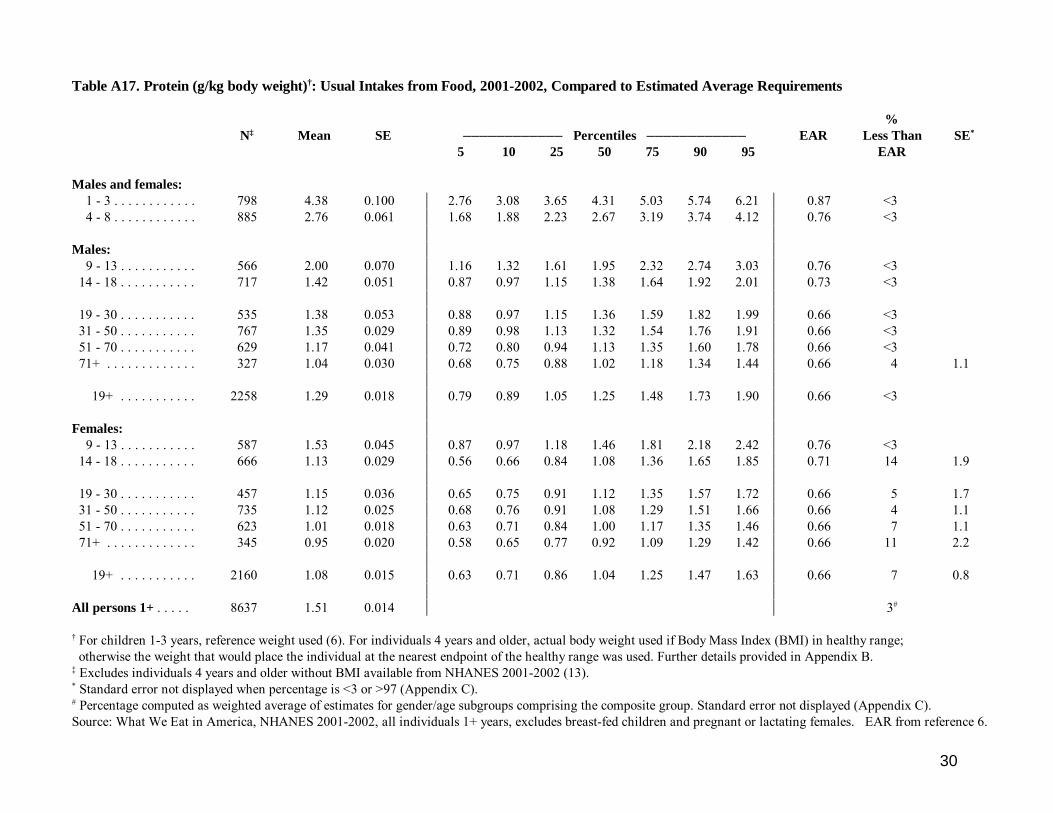
Table A17. Protein (g/kg body weight)†: Usual Intakes from Food, 2001-2002, Compared to Estimated Average Requirements
%N‡ Mean SE )))))))))))) Percentiles )))))))))))) EAR Less Than SE*
5 10 25 50 75 90 95 EAR
Males and females: 1 - 3 . . . . . . . . . . . . 798 4.38 0.100 * 2.76 3.08 3.65 4.31 5.03 5.74 6.21 * 0.87 <3 4 - 8 . . . . . . . . . . . . 885 2.76 0.061 * 1.68 1.88 2.23 2.67 3.19 3.74 4.12 * 0.76 <3
* *
Males: * *
9 - 13 . . . . . . . . . . . 566 2.00 0.070 * 1.16 1.32 1.61 1.95 2.32 2.74 3.03 * 0.76 <3 14 - 18 . . . . . . . . . . . 717 1.42 0.051 * 0.87 0.97 1.15 1.38 1.64 1.92 2.01 * 0.73 <3
* *
19 - 30 . . . . . . . . . . . 535 1.38 0.053 * 0.88 0.97 1.15 1.36 1.59 1.82 1.99 * 0.66 <3 31 - 50 . . . . . . . . . . . 767 1.35 0.029 * 0.89 0.98 1.13 1.32 1.54 1.76 1.91 * 0.66 <3 51 - 70 . . . . . . . . . . . 629 1.17 0.041 * 0.72 0.80 0.94 1.13 1.35 1.60 1.78 * 0.66 <3 71+ . . . . . . . . . . . . . 327 1.04 0.030 * 0.68 0.75 0.88 1.02 1.18 1.34 1.44 * 0.66 4 1.1
* *
19+ . . . . . . . . . . . 2258 1.29 0.018 * 0.79 0.89 1.05 1.25 1.48 1.73 1.90 * 0.66 <3* *
Females: * *
9 - 13 . . . . . . . . . . . 587 1.53 0.045 * 0.87 0.97 1.18 1.46 1.81 2.18 2.42 * 0.76 <3 14 - 18 . . . . . . . . . . . 666 1.13 0.029 * 0.56 0.66 0.84 1.08 1.36 1.65 1.85 * 0.71 14 1.9
* *
19 - 30 . . . . . . . . . . . 457 1.15 0.036 * 0.65 0.75 0.91 1.12 1.35 1.57 1.72 * 0.66 5 1.7 31 - 50 . . . . . . . . . . . 735 1.12 0.025 * 0.68 0.76 0.91 1.08 1.29 1.51 1.66 * 0.66 4 1.1 51 - 70 . . . . . . . . . . . 623 1.01 0.018 * 0.63 0.71 0.84 1.00 1.17 1.35 1.46 * 0.66 7 1.1 71+ . . . . . . . . . . . . . 345 0.95 0.020 * 0.58 0.65 0.77 0.92 1.09 1.29 1.42 * 0.66 11 2.2
* *
19+ . . . . . . . . . . . 2160 1.08 0.015 * 0.63 0.71 0.86 1.04 1.25 1.47 1.63 * 0.66 7 0.8* *
All persons 1+ . . . . . 8637 1.51 0.014 * * 3#
† For children 1-3 years, reference weight used (6). For individuals 4 years and older, actual body weight used if Body Mass Index (BMI) in healthy range; otherwise the weight that would place the individual at the nearest endpoint of the healthy range was used. Further details provided in Appendix B.‡ Excludes individuals 4 years and older without BMI available from NHANES 2001-2002 (13).* Standard error not displayed when percentage is <3 or >97 (Appendix C).# Percentage computed as weighted average of estimates for gender/age subgroups comprising the composite group. Standard error not displayed (Appendix C).Source: What We Eat in America, NHANES 2001-2002, all individuals 1+ years, excludes breast-fed children and pregnant or lactating females. EAR from reference 6.
30
Section B. Tables
Usual Nutrient Intakes from Food, 2001-2002, Compared to Adequate Intakes Page Table B 18. Vitamin K (µg)........................................................................................................................................................32 Table B 19. Calcium (mg) ..........................................................................................................................................................33Table B 20. Potassium (mg) .......................................................................................................................................................34 Table B 21. Sodium (mg) ...........................................................................................................................................................35 Table B 22. Dietary Fiber (g) .....................................................................................................................................................36 Table B 23. Linoleic Acid 18:2 (g).............................................................................................................................................37 Table B 24. Linolenic Acid 18:3 (g)...........................................................................................................................................38
31
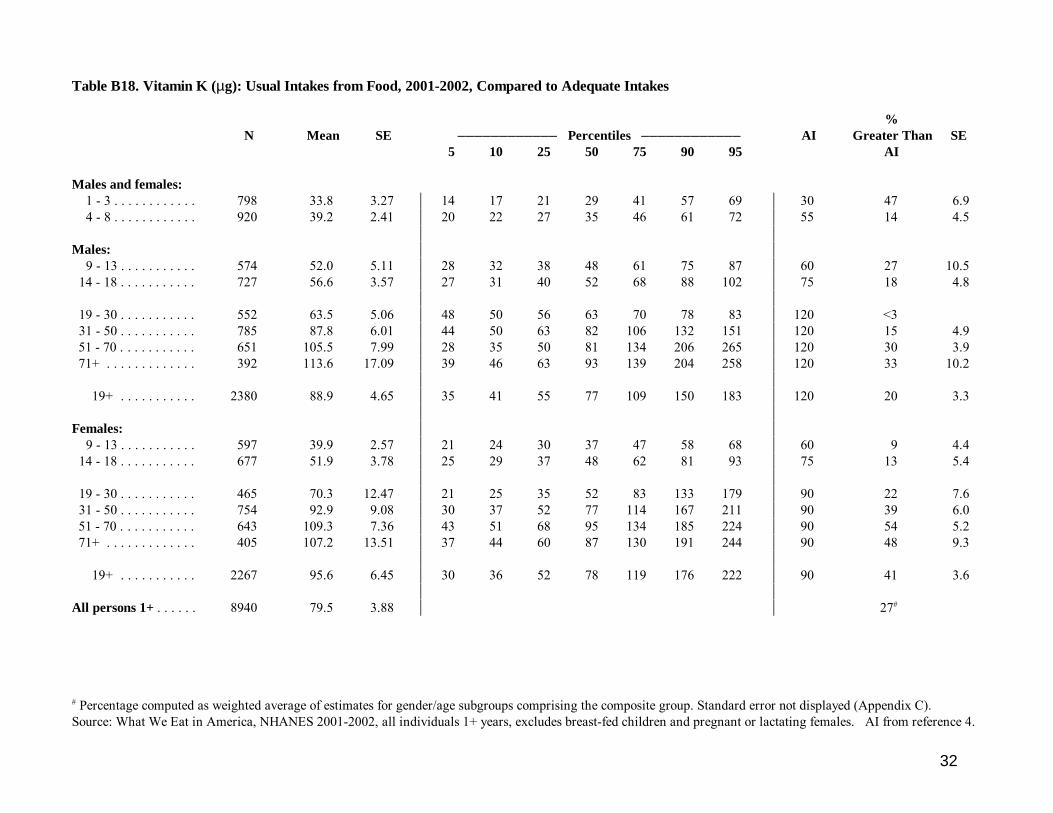
Table B18. Vitamin K (µg): Usual Intakes from Food, 2001-2002, Compared to Adequate Intakes
%N Mean SE )))))))))))) Percentiles )))))))))))) AI Greater Than SE
5 10 25 50 75 90 95 AI
Males and females: 1 - 3 . . . . . . . . . . . . 798 33.8 3.27 * 14 17 21 29 41 57 69 * 30 47 6.9 4 - 8 . . . . . . . . . . . . 920 39.2 2.41 * 20 22 27 35 46 61 72 * 55 14 4.5
* *
Males: * *
9 - 13 . . . . . . . . . . . 574 52.0 5.11 * 28 32 38 48 61 75 87 * 60 27 10.5 14 - 18 . . . . . . . . . . . 727 56.6 3.57 * 27 31 40 52 68 88 102 * 75 18 4.8
* *
19 - 30 . . . . . . . . . . . 552 63.5 5.06 * 48 50 56 63 70 78 83 * 120 <3 31 - 50 . . . . . . . . . . . 785 87.8 6.01 * 44 50 63 82 106 132 151 * 120 15 4.9 51 - 70 . . . . . . . . . . . 651 105.5 7.99 * 28 35 50 81 134 206 265 * 120 30 3.9 71+ . . . . . . . . . . . . . 392 113.6 17.09 * 39 46 63 93 139 204 258 * 120 33 10.2
* *
19+ . . . . . . . . . . . 2380 88.9 4.65 * 35 41 55 77 109 150 183 * 120 20 3.3* *
Females: * *
9 - 13 . . . . . . . . . . . 597 39.9 2.57 * 21 24 30 37 47 58 68 * 60 9 4.4 14 - 18 . . . . . . . . . . . 677 51.9 3.78 * 25 29 37 48 62 81 93 * 75 13 5.4
* *
19 - 30 . . . . . . . . . . . 465 70.3 12.47 * 21 25 35 52 83 133 179 * 90 22 7.6 31 - 50 . . . . . . . . . . . 754 92.9 9.08 * 30 37 52 77 114 167 211 * 90 39 6.0 51 - 70 . . . . . . . . . . . 643 109.3 7.36 * 43 51 68 95 134 185 224 * 90 54 5.2 71+ . . . . . . . . . . . . . 405 107.2 13.51 * 37 44 60 87 130 191 244 * 90 48 9.3
* *
19+ . . . . . . . . . . . 2267 95.6 6.45 * 30 36 52 78 119 176 222 * 90 41 3.6* *
All persons 1+ . . . . . . 8940 79.5 3.88 * * 27#
# Percentage computed as weighted average of estimates for gender/age subgroups comprising the composite group. Standard error not displayed (Appendix C).Source: What We Eat in America, NHANES 2001-2002, all individuals 1+ years, excludes breast-fed children and pregnant or lactating females. AI from reference 4.
32
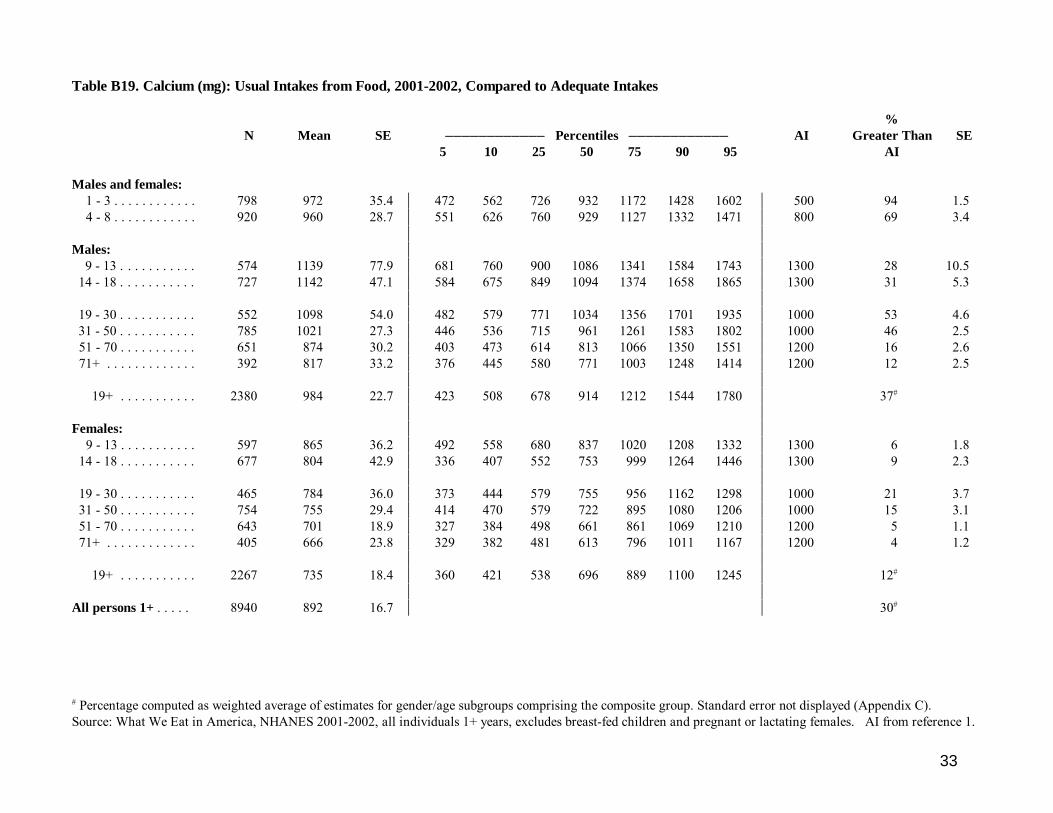
Table B19. Calcium (mg): Usual Intakes from Food, 2001-2002, Compared to Adequate Intakes
%N Mean SE )))))))))))) Percentiles )))))))))))) AI Greater Than SE
5 10 25 50 75 90 95 AI
Males and females: 1 - 3 . . . . . . . . . . . . 798 972 35.4 * 472 562 726 932 1172 1428 1602 * 500 94 1.5 4 - 8 . . . . . . . . . . . . 920 960 28.7 * 551 626 760 929 1127 1332 1471 * 800 69 3.4
* *
Males: * *
9 - 13 . . . . . . . . . . . 574 1139 77.9 * 681 760 900 1086 1341 1584 1743 * 1300 28 10.5 14 - 18 . . . . . . . . . . . 727 1142 47.1 * 584 675 849 1094 1374 1658 1865 * 1300 31 5.3
* *
19 - 30 . . . . . . . . . . . 552 1098 54.0 * 482 579 771 1034 1356 1701 1935 * 1000 53 4.6 31 - 50 . . . . . . . . . . . 785 1021 27.3 * 446 536 715 961 1261 1583 1802 * 1000 46 2.5 51 - 70 . . . . . . . . . . . 651 874 30.2 * 403 473 614 813 1066 1350 1551 * 1200 16 2.6 71+ . . . . . . . . . . . . . 392 817 33.2 * 376 445 580 771 1003 1248 1414 * 1200 12 2.5
* *
19+ . . . . . . . . . . . 2380 984 22.7 * 423 508 678 914 1212 1544 1780 * 37#
* *
Females: * *
9 - 13 . . . . . . . . . . . 597 865 36.2 * 492 558 680 837 1020 1208 1332 * 1300 6 1.8 14 - 18 . . . . . . . . . . . 677 804 42.9 * 336 407 552 753 999 1264 1446 * 1300 9 2.3
* *
19 - 30 . . . . . . . . . . . 465 784 36.0 * 373 444 579 755 956 1162 1298 * 1000 21 3.7 31 - 50 . . . . . . . . . . . 754 755 29.4 * 414 470 579 722 895 1080 1206 * 1000 15 3.1 51 - 70 . . . . . . . . . . . 643 701 18.9 * 327 384 498 661 861 1069 1210 * 1200 5 1.1 71+ . . . . . . . . . . . . . 405 666 23.8 * 329 382 481 613 796 1011 1167 * 1200 4 1.2
* *
19+ . . . . . . . . . . . 2267 735 18.4 * 360 421 538 696 889 1100 1245 * 12#
* *
All persons 1+ . . . . . 8940 892 16.7 * * 30#
# Percentage computed as weighted average of estimates for gender/age subgroups comprising the composite group. Standard error not displayed (Appendix C).Source: What We Eat in America, NHANES 2001-2002, all individuals 1+ years, excludes breast-fed children and pregnant or lactating females. AI from reference 1.
33

Table B20. Potassium (mg): Usual Intakes from Food, 2001-2002, Compared to Adequate Intakes
%N Mean SE )))))))))))) Percentiles )))))))))))) AI Greater Than SE*
5 10 25 50 75 90 95 AI
Males and females: 1 - 3 . . . . . . . . . . . . 798 2086 46.6 * 1251 1414 1703 2044 2419 2806 3067 * 3000 6 1.1 4 - 8 . . . . . . . . . . . . 920 2136 54.5 * 1332 1487 1763 2092 2466 2845 3081 * 3800 <3
* *
Males: * *
9 - 13 . . . . . . . . . . . 574 2472 101.0 * 1593 1755 2051 2419 2831 3253 3535 * 4500 <3 14 - 18 . . . . . . . . . . . 727 2774 103.2 * 1697 1893 2248 2694 3211 3752 4121 * 4700 <3
* *
19 - 30 . . . . . . . . . . . 552 3028 128.0 * 1722 1958 2388 2932 3564 4221 4660 * 4700 5 1.7 31 - 50 . . . . . . . . . . . 785 3280 69.4 * 2076 2314 2726 3219 3769 4328 4692 * 4700 5 1.2 51 - 70 . . . . . . . . . . . 651 3109 90.0 * 1764 1995 2431 2994 3651 4349 4837 * 4700 6 1.8 71+ . . . . . . . . . . . . . 392 2803 81.8 * 1499 1752 2202 2743 3338 3929 4311 * 4700 <3
* *
19+ . . . . . . . . . . . 2380 3141 54.9 * 1791 2040 2491 3049 3688 4354 4803 * 4700 6 0.9* *
Females: * *
9 - 13 . . . . . . . . . . . 597 2125 79.1 * 1231 1379 1669 2054 2503 2964 3268 * 4500 <3 14 - 18 . . . . . . . . . . . 677 2020 56.6 * 1107 1271 1573 1954 2389 2845 3157 * 4700 <3
* *
19 - 30 . . . . . . . . . . . 465 2139 64.3 * 1077 1271 1622 2063 2579 3114 3449 * 4700 <3 31 - 50 . . . . . . . . . . . 754 2398 58.1 * 1358 1547 1892 2324 2822 3340 3688 * 4700 <3 51 - 70 . . . . . . . . . . . 643 2468 62.0 * 1446 1643 1995 2419 2887 3354 3657 * 4700 <3 71+ . . . . . . . . . . . . . 405 2208 59.4 * 1235 1411 1726 2111 2584 3118 3501 * 4700 <3
* *
19+ . . . . . . . . . . . 2267 2341 39.1 * 1276 1474 1830 2269 2772 3297 3651 * 4700 <3* *
All persons 1+ . . . . . 8940 2606 33.4 * * <3#
* Standard error not displayed when percentage is <3 or >97 (Appendix C).# Percentage computed as weighted average of estimates for gender/age subgroups comprising the composite group. Standard error not displayed (Appendix C).Source: What We Eat in America, NHANES 2001-2002, all individuals 1+ years, excludes breast-fed children and pregnant or lactating females. AI from reference 5.
34
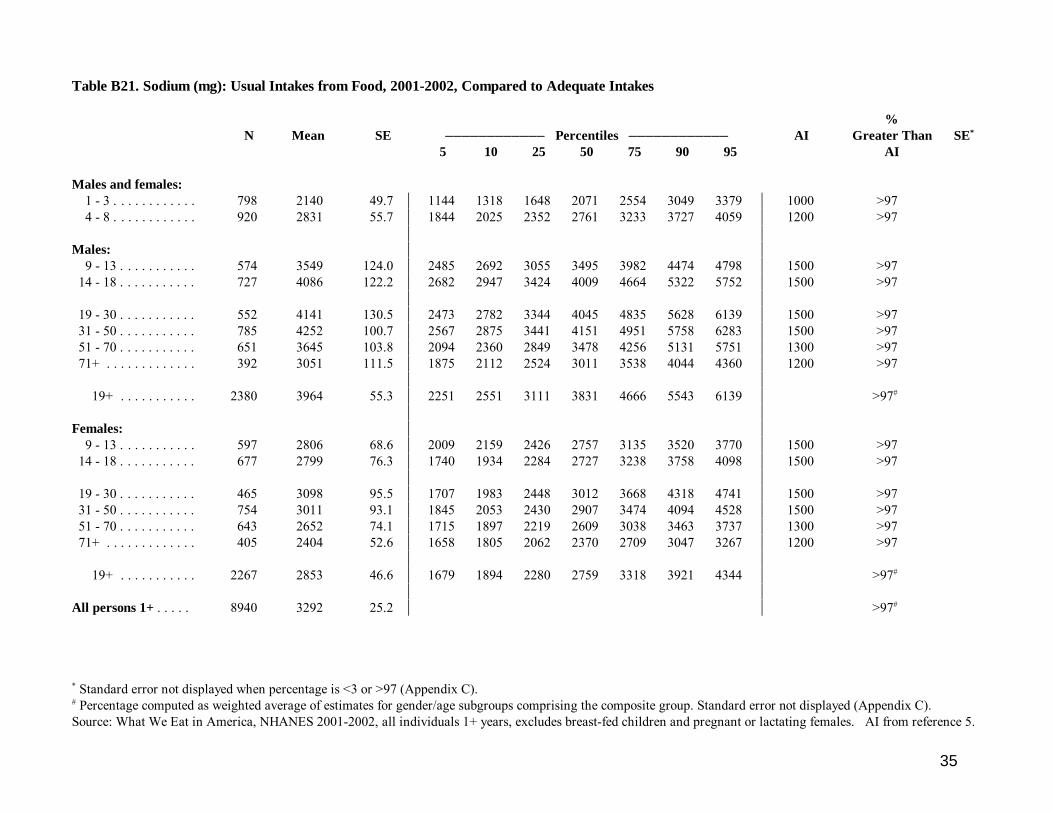
Table B21. Sodium (mg): Usual Intakes from Food, 2001-2002, Compared to Adequate Intakes
%N Mean SE )))))))))))) Percentiles )))))))))))) AI Greater Than SE*
5 10 25 50 75 90 95 AI
Males and females: 1 - 3 . . . . . . . . . . . . 798 2140 49.7 * 1144 1318 1648 2071 2554 3049 3379 * 1000 >97 4 - 8 . . . . . . . . . . . . 920 2831 55.7 * 1844 2025 2352 2761 3233 3727 4059 * 1200 >97
* *
Males: * *
9 - 13 . . . . . . . . . . . 574 3549 124.0 * 2485 2692 3055 3495 3982 4474 4798 * 1500 >97 14 - 18 . . . . . . . . . . . 727 4086 122.2 * 2682 2947 3424 4009 4664 5322 5752 * 1500 >97
* *
19 - 30 . . . . . . . . . . . 552 4141 130.5 * 2473 2782 3344 4045 4835 5628 6139 * 1500 >97 31 - 50 . . . . . . . . . . . 785 4252 100.7 * 2567 2875 3441 4151 4951 5758 6283 * 1500 >97 51 - 70 . . . . . . . . . . . 651 3645 103.8 * 2094 2360 2849 3478 4256 5131 5751 * 1300 >97 71+ . . . . . . . . . . . . . 392 3051 111.5 * 1875 2112 2524 3011 3538 4044 4360 * 1200 >97
* *
19+ . . . . . . . . . . . 2380 3964 55.3 * 2251 2551 3111 3831 4666 5543 6139 * >97#
* *
Females: * *
9 - 13 . . . . . . . . . . . 597 2806 68.6 * 2009 2159 2426 2757 3135 3520 3770 * 1500 >97 14 - 18 . . . . . . . . . . . 677 2799 76.3 * 1740 1934 2284 2727 3238 3758 4098 * 1500 >97
* *
19 - 30 . . . . . . . . . . . 465 3098 95.5 * 1707 1983 2448 3012 3668 4318 4741 * 1500 >97 31 - 50 . . . . . . . . . . . 754 3011 93.1 * 1845 2053 2430 2907 3474 4094 4528 * 1500 >97 51 - 70 . . . . . . . . . . . 643 2652 74.1 * 1715 1897 2219 2609 3038 3463 3737 * 1300 >97 71+ . . . . . . . . . . . . . 405 2404 52.6 * 1658 1805 2062 2370 2709 3047 3267 * 1200 >97
* *
19+ . . . . . . . . . . . 2267 2853 46.6 * 1679 1894 2280 2759 3318 3921 4344 * >97#
* *
All persons 1+ . . . . . 8940 3292 25.2 * * >97#
* Standard error not displayed when percentage is <3 or >97 (Appendix C).# Percentage computed as weighted average of estimates for gender/age subgroups comprising the composite group. Standard error not displayed (Appendix C).Source: What We Eat in America, NHANES 2001-2002, all individuals 1+ years, excludes breast-fed children and pregnant or lactating females. AI from reference 5.
35
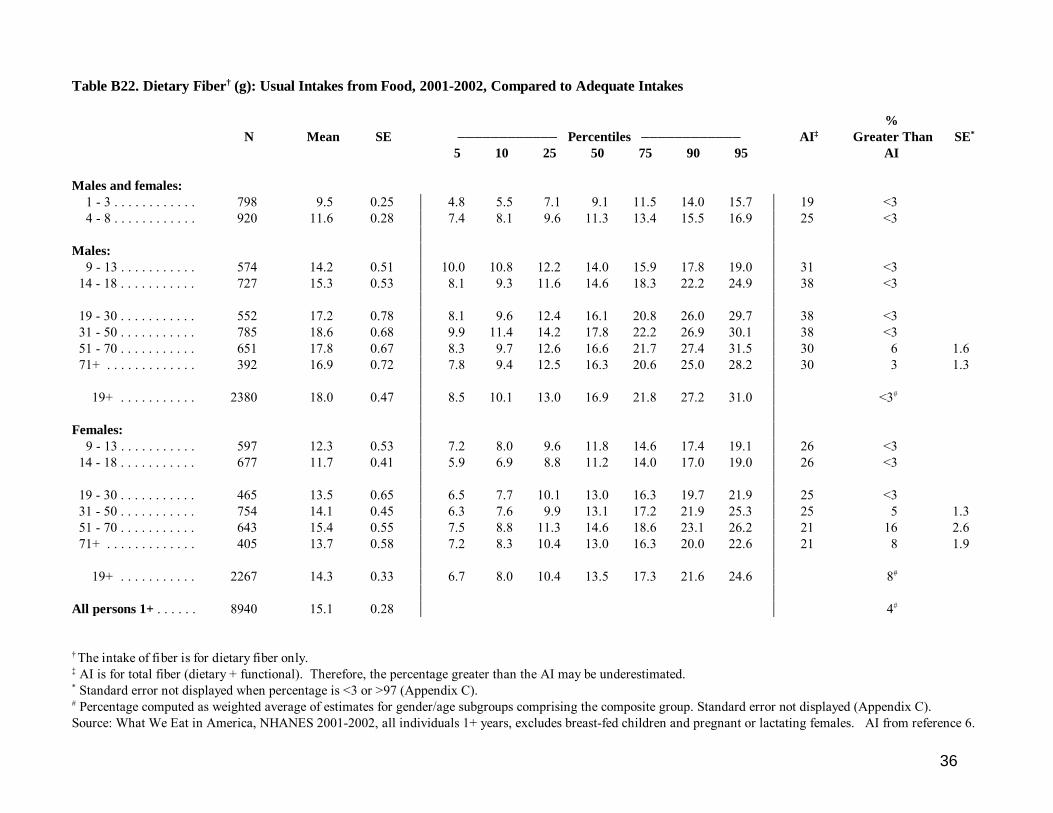
Table B22. Dietary Fiber† (g): Usual Intakes from Food, 2001-2002, Compared to Adequate Intakes
%N Mean SE )))))))))))) Percentiles )))))))))))) AI‡ Greater Than SE*
5 10 25 50 75 90 95 AI
Males and females: 1 - 3 . . . . . . . . . . . . 798 9.5 0.25 * 4.8 5.5 7.1 9.1 11.5 14.0 15.7 * 19 <3 4 - 8 . . . . . . . . . . . . 920 11.6 0.28 * 7.4 8.1 9.6 11.3 13.4 15.5 16.9 * 25 <3
* *
Males: * *
9 - 13 . . . . . . . . . . . 574 14.2 0.51 * 10.0 10.8 12.2 14.0 15.9 17.8 19.0 * 31 <3 14 - 18 . . . . . . . . . . . 727 15.3 0.53 * 8.1 9.3 11.6 14.6 18.3 22.2 24.9 * 38 <3
* *
19 - 30 . . . . . . . . . . . 552 17.2 0.78 * 8.1 9.6 12.4 16.1 20.8 26.0 29.7 * 38 <3 31 - 50 . . . . . . . . . . . 785 18.6 0.68 * 9.9 11.4 14.2 17.8 22.2 26.9 30.1 * 38 <3 51 - 70 . . . . . . . . . . . 651 17.8 0.67 * 8.3 9.7 12.6 16.6 21.7 27.4 31.5 * 30 6 1.6 71+ . . . . . . . . . . . . . 392 16.9 0.72 * 7.8 9.4 12.5 16.3 20.6 25.0 28.2 * 30 3 1.3
* *
19+ . . . . . . . . . . . 2380 18.0 0.47 * 8.5 10.1 13.0 16.9 21.8 27.2 31.0 * <3#
* *
Females: * *
9 - 13 . . . . . . . . . . . 597 12.3 0.53 * 7.2 8.0 9.6 11.8 14.6 17.4 19.1 * 26 <3 14 - 18 . . . . . . . . . . . 677 11.7 0.41 * 5.9 6.9 8.8 11.2 14.0 17.0 19.0 * 26 <3
* *
19 - 30 . . . . . . . . . . . 465 13.5 0.65 * 6.5 7.7 10.1 13.0 16.3 19.7 21.9 * 25 <3 31 - 50 . . . . . . . . . . . 754 14.1 0.45 * 6.3 7.6 9.9 13.1 17.2 21.9 25.3 * 25 5 1.3 51 - 70 . . . . . . . . . . . 643 15.4 0.55 * 7.5 8.8 11.3 14.6 18.6 23.1 26.2 * 21 16 2.6 71+ . . . . . . . . . . . . . 405 13.7 0.58 * 7.2 8.3 10.4 13.0 16.3 20.0 22.6 * 21 8 1.9
* *
19+ . . . . . . . . . . . 2267 14.3 0.33 * 6.7 8.0 10.4 13.5 17.3 21.6 24.6 * 8#
* *
All persons 1+ . . . . . . 8940 15.1 0.28 * * 4#
† The intake of fiber is for dietary fiber only.‡ AI is for total fiber (dietary + functional). Therefore, the percentage greater than the AI may be underestimated.* Standard error not displayed when percentage is <3 or >97 (Appendix C).# Percentage computed as weighted average of estimates for gender/age subgroups comprising the composite group. Standard error not displayed (Appendix C).Source: What We Eat in America, NHANES 2001-2002, all individuals 1+ years, excludes breast-fed children and pregnant or lactating females. AI from reference 6.
36
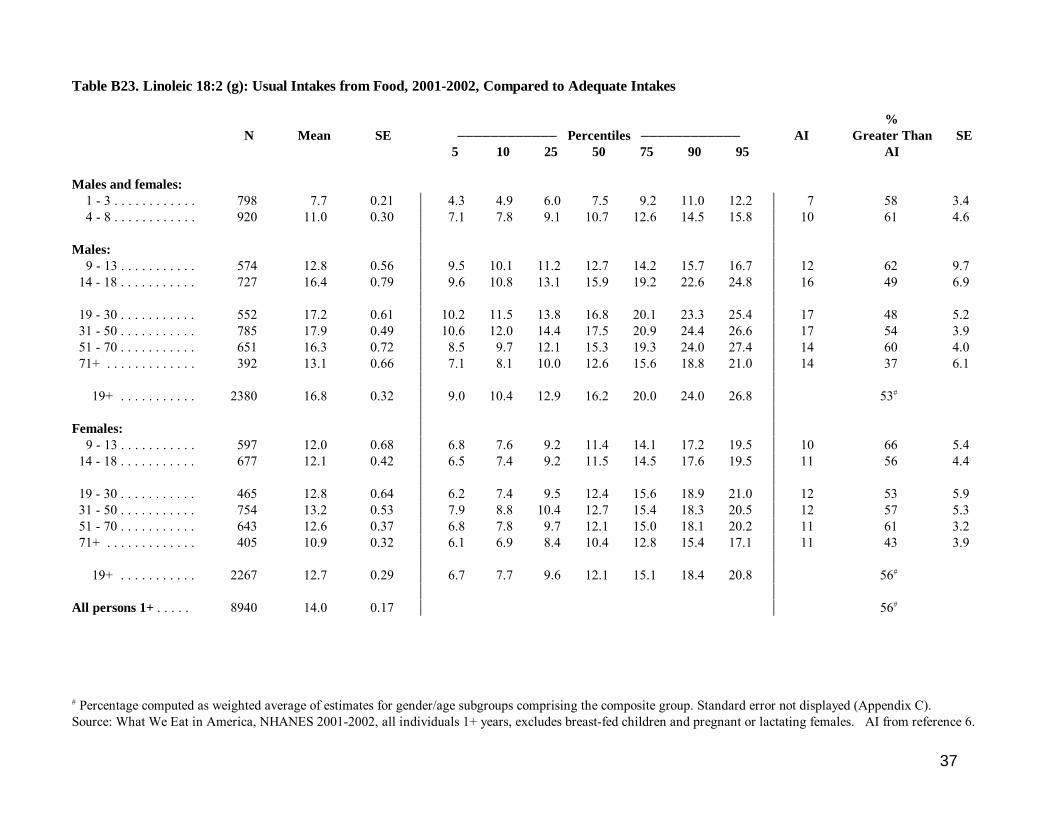
Table B23. Linoleic 18:2 (g): Usual Intakes from Food, 2001-2002, Compared to Adequate Intakes
%N Mean SE )))))))))))) Percentiles )))))))))))) AI Greater Than SE
5 10 25 50 75 90 95 AI
Males and females: 1 - 3 . . . . . . . . . . . . 798 7.7 0.21 * 4.3 4.9 6.0 7.5 9.2 11.0 12.2 * 7 58 3.4 4 - 8 . . . . . . . . . . . . 920 11.0 0.30 * 7.1 7.8 9.1 10.7 12.6 14.5 15.8 * 10 61 4.6
* *
Males: * *
9 - 13 . . . . . . . . . . . 574 12.8 0.56 * 9.5 10.1 11.2 12.7 14.2 15.7 16.7 * 12 62 9.7 14 - 18 . . . . . . . . . . . 727 16.4 0.79 * 9.6 10.8 13.1 15.9 19.2 22.6 24.8 * 16 49 6.9
* *
19 - 30 . . . . . . . . . . . 552 17.2 0.61 * 10.2 11.5 13.8 16.8 20.1 23.3 25.4 * 17 48 5.2 31 - 50 . . . . . . . . . . . 785 17.9 0.49 * 10.6 12.0 14.4 17.5 20.9 24.4 26.6 * 17 54 3.9 51 - 70 . . . . . . . . . . . 651 16.3 0.72 * 8.5 9.7 12.1 15.3 19.3 24.0 27.4 * 14 60 4.0 71+ . . . . . . . . . . . . . 392 13.1 0.66 * 7.1 8.1 10.0 12.6 15.6 18.8 21.0 * 14 37 6.1
* *
19+ . . . . . . . . . . . 2380 16.8 0.32 * 9.0 10.4 12.9 16.2 20.0 24.0 26.8 * 53#
* *
Females: * *
9 - 13 . . . . . . . . . . . 597 12.0 0.68 * 6.8 7.6 9.2 11.4 14.1 17.2 19.5 * 10 66 5.4 14 - 18 . . . . . . . . . . . 677 12.1 0.42 * 6.5 7.4 9.2 11.5 14.5 17.6 19.5 * 11 56 4.4
* *
19 - 30 . . . . . . . . . . . 465 12.8 0.64 * 6.2 7.4 9.5 12.4 15.6 18.9 21.0 * 12 53 5.9 31 - 50 . . . . . . . . . . . 754 13.2 0.53 * 7.9 8.8 10.4 12.7 15.4 18.3 20.5 * 12 57 5.3 51 - 70 . . . . . . . . . . . 643 12.6 0.37 * 6.8 7.8 9.7 12.1 15.0 18.1 20.2 * 11 61 3.2 71+ . . . . . . . . . . . . . 405 10.9 0.32 * 6.1 6.9 8.4 10.4 12.8 15.4 17.1 * 11 43 3.9
* *
19+ . . . . . . . . . . . 2267 12.7 0.29 * 6.7 7.7 9.6 12.1 15.1 18.4 20.8 * 56#
* *
All persons 1+ . . . . . 8940 14.0 0.17 * * 56#
# Percentage computed as weighted average of estimates for gender/age subgroups comprising the composite group. Standard error not displayed (Appendix C).Source: What We Eat in America, NHANES 2001-2002, all individuals 1+ years, excludes breast-fed children and pregnant or lactating females. AI from reference 6.
37
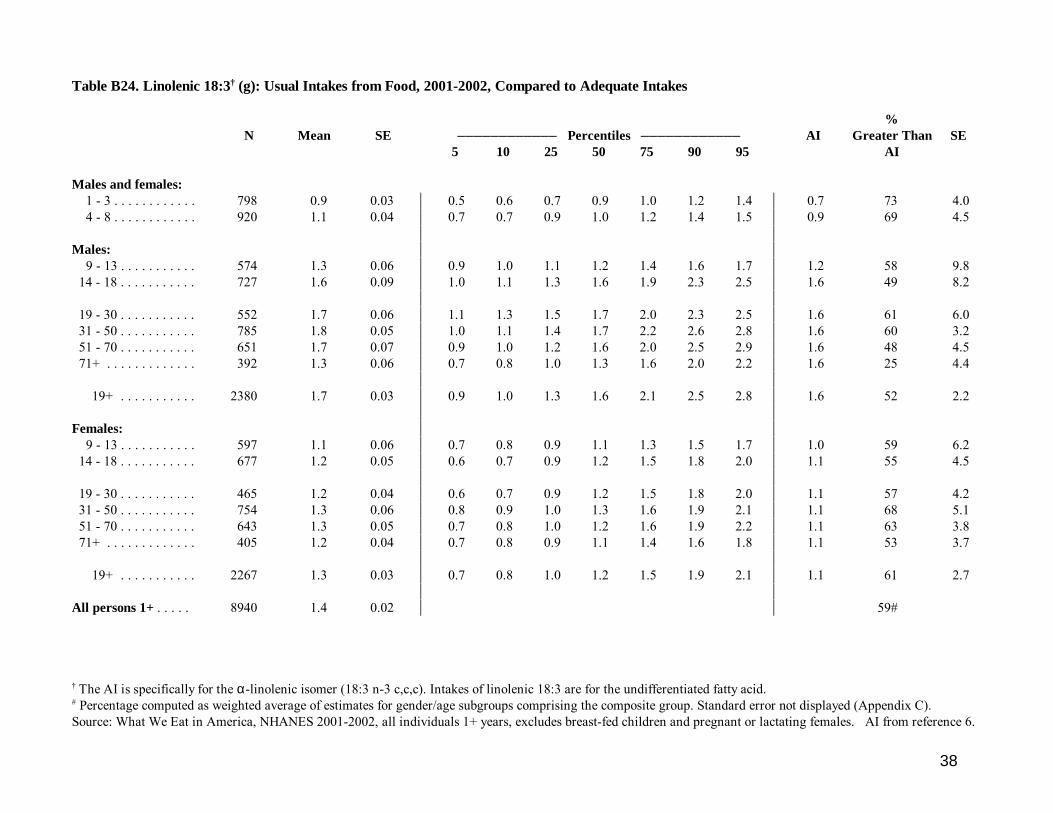
Table B24. Linolenic 18:3† (g): Usual Intakes from Food, 2001-2002, Compared to Adequate Intakes
%N Mean SE )))))))))))) Percentiles )))))))))))) AI Greater Than SE
5 10 25 50 75 90 95 AI
Males and females: 1 - 3 . . . . . . . . . . . . 798 0.9 0.03 * 0.5 0.6 0.7 0.9 1.0 1.2 1.4 * 0.7 73 4.0 4 - 8 . . . . . . . . . . . . 920 1.1 0.04 * 0.7 0.7 0.9 1.0 1.2 1.4 1.5 * 0.9 69 4.5
* *
Males: * *
9 - 13 . . . . . . . . . . . 574 1.3 0.06 * 0.9 1.0 1.1 1.2 1.4 1.6 1.7 * 1.2 58 9.8 14 - 18 . . . . . . . . . . . 727 1.6 0.09 * 1.0 1.1 1.3 1.6 1.9 2.3 2.5 * 1.6 49 8.2
* *
19 - 30 . . . . . . . . . . . 552 1.7 0.06 * 1.1 1.3 1.5 1.7 2.0 2.3 2.5 * 1.6 61 6.0 31 - 50 . . . . . . . . . . . 785 1.8 0.05 * 1.0 1.1 1.4 1.7 2.2 2.6 2.8 * 1.6 60 3.2 51 - 70 . . . . . . . . . . . 651 1.7 0.07 * 0.9 1.0 1.2 1.6 2.0 2.5 2.9 * 1.6 48 4.5 71+ . . . . . . . . . . . . . 392 1.3 0.06 * 0.7 0.8 1.0 1.3 1.6 2.0 2.2 * 1.6 25 4.4
* *
19+ . . . . . . . . . . . 2380 1.7 0.03 * 0.9 1.0 1.3 1.6 2.1 2.5 2.8 * 1.6 52 2.2* *
Females: * *
9 - 13 . . . . . . . . . . . 597 1.1 0.06 * 0.7 0.8 0.9 1.1 1.3 1.5 1.7 * 1.0 59 6.2 14 - 18 . . . . . . . . . . . 677 1.2 0.05 * 0.6 0.7 0.9 1.2 1.5 1.8 2.0 * 1.1 55 4.5
* *
19 - 30 . . . . . . . . . . . 465 1.2 0.04 * 0.6 0.7 0.9 1.2 1.5 1.8 2.0 * 1.1 57 4.2 31 - 50 . . . . . . . . . . . 754 1.3 0.06 * 0.8 0.9 1.0 1.3 1.6 1.9 2.1 * 1.1 68 5.1 51 - 70 . . . . . . . . . . . 643 1.3 0.05 * 0.7 0.8 1.0 1.2 1.6 1.9 2.2 * 1.1 63 3.8 71+ . . . . . . . . . . . . . 405 1.2 0.04 * 0.7 0.8 0.9 1.1 1.4 1.6 1.8 * 1.1 53 3.7
* *
19+ . . . . . . . . . . . 2267 1.3 0.03 * 0.7 0.8 1.0 1.2 1.5 1.9 2.1 * 1.1 61 2.7* *
All persons 1+ . . . . . 8940 1.4 0.02 * * 59#
† The AI is specifically for the α-linolenic isomer (18:3 n-3 c,c,c). Intakes of linolenic 18:3 are for the undifferentiated fatty acid.# Percentage computed as weighted average of estimates for gender/age subgroups comprising the composite group. Standard error not displayed (Appendix C).Source: What We Eat in America, NHANES 2001-2002, all individuals 1+ years, excludes breast-fed children and pregnant or lactating females. AI from reference 6.
38
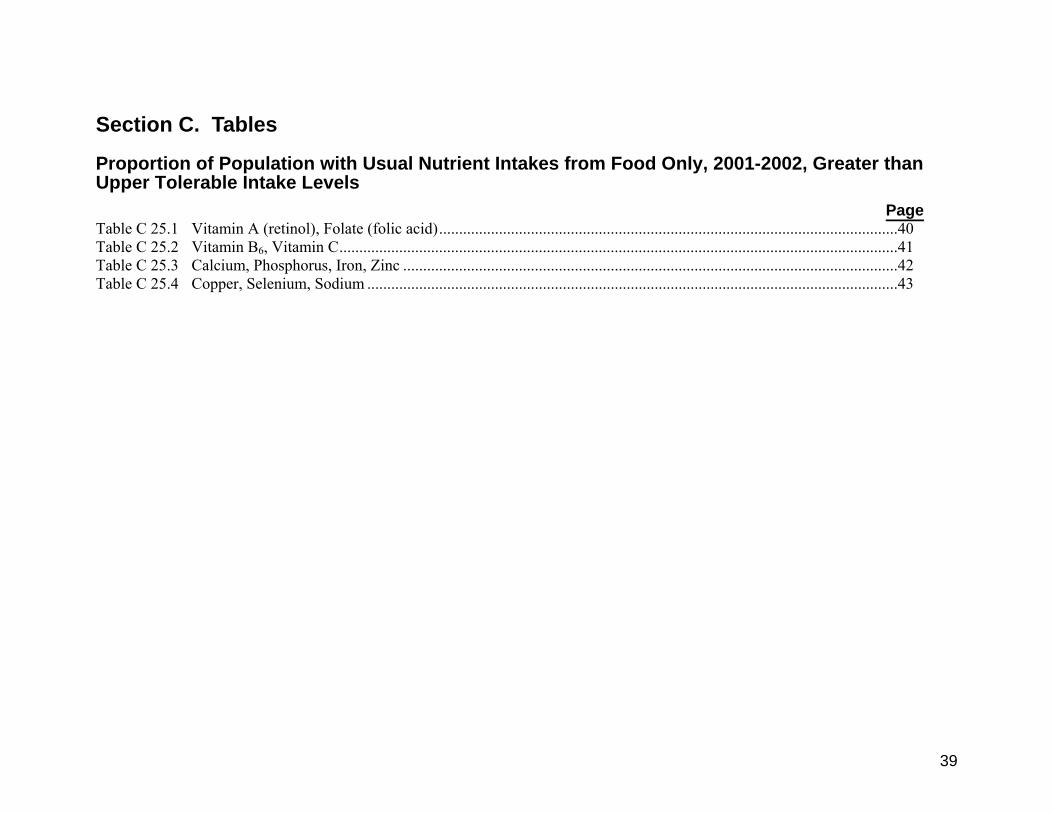
Section C. Tables
Proportion of Population with Usual Nutrient Intakes from Food Only, 2001-2002, Greater than Upper Tolerable Intake Levels Page Table C 25.1 Vitamin A (retinol), Folate (folic acid)...................................................................................................................40Table C 25.2 Vitamin B6, Vitamin C............................................................................................................................................41Table C 25.3 Calcium, Phosphorus, Iron, Zinc ............................................................................................................................42Table C 25.4 Copper, Selenium, Sodium .....................................................................................................................................43
39
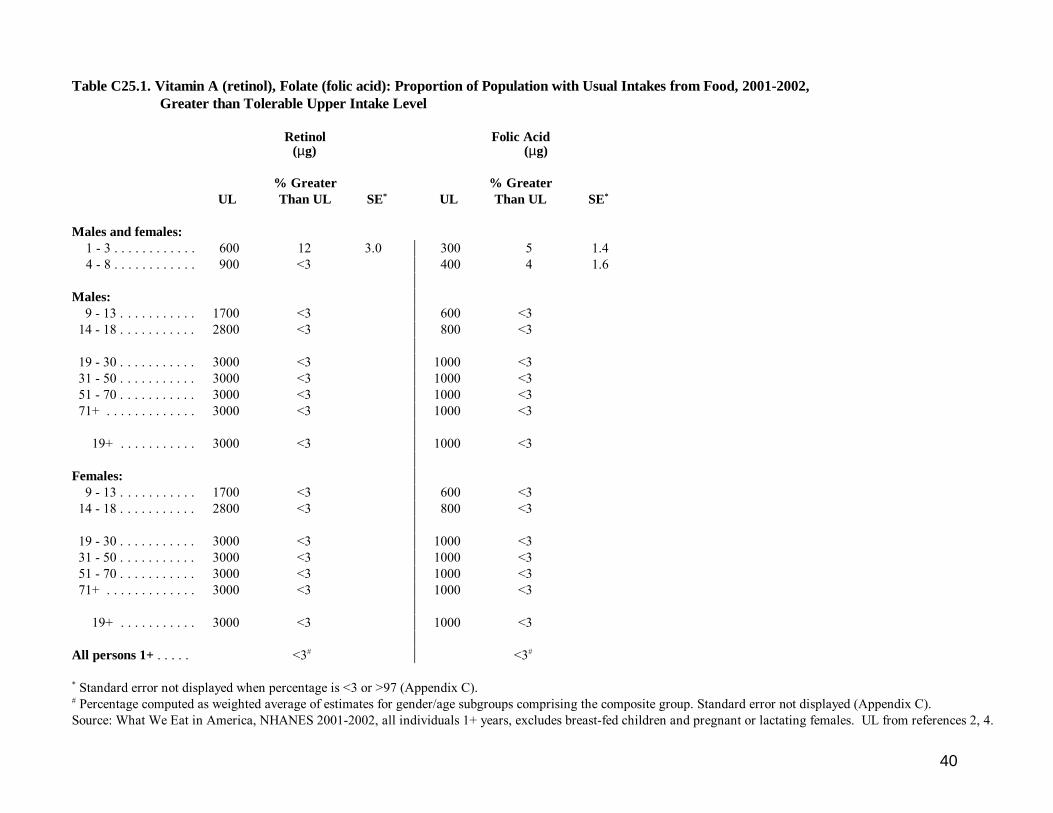
Table C25.1. Vitamin A (retinol), Folate (folic acid): Proportion of Population with Usual Intakes from Food, 2001-2002, Greater than Tolerable Upper Intake Level
Retinol Folic Acid(µg) (µg)
% Greater % GreaterUL Than UL SE* UL Than UL SE*
Males and females: 1 - 3 . . . . . . . . . . . . 600 12 3.0 * 300 5 1.4 4 - 8 . . . . . . . . . . . . 900 <3 * 400 4 1.6
*
Males: *
9 - 13 . . . . . . . . . . . 1700 <3 * 600 <3 14 - 18 . . . . . . . . . . . 2800 <3 * 800 <3
*
19 - 30 . . . . . . . . . . . 3000 <3 * 1000 <3 31 - 50 . . . . . . . . . . . 3000 <3 * 1000 <3 51 - 70 . . . . . . . . . . . 3000 <3 * 1000 <3 71+ . . . . . . . . . . . . . 3000 <3 * 1000 <3
*
19+ . . . . . . . . . . . 3000 <3 * 1000 <3*
Females: *
9 - 13 . . . . . . . . . . . 1700 <3 * 600 <3 14 - 18 . . . . . . . . . . . 2800 <3 * 800 <3
*
19 - 30 . . . . . . . . . . . 3000 <3 * 1000 <3 31 - 50 . . . . . . . . . . . 3000 <3 * 1000 <3 51 - 70 . . . . . . . . . . . 3000 <3 * 1000 <3 71+ . . . . . . . . . . . . . 3000 <3 * 1000 <3
*
19+ . . . . . . . . . . . 3000 <3 * 1000 <3*
All persons 1+ . . . . . <3#* <3#
* Standard error not displayed when percentage is <3 or >97 (Appendix C).# Percentage computed as weighted average of estimates for gender/age subgroups comprising the composite group. Standard error not displayed (Appendix C).Source: What We Eat in America, NHANES 2001-2002, all individuals 1+ years, excludes breast-fed children and pregnant or lactating females. UL from references 2, 4.
40
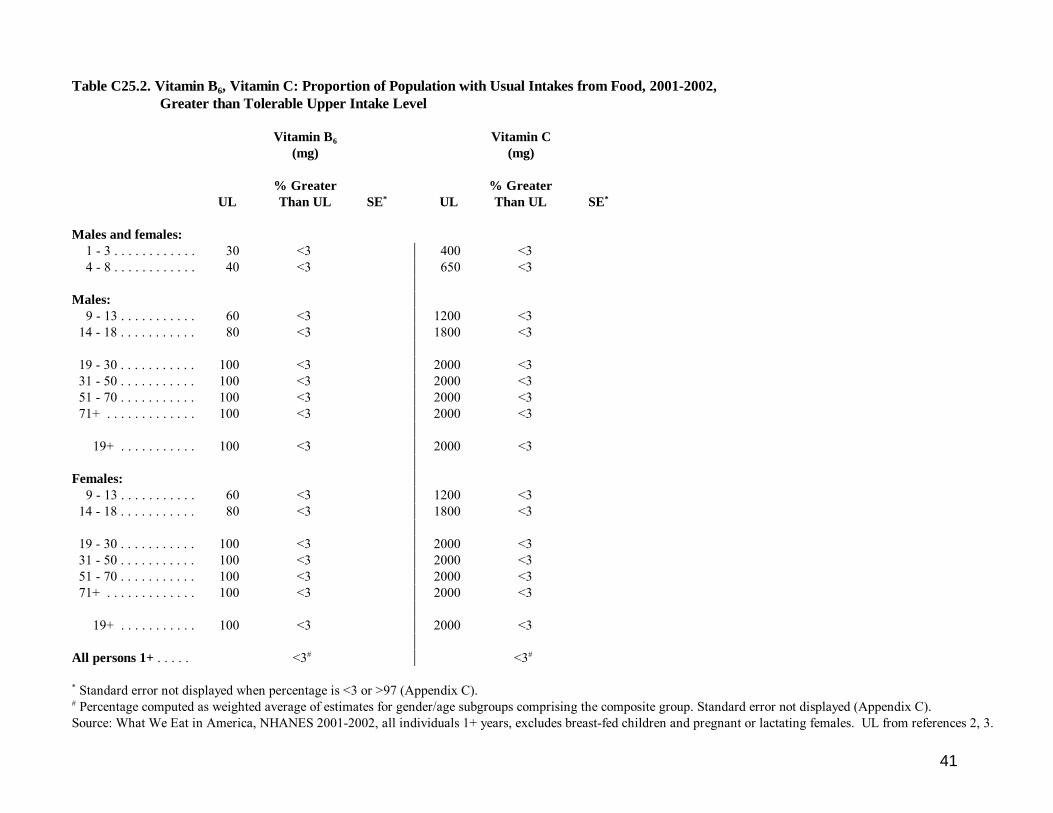
Table C25.2. Vitamin B6, Vitamin C: Proportion of Population with Usual Intakes from Food, 2001-2002, Greater than Tolerable Upper Intake Level
Vitamin B6 Vitamin C(mg) (mg)
% Greater % GreaterUL Than UL SE* UL Than UL SE*
Males and females: 1 - 3 . . . . . . . . . . . . 30 <3 * 400 <3 4 - 8 . . . . . . . . . . . . 40 <3 * 650 <3
*
Males: *
9 - 13 . . . . . . . . . . . 60 <3 * 1200 <3 14 - 18 . . . . . . . . . . . 80 <3 * 1800 <3
*
19 - 30 . . . . . . . . . . . 100 <3 * 2000 <3 31 - 50 . . . . . . . . . . . 100 <3 * 2000 <3 51 - 70 . . . . . . . . . . . 100 <3 * 2000 <3 71+ . . . . . . . . . . . . . 100 <3 * 2000 <3
*
19+ . . . . . . . . . . . 100 <3 * 2000 <3*
Females: *
9 - 13 . . . . . . . . . . . 60 <3 * 1200 <3 14 - 18 . . . . . . . . . . . 80 <3 * 1800 <3
*
19 - 30 . . . . . . . . . . . 100 <3 * 2000 <3 31 - 50 . . . . . . . . . . . 100 <3 * 2000 <3 51 - 70 . . . . . . . . . . . 100 <3 * 2000 <3 71+ . . . . . . . . . . . . . 100 <3 * 2000 <3
*
19+ . . . . . . . . . . . 100 <3 * 2000 <3*
All persons 1+ . . . . . <3#* <3#
* Standard error not displayed when percentage is <3 or >97 (Appendix C).# Percentage computed as weighted average of estimates for gender/age subgroups comprising the composite group. Standard error not displayed (Appendix C).Source: What We Eat in America, NHANES 2001-2002, all individuals 1+ years, excludes breast-fed children and pregnant or lactating females. UL from references 2, 3.
41
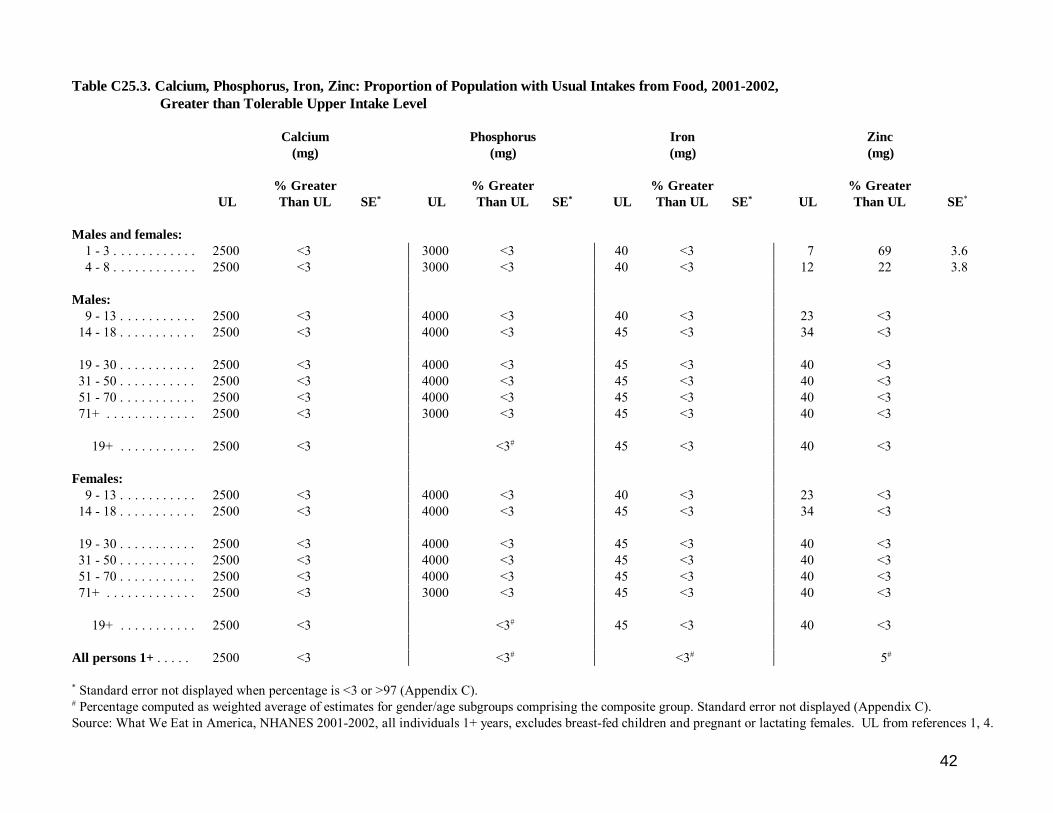
Table C25.3. Calcium, Phosphorus, Iron, Zinc: Proportion of Population with Usual Intakes from Food, 2001-2002, Greater than Tolerable Upper Intake Level
Calcium Phosphorus Iron Zinc(mg) (mg) (mg) (mg)
% Greater % Greater % Greater % GreaterUL Than UL SE* UL Than UL SE* UL Than UL SE* UL Than UL SE*
Males and females: 1 - 3 . . . . . . . . . . . . 2500 <3 * 3000 <3 * 40 <3 * 7 69 3.6 4 - 8 . . . . . . . . . . . . 2500 <3 * 3000 <3 * 40 <3 * 12 22 3.8
* * *
Males: * * *
9 - 13 . . . . . . . . . . . 2500 <3 * 4000 <3 * 40 <3 * 23 <3 14 - 18 . . . . . . . . . . . 2500 <3 * 4000 <3 * 45 <3 * 34 <3
* * *
19 - 30 . . . . . . . . . . . 2500 <3 * 4000 <3 * 45 <3 * 40 <3 31 - 50 . . . . . . . . . . . 2500 <3 * 4000 <3 * 45 <3 * 40 <3 51 - 70 . . . . . . . . . . . 2500 <3 * 4000 <3 * 45 <3 * 40 <3 71+ . . . . . . . . . . . . . 2500 <3 * 3000 <3 * 45 <3 * 40 <3
* * *
19+ . . . . . . . . . . . 2500 <3 * <3#* 45 <3 * 40 <3
* * *
Females: * * *
9 - 13 . . . . . . . . . . . 2500 <3 * 4000 <3 * 40 <3 * 23 <3 14 - 18 . . . . . . . . . . . 2500 <3 * 4000 <3 * 45 <3 * 34 <3
* * *
19 - 30 . . . . . . . . . . . 2500 <3 * 4000 <3 * 45 <3 * 40 <3 31 - 50 . . . . . . . . . . . 2500 <3 * 4000 <3 * 45 <3 * 40 <3 51 - 70 . . . . . . . . . . . 2500 <3 * 4000 <3 * 45 <3 * 40 <3 71+ . . . . . . . . . . . . . 2500 <3 * 3000 <3 * 45 <3 * 40 <3
* * *
19+ . . . . . . . . . . . 2500 <3 * <3#* 45 <3 * 40 <3
* * *
All persons 1+ . . . . . 2500 <3 * <3#* <3#
* 5#
* Standard error not displayed when percentage is <3 or >97 (Appendix C).# Percentage computed as weighted average of estimates for gender/age subgroups comprising the composite group. Standard error not displayed (Appendix C).Source: What We Eat in America, NHANES 2001-2002, all individuals 1+ years, excludes breast-fed children and pregnant or lactating females. UL from references 1, 4.
42
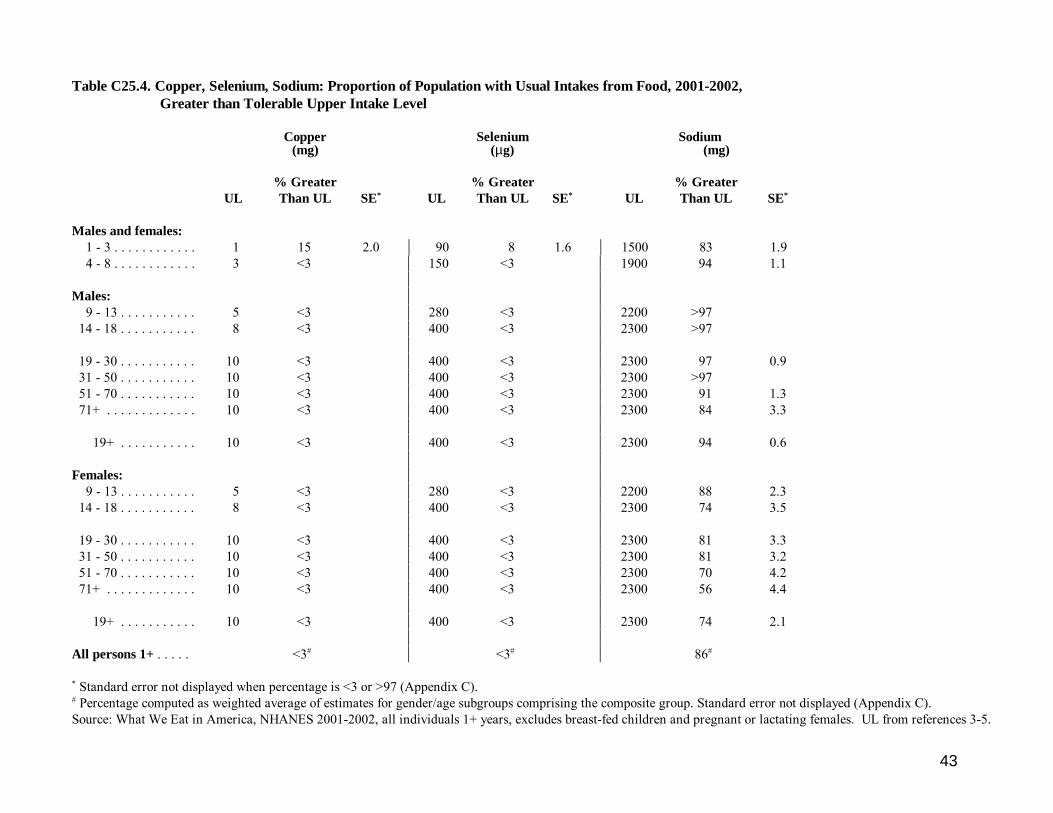
Table C25.4. Copper, Selenium, Sodium: Proportion of Population with Usual Intakes from Food, 2001-2002, Greater than Tolerable Upper Intake Level
Copper Selenium Sodium(mg) (µg) (mg)
% Greater % Greater % GreaterUL Than UL SE* UL Than UL SE* UL Than UL SE*
Males and females: 1 - 3 . . . . . . . . . . . . 1 15 2.0 * 90 8 1.6 * 1500 83 1.9 4 - 8 . . . . . . . . . . . . 3 <3 * 150 <3 * 1900 94 1.1
* *
Males: * *
9 - 13 . . . . . . . . . . . 5 <3 * 280 <3 * 2200 >97 14 - 18 . . . . . . . . . . . 8 <3 * 400 <3 * 2300 >97
* *
19 - 30 . . . . . . . . . . . 10 <3 * 400 <3 * 2300 97 0.9 31 - 50 . . . . . . . . . . . 10 <3 * 400 <3 * 2300 >97 51 - 70 . . . . . . . . . . . 10 <3 * 400 <3 * 2300 91 1.3 71+ . . . . . . . . . . . . . 10 <3 * 400 <3 * 2300 84 3.3
* *
19+ . . . . . . . . . . . 10 <3 * 400 <3 * 2300 94 0.6* *
Females: * *
9 - 13 . . . . . . . . . . . 5 <3 * 280 <3 * 2200 88 2.3 14 - 18 . . . . . . . . . . . 8 <3 * 400 <3 * 2300 74 3.5
* *
19 - 30 . . . . . . . . . . . 10 <3 * 400 <3 * 2300 81 3.3 31 - 50 . . . . . . . . . . . 10 <3 * 400 <3 * 2300 81 3.2 51 - 70 . . . . . . . . . . . 10 <3 * 400 <3 * 2300 70 4.2 71+ . . . . . . . . . . . . . 10 <3 * 400 <3 * 2300 56 4.4
* *
19+ . . . . . . . . . . . 10 <3 * 400 <3 * 2300 74 2.1* *
All persons 1+ . . . . . <3#* <3#
* 86#
* Standard error not displayed when percentage is <3 or >97 (Appendix C).# Percentage computed as weighted average of estimates for gender/age subgroups comprising the composite group. Standard error not displayed (Appendix C).Source: What We Eat in America, NHANES 2001-2002, all individuals 1+ years, excludes breast-fed children and pregnant or lactating females. UL from references 3-5.
43

Appendix A. Sample Counts and Weighted Population Estimates of What We Eat in America, NHANES 2001-2002 Sample Weighted Population Count Estimate (%) Males and females: Under 1, breastfeeding . . . . . . . . . . . . 158 0.5 Under 1, not breastfeeding . . . . . . . . . 378 1.0 1 – 3, breastfeeding . . . . . . . . . . . . . . . 24 0.1 1 – 3, not breastfeeding . . . . . . . . . . . . 798 4.2 4 - 8 . . . . . . . . . . . . . . . . . . . . . . . . . . . 920 6.9 Males: 9 - 13 . . . . . . . . . . . . . . . . . . . . . . . . . . 574 3.8 14 - 18 . . . . . . . . . . . . . . . . . . . . . . . . . . 727 3.8 19 - 30 . . . . . . . . . . . . . . . . . . . . . . . . . . 552 8.0 31 - 50 . . . . . . . . . . . . . . . . . . . . . . . . . . 785 15.5 51 - 70 . . . . . . . . . . . . . . . . . . . . . . . . . . 651 8.5 71+ . . . . . . . . . . . . . . . . . . . . . . . . . . . . 392 2.8 19+ . . . . . . . . . . . . . . . . . . . . . . . . . . 2380 34.8 Females, not pregnant or lactating: 9 - 13 . . . . . . . . . . . . . . . . . . . . . . . . . . 597 3.8 14 - 18 . . . . . . . . . . . . . . . . . . . . . . . . . . 677 3.4 19 - 30 . . . . . . . . . . . . . . . . . . . . . . . . . . 465 7.6 31 - 50 . . . . . . . . . . . . . . . . . . . . . . . . . . 754 14.5 51 - 70 . . . . . . . . . . . . . . . . . . . . . . . . . . 643 9.4 71+ . . . . . . . . . . . . . . . . . . . . . . . . . . . . 405 4.0 19+ . . . . . . . . . . . . . . . . . . . . . . . . . . 2267 35.6 All persons 1+ used for report . . . . . . . 8940 96.1 Females, pregnant or lactating: 18 and younger . . . . . . . . . . . . . . . . . . . 35 0.1 19 - 30 . . . . . . . . . . . . . . . . . . . . . . . . . . 252 1.6 31 - 50 . . . . . . . . . . . . . . . . . . . . . . . . . . 96 0.6 50 and younger . . . . . . . . . . . . . . . . . 383 2.3
All ages with complete intakes . . . . . . . . 9883 100.0 Numbers and text in italics refer to respondents excluded from the analyses presented in this report.
44

Appendix B. Procedure for Usual Intake Estimation Overview of the General Method for Usual Intake Estimation The method and software used to estimate the usual nutrient intake distributions presented in this report were developed by Iowa State University (10) through a cooperative agreement with the Agricultural Research Service. The software, C-SIDE version 1.02, Software for Intake Distribution Estimation (12), was used to estimate the usual nutrient intake distributions and percentiles and to estimate the percentage of a population group with inadequate intakes based on the EAR, and with intakes at or greater than the AI or greater than the UL. The following is a general summary of the usual intake estimation method as implemented by C-SIDE.
1. Preliminary data adjustments Preliminary data adjustments include shifting observed intake data by a small amount away from zero, incorporating survey weights, and correcting for the effect of the sample day (Day 1 versus Day 2) on the mean and the variance of the distribution of observed intakes. Adjustment may also be made for differences in diet due to non-person specific effects such as seasonality or weekend-versus-weekday eating patterns.
2. Transformation to normality Observed intake data (whether adjusted or not) generally have nonnormal distributions. For certain nutrients, skewness is quite extreme. Most statistical procedures rely on an assumption of normality. At this step the adjusted dietary intake data are transformed into normality. This is done in a two-step process. First, a power or log transformation is used to transform the data as close to normal as possible. Second, a nonparametric transformation, based on a grafted polynomial model, takes the power-transformed data into normality.
3. Estimation of within- and between-individual variances in intakes A measurement error model is used, under the assumption of normality, to obtain estimates for the components of within- and between-individual variances. The variance components are used to estimate the distribution of usual intakes in the normal scale, which is assumed to exhibit only between-individual variation.
45
4. Back-transformation into the original scale The final step is to transform the estimated usual intake distribution from the normal scale into the original scale. This inverse transformation ensures that the mean of the original intakes is retained in the usual intake distribution transformed back to the original scale.
The Process Used to Produce the Estimates in this Report
Introduction The usual intake estimation procedure requires multiple days of nutrient intake data for at least a representative subsample of individuals in the group in order to separate the total variation in intake into within- and between-individual components. As described in the public release of WWEIA, NHANES 2001-2002 (8), dietary intakes were collected for two 24-hour periods beginning in 2002 while only one 24-hour intake per individual was collected in 2001. As a precaution to protect the confidentiality of survey participants, single-year data from NHANES are not released for public use. For that reason, only Day 1 interview data are included in the WWEIA, NHANES 2001-2002 release. Restricted data, such as the 2002 Day 2 dietary data, may be made available at the Research Data Center, National Center for Health Statistics, Hyattsville, MD (14), and were available to the authors of this report. A two-step process was followed to produce the results presented in this report. • Step 1 Within-individual variances were estimated through the usual intake procedure for each nutrient and gender/age group
using the 2-day intake data from 2002. • Step 2 The full set of day 1 intakes from WWEIA, NHANES 2001-2002 was analyzed with C-SIDE, using the variance
components estimated from step 1 as additional inputs, to produce estimated usual intake distributions and to make comparisons to the DRIs.
Within-individual Variance Component Estimates The within-individual variance component estimates produced in step 1 are available on the Food Surveys Research Group website at www.ars.usda.gov/foodsurvey so that analysts without access to the restricted data may still compute their own estimates of usual intake from WWEIA, NHANES 2001-2002 or from other data for which only one day of intake per person is available.
Computer and Programming Environment All programs were run on a Sun UltraSparc II computer using the Solaris 8 version of the UNIX operating system with the exception of the generation of the sampling weights. C-SIDE version 1.02 was used for the usual intake estimation. C-SIDE has a window-based user interface but a batch approach was used for convenience as a separate run is necessary for each nutrient/population group combination. That is, separate C-SIDE programs were written and run in the background and the output directed to separate output files rather than interactively entering information for each run through the user interface. Note that it is possible to run multiple analyses within a single C-SIDE program but not easily under these circumstances where not all analyses use the same settings. Thus, each nutrient/population group combination was analyzed through a separate C-SIDE program. SAS® version 8.2 (15) and file and data manipulation capabilities of UNIX were used to prepare the data files used as input for C-SIDE, generate the individual C-SIDE programs, control the running of the programs, compile the results from the individual program output files, and prepare the tables of statistics included in this report. The sampling weights were calibrated and jackknife replicates were generated using WesVar® version 4.2 (16) on a personal computer running the Windows XP operating system. Sampling Weights The use of sampling weights is suggested when estimating usual intakes from WWEIA, NHANES 2001-2002 just as their use is suggested for other analyses of NHANES data. As with other large-scale surveys with a complex sample design, sampling weights may compensate for variable probabilities of selection, differential nonresponse rates, and possible deficiencies in the sampling frame. C-SIDE allows for the use of sampling weights in estimating usual intake statistics. The basic sampling weights provided with NHANES data (known as MEC weights) are intended for the analysis of data collected at the Mobile Examination Center. The dietary intake data are collected at this level. As with most sampling weights for data from complex sample designs, the MEC weights were calculated from the base probabilities of selection, adjusted for nonresponse, and calibrated through poststratification to match population control totals. Poststratification is a process in which respondents are placed into non-overlapping categories, or poststratification cells, and their weights are adjusted so that the sums of the adjusted weights are equal to population totals within each cell.
47
For this report, the MEC weights were re-calibrated through poststratification to create sets of weights for only the subsets of individuals providing complete dietary intakes. The poststratification also included an adjustment for day of the week by assuming weekday intakes (Monday - Thursday) comprise 4/7ths of all intakes and weekend intakes (Friday - Sunday) comprise 3/7ths of all intakes. The weights used for step 1 were constructed by re-calibrating MEC weights originally constructed for the 2002 sample and the weights for step 2 were constructed by re-calibrating the MEC weights from the public release. The poststratification cells and target counts used for both of these calibrations are provided in Appendix Table B1. The target counts were calculated by summing the original MEC weights for all examinees in the NHANES 2001-2002 data set within each of the poststratification cells. WesVar software was used to poststratify the weights. The WesVar software was also used to construct jackknife replicate weights for step 2. C-SIDE can estimate standard errors of means or percentages using either a jackknife or a balanced repeated replication method. The standard errors of the mean and of the estimates of the percentage of individuals less than the EAR or at or greater than the AI or greater than the UL provided in this report were computed by a jackknife replication method using these weights. The type of jackknife method used was the delete-one method, called JK1 in WesVar. This method places each unit into one of G subsets. Replicates are formed by deleting one group at a time and multiplying the weights for the other groups by the appropriate factor. For this report, the replicate groups were defined by the combination of the masked variance strata and PSUs from the demographics file (WTMVSTRA, WTMVPSU). There are 2 masked variance PSUs within each of 15 masked variance strata so a set of 30 JK1 replicate weights was constructed. The replicates were calibrated to the same population totals from Appendix Table B1 as the full-sample weight. Because within-individual variances were the only interest in step 1, it was not necessary to create a set of replicate weights from the 2002 sampling weights.
48
C-SIDE Application A variety of parameters may be set for a C-SIDE analysis. Generally, the default settings were used for this analysis but modification to parameters affecting the transformation of the observed intakes to normality was necessary in some cases. Among the parameters controlling the transformation of the observed intakes to normality are the minimum number of join points referred to as MINJP, allowed when fitting a grafted polynomial function to a normal probability plot and the type I error rate (alpha in most statistics textbooks) used to test significance with an Anderson-Darling test for normality. In the C-SIDE programs this second parameter is identified as ADALPHA. The default value for ADALPHA is 0.15 and error rates of 0.10, 0.05, and 0.01 are also available. C-SIDE is designed to halt if the Anderson-Darling test fails at the significance level defined by ADALPHA although this feature may be overridden by setting ADALPHA = 0. It is less likely that intakes that are transformed by a transformation that fails the Anderson-Darling test at the default value of ADALPHA but do not fail at a lower value of ADALPHA come from a normal distribution. The procedure followed for this report was to use the default value of ADALPHA = 0.15 unless the test failed. If that happened, ADALPHA was set to the next lower value for which the test did not fail and MINJP was set to the number of join points C-SIDE used in fitting the polynomial. This adjustment was necessary for a small percentage of the usual intake distributions estimated. Furthermore, it was found that some of the polynomial fits that required this modification in settings resulted in distributions with unstable variance estimates. For these, the minimum number of join points was lowered until a stable estimate was computed. As part of the initial data adjustment, C-SIDE makes available a ratio adjustment to partially remove the effects of classification variables. This was applied for the day of the week variable through a CLASS statement although the primary adjustment for day of the week was made through the re-calibrated sampling weights.
49
The usual intake estimations of step 1 from 2002 two-day data used C-SIDE as described in the preceding paragraphs. The estimations of step 2 from 2001-2002 one-day data required two changes to normal use of C-SIDE to allow incorporation of the within-individual variance components estimated in step 1. First, because C-SIDE requires input data files to contain intake data for more than one day for at least some individuals, an input file was constructed that contained the full set of Day 1 intake data for all of the individuals included in the analysis, as well as a second set of the same intake data, but identified as having been collected on a second day. Applying C-SIDE to this data set in the normal manner would produce a zero estimate for the within-individual component of variance because the intake on the “second day” is the same as on the first for each individual. Therefore, the within-individual variance components were supplied as external inputs to C-SIDE using the parameter settings described below. PEVCR = within-individual variance component from step 1 NPEVCR = 999999 (forces C-SIDE to use the external estimate of within-individual variance) FXHETVAR = N (turns off the correction for heterogeneous within-individual variances -
necessary because of the duplicate Day 2 records in the input file) The procedure for supplying external variance components to facilitate analysis of one-day data was provided by Dr. Kevin W. Dodd (17) at the National Cancer Institute, who was one of the developers of C-SIDE. The ability of C-SIDE to operate in this fashion is an undocumented feature of the software. Versions of C-SIDE later than 1.02 may use different settings to obtain the same behavior, and may expand on this functionality. The replicate weights along with the full-sample weight were used so that standard errors of the mean and the percentages may be computed. The percentage less than or greater than a specified value and its standard error is requested in a RUN statement within a C-SIDE program. For this report, a separate program was used when a comparison to a UL was needed for an analysis that also included a comparison to an EAR or AI. The resulting estimates are included in the C-SIDE output listing.
50
Special Situation - Iron and the probability approach The assumptions necessary for the use of the EAR cut-point method appear to be met for each of the nutrients analyzed with respect to an EAR with the exception of iron. It is expected that the distribution of requirements for menstruating females, and potentially other gender-age groups, is not normal or necessarily symmetric, and the process used to derive the EAR and the corresponding RDA for iron was therefore different than the process used for other nutrients. Essentially, the distribution of requirements was simulated through a Monte Carlo process and the EAR and RDA were derived from those distributions as the 50th and 97.5th percentiles of the simulated distribution. (4) Because of this asymmetry in the distribution of iron requirements, the probability approach (4, 7) rather than the EAR cut-point method was used for the analysis of iron intake. The implementation of this approach was possible because tables of the risk of inadequate intake for specified ranges of the usual intake of iron are provided in the IOM report on iron DRIs (4). The following summarizes how the use of the probability approach to compare intakes with the EAR was implemented for this report:
• C-SIDE was used to estimate the usual intake distribution as described above. In addition, a file containing the intake value at 499 evenly spaced percentiles was generated.
• Graphically, a plot of the percentile values approximates the density curve of the intake distribution. The area under the curve
between two intake values on the x-axis is the percentage of the population with usual intake in that range.
• The probability of risk tables provide a risk associated with specified ranges of intake. If these ranges coincided with the points in the density curve it would be necessary simply to multiply the risk by the percentage of the population (i.e., area under the curve) for each range and sum the resulting products to estimate the total risk of inadequacy of intake.
• The endpoints of the ranges in the tables do not necessarily match the percentile values but density values for the range
endpoints may be interpolated from the percentile values. This permits the calculation described above.
• The interpolation was made by assuming an approximation of the density curve by a straight line between two adjacent percentiles. The calculation of the area under the density curve was made by the trapezoid method.
• Standard errors were not produced for estimates made with the probability approach.
51
Special Situation – Protein-to-Body Weight Ratios The EAR for protein is derived and stated in terms of grams of protein per kilogram of body weight as well as in grams of protein per day using reference body weights for each gender-age group (6). Using the cut point method, the distribution of protein to body weight ratios in the population (adjusted for usual intake) was compared to the EAR to determine the percentage of the population with inadequate protein intakes. The EAR was assumed to refer to ratios based on body weights falling within the healthy weight range. Thus, actual body weight was not used to compute an individual’s protein-to-body weight ratio when it fell outside of the healthy range. Instead, the weight that would place the individual at the nearest endpoint of the healthy weight range was used as follows:
• For adults ages 19 years and older, body mass index (BMI) was used to define the healthy weight range. If an individual’s BMI was below 18.5 or at or above 25.0, their actual weight was assumed to be outside of the healthy range. In this case, the weight that would place them at the nearest BMI cut point, given their height, was used instead of their actual weight in computing protein-to-body weight ratio.
• For children ages 4-18 years, a comparison to the 2000 CDC growth charts through the CDC BMI percentile program (18)
was used to determine the healthy range. The healthy range for this age group is defined as the 5th to the 85th percentile of the appropriate growth curve. When the BMI was outside of this range, the weight that would place the respondent at the nearest endpoint given their height was used.
• For children ages 1-3 years, an exception was necessary because standing height (and thus BMI) was not available from
NHANES for all children in this age group. For consistency, the protein to body weight ratio was computed as protein intake divided by 12 kg, the body weight of the reference person age 1-3 (6), for all children in this age range.
Not every WWEIA respondent ages 4 years and older has a value for BMI in the NHANES data set. The estimation of usual intake of protein in this report for gender/age groups comprised of persons 4 years of age or older excludes respondents without a BMI value in the NHANES data set.
52
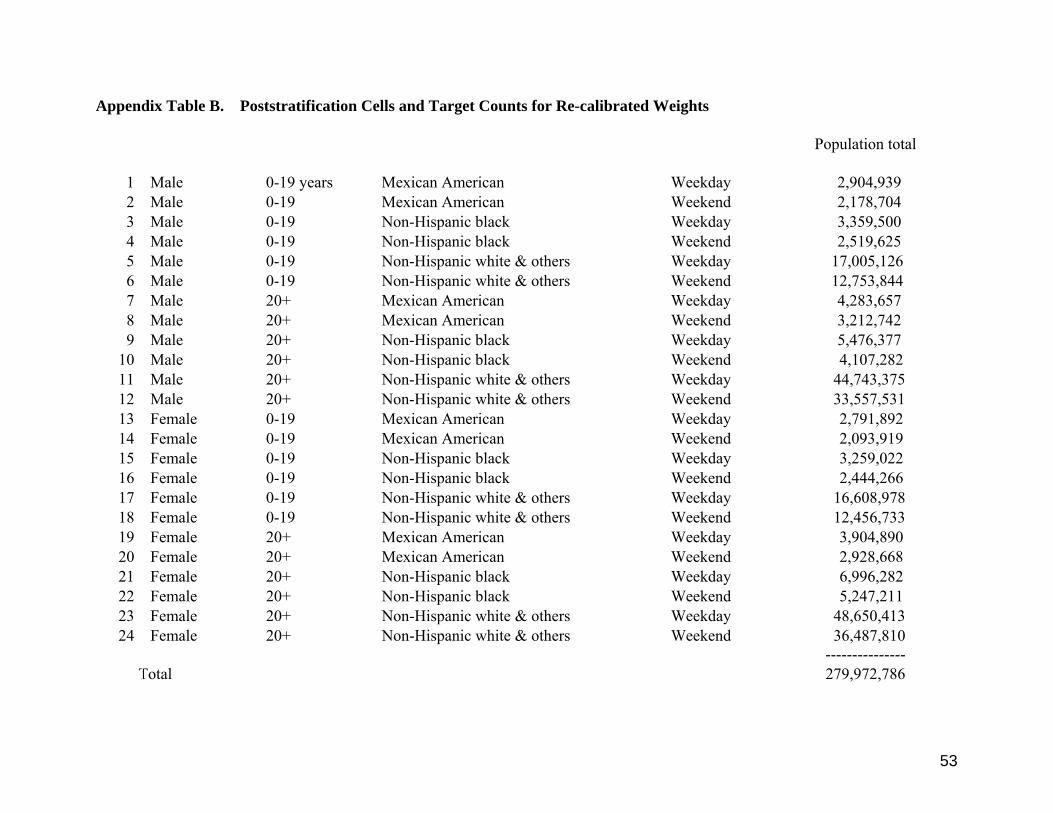
Appendix Table B. Poststratification Cells and Target Counts for Re-calibrated Weights
Population total
1 Male 0-19 years Mexican American Weekday 2,904,939 2 Male 0-19 Mexican American Weekend 2,178,704 3 Male 0-19 Non-Hispanic black Weekday 3,359,500 4 Male 0-19 Non-Hispanic black Weekend 2,519,625 5 Male 0-19 Non-Hispanic white & others Weekday 17,005,126 6 Male 0-19 Non-Hispanic white & others Weekend 12,753,844 7 Male 20+ Mexican American Weekday 4,283,657 8 Male 20+ Mexican American Weekend 3,212,742 9 Male 20+ Non-Hispanic black Weekday 5,476,377
10 Male 20+ Non-Hispanic black Weekend 4,107,282 11 Male 20+ Non-Hispanic white & others Weekday 44,743,375 12 Male 20+ Non-Hispanic white & others Weekend 33,557,531 13 Female 0-19 Mexican American Weekday 2,791,892 14 Female 0-19 Mexican American Weekend 2,093,919 15 Female 0-19 Non-Hispanic black Weekday 3,259,022 16 Female 0-19 Non-Hispanic black Weekend 2,444,266 17 Female 0-19 Non-Hispanic white & others Weekday 16,608,978 18 Female 0-19 Non-Hispanic white & others Weekend 12,456,733 19 Female 20+ Mexican American Weekday 3,904,890 20 Female 20+ Mexican American Weekend 2,928,668 21 Female 20+ Non-Hispanic black Weekday 6,996,282 22 Female 20+ Non-Hispanic black Weekend 5,247,211 23 Female 20+ Non-Hispanic white & others Weekday 48,650,413 24 Female 20+ Non-Hispanic white & others Weekend 36,487,810
--------------- Total 279,972,786
53
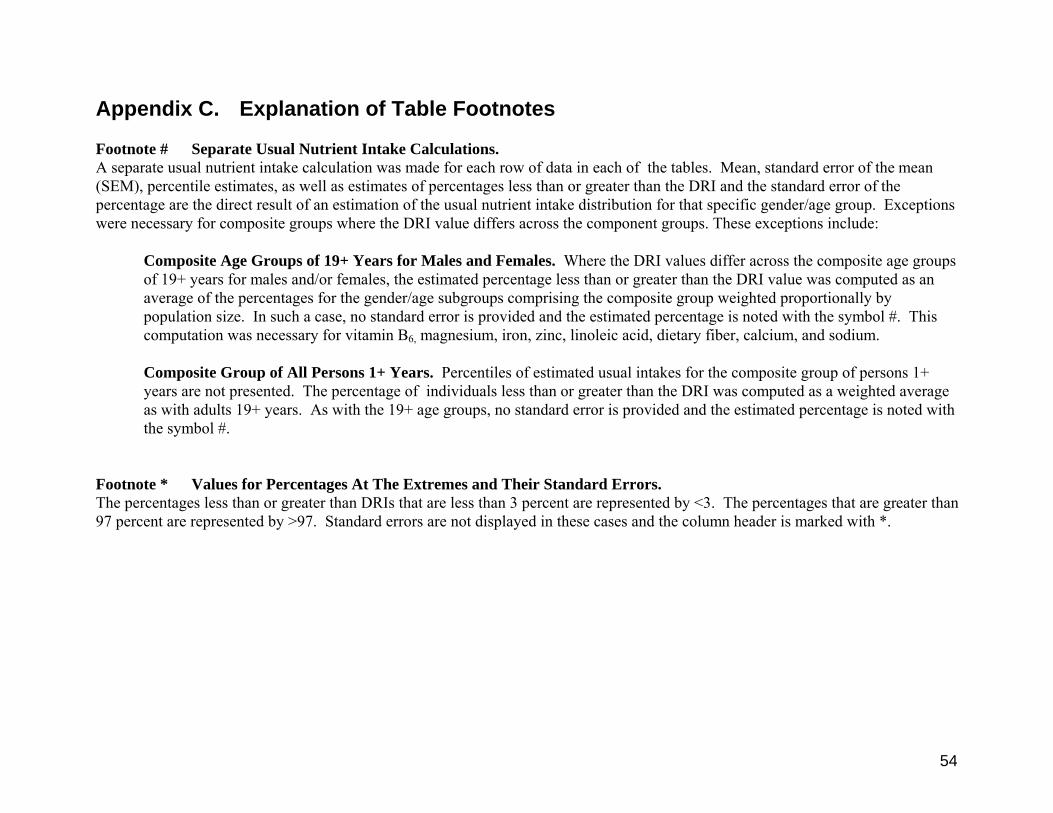
Appendix C. Explanation of Table Footnotes Footnote # Separate Usual Nutrient Intake Calculations. A separate usual nutrient intake calculation was made for each row of data in each of the tables. Mean, standard error of the mean (SEM), percentile estimates, as well as estimates of percentages less than or greater than the DRI and the standard error of the percentage are the direct result of an estimation of the usual nutrient intake distribution for that specific gender/age group. Exceptions were necessary for composite groups where the DRI value differs across the component groups. These exceptions include:
Composite Age Groups of 19+ Years for Males and Females. Where the DRI values differ across the composite age groups of 19+ years for males and/or females, the estimated percentage less than or greater than the DRI value was computed as an average of the percentages for the gender/age subgroups comprising the composite group weighted proportionally by population size. In such a case, no standard error is provided and the estimated percentage is noted with the symbol #. This computation was necessary for vitamin B6, magnesium, iron, zinc, linoleic acid, dietary fiber, calcium, and sodium.
Composite Group of All Persons 1+ Years. Percentiles of estimated usual intakes for the composite group of persons 1+ years are not presented. The percentage of individuals less than or greater than the DRI was computed as a weighted average as with adults 19+ years. As with the 19+ age groups, no standard error is provided and the estimated percentage is noted with the symbol #.
Footnote * Values for Percentages At The Extremes and Their Standard Errors. The percentages less than or greater than DRIs that are less than 3 percent are represented by <3. The percentages that are greater than 97 percent are represented by >97. Standard errors are not displayed in these cases and the column header is marked with *.
54

Appendix D. References 1. Institute of Medicine, Food and Nutrition Board. 1997. Dietary Reference Intakes for Calcium, Phosphorus, Magnesium, Vitamin D, and Fluoride. National Academy Press. Washington, DC. 2. Institute of Medicine, Food and Nutrition Board. 1998. Dietary Reference Intakes for Thiamin, Riboflavin, Niacin, Vitamin B6,
Folate, Vitamin B12, Pantothenic Acid, Biotin, and Choline. National Academy Press. Washington, DC. 3. Institute of Medicine, Food and Nutrition Board. 2000. Dietary Reference Intakes for Vitamin C, Vitamin E, Selenium, and
Carotenoids. National Academy Press. Washington, DC. 4. Institute of Medicine, Food and Nutrition Board. 2001. Dietary Reference Intakes for Vitamin A, Vitamin K, Arsenic, Boron,
Chromium, Copper, Iodine, Iron, Manganese, Molybdenum, Nickel, Silicon, Vanadium, and Zinc. National Academy Press. Washington, DC.
5. Institute of Medicine, Food and Nutrition Board. 2005. Dietary Reference Intakes for Water, Potassium, Sodium, Chloride, and
Sulfate. National Academy Press. Washington, DC. 6. Institute of Medicine, Food and Nutrition Board. 2005. Dietary Reference Intakes for Energy, Carbohydrate, Fiber, Fat, Fatty
Acids, Cholesterol, Protein, and Amino Acids (Macronutrients). National Academy Press. Washington, DC. 7. Institute of Medicine, Food and Nutrition Board. 2000. Dietary Reference Intakes: Applications in Dietary Assessment. National
Academy Press. Washington, DC. 8. What We Eat in America, NHANES 2001-2002, Food Surveys Research Group website: available at
http://www.ars.usda.gov/foodsurvey. 9. USDA Food and Nutrient Database for Dietary Studies 1.0, Food Surveys Research Group website: available at
http://www.ars.usda.gov/ba/bhnrc/fsrg.
10. Nusser, S.M., Carriquiry, A.L., Dodd, K.W., Fuller, W.A. 1996. A semiparametric transformation approach to estimating usual
daily intake distributions. J. Am. Stat. Assoc. 91:1440-1449. 11. Guenther, P.M., Kott, P., Carriquiry, A.L. 1997. Development of an approach for estimating usual nutrient intake distributions at the population level. J. Nutr. 127:1106-1112. 12. Iowa State University: available at http://cssm.iastate.edu/software/cside.html. 13. NHANES 2001-2002 Data Release--data, documentation, codebooks, and SAS code: available at
www.cdc.gov/nchs/about/major/nhanes/nhanes01-02.htm. 14. NCHS Research Data Center website: available at http://www.cdc.gov/nchs/r&d/rdc.htm. 15. SAS Institute Inc., SAS OnlineDoc®, Version 8, Cary, NC: SAS Institute Inc., 1999. 16. WesVar® 4.2 User’s Guide, 2002. Westat, 1650 Research Boulevard, Rockville, MD 20850. 17. Dodd, K.W., National Cancer Institute, Personal communication, 2004. 18. A SAS Program for the CDC 2000 Growth Charts: available at www.cdc.gov/nccdphp/dnpa.growthcharts/sas.htm.
56