what south africans die of... measurement of household food security: 2013 and beyond dr isabelle...
TRANSCRIPT

What South Africans die of...
MEASUREMENT OF HOUSEHOLD FOOD SECURITY: 2013 and beyond
Dr Isabelle Schmidt Social Statistics Stats SA

What South Africans die of...STATISTICS SOUTH AFRICA: TWO CORE CLUSTERS
ECONOMIC STATISTICS POPULATION AND SOCIAL STATISTICS

What South Africans die of...ECONOMIC STATS: SUPPLY SIDE STATISTICS

What South Africans die of...

What South Africans die of...POPULATION AND SOCIAL STATISTICS: DEMAND SIDE STATISTICS

What South Africans die of...HOUSEHOLD FOOD SECURITY: THE AFRICAN
CONTEXT
• Agrarian based economies: access to land important determinant of FS
• Small holder agriculture major role in food supply
• Early FS measurement focussed on harvest predictions and ID food aid needs

What South Africans die of...SOUTH AFRICAN HOUSEHOLD FOOD SECURITY REALITIES
• Own food production: small contribution to FS
• Most food bought
• Employment and grants main sources of income
• Poverty and inequality main drivers of food insecurity

What South Africans die of...SOUTH AFRICAN FS MEASUREMENT SYSTEMS
• Govt - MIS and early warning systems
• Alternative sources e.g. UNISA food security students deployed as Govt. Workers; NGO’s
• Govt - MIS and early warning systems
• Household questionnaire survey data
• Census

What South Africans die of...
FOOD ACCESS Data Source
Fre-quency
Value/Status
1. % of households with moderate to severe food access problems GHS 2012
ANNUAL
21,5%
2. % of households in income quintiles 1-3 with moderate to severe food access problems
GHS 2012
ANNUAL
-
3. % of households who ran out of money to buy food for 5 or more days during the past 30 days
GHS 2012
ANNUAL
7,2%
4. % who cut meal sizes for 5 or more days during the past 30 days GHS 2012
ANNUAL
7,0%
5. % of households who skipped meals because there was not enough food in the house for 5 or more days during past 30 days
GHS 2012
ANNUAL
5,9%
6. % of households who ate a smaller variety of foods for 5 or more days during the past 30 days
GHS 2012
ANNUAL
8,8%
7. % of households with child 17 years or younger who went hungry during the past year
GHS 2012
ANNUAL
12,6%
CURRENT INDICATORS: Food security statistics
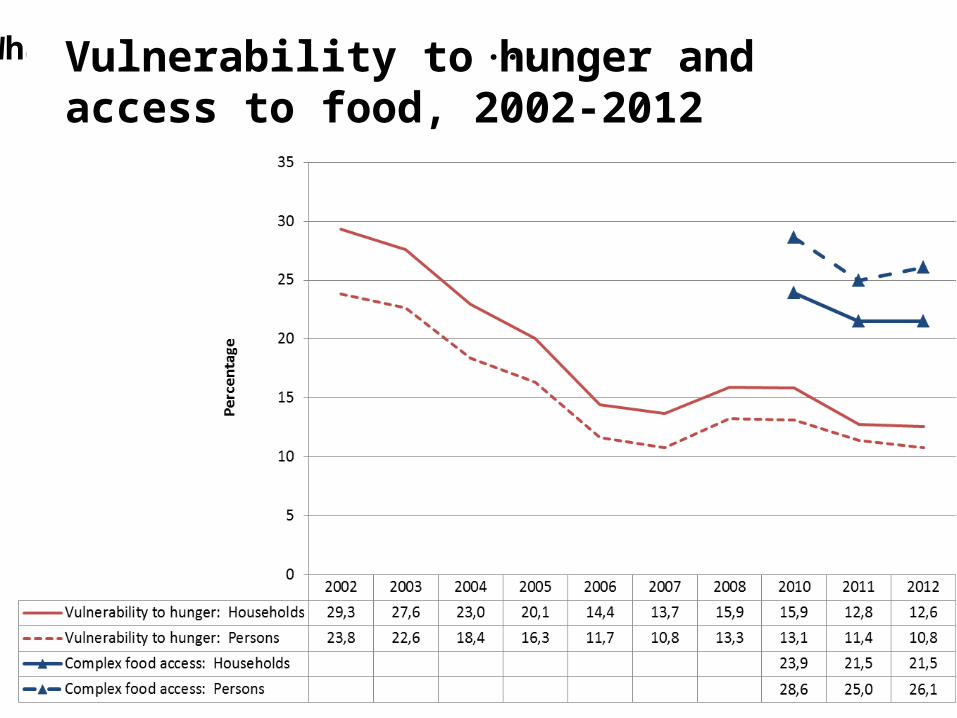
What South Africans die of...Vulnerability to hunger and access to food, 2002-2012

What South Africans die of...Percentage of households experiencing food adequacy, by province, 2012

What South Africans die of...
AVAILABILITY Data Source
Fre-quency
Value
7 % of urban households who engage in some agricultural activity
GHS 2012 AN-NUAL
5,9%
8 % of rural households who engage in some agricultural activity
GHS 2012 AN-NUAL
44,3%
9 % of households reliant on social grants for more than 50% of their household income
IES/LCS Periodic -
10 % of households with at least one employed household member
GHS 2012 AN-NUAL
71,6%

What South Africans die of...
UTILIZATION Data Source
Fre-quency Value
11 % of respondents with a high dietary diversity score GHS 2013 ANNUAL Forth-coming
12 % of households who buy ultra processed food three or more times per week
IES 2010/2011
5 yrs -
13 % of households with access to piped water on or off-site
GHS 2012 Annual 90,8%
14 % of households without toilet facilities or still using a bucket toilet
GHS 2012 Annual 5,3%
15 % of households whose refuse is removed by the municipality, once per week or less often.
GHS 2012 Annual 64,0%
16 % of households connected to the main electricity GHS 2012 Annual 85,0%

What South Africans die of...
NorthernCape
95,6%
KwaZulu-Natal
87,3%
98,9%
WesternCape
FreeState
96,7%
Mpumalanga87,5%
North West91,1%
79%
EasternCape
Gauteng
80,1%Limpopo
97,3%
Access to piped water in the dwelling, off-site or on-site, 2012
85-89%90-94%
79-84%
>94%56,3%
73,9%
75,8%
2002 84,9%
90,8%2012

What South Africans die of...
NorthernCape6,1%
KwaZulu-Natal
5,7%
3,2%
WesternCape
FreeState
6%
Mpumalanga6,4%
North West5,8%
13,4%
EasternCape
Gauteng
6,3%Limpopo
1,8%
Basic service deliveryHouseholds with no toilet facilities or using bucket toilet
6-10%
>11%
0-5%
5,8%
2002
36,8%
17,3%
17,2%
10,9%
1,9%
7,5%7,1%
20,5%
EC Largest improvement since 2002

What South Africans die of...Let’s also take a closer look at……

What South Africans die of... Maize processing in South Africa Graph: CPI Statistics Source: Chamber of milling

What South Africans die of...

What South Africans die of...Food inflation and the poor Source: CPI Statistics
-5,0
0,0
5,0
10,0
15,0
20,0
2009
01
2009
04
2009
07
2009
10
2010
01
2010
04
2010
07
2010
10
2011
01
2011
04
2011
07
2011
10
2012
01
2012
04
2012
07
2012
10
2013
01
2013
04
2013
07
Quintile 1
Quintile 2
Quintile 3
Headline CPI
Food CPI
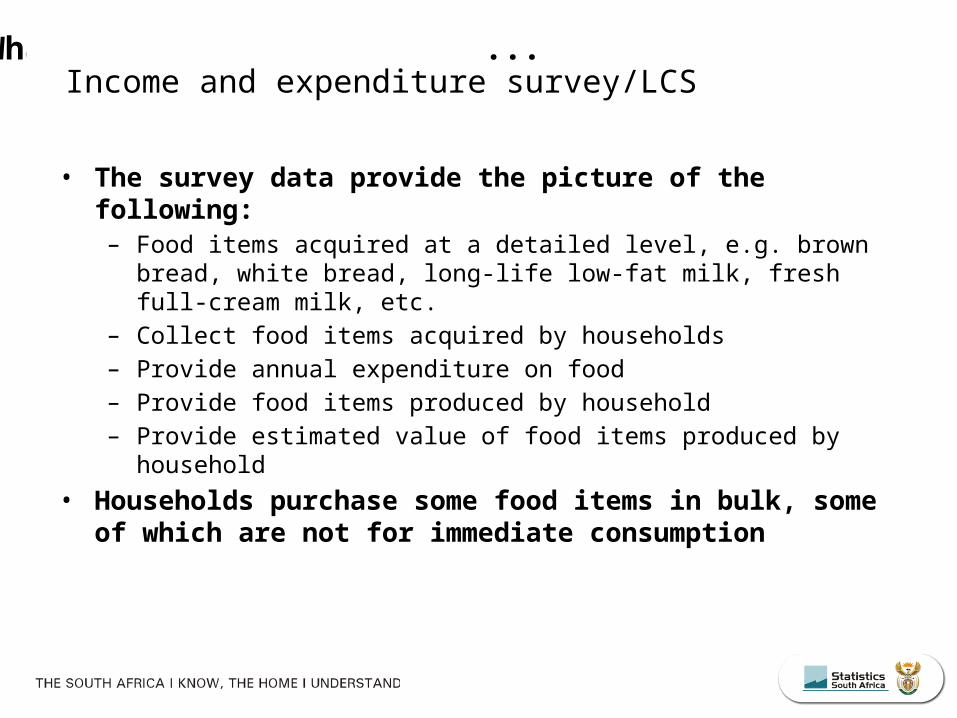
What South Africans die of...Income and expenditure survey/LCS
• The survey data provide the picture of the following:– Food items acquired at a detailed level, e.g. brown bread,
white bread, long-life low-fat milk, fresh full-cream milk, etc.– Collect food items acquired by households– Provide annual expenditure on food– Provide food items produced by household– Provide estimated value of food items produced by household
• Households purchase some food items in bulk, some of which are not for immediate consumption
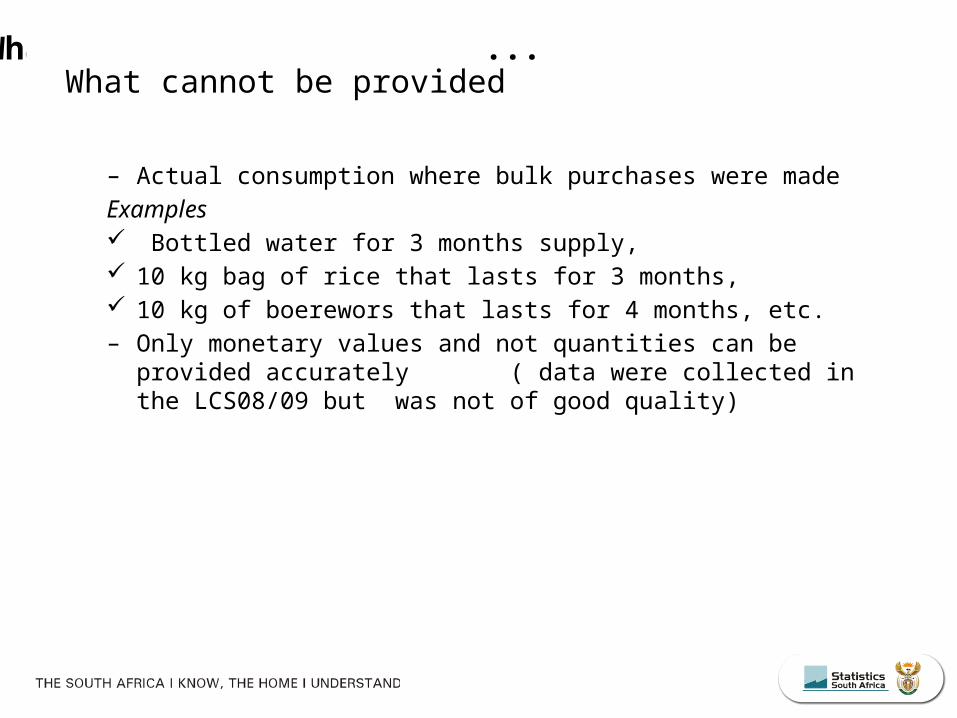
What South Africans die of...What cannot be provided
– Actual consumption where bulk purchases were madeExamples Bottled water for 3 months supply, 10 kg bag of rice that lasts for 3 months, 10 kg of boerewors that lasts for 4 months, etc. – Only monetary values and not quantities can be provided
accurately ( data were collected in the LCS08/09 but was not of good quality)

What South Africans die of...Moving forward: The need• Expand the statistical base (breadth)
• Gaps identified in all the social statistics themes (from the population theme to the environmental statistics theme)
• Expand the statistical base (depth)

What South Africans die of...
• Rural/urban• More textured
indicators• Metro/Non-metro• Income quintiles
Composite indicators• Dietary diversity score• Composite food
security index
Scale or geography of reporting• Municipal level
Frequency
• At least once a year or more often

What South Africans die of...
• Resources• Conflicting demands and
priorities
Moving forward: The constraints

What South Africans die of...Proposed Continuous Population Survey (CPS)
SurveysYEAR
1(2015)YEAR
2(2016)YEAR
3(2017)YEAR
4(2018)YEAR
5(2019)YEAR
6(2020)YEAR
7(2021)YEAR
8(2022)
CPS
LCS/IES/GHS
District level
CS/LCS/IES/GHS
Municipal level
LCS/IES/GHS
Provincial level
LCS/IES/GHS
District level
CS/LCS/IES/GHSMunicipal
level
LCS/IES/GHS
Provincial level
LCS/IES/GHS
District level
CS/LCS/IES/GHSMunicipal
level
FS indicators
Access AvailabilityUtilization
Access AvailabilityUtilization
Access Availability
Limited Utilization
Access AvailabilityUtilization
Access AvailabilityUtilization
Access Availability
Limited Utilization
Access AvailabilityUtilization
Access AvailabilityUtilization
New FS indicators
Anthropo-metrics
Food expenditureDiarrhoea
Anthropo-metrics
Food expenditureDiarrhoea
Level of Geography
District Municipal Provincial District Municipal Provincial District Municipal

What South Africans die of...
Thank you

What South Africans die of...Contact details
General Household Survey (GHS)Isabelle Schmidt [email protected] Roux [email protected]
IES/LCSNozipho Shabala [email protected]
Food CPIPatrick Kelly [email protected]