what new 13 2015 d 2010 - projects analytics oracle primavera … · note that ‘url’-type...
TRANSCRIPT

Asta Powerproject
WHAT’S NEW IN VERSION 13?
Discover more at www.astapowerproject.net

ASTA POWERPROJECT: WHAT’S NEW IN VERSION 13?
Asta Powerproject
WHAT’S NEW IN ASTA POWERPROJECT VERSION 13?
Asta Powerproject is a comprehensive product suite
with the flexibility to meet the varying needs of
everyone involved in running projects and those who
rely on project performance. It is easy to use,
scalable and powerful, and is widely relied upon to
support project activity at all levels of complexity.
Since its launch in 1988, Asta Powerproject has
evolved and improved driven by regular feedback
from users and by making use of the latest
technologies available. This release of version
13 is a continuation of that evolution with a number
of improvements which have been built and honed
following continuous development and the
integration of user feedback.
This document outlines the changes in the latest
release.
When you install version 13 you also have the option to
activate Asta Powerproject BIM*. To purchase licences
for Asta Powerproject BIM please email
[email protected] or call the Sales team on
01844 261700. For information about Asta
Powerproject BIM features visit www.astadev.com/BIM.
* This is currently only available in UK and Ireland.
Other countries will follow shortly. Please contact your reseller.
Use resource curves and allocation profiles to plan nonlinear allocations
In some cases, the effort, quantity or cost of an allocation
may not be linear. You can reflect this in a project by
assigning resource curves to resource or cost allocations in
order to plan nonlinear assignment - assignments in which
work or cost occurs sporadically, or at varying levels of
effort, quantity or cost. A resource curve consists of a
number of discrete rectangular segments - or ‘points’ -each
of which defines a percentage of duration and a
corresponding level of allocation. For example, if a resource
curve has ten points, the first segment relates to the first
10% of an allocation’s duration and defines the amount of
allocation that relates to that segment. You can configure
resource curves to accurately represent the varying levels
of effort, quantity or cost across the duration of the
allocations to which the resource curve is assigned.
In the case of permanent resource allocations, you can
also specify that an allocation should use an individual
allocation profile, which acts in a similar way to a
resource curve but which applies to an individual
allocation only. An allocation profile consists of a number
of discrete segments, each of which defines a duration
and a corresponding level of effort.
Watch a short video at www.astadev.com/asta-
powerproject-version-13/ to explain this further.
Back loaded resource curve Bell shaped resource curve
Front loaded resource curve Three step resource curve
Discover more at www.astapowerproject.net
ASTA POWERPROJECT: WHAT’S NEW IN VERSION 13?
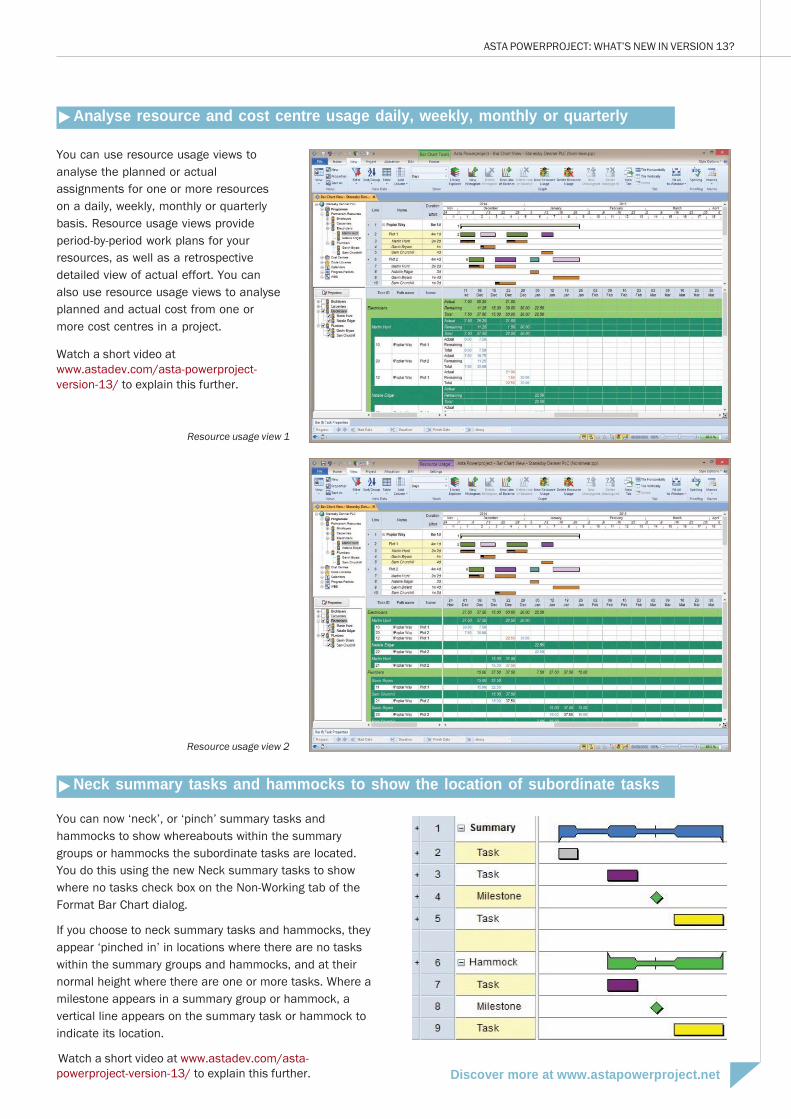
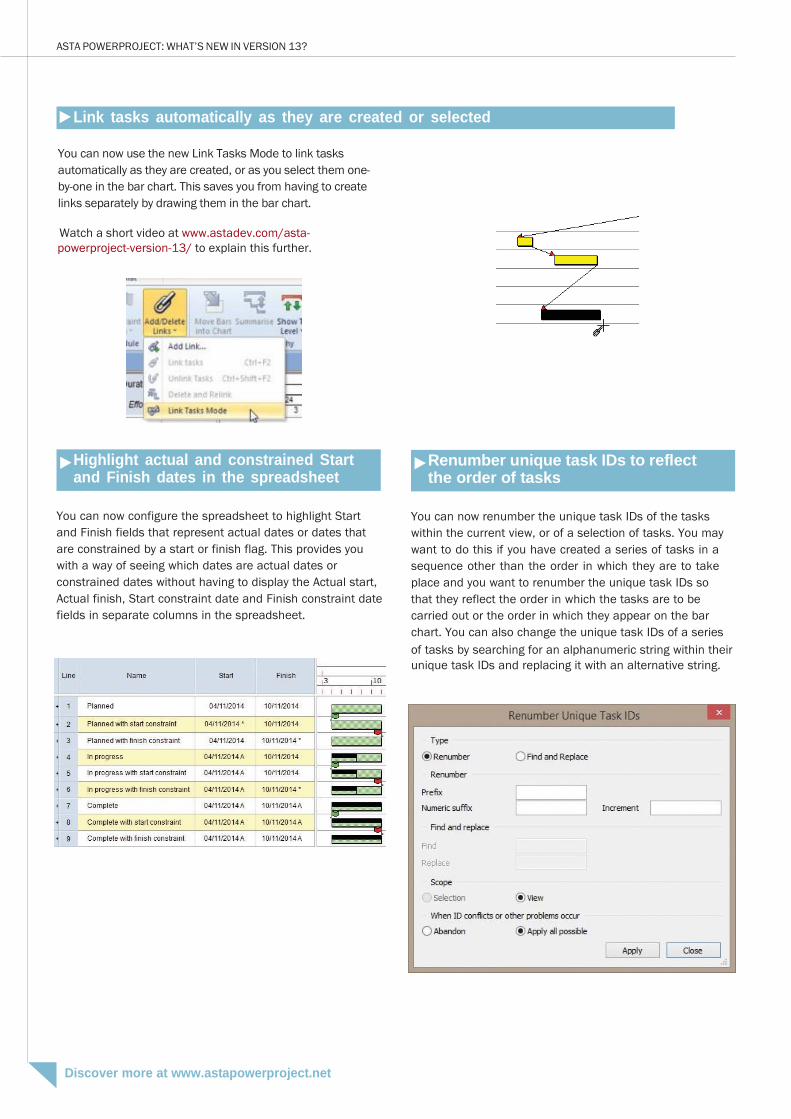
Analyse resource and cost centre usage daily, weekly, monthly or quarterly
You can use resource usage views to
analyse the planned or actual
assignments for one or more resources
on a daily, weekly, monthly or quarterly
basis. Resource usage views provide
period-by-period work plans for your
resources, as well as a retrospective
detailed view of actual effort. You can
also use resource usage views to analyse
planned and actual cost from one or
more cost centres in a project.
Watch a short video at
www.astadev.com/asta-powerproject-
version-13/ to explain this further.
Resource usage view 1
Resource usage view 2
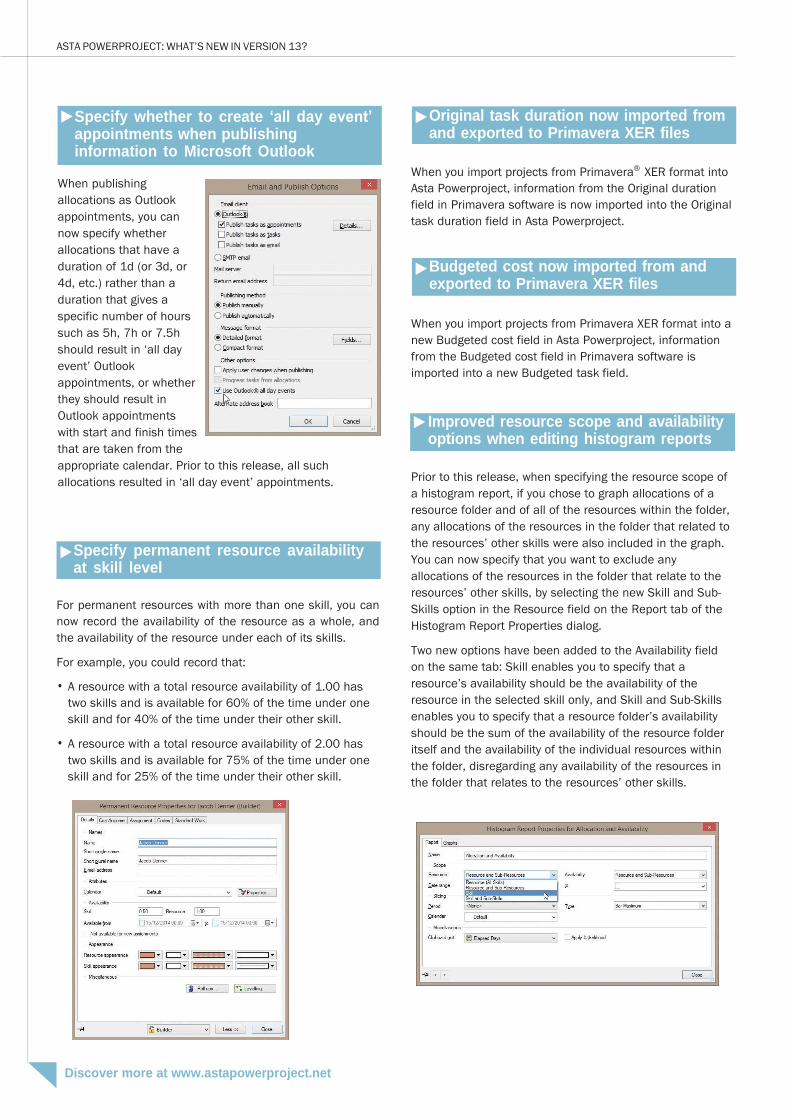
Neck summary tasks and hammocks to show the location of subordinate tasks
You can now ‘neck’, or ‘pinch’ summary tasks and
hammocks to show whereabouts within the summary
groups or hammocks the subordinate tasks are located.
You do this using the new Neck summary tasks to show
where no tasks check box on the Non-Working tab of the
Format Bar Chart dialog.
If you choose to neck summary tasks and hammocks, they
appear ‘pinched in’ in locations where there are no tasks
within the summary groups and hammocks, and at their
normal height where there are one or more tasks. Where a
milestone appears in a summary group or hammock, a
vertical line appears on the summary task or hammock to
indicate its location.
Watch a short video at www.astadev.com/asta-
powerproject-version-13/ to explain this further.
Discover more at www.astapowerproject.net
ASTA POWERPROJECT: WHAT’S NEW IN VERSION 13?
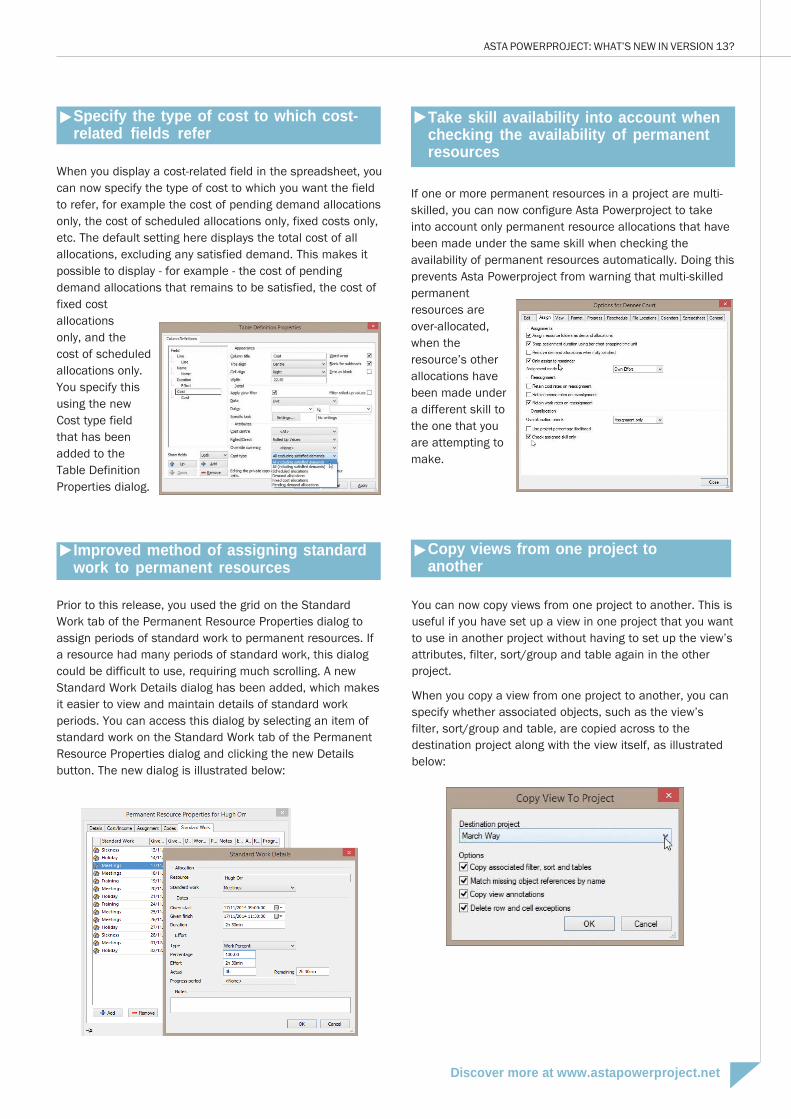
Link tasks automatically as they are created or selected
You can now use the new Link Tasks Mode to link tasks
automatically as they are created, or as you select them one-
by-one in the bar chart. This saves you from having to create
links separately by drawing them in the bar chart.
Watch a short video at www.astadev.com/asta-
powerproject-version-13/ to explain this further.
Highlight actual and constrained Start and Finish dates in the spreadsheet
You can now configure the spreadsheet to highlight Start
and Finish fields that represent actual dates or dates that
are constrained by a start or finish flag. This provides you
with a way of seeing which dates are actual dates or
constrained dates without having to display the Actual start,
Actual finish, Start constraint date and Finish constraint date
fields in separate columns in the spreadsheet.
Renumber unique task IDs to reflect the order of tasks
You can now renumber the unique task IDs of the tasks
within the current view, or of a selection of tasks. You may
want to do this if you have created a series of tasks in a
sequence other than the order in which they are to take
place and you want to renumber the unique task IDs so
that they reflect the order in which the tasks are to be
carried out or the order in which they appear on the bar
chart. You can also change the unique task IDs of a series
of tasks by searching for an alphanumeric string within their
unique task IDs and replacing it with an alternative string.
Discover more at www.astapowerproject.net

ASTA POWERPROJECT: WHAT’S NEW IN VERSION 13?
Record the actual start and finish dates of tasks per progress period
If you use multiple progress periods in a project, you can
now view the actual start and actual finish dates of the
progress that was marked in each individual progress
period in the spreadsheet. You do this by displaying the
Actual start and Actual finish date fields in the spreadsheet
and specifying the progress period to which you want the
date to apply.
Filter on the results of formulae
You can now create filters that filter items according to the
results of formulae, using a new Formula page that has
been added to the Filter Wizard.
Hyperlinks displayed in the bar chart are now clickable
It was possible prior to this release to display ‘URL’-type
user-defined fields in the bar chart, using the fields in the
Task data display group on the Tasks tab of the Format Bar
Chart dialog. However, prior to this release, the contents of
these fields were not displayed as clickable hyperlinks.
‘URL’-type user defined fields now appear as clickable
hyperlinks when you display them to the left or right of
tasks in the bar chart. Note that ‘URL’-type fields are not
clickable if you display them on top of tasks.
Include details of task priority when publishing information to Microsoft Outlook
You can now choose to include details of the priority of
tasks when you publish information from Asta Powerproject
to Microsoft Outlook®. If you choose to include priority
details and a task has no priority defined but its bar does,
the bar priority is published.
Discover more at www.astapowerproject.net
ASTA POWERPROJECT: WHAT’S NEW IN VERSION 13?
Specify whether to create ‘all day event’ appointments when publishing information to Microsoft Outlook
When publishing
allocations as Outlook
appointments, you can
now specify whether
allocations that have a
duration of 1d (or 3d, or
4d, etc.) rather than a
duration that gives a
specific number of hours
such as 5h, 7h or 7.5h
should result in ‘all day
event’ Outlook
appointments, or whether
they should result in
Outlook appointments
with start and finish times
that are taken from the
appropriate calendar. Prior to this release, all such
allocations resulted in ‘all day event’ appointments.
Specify permanent resource availability at skill level
For permanent resources with more than one skill, you can
now record the availability of the resource as a whole, and
the availability of the resource under each of its skills.
For example, you could record that:
• A resource with a total resource availability of 1.00 has
two skills and is available for 60% of the time under one
skill and for 40% of the time under their other skill.
• A resource with a total resource availability of 2.00 has
two skills and is available for 75% of the time under one
skill and for 25% of the time under their other skill.
Original task duration now imported from and exported to Primavera XER files
When you import projects from Primavera® XER format into
Asta Powerproject, information from the Original duration
field in Primavera software is now imported into the Original
task duration field in Asta Powerproject.
Budgeted cost now imported from and exported to Primavera XER files
When you import projects from Primavera XER format into a
new Budgeted cost field in Asta Powerproject, information
from the Budgeted cost field in Primavera software is
imported into a new Budgeted task field.
Improved resource scope and availability options when editing histogram reports
Prior to this release, when specifying the resource scope of
a histogram report, if you chose to graph allocations of a
resource folder and of all of the resources within the folder,
any allocations of the resources in the folder that related to
the resources’ other skills were also included in the graph.
You can now specify that you want to exclude any
allocations of the resources in the folder that relate to the
resources’ other skills, by selecting the new Skill and Sub-
Skills option in the Resource field on the Report tab of the
Histogram Report Properties dialog.
Two new options have been added to the Availability field
on the same tab: Skill enables you to specify that a
resource’s availability should be the availability of the
resource in the selected skill only, and Skill and Sub-Skills
enables you to specify that a resource folder’s availability
should be the sum of the availability of the resource folder
itself and the availability of the individual resources within
the folder, disregarding any availability of the resources in
the folder that relates to the resources’ other skills.
Discover more at www.astapowerproject.net
ASTA POWERPROJECT: WHAT’S NEW IN VERSION 13?
Specify the type of cost to which cost- related fields refer
When you display a cost-related field in the spreadsheet, you
can now specify the type of cost to which you want the field
to refer, for example the cost of pending demand allocations
only, the cost of scheduled allocations only, fixed costs only,
etc. The default setting here displays the total cost of all
allocations, excluding any satisfied demand. This makes it
possible to display - for example - the cost of pending
demand allocations that remains to be satisfied, the cost of
fixed cost
allocations
only, and the
cost of scheduled
allocations only.
You specify this
using the new
Cost type field
that has been
added to the
Table Definition
Properties dialog.
Take skill availability into account when checking the availability of permanent resources
If one or more permanent resources in a project are multi-
skilled, you can now configure Asta Powerproject to take
into account only permanent resource allocations that have
been made under the same skill when checking the
availability of permanent resources automatically. Doing this
prevents Asta Powerproject from warning that multi-skilled
permanent
resources are
over-allocated,
when the
resource’s other
allocations have
been made under
a different skill to
the one that you
are attempting to
make.
Improved method of assigning standard work to permanent resources
Prior to this release, you used the grid on the Standard
Work tab of the Permanent Resource Properties dialog to
assign periods of standard work to permanent resources. If
a resource had many periods of standard work, this dialog
could be difficult to use, requiring much scrolling. A new
Standard Work Details dialog has been added, which makes
it easier to view and maintain details of standard work
periods. You can access this dialog by selecting an item of
standard work on the Standard Work tab of the Permanent
Resource Properties dialog and clicking the new Details
button. The new dialog is illustrated below:
Copy views from one project to another
You can now copy views from one project to another. This is
useful if you have set up a view in one project that you want
to use in another project without having to set up the view’s
attributes, filter, sort/group and table again in the other
project.
When you copy a view from one project to another, you can
specify whether associated objects, such as the view’s
filter, sort/group and table, are copied across to the
destination project along with the view itself, as illustrated
below:
Discover more at www.astapowerproject.net
ASTA POWERPROJECT: WHAT’S NEW IN VERSION 13?
Specify a number of additional access rights
A number of additional access rights have been added to
the General tab of the User Properties dialog, which allow
you to specify whether users can:
• Identify that charts and summary groups represent
individual projects.
• Create and delete expanded tasks and charts.
• Create and delete summary tasks and summary groups.
• Reschedule the project.
Apply the view filter to rolled-up values in the spreadsheet
When you display certain fields in the spreadsheet, you
have long been able to apply the current view filter in order
to filter the data that is displayed in the spreadsheet
columns, using the Apply view filter check box on the Table
Definition Properties dialog. This check box affects the
display of data for bars, tasks and allocations, but not
rolled-up values - i.e. values that relate to summary tasks,
expanded task and hammocks.
You can now choose to apply the current view filter to
rolled-up values in the spreadsheet, using a new Filter
rolled-up values check box on the Table Definition
Properties dialog. This check box is available for all fields
for which the Apply view filter field is available.
Specify what happens if a resource or cost centre is dragged and dropped onto a completed section
You can now specify whether it should be possible to assign
resources and cost centres to 100% complete tasks and to
completed sections of part-progressed tasks by dragging
and dropping them. You do this using the new Only assign
to remainder check box on the Assign tab of the Options
dialog.
Note that as part of this change, a number of existing
options have been moved from the Edit tab of the Options
dialog to a new Assign tab.
Colour tasks according to the appearance of the lead resource that is assigned to them
As an alternative to displaying tasks using the appearance
of the codes that are assigned to them, you can now
choose to colour tasks according to the appearance of the
lead resource that is assigned to them. If you colour-code
your resources and cost centres, this saves you from
having to set up a corresponding series of similarly-
coloured codes with which to colour your tasks.
You can specify that any one of a task’s resource or cost
allocations is the task’s “lead resource”, and you can
configure resources and cost centres so that their
allocations become lead resources by default.
Specify a default appearance for each different type of task
Prior to this release, you could specify a default appearance
to apply to tasks, as an alternative to displaying tasks using
the appearance of the codes that are assigned to them. You
can now specify a different default appearance for each
different type of task – for example standard tasks,
summary tasks, expanded tasks, etc. – using the new
Format Task Appearances dialog.
Specify default codes to apply to resource and cost allocations
You can now specify which codes should be applied by
default to allocations of specific resources and cost centres,
using a new Codes tab that has been added to the
Permanent Resource Properties dialog, the Consumable
Resource Properties dialog and the Cost Centre Properties
dialog. For each resource and cost centre - and for each skill
of multi-skilled permanent resources - you can select one or
more codes from any number of the code libraries in the
project.
Specify default codes to apply to allocation groups
You can now specify which codes should be applied by
default to tasks to which allocation groups are assigned,
using a new Codes tab that has been added to the
Allocation Group Properties dialog. For each allocation
group, you can select one or more codes from any number
of the code libraries in the project.
Discover more at www.astapowerproject.net
ASTA POWERPROJECT: WHAT’S NEW IN VERSION 13?
Specify a default work unit to apply to task work
It was possible prior to this release to specify a default
amount of work to be applied to new tasks by default -
using the Task tab of the Bar Chart Defaults Properties
dialog. You can now also specify the unit in which the
default work is measured.
Prefix UDF-based sort/group subheadings with the names of the user-defined fields
Prior to this release, if you sorted/grouped items according
to the contents of user-defined fields and displayed
subheadings to identify the points at which a sort/group
criterion changes, the names of the user-defined fields on
which the sort/group was based were not displayed in the
subheadings, making it difficult to identify the sort/group
criteria being used.
You can now choose to prefix sort/group subheadings with
the names of the user-defined fields on which the criteria
are based, using the new Prefix with UDF name field on the
Sort/Group Properties dialog. This makes it easier to identify
the criteria by which items are sorted/grouped.
Use the Cumulative items field to count the number of items in summary groups and charts
A new Cumulative items field has been added, which you
can use to display the number of tasks or allocations on a
bar; for bars containing one of more summary or expanded
tasks, this includes the number of tasks and milestones
within the subcharts or summary groups but not the
expanded or summary tasks themselves. The tasks and
milestones within any nested expanded or summary tasks
are included in the count, but the nested expanded or
summary tasks themselves are not counted.
Improvement to displaying information about specific tasks in the spreadsheet
When you configure a spreadsheet field to refer to tasks on
a bar that have been assigned specific code library entries,
you can now specify that the field should refer to those
tasks on a bar that have been assigned all of the selected
entries, rather than all tasks on a bar that have been
assigned one or more of the selected entries. You do this
using the new All entries must match field on the Specific
Task Data dialog.
Add columns to and remove columns from links-related grids
You can now add columns to and remove columns from
the grids in the following locations:
• Bar and Task Properties dialog - Links tab.
• Properties view - Predecessors tab.
• Properties view - Successors tab.
This enables you to choose the information that you want
to display in the grids. In addition to this, you can sort the
links in the grids according to the values in any of the
columns of information and change the position of the
columns in the grids.
Once you have finished configuring a grid, you can easily
apply the same layout to the other grids, using a new Sync
Layout button.
Changes to the names of some earned value fields
The following changes have been made to the names of
some earned value fields to bring them in line with
commonly-used terminology:
• “Actual cost of work performed” has been renamed
“Actual cost (AC)”.
• “Budget cost of work performed” has been renamed
“Earned value (EV)”.
• “Budget cost of work scheduled” has been renamed
“Planned value (PV)”.
• “Cost performance ratio” has been renamed “Cost
performance index (CPI)”.
• “Projected cost” has been renamed “Estimate at
completion (EAC)”.
• Acronyms have been appended to the names of many of
the other earned value fields.
Despite these name changes, any existing references to
these fields - for example in tables, filters or formulae - will
continue to work.
The “Schedule performance ratio” field, which was very
similar to the “Schedule performance index” field, has been
deleted from the Asta Powerproject user interface. As is the
case with the renamed fields, any existing references to this
field - for example in tables, filters or formulae - will continue
to work.
Discover more at www.astapowerproject.net

ASTA POWERPROJECT: WHAT’S NEW IN VERSION 13?
Optimise the margins of output for PDF printing
When printing, Asta Powerproject normally applies a small
adjustment to the margins of the output to ensure that it will
fit within the margins of the selected printer. When
outputting to PDF, this adjustment is unwanted. You can
now optimise the margins of your output for PDF printing by
specifying that you are printing to PDF and want to print
using the full extent of the page as far as possible, using a
new printing option.
Include a calendar exception legend when printing
You can now specify that a legend explaining the calendar
exceptions that have been selected on the Non-Working
tab of the Format Bar Chart dialog should be included in
printed output, using a new printing option.
Keep tasks and their allocations on the same page when printing
You can now specify that wherever possible, allocation bars
and baseline bars should be printed on the same page as
the bar to which they relate, using a new printing option.
Discover more at www.astapowerproject.net
Tel: 1--800-931-1582
www.astapowerproject.net