what is space syntax? · space syntax is a method for describing and analyzing the relationships...
TRANSCRIPT

Ministère de la Culture et de la Communication
Ecole Nationale Supérieure de Paris Belleville
Séminaire de Master Architectures et villes face à la Mondialisation
coord. Alessia de Biase
What is Space Syntax?
Does the urban form of the city affect the level of burglary
and crime?
Article by Karolina Jacoby
Royal Institute of Architecture Stockholm
Director of article: Alessia de Biase
JUNE 2006

Introduction
Architects often se urban design as special formal typologies and floor area
ratios, whereas other professions study the human actions, forms of life, public
conversation, diversity, coincidence, the topology of the movement networks, etc.1 Here I will talk about a method that is in between this. It’s both mathematical and takes notice to the human factor.
Space has a value. It is defined by the buildings and streets that surround it and
in turn it gives definition to those streets and buildings. The word syntax refers to the relationships between words in a sentence. It is the system by which we arrange words to create meaning. In the same way, how can public and private
spaces be arranged so that they make sense to the people who use them?2
Space Syntax is a method for describing and analyzing the relationships
between spaces of urban areas and buildings. In space syntax, the spaces are understood as voids such as streets, squares, rooms and fields, between walls, fences and other things that restrain pedestrian movement or the visual field.
The idea assumes that most people, most of the time, will take the simplest route to their destination. That route tends to involve the fewest changes of direction. The more changes of direction, the more complex the system, and
therefore the more ineffective or inefficient the network design becomes.
The idea originated with Bill Hillier, a professor at The Bartlett School of
Architecture, University College London (UCL), who, 20 years ago wanted to find out why social housing of the 1960s and 70s in the United Kingdom was not working; why a sense of community had not developed. He wanted to find a
means of describing and analyzing how the housing layouts interacted with the space available. Together with Julienne Hanson he wrote a book called “The Social Logic of Space” (1981).
His work resolves many of the problems with understanding entire city structures
as a network with different spatial and urban dimensions. This has major impact
on understanding the pedestrian movements in the city. Hillier found strong relationship between the relative number of pedestrians and spatial integration of the city structure. It provides an urban morphological representation by
looking at only public spaces (open space). These public spaces look like a beady ring system, in which space widens to from irregular beads, and narrows to form strings, while at the same time joining back to itself so that they are always choices of routes from any one space to any other.3
1Bo Grönlund, professor in urbanism at Copenhagen university of Art and Architecture 2 Space syntax, www.spacesyntax.com
3 Hillier and Hanson, “The social logic of space” 1984
By breaking down the subject and explaining the basic terms used in Space
Syntax it becomes easier to understand the different variables and its approach.4 The three basic conceptions in Space Syntax Analysis:
• Convex space, or convex polygon as some analyst calls it, is a polygon that
no line drawn between any pair of points within that polygon goes outside of
the polygon. In other words no line crosses its perimeter.
• Axial space or an axial line is the longest line which chains convex polygons.
It’s a straight line linked to the notion of visibility and that can be followed by foot.
• Isovist space is the total area that can be viewed from a point, in three dimensions.
The spatial structure you are measuring is represented by using syntactic maps, with the same terminology as above, i.e.:
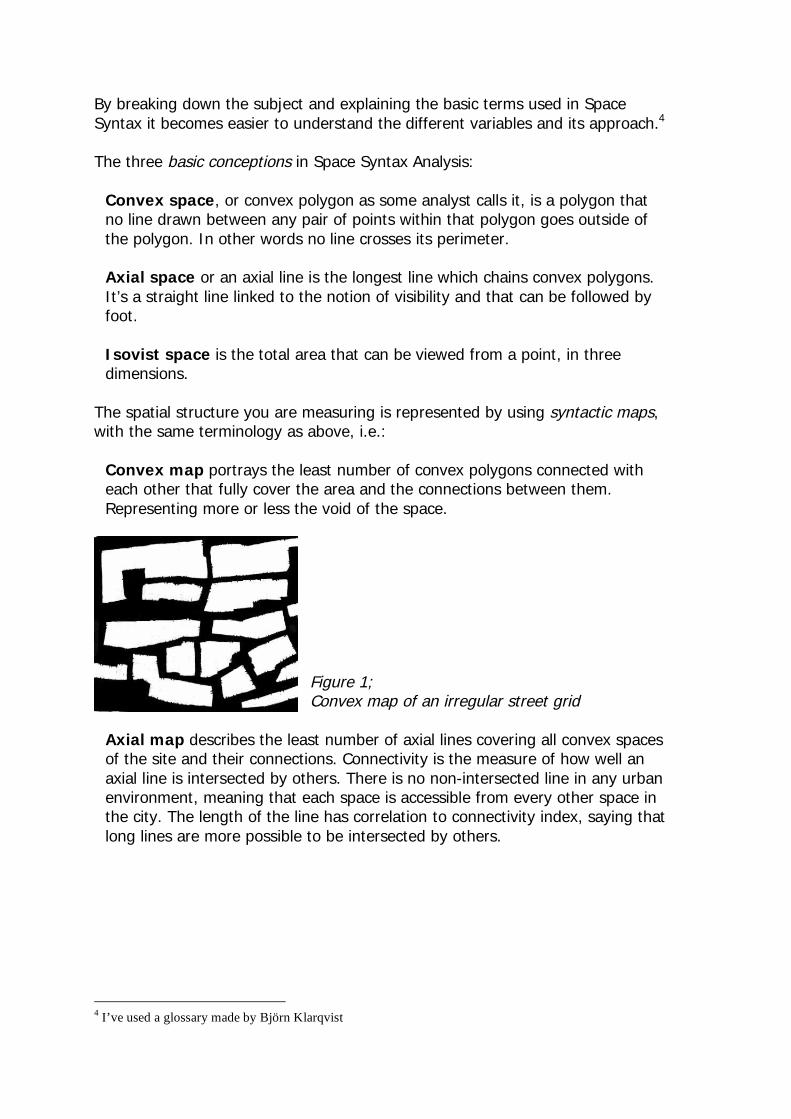
• Convex map portrays the least number of convex polygons connected with
each other that fully cover the area and the connections between them.
Representing more or less the void of the space.
Figure 1; Convex map of an irregular street grid
• Axial map describes the least number of axial lines covering all convex spaces of the site and their connections. Connectivity is the measure of how well an
axial line is intersected by others. There is no non-intersected line in any urban environment, meaning that each space is accessible from every other space in the city. The length of the line has correlation to connectivity index, saying that
long lines are more possible to be intersected by others.
4 I’ve used a glossary made by Björn Klarqvist

Figure 2; Axial map of the same irregular grid as above.
• Isovist map presents the areas that are visible from convex spaces or axial lines.
These maps can be transformed into graphs easier to read and analyze: • Graph is a figure showing the relationship of access between all the convex
spaces or axial spaces in the area. The spaces are drawn like circles or dots and the links with lines.
Figure 3; An axial map and its graph
• Syntactic step is the direct connection or relation between a space and its
immediate neighbors. In an axial map it’s usually the change of direction from one line to another. See figure above.
• Depth is a topological distance in a graph. It counts the least number of syntactic steps that are needed to reach one from another. If two lines are directly connected, the distance between them is equal to one, and the
distance of lines which are not directly connected is the shortest path between them. See same figure above.
• Justified graph show the specific space placed at the bottom, at the “root”. All spaces one syntactic step away from the root space are placed on the first level in the graph, all spaces two spaces away will be place on the second level
and so on. These graphs help to understand the overall depth of a site seen from one of its points. See figure below. The justified graph can be called either deep or shallow depending on how it looks with the steps (levels), tree-
like or bush-like.

Figure 4; Showing connections in a building i.e. a museum and their justified graphs on the right side, with the two examples of bush-like (above) and tree-like (below).
The four syntactic measures that can be calculated are:
• Connectivity measures the number of depths that are directly connected to a
space. This is called local measure.
• Integration is a static global measure. It indicates the degree to which a line
is more integrated, or segregated, from a system as a whole. • Control value is a dynamic local measure, in which the alternative
connections are counted. It measures how each axial line controls its immediate neighbors, i.e. those lines intersected by the current one.
• Global choice is a dynamic global measure of the “flow” through space. A
specific space has a strong choice value when many of the shortest paths pass
through it. Depending on how well a space is connected, the axial map can be colored from
red to blue, the connectivity or integration. Red lines represent very well connected/integrated space and blue lines are not well connected and the most segregated, using the spectrum (red to blue) to show something in between.
The distance you talk about when working with space syntax is a sort of topological distance (Buckley and Harary 1990), i.e. the distance of two
intersected axial lines is one, and the distance between non-intersected lines is

the shortest path between them (See figure below). In a study made by Sadalla
and Magel in 1980, the cognitive distance is looked at. They found that routes with increasing numbers of right-angle turns were shown to be psychologically longer than routes with fewer right-angle turns. The figure illustrates two routes
from point A to point B. Both the ways are equally long but people that follow the route with more turns have longer distance estimation than if they take the route with only one turn. This has to do with the visual possibility of measuring
the distance. If you can’t estimate the length it seems longer. We have a desire to minimize functional distance (Deutsch and Isard 1961).
Figure 5; Showing Distance estimates influenced by the route structuring
Examples to understand the practice of space syntax Take a small city in Italy for example. Usually the street layout is very complex.
The main streets are crowded with tourists (like in Venice, Florens or Rome) and few of them try to explore or take shortcuts to avoid the crowds by taking the small meandering back streets. One explanation to this is because the small
streets are just too complicated, with too many changes of direction that can lead to disorientation and being lost. In general the more complicated an urban street design is, the less accessible it becomes and the more it created social
exclusion.
Picture 1; Venice and its grid.

If we use Oxford Street in London as an example, it’s the opposite, pedestrians
have a clear view along the street an the streets connecting to it such as Bond Street, Regent Street and Tottenham Court Road. Oxford Street is one of the longest and most straight roads in London, giving a clear view for the
pedestrians and it’s also the biggest “shopping center” in Europe thanks to its global and local integration looking on the axial map.
Picture 2; Oxford Street, London
On an average it takes 9.8 changes of direction to move from Oxford Street to
any other location in London, which explains its popularity for shops and
shoppers. Looking at a syntax map, Oxford Street is red (most integrated) and if you compare this map, which is calculated by the computer, with the reality it speaks its own language, the system is very accurate. Other shops (retailers) are
not only attracted by the fact that established stores attract people to the area but also because it has the best access, which is part of why shops are there in at first place.
In this case the global integration shows that Oxford Street and the smaller streets are the lines that link Oxford Street to the City of London.
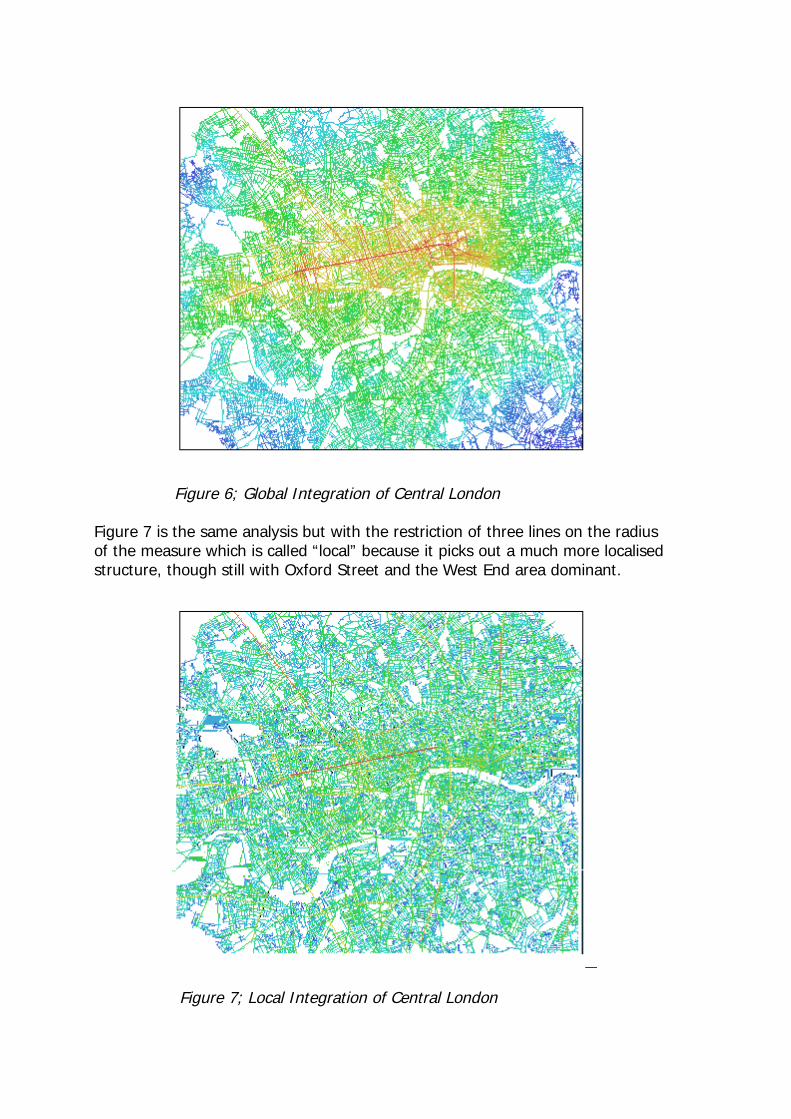
Figure 6; Global Integration of Central London
Figure 7 is the same analysis but with the restriction of three lines on the radius of the measure which is called “local” because it picks out a much more localised structure, though still with Oxford Street and the West End area dominant.
Figure 7; Local Integration of Central London

The Trafalgar Square project5
A masterplan for the area was commissioned in 1996 by Westminster City Council and the Greater London Authority, asking for improvements in the quality of the
public realm, which was perceived to be unpleasant, unsafe, and dominated by traffic. Foster & Partners joined the competion and together with Space Syntax they have been working on analysing the popular Trafalgar Square in London.
They made the most detailed survey ever of pedestrian movement, by trained observers who took notes on more than 300 locations at different times of the day.
Through the use of the Space Syntax software the resultant observation study helped define the optimum width of a new staircase at the northern end, which
would encourage pedestrians to use the center of the square.
Before the Londoners found it easier to go round the square than to trespass it
because of the stairs in the north-west and north-east corners. At the square where mostly tourists as seen in figure 8. Londoners avoided the centre of Trafalgar Square and tourists failed to make the journey between Trafalgar
Square and Parliament Square. The new proposal was to make a central staircase which would increase the flow.
Figure 8; Trafalgar Square. PAST, The red dots are tourists, the blue lines are Londoners and the green lines are informal pedestrian crossings.
5 FROM RESEARCH TO DESIGN re-engineering the space of Trafalgar Square Hillier, Stonor, Major, Spende
September 1998
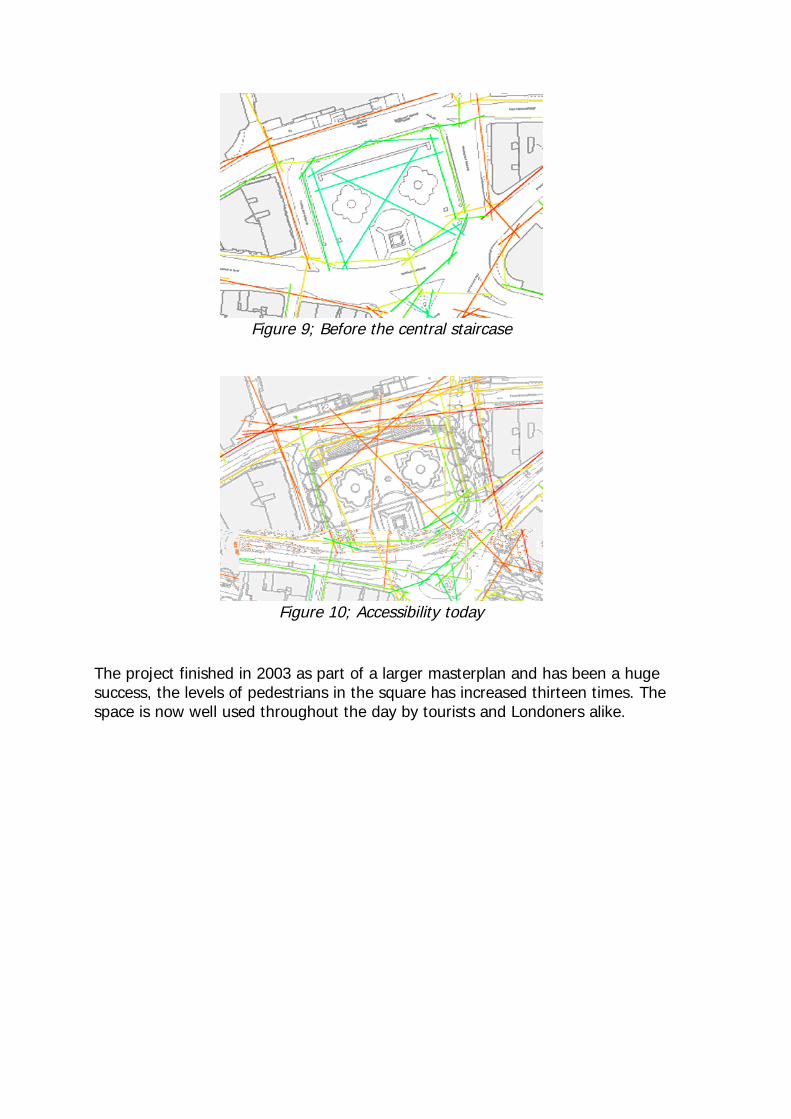
Figure 9; Before the central staircase
Figure 10; Accessibility today
The project finished in 2003 as part of a larger masterplan and has been a huge success, the levels of pedestrians in the square has increased thirteen times. The space is now well used throughout the day by tourists and Londoners alike.

Today, photo of the new staircase in use.
Space syntax and safety
Sometimes it’s contradictory to what is considered as a frightening, insecure space and environment; both too open fields and too narrow can be threat full.
Places where many people gather are sometimes as frightening as where it’s empty and abandoned. It’s important to understand the city structure to be able
to prevent fear. By comparing city plans it shows that urban forms with a grid shape have higher
flow of people and traffic than cities with a tree-like shape. In the grid-like city the many junctions create meeting spots for people. The grid doesn’t have to be identical and square, the important is that the blocks are short and the crossings
many. This makes it easier for people to get around and gives the possibility of more meetings. The shape of the city affects the level of clarity and to read the space. In some cities you never manage to locate yourself and find your way
whereas other cities have a system that is easy to understand. The tree-like systems tend to be more difficult for orientation than the grid-like. The possibility to choose an alternative route increases the level of safety.
Time aspect is also important here. How much extra time are we willing to spend by choosing the longer, safer route, than the shortest? Normally we feel more
comfortable with people around us so that if we are attacked or feel scared there
is a third part that can help us. The shape of the buildings matter as well. The
height has little to do with it but the length of the façade more. If we can’t make a turn anywhere we feel uncomfortable. On the other hand if the location has too many small streets and hideaways we wouldn’t want to pass there at night.
The buildings create certain shapes and movements. If it’s narrow between the houses or wall the “forced” movement forward is stronger than when you can choose which side of the street you want to use.
Lightning is very important as well for our perception of a certain space or location. Poor lightning in combination with isolated places with few sight lines
and lack of other people, creates uncomfortable surroundings. The shape of community transports and their bus stops is of importance as well. Maybe you have to trespass a dark tunnel or stand at a very open place to take the bus, and
at night this creates fear.
Does the city shape affect the level of crime?
There is a tendency for people to think that the more people who pass your front door the more likely one of them is to be a thief. In “Defensible Space”
(Newman, 1972) there is a theory that tells this. In fact, something like the opposite seems to be the case. Other people, including strangers, keep you safe.
To show and example of how this can be analyzed, we6 take an area and first create a map in which dots indicate the exact locations of different kinds of crime
- burglary in this case. We then create a space syntax model of the area. We then superimpose the crime map on the syntax map, and proceed in two ways: first, look for visual patterns, and their relation to the visual syntactic patterns;
then correlate syntactic values with crime rates. It is important in these cases to consider the lack of crime as well as concentrations. For example, in the map shown, a designed area of New Town X, crime seems to be highest where the
urban grid is most segregated and lowest where the lines are longest and most integrated (Shown red on the map)
A more integrated area usually have less crime that a more segregated one. In other words it is not the surveillance of the space you are in that is critical, but surveillance by neighbouring groups of houses on the way to your space. It’s the
fear of being seen or caught (disturbed) when committing a crime that leads the thieves and criminals to operate in places with few or no people and little or no passage. For example, the use of a cul de sac layout tends to create vulnerability
6 Bill Hillier in THE COMMON LANGUAGE OF SPACE:
a way of looking at the social, economic and environmental functioning of cities on a common basis.

by increasing entrance-free space, and greater delinearisation of spaces. In
general, safety seems to lie in linearity and in the continuity of building entrances through all spaces.
Figure 8; New Town X (Burglary in dwellings shown by red dots)

Software that is used in Space Syntax
The Laboratory of Space Syntax has developed several software’s that they use in their work. Space Syntax uses the software for its own research and at
universities around the world. (If you’re and academic you can be permitted access to the program by getting in touch with the office and presenting proof of your academic membership.)
Axman is a set of program for space syntax analysis which is based on Macintosh computer. This presents an analysis of sight lines for single buildings or entire
cities. It presents the sight lines graphically, overlaid on top on a plan or map. This is the programme used most by the office and it’s this program which colours the axial lines and presents the different depths.
Pesh is another software that is mostly used to analyze the flow for the interior of complex buildings like museums and workspace. It can show the pedestrian
movement and façade analysis. See figure below of British Museum.
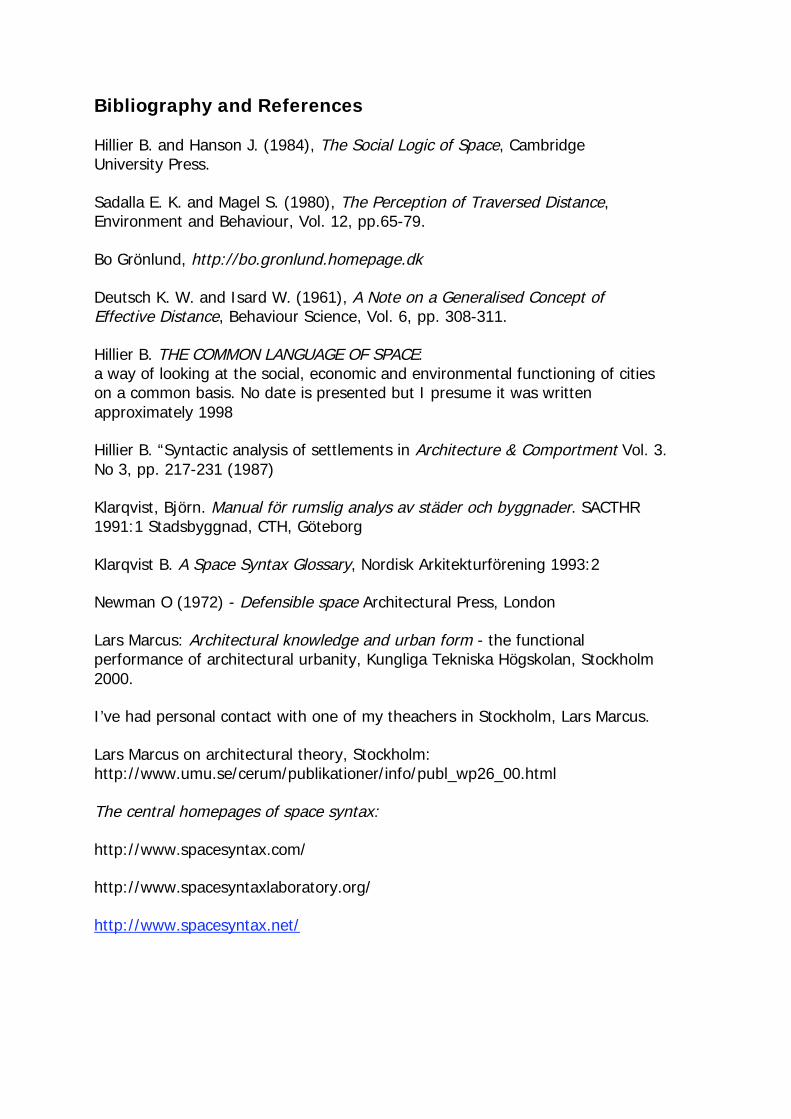
Space Box is used for detailed analysis of small urban areas such as public square or transport terminals. Used for example on the Trafalgar Square project.
They also work with an international program that has been used long time is GIS, Geographic Information Systems, which is a computer system capable of assembling, storing, manipulating, and displaying geographically referenced
information (i.e. spatial data). For example, GIS can show the concentration of a contaminant within a community in relation to points of reference such as streets and homes. In the strictest sense, it is a computer system capable of integrating,
storing, editing, analyzing, and displaying geographically-referenced information. In a more generic sense, GIS is a ”smart map” tool that allows users to create interactive queries, analyze the spatial information, and edit data.
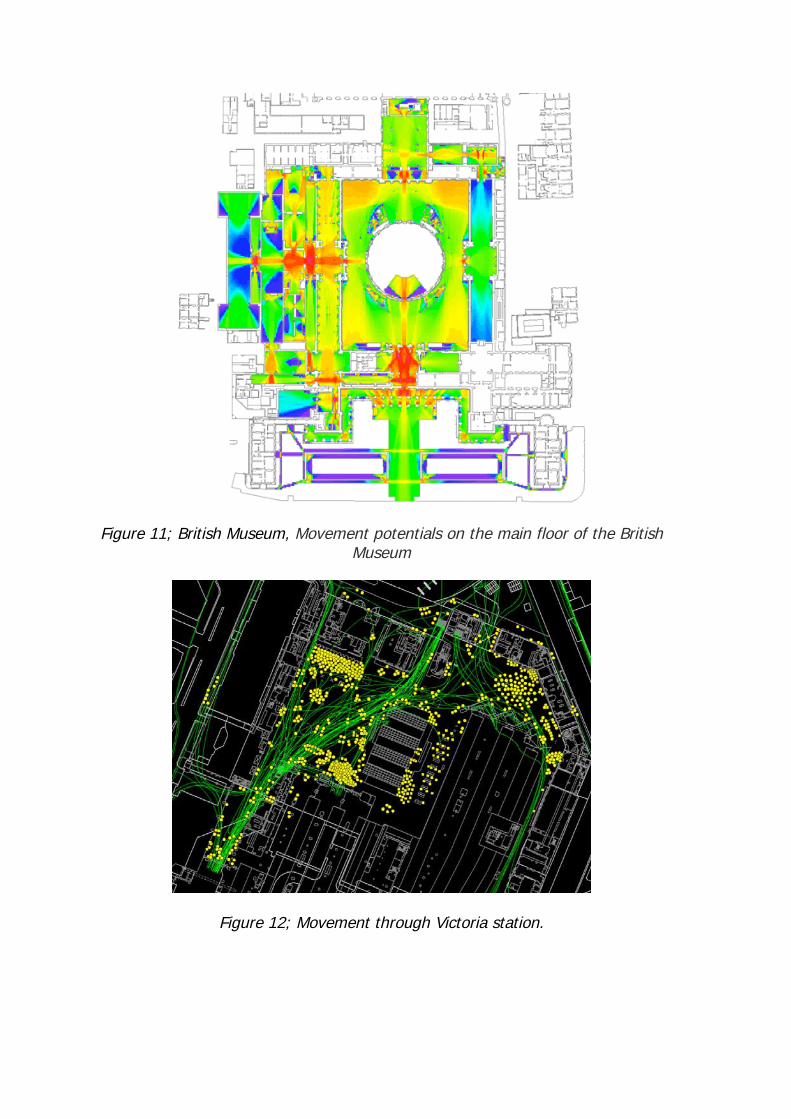
Figure 11; British Museum, Movement potentials on the main floor of the British Museum
Figure 12; Movement through Victoria station.

The method I’ve been explaining in this article has for me the fascination of
computer vs. reality. As they are all interesting maps and analyses, but let’s not forget that these maps are calculated by computers that of course doesn’t know where the shops are or which areas that are popular for the moment. But by
superposing the computer map with reality and field work that shows how people move and where the trends are its amazing to find that most of the times (if not all of the times) it turns out that the result shows the same. It is so
effective that since the early 1990s the method has been used on building and urban design projects by British architects Richard Rogers, Norman Foster, Terry Farrell, Michael Hopkins, Nicholas Grimshaw, and Zaha Hadid. Usually the
architects turn to Space Syntax, which is an independent company since 1989, in an early faze of their work.
The company works today as consultants to help urban developers with spatial analyses and to visualise the flow of a site or location. It is a former student to Bill Hillier, Tom Stonor, who is managing director of Space Syntax Limited. He
explains: "The general rule is derived from the link between layout and movement. The majority of pedestrians will always veer toward the simplest
route. It is surprising how many designers do not appreciate this. Many of us have been taught the opposite — that complexity creates interest. Unfortunately that isn't strictly true." 7&
8
With a growing international reputation, the company now has offices in Sydney, Seoul, Paris, Brussels, Stockholm, and Athens, the evidence-based design and
planning concept appears ready to become a standard for major urban regeneration projects throughout the world.
7 Architecture Week, Don Barker, 31 October 2005
8 Also on the web site www.spacesyntax.com
Bibliography and References
Hillier B. and Hanson J. (1984), The Social Logic of Space, Cambridge University Press.
Sadalla E. K. and Magel S. (1980), The Perception of Traversed Distance, Environment and Behaviour, Vol. 12, pp.65-79.
Bo Grönlund, http://bo.gronlund.homepage.dk
Deutsch K. W. and Isard W. (1961), A Note on a Generalised Concept of Effective Distance, Behaviour Science, Vol. 6, pp. 308-311.
Hillier B. THE COMMON LANGUAGE OF SPACE: a way of looking at the social, economic and environmental functioning of cities on a common basis. No date is presented but I presume it was written
approximately 1998
Hillier B. “Syntactic analysis of settlements in Architecture & Comportment Vol. 3.
No 3, pp. 217-231 (1987)
Klarqvist, Björn. Manual för rumslig analys av städer och byggnader. SACTHR 1991:1 Stadsbyggnad, CTH, Göteborg
Klarqvist B. A Space Syntax Glossary, Nordisk Arkitekturförening 1993:2
Newman O (1972) - Defensible space Architectural Press, London
Lars Marcus: Architectural knowledge and urban form - the functional performance of architectural urbanity, Kungliga Tekniska Högskolan, Stockholm
2000.
I’ve had personal contact with one of my theachers in Stockholm, Lars Marcus.
Lars Marcus on architectural theory, Stockholm: http://www.umu.se/cerum/publikationer/info/publ_wp26_00.html
The central homepages of space syntax:
http://www.spacesyntax.com/
http://www.spacesyntaxlaboratory.org/
http://www.spacesyntax.net/
