what is real? how do you deÞne real
TRANSCRIPT

1
“ If you're talking about what you can feel, what you can smell, what you
can taste and see, then !real" is simply electrical signals interpreted by your
brain. This is the world that you know."
Morpheus, in the Matrix.
What is real? How do you define !real"?
1. Encoding
encoding D&A ch.1readings:
3
• Neurons and Glial cells (insulating, supporting, nourishing neurons).
•10^11 neurons in human brain, each link to up to 10,000 other neurons.
The Brain Neurons
• neuron = cell, diverse morphologies
•2Dendrites: receive inputs from other cells, mediated via synapses.
•3 Soma (cell body): integrates signals from dendrites. 4-100 micrometers.•4 Action potential: All-or-nothing event generated if signals in soma exceed threshold.
•5 Axon: transfers signal to other neurons.
• Synapse: contact between pre- and postsynaptic cell. - Efficacy of transmission can vary over time.- Excitatory or inhibitory.- Chemical or electrical.10^16 synapses in young children (decreasing with age -- 1-5x10^15)

• Ions channels across the membrane, allowing ions to move in and out, with
selective permeability (mainly Na+, K+, Ca2+,Cl-)
• Vm: difference in potential between interior and exterior of the neuron.
• at rest, Vm~-70 mV (more Na+ outside, more K+ inside, due to N+/K+ pump)
• Following activation of (Glutamatergic) synapses, depolarization occurs.
• if depolarization > threshold, neuron generates an action potential (spike) (fast
100 mv depolarization that propagates along the axon, over long distances).
Membrane potential and action potential
• Axon terminate at synapse.
AP-> opens ion channels, influx of Ca2+,
release of neurotransmitter in the synaptic
cleft, which bind at the post-synaptic
receptors, causing ion-conducting channels
to open.
• Glutamate: main excitatory
neurotransmitter -- bind to AMPA, NMDA,
mGlu receptor, induces depolarization.
• GABA: main inhibitory neurotransmitter --
GABA receptor, induces hyperpolarization.
Synapses
• intracellular recordings (commonly in
vitro, sometimes in vivo (anesthesized,
paralyzed))
sharp electrode placed inside the neuron
patch electrode, sealed to the membrane.
view Vm.
• extracellular (often in vivo, possibly
awake behaving animal)
electrode is placed near a neuron.
view action potentials.
• Commonly, one neuron at a time, now
use of arrays of electrodes is beginning.
Electrophysiological Recordings
8
9Intracellular and Extracellular electrophysiology
10Excitatory and Inhibitory synapses -- EPSP and IPSP
A- 'Unaware'
Fixed !!
Decoder
Adaptation!
State
Population !
Response
Encoder!!! r
B- 'Aware'
Adaptive !!
Decoder
Adaptation!
State
Population !
Response
Encoder!!! r
s s
s s
Encoding problem: A- 'Unaware'
Fixed !!
Decoder
Adaptation!
State
Population !
Response
Encoder!!! r
B- 'Aware'
Adaptive !!
Decoder
Adaptation!
State
Population !
Response
Encoder!!! r
s s
s s
!180 !90 0 90 1800
25
50
!test
Re
sp
on
se
s
A ! Tuning Curves
!180 !90 0 90 180
0
25
50
!test
B ! Population Response
Perception: what we think the world is likeThe World
Activity in the brain
properties of neurons
P [r|s]
?
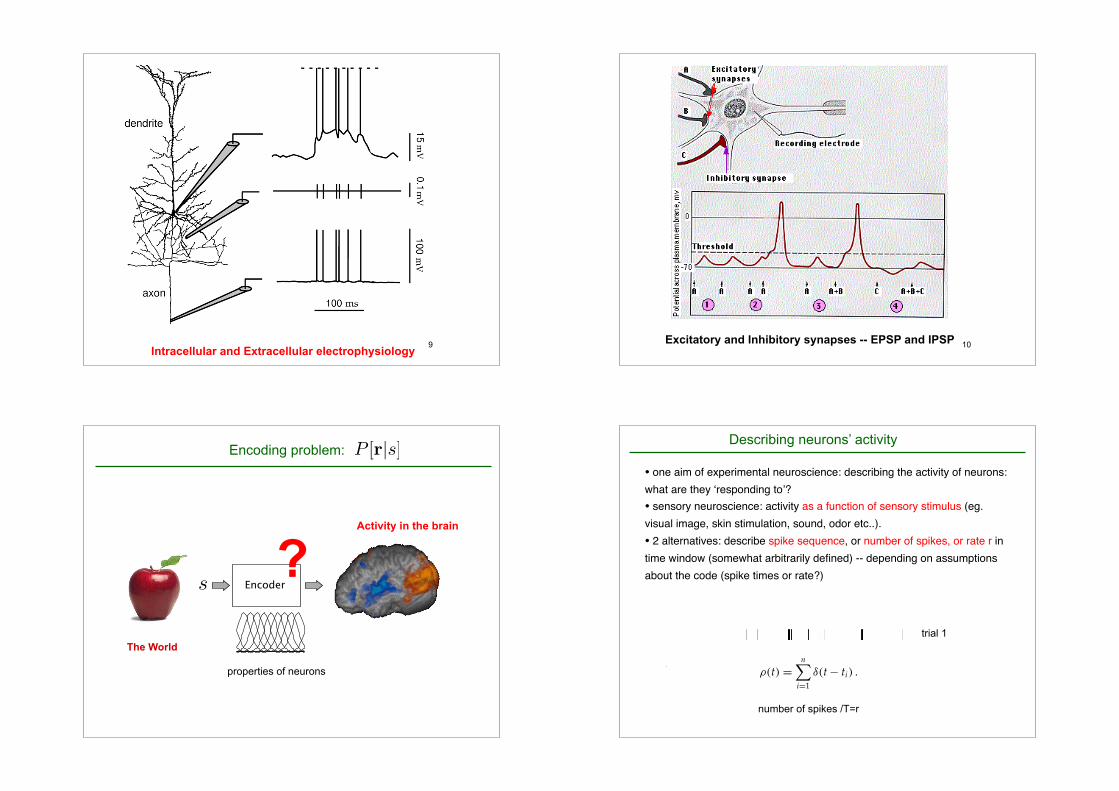
Describing neurons’ activity
• one aim of experimental neuroscience: describing the activity of neurons:
what are they !responding to"?
• sensory neuroscience: activity as a function of sensory stimulus (eg.
visual image, skin stimulation, sound, odor etc..).
• 2 alternatives: describe spike sequence, or number of spikes, or rate r in
time window (somewhat arbitrarily defined) -- depending on assumptions
about the code (spike times or rate?)
trial 1
trial 2
...
trial 5
1.2 Spike Trains and Firing Rates 7
neural encoding by showing how reverse-correlation methods are usedto construct estimates of firing rates in response to time-varying stimuli.These methods have been applied extensively to neural responses in theretina, lateral geniculate nucleus (LGN) of the thalamus, and primary vi-sual cortex, and we review the resulting models.
1.2 Spike Trains and Firing Rates
Action potentials convey information through their timing. Although ac-tion potentials can vary somewhat in duration, amplitude, and shape,they are typically treated in neural encoding studies as identical stereo-typed events. If we ignore the brief duration of an action potential (about1 ms), an action potential sequence can be characterized simply by a listof the times when spikes occurred. For n spikes, we denote these timesby ti with i = 1,2, . . . ,n. The trial during which the spikes are recordedis taken to start at time zero and end at time T, so 0 ≤ ti ≤ T for all i. Thespike sequence can also be represented as a sum of infinitesimally narrow,idealized spikes in the form of Dirac δ functions (see the MathematicalAppendix),
ρ(t) =n
∑
i=1δ(t− ti) . (1.1)
We call ρ(t) the neural response function and use it to re-express sums neural responsefunction ρ(t)over spikes as integrals over time. For example, for any well-behaved
function h(t), we can write
n∑
i=1h(t− ti) =
∫ T
0dτ h(τ)ρ(t− τ) (1.2)
where the integral is over the duration of the trial. The equality followsfrom the basic defining equation for a δ function, δ function
∫
dτ δ(t− τ)h(τ) = h(t) , (1.3)
provided that the limits of the integral surround the point t (if they do not,the integral is zero).
Because the sequence of action potentials generated by a given stimulustypically varies from trial to trial, neuronal responses are typically treatedprobabilistically, and characterized, for example, by the probability that aspike occurs at a particular time during a trial. Spike times are continuousvariables, and, as a result, the probability for a spike to occur at any pre-cisely specified time is actually zero. To get a nonzero value, we must askfor the probability that a spike occurs within a specified interval, for exam-ple the interval between times t and t+ $t. For small $t, the probability
Draft: December 17, 2000 Theoretical Neuroscience
number of spikes /T=r

Describing neurons’ activity
• Variability is very large --> statistical measures.
Average over many trial: trial average rate <r>.
Neurons in the visual cortex
In retina, LGN and visual cortex, the activity of neurons (spike count) is
correlated with some aspects of the visual image (contrast, orientation, color,
spatial frequency, ... in early visual cortex ... towards more complicated features
such as faces and object shapes in ‘higher’ areas).
= V1
1. Modeling the average firing rate <r(s)>
• Focus description on average firing rate <r(s)>.
• Tuning curves: modify an aspect s of the stimulus, and measure <r(s)>
• V1 neurons: highly selective to the orientation of the stimulus (e.g. bar) flashed in
their receptive field.
• Such bell-shaped (Gaussian-like) tuning curves are very common in the cortex.
s→< r(s) >
http://www.youtube.com/watch?v=MDJSnJ2cIFc
a) - Gaussian Tuning Curves
1.2 Spike Trains and Firing Rates 13
choice of parameters used as arguments of tuning curve functions is par-tially a matter of convention. Because tuning curves correspond to firingrates, they are measured in units of spikes per second or Hz.
Figure 1.5A shows extracellular recordings of a neuron in the primary vi- primary visualcortex V1sual cortex (V1) of a monkey. While these recordings were being made, a
bar of light was moved at different angles across the region of the visualfield where the cell responded to light. This region is called the recep-tive field of the neuron. Note that the number of action potentials fireddepends on the angle of orientation of the bar. The same effect is shownin figure 1.5B in the form of a response tuning curve, which indicates howthe average firing rate depends on the orientation of the light bar stimulus.The data have been fit by a response tuning curve of the form
A60
50
40
30
20
10
0-40 -20 0 20 40
s (orientation angle in degrees)
f (Hz)
B
Figure 1.5: A) Recordings from a neuron in the primary visual cortex of a monkey.A bar of light was moved across the receptive field of the cell at different angles.The diagrams to the left of each trace show the receptive field as a dashed squareand the light source as a black bar. The bidirectional motion of the light bar isindicated by the arrows. The angle of the bar indicates the orientation of the lightbar for the corresponding trace. B) Average firing rate of a cat V1 neuron plotted asa function of the orientation angle of the light bar stimulus. The curve is a fit usingthe function 1.14 with parameters rmax = 52.14 Hz, smax = 0◦, and σ f = 14.73◦. (Afrom Hubel and Wiesel, 1968; adapted from Wandell, 1995. B data points fromHenry et al., 1974).)
Gaussiantuning curve
f (s) = rmax exp
(
−12
(
s− smaxσ f
)2)
(1.14)
where s is the orientation angle of the light bar, smax is the orientation angleevoking the maximum average response rate rmax (with s− smax taken tolie in the range between -90◦ and +90◦), and σ f determines the width ofthe tuning curve. The neuron responds most vigorously when a stimulushaving s= smax is presented, so we call smax the preferred orientation angleof the neuron.
Draft: December 17, 2000 Theoretical Neuroscience
smaxrmax
σf
: preferred orientation;
: maximal response;
: tuning curve width (selectivity)
σf
smax
rmax
Cells are going to be described by:

b) - Sigmoidal response curves
1.2 Spike Trains and Firing Rates 15
Figure 1.7B shows how the average firing rate of a V1 neuron depends onretinal disparity and illustrates another important type of tuning curve.
FA
s
40
30
20
10
0
-1.0 -0.5 0.0 0.5 1.0
s (retinal disparity in degrees)
f (Hz)
B
Figure 1.7: A) Definition of retinal disparity. The grey lines show the location oneach retina of an object located nearer than the fixation point F. The image fromthe fixation point falls at the fovea in each eye, the small pit where the black linesmeet the retina. The image from a nearer object falls to the left of the fovea in theleft eye and to the right of the fovea in the right eye. For objects further away thanthe fixation point, this would be reversed. The disparity angle s is indicated inthe figure. B) Average firing rate of a cat V1 neuron responding to separate barsof light illuminating each eye plotted as a function of the disparity. Because thisneuron fires for positive s values it is called a far-tuned cell. The curve is a fit usingthe function 1.17 with parameters rmax = 36.03 Hz, s1/2 = 0.036◦, and !s = 0.029◦.(A adapted fromWandell, 1995; B data points from Poggio and Talbot, 1981.)
Retinal disparity is a difference in the retinal location of an image betweenthe two eyes (figure 1.7A). Some neurons in area V1 are sensitive to dispar-ity, representing an early stage in the representation of viewing distance.In figure 1.7B, the data points have been fit with a tuning curve called a sigmoidal
tuning curvelogistic or sigmoidal function,
f (s) = rmax
1+ exp(
(s1/2 − s)/!s
) . (1.17)
In this case, s is the retinal disparity, the parameter s1/2 is the disparitythat produces a firing rate half as big as the maximum value rmax, and !s
controls how quickly the firing rate increases as a function of s. If !s isnegative, the firing rate is a monotonically decreasing function of s ratherthan a monotonically increasing function as in figure 1.7B.
Spike-Count Variability
Tuning curves allow us to predict the average firing rate, but they do notdescribe how the spike-count firing rate r varies about its mean value〈r〉 = f (s) from trial to trial. While the map from stimulus to average
Draft: December 17, 2000 Theoretical Neuroscience
• For some other dimensions, sigmoidal or logistic response functions
• E.g. Luminance, Contrast, Retinal Disparity (depth / fixation point).
rmax
∆s
: s at half response
: slope’s sign and steepness
s1/2
Stimulus features encoded in V1
[Sceniak et al, 2002]
[Foster et al, 1985]
• Many different features are encoded in
V1: spatial position (retinotopy),
orientation, direction, contrast, spatial
frequency, temporal frequency, color,
depth ...
• a variety of tuning/ response shapes.