what is an ecosystem?
DESCRIPTION
What is an Ecosystem?. An ecosystem refers to the natural systems in which energy is passed from one organism to another and matter is recycled. An ecosystem includes all of the biotic and abiotic factors which are interrelated in an area. Ecology. - PowerPoint PPT PresentationTRANSCRIPT
What is an Ecosystem?
An ecosystem refers to the natural systems in which energy is passed from one organism to another and matter is recycled.
An ecosystem includes all of the biotic and abiotic factors which are interrelated in an area.
Ecology
Ecology is the study of ecosystems and the way in which living things interact with each other and their surroundings.
Ecologist take quantitative and qualitative measurements of the abiotic environment, individual organisms and populations. These measurements provide insight into the interactions between organisms and their environment.
Changes within an ecosystem cause consequential changes in other areas of the ecosystem and ecologists attempt to predict and study the ways in which ecosystems respond to change.
The biosphere
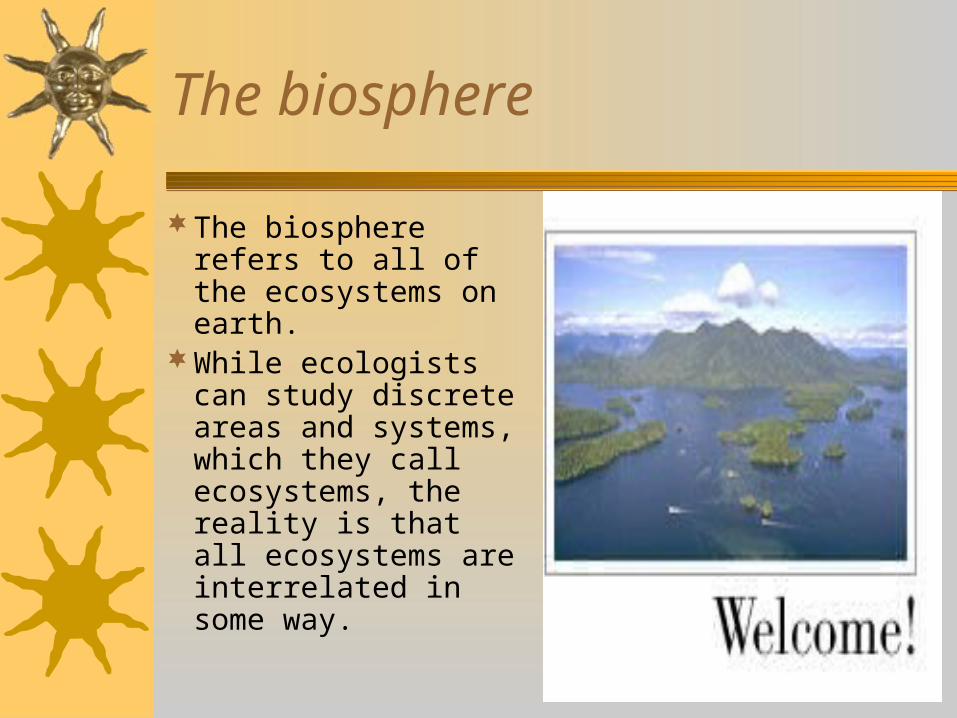
The biosphere refers to all of the ecosystems on earth.
While ecologists can study discrete areas and systems, which they call ecosystems, the reality is that all ecosystems are interrelated in some way.
Populations
A population is a group of organisms of the same species living in a certain area at a particular time.
A population can change in:– Density– Geographical distribution– Age distribution– Fecundity– Size– Relative abundance
Population Density
Population density is the number of individuals of a species per unit area.
For example, the number of sheep per hectare.
Population density is calculated by dividing the total number of individuals by the total area. The result will be a number per unit area.
Geographical Distribution
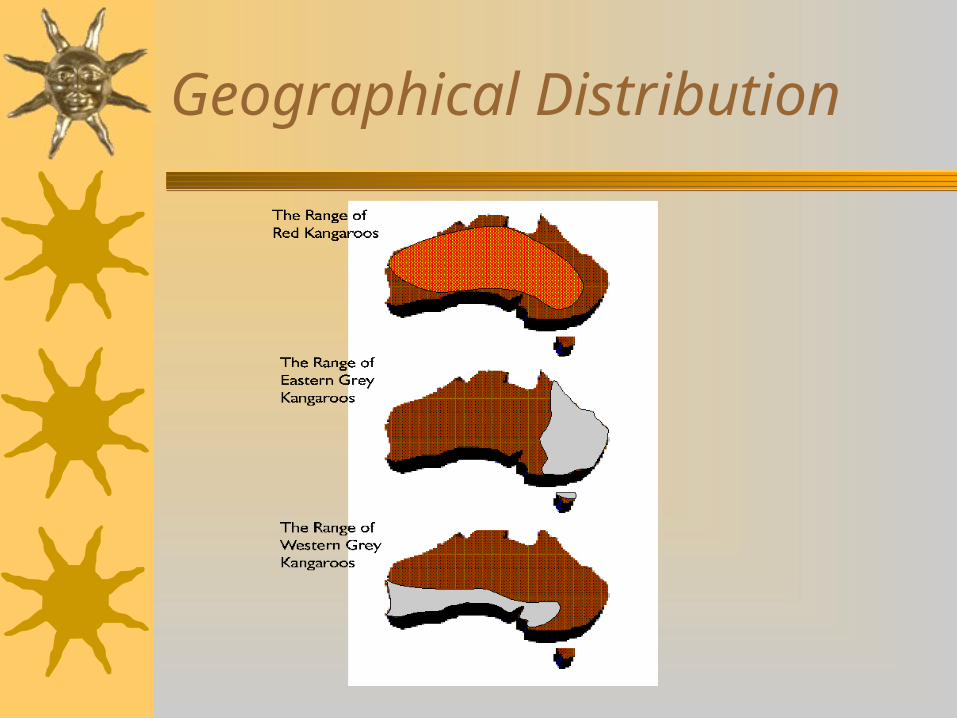
This is a measurement of population dynamics which gives an indication of the places within an environment where individuals of a population are found.
This information is normally presented in graphical or map form however it can also be presented in tabular form with reference to specific points within an ecosystem.
Geographical Distribution
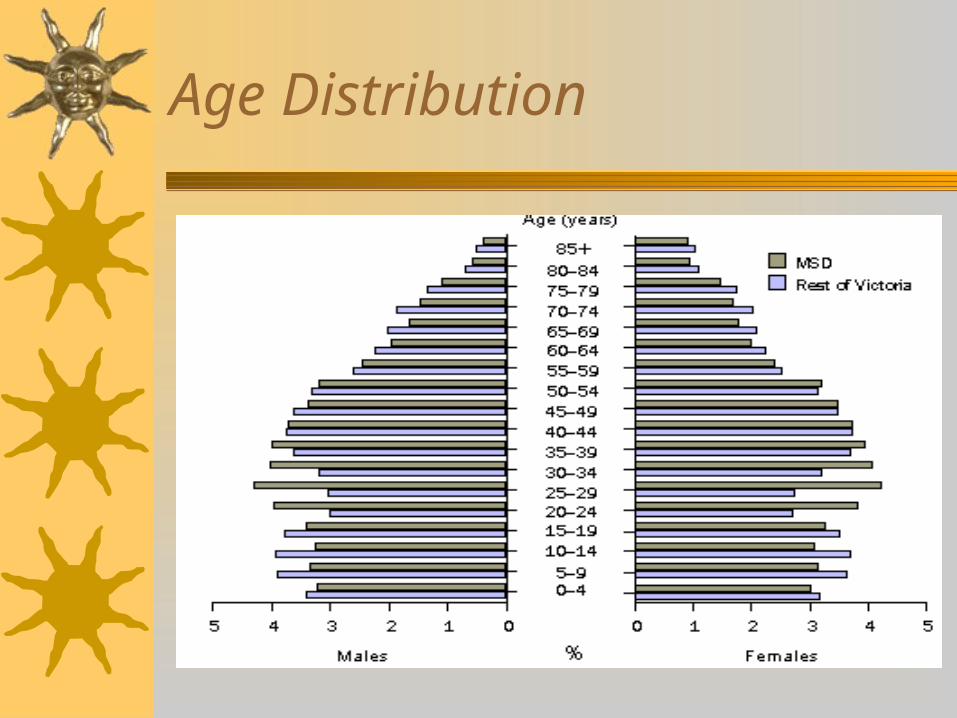
Age Distribution
This information is normally presented as bar graphs or specialised histograms.
It provides information on the relative numbers of individuals within a population within specified age ranges
Age Distribution
Fecundity
The fecundity of a population refers to the number of offspring produced in a given time in relation to the number of mature females.
This information is useful when studying the population dynamics of a population, particularly in relation to its potential for growth.
Population Size
The number of individuals is an important measure of any population.
A related measure is the growth rate. This provides information on the rate at which a population will increase.
It is normally expressed as a number per proportion of the original population.
50 per 1000 increase in the sheep population.A percentage can also be calculated to give a
clear picture.
Calculating population growth
The formula for calculating population growth takes into account all additions and reductions in the population.
The formula is:
– (births + immigration)-(deaths + emigration)
A worked example
The population of wood ducks in Kelmscott fluctuates considerably in the course of a year. In January 2003, the population was 15 000. During the course of the year, their were 8000 births and 4500 deaths. A further 2000 birds immigrated into Kelmscott and 1500 birds left the area.
A worked example
First, substitute the values into the formula
= (8000 + 2000) – (4500 +1500) This equates to 4000 increase.As a proportion of the total population, this
would be – 4000/15 000 = growth rate of .26666
A worked example
.26666 per individual does not provide a clear picture of the growth rate of the population.
So, (4000/15000)x100 = 26%. This means that the population of wood ducks in Kelmscott is increasing at a rate of 26% per year.
Relative abundance
The relative abundance of an organism reflects a relationship between one population and another.
An example of this would be the relationship between rabbits and foxes. We might say that there are 25 rabbits to each fox or the fox population is 25% of the rabbit population.
Question Set 1
What is an ecosystem?An ecosystem refers to the natural systems
in which energy is passed from one organism to another and matter is recycled.
An ecosystem includes all of the biotic and abiotic factors which are interrelated in an area.
Question Set 1
What is population density?Population density is the number of
individuals of a species per unit area.
Question Set 1
What is the formula for calculating the growth rate of a population?– (births + immigration)-(deaths + emigration)
Question Set 1
What is fecundity a measure of in a population?
The fecundity of a population refers to the number of offspring produced in a given time in relation to the number of mature females.
Communities and Biomes
A community is a group of organisms belonging to different species which live in the same area and interact with one another.
A biome is a major ecological unit within a community.
Trophic Relationships
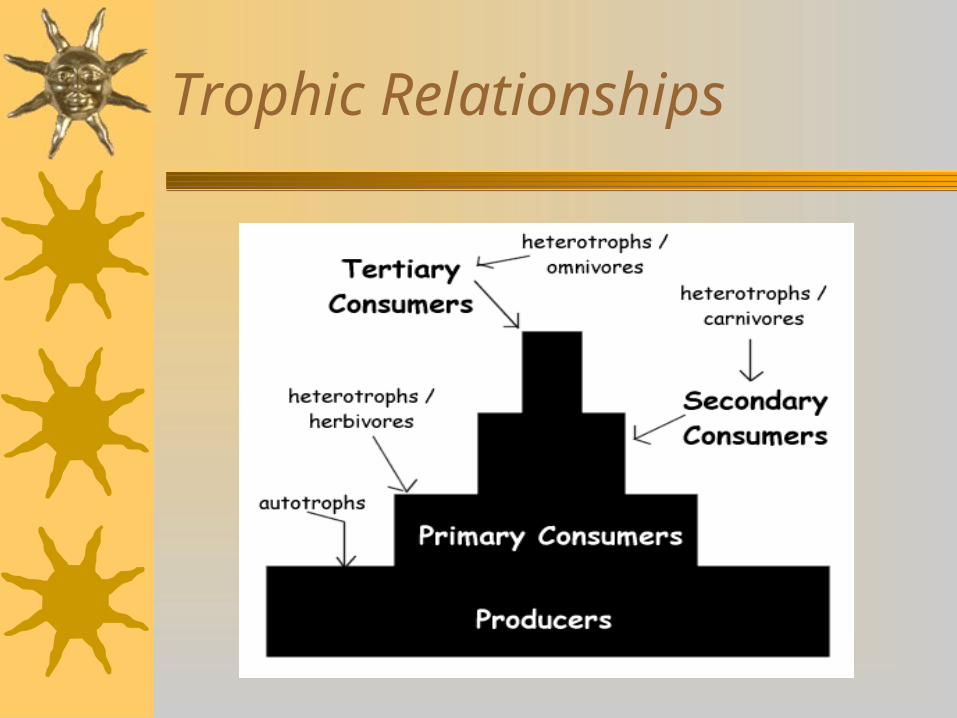
Ecologists spend considerable time studying the feeding relationships between organisms.
Particularly, ecologists will examine the relationship between autotrophs and heterotrophs.
The trophic levels in an ecosystem represent the feeding hierarchy.
Trophic Relationships
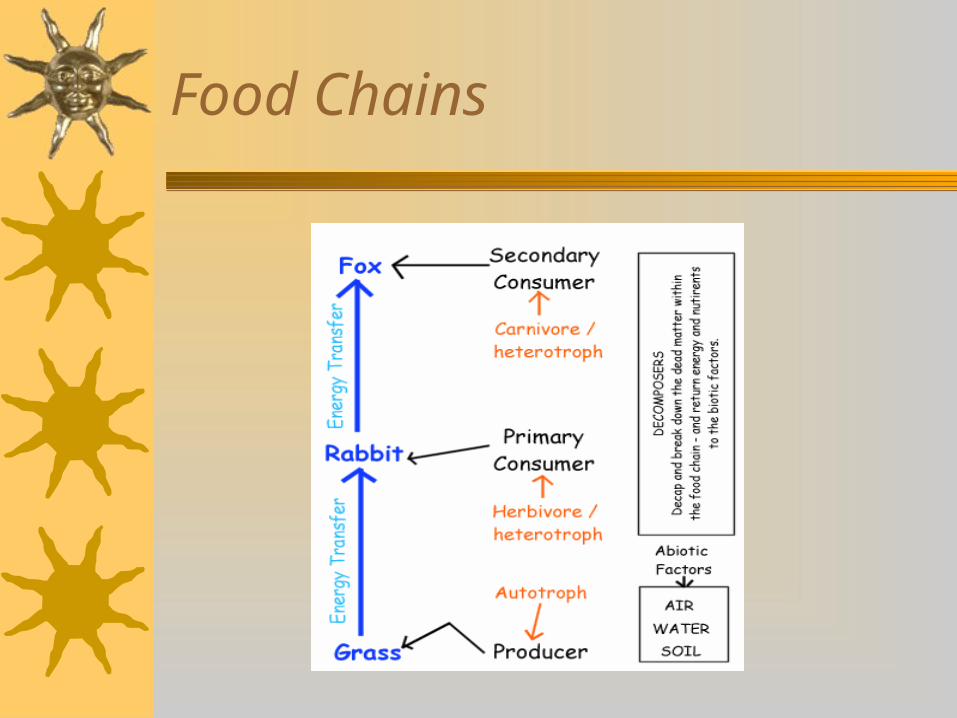
Food Chains
A food chain represents the one to one feeding relationship between organisms.
All food chains should include an autotroph as this is the original source of energy in any ecosystem.
Each arrow represents the transfer of energy from one organism to another.
It is important to note that energy from the sun and energy lost to the environment as heat are generally not included in food chains.
Food Chains
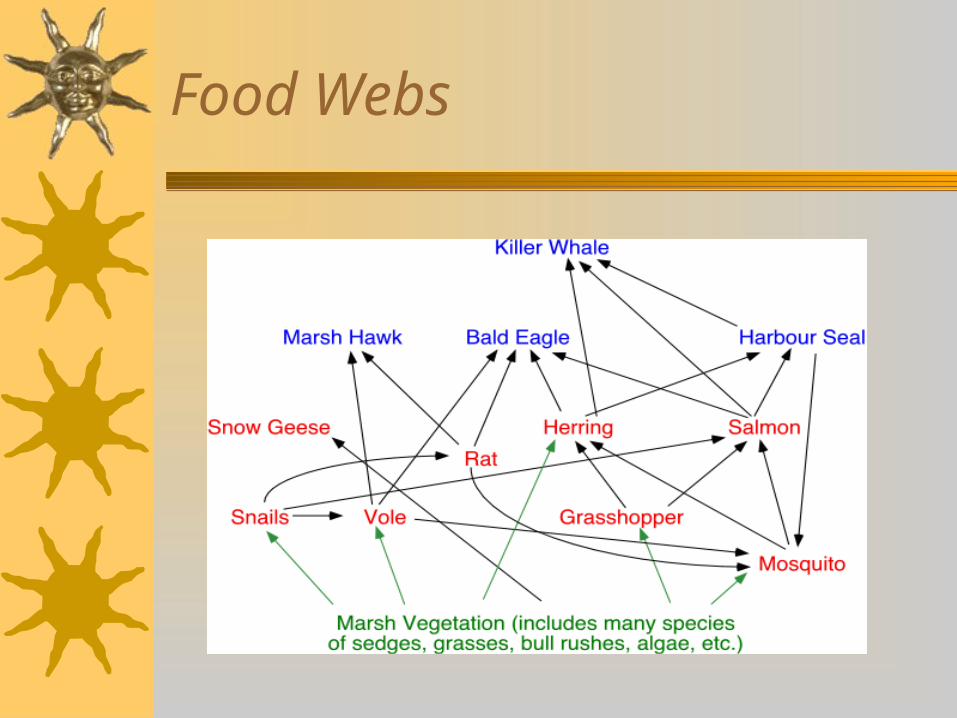
Food Webs
Food webs are a more comprehensive representation of the feeding relationships which occur in an ecosystem.
They show all of the interrelationships between organisms in an ecosystem.
Food webs also show the competition for various food sources within an ecosystem.
Food Webs
Energy Transfers
It is important to note that not all of the energy available at one trophic level is transferred to the next.
Approximately 10% is transferred from one trophic level to the next while significant amounts of energy are lost at each trophic level in the form of heat.
It is also important to note that energy is not recycled in an ecosystem.
Question Set 2
What is the difference between a food web and a food chain?
A food chain represents the one to one feeding relationship between organisms.
Food webs are a more comprehensive representation of the feeding relationships which occur in an ecosystem.
They show all of the interrelationships between organisms in an ecosystem.
Food webs also show the competition for various food sources within an ecosystem.
Question Set 2
Describe how energy is transferred through the various trophic levels of an ecosystem.
It is important to note that not all of the energy available at one trophic level is transferred to the next.
Approximately 10% is transferred from one trophic level to the next while significant amounts of energy are lost at each trophic level in the form of heat.
It is also important to note that energy is not recycled in an ecosystem.
Matter Dynamics
Examination of matter transfer in an ecosystem shows that matter is recycled .
Matter moves from autotrophs, through the various heterotrophic levels.
Ultimately, all matter passes through the decomposer level where it is broken down to its simplest form.
This results in the release of large amounts of heat energy and fundamental chemical substances which can then be re-utilised by autotrophs.
Matter Cycles
There are a number of significant matter cycles within ecosystems. The models of these illustrate how specific substances are cycled through an ecosystem.
These substances are:– Carbon
– Nitrogen
– Phosphorous
– Water
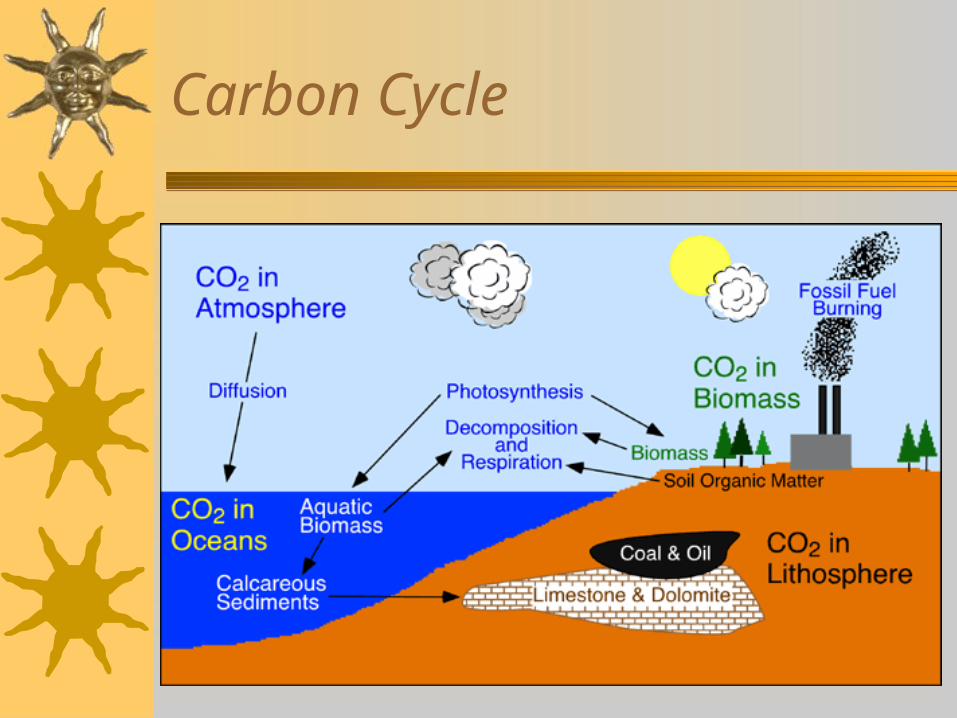
Carbon Cycle
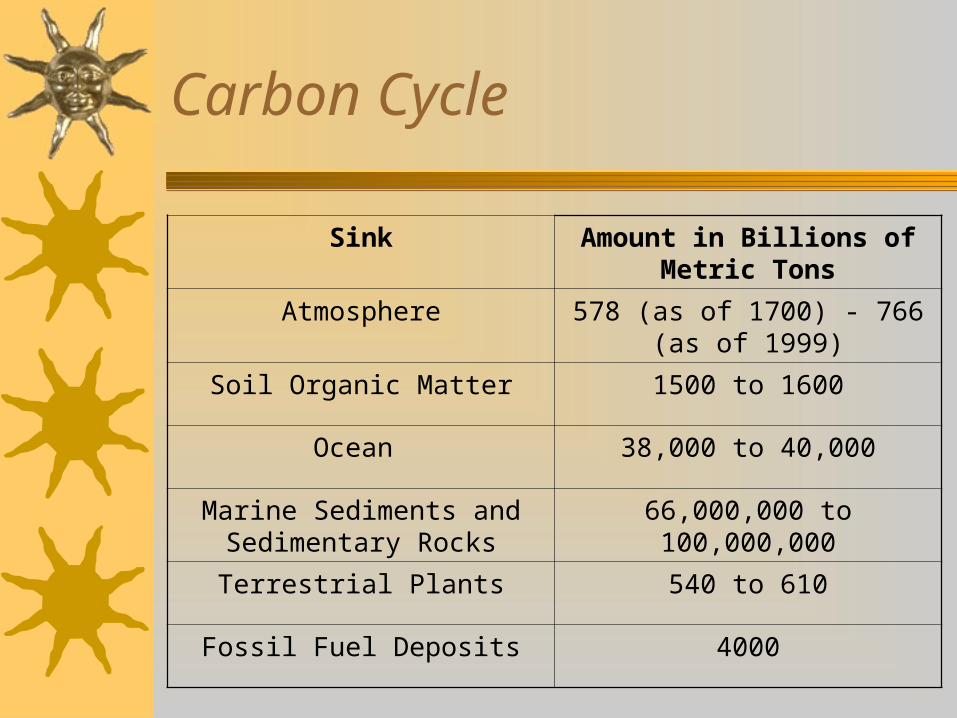
Carbon Cycle
Sink Amount in Billions of Metric Tons
Atmosphere 578 (as of 1700) - 766 (as of 1999)
Soil Organic Matter 1500 to 1600
Ocean 38,000 to 40,000
Marine Sediments and Sedimentary Rocks
66,000,000 to 100,000,000
Terrestrial Plants 540 to 610
Fossil Fuel Deposits 4000
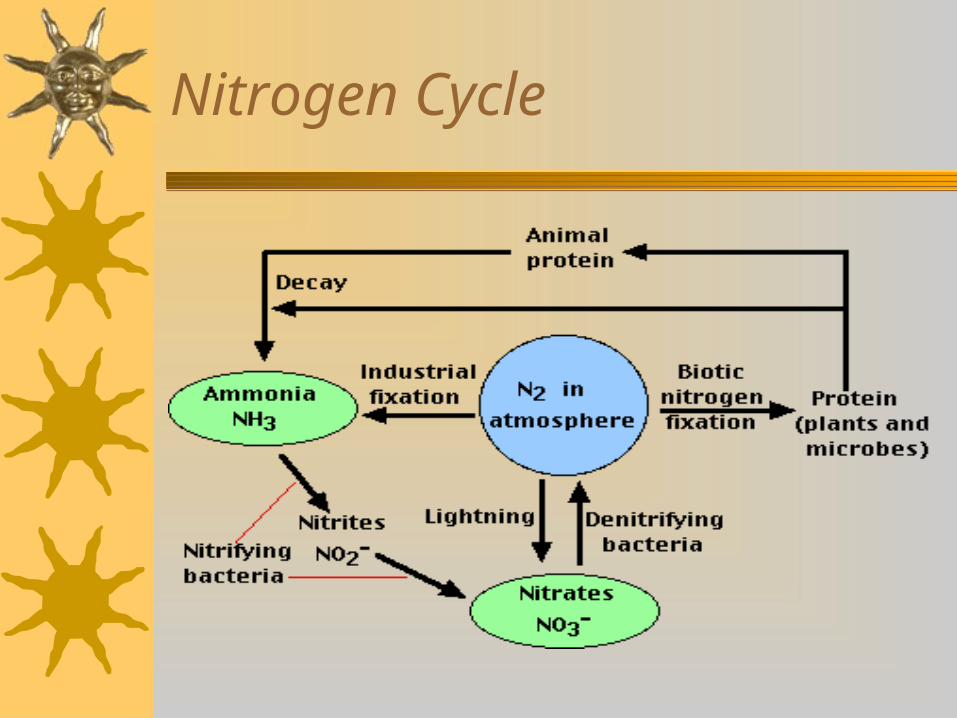
Nitrogen Cycle
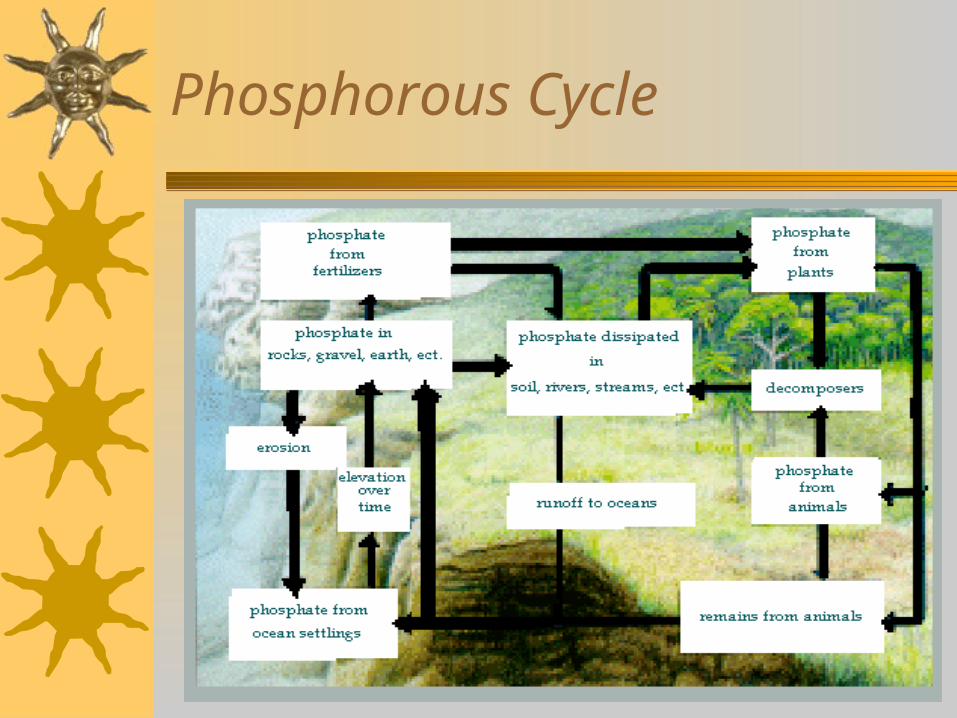
Phosphorous Cycle
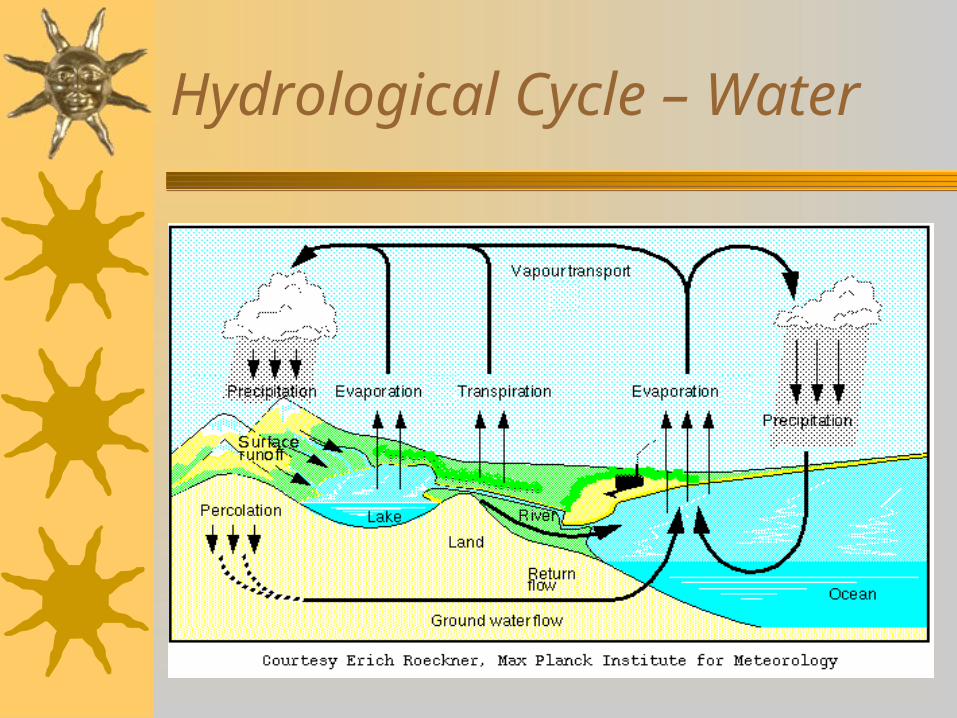
Hydrological Cycle – Water
Pollution of natural cycles
Generally, natural cycles exist in a state of equilibrium, whereby matter flows from one stage of the cycle to the next. There is not a build up matter at any one point.
However, the activities of man can result in a build up of matter in these natural cycles.
We call this build up pollution.
Pollution
An example of human activity resulting in a loss of equilibrium in a natural cycle is the build up carbon at particular points in the carbon cycle.
Carbon is released, as CO2, when we burn fossil fuels. Fossil fuels are a stored form of carbon in the environment. This carbon would normally remain fixed in oil reserves.
Pollution
As a result of our burning fossil fuel, large amounts of carbon are being released into the atmosphere.
This is having the significant effect of causing what we call global warming.
Cumulative Toxins
Cumulative toxins are those chemicals which have two characteristics:– They are passed from one trophic level to the next.– They do not break down.
The consequence of this is that these toxins gradually build up in the ecosystem. The higher the trophic level at which an organism functions, the more of these cumulative toxins will be present in their bodies. This is known as the magnification effect or biological magnification.
DDT
DDT is a banned pesticide which was used in the early to mid 20th century.
After extensive use, ecologist began to notice an accumulation of this substance in the various animals found in an exposed ecosystem.
They also noticed that the higher the trophic level of an organism the more DDT was found in their tissue.
DDT
An extreme consequence of this was the near extinction of large predatory birds, such as the Wedgetailed Eagle.
The effect of this cumulative poison on these birds was a reduction in the thickness of egg shells.
The birth rates in these birds dropped significantly before the effect of this toxin was noticed.
Metals in the environment
Metals can also become a cumulative toxin in the environment.
These metals include lead and mercury which cause damage to the nervous system.
They also include the metals cadmium, arsenic and selenium which are carcinogenic.
Question Set 3
What is pollution?Generally, natural cycles exist in a state of
equilibrium, whereby matter flows from one stage of the cycle to the next. There is not a build up matter at any one point.
However, the activities of man can result in a build up of matter in these natural cycles.
We call this build up pollution.
Question Set 3
What is biological magnification?Toxins gradually build up in the
ecosystem. The higher the trophic level at which an organism functions, the more of these cumulative toxins will be present in their bodies. This is known as the magnification effect or biological magnification.
Biological Pyramids
Biological pyramids represent the distribution of matter in the environment.
They include:– Biomass pyramids– Abundance pyramids
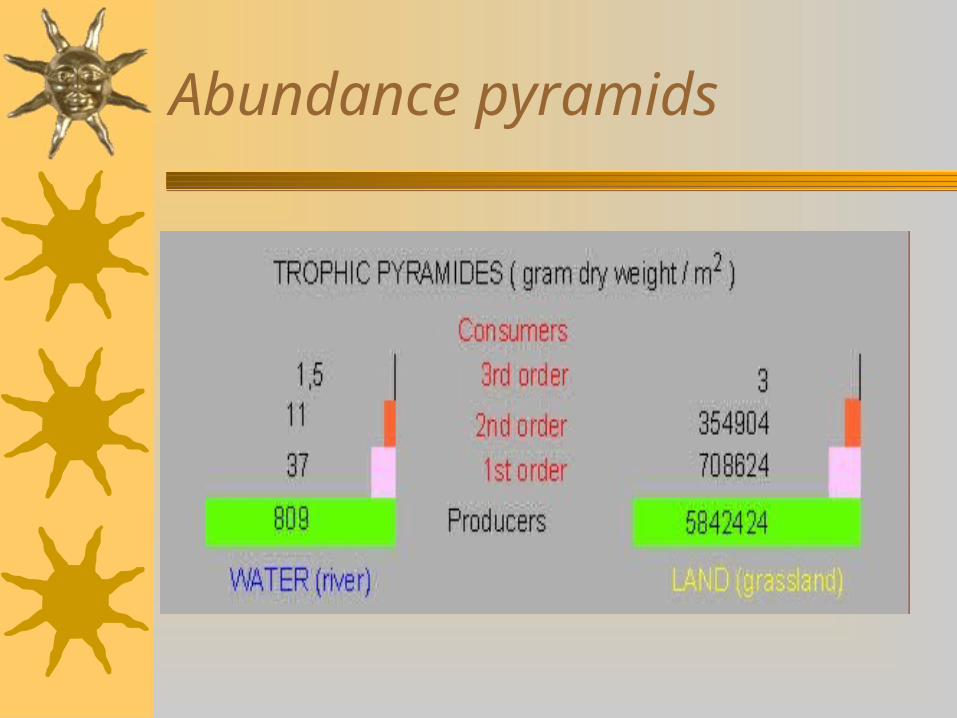
Abundance pyramids
Abundance pyramids show the number of organisms at each of the trophic levels of an ecosystem.
Generally, there are greater numbers of organisms at the base of these pyramids, and numbers gradually decrease towards the top.
It is important to note that abundance pyramids can be a little deceiving since greater numbers of organisms at a trophic level may not mean that there is more biomass. Millions of insects at a trophic level would have very little biomass.
Abundance pyramids
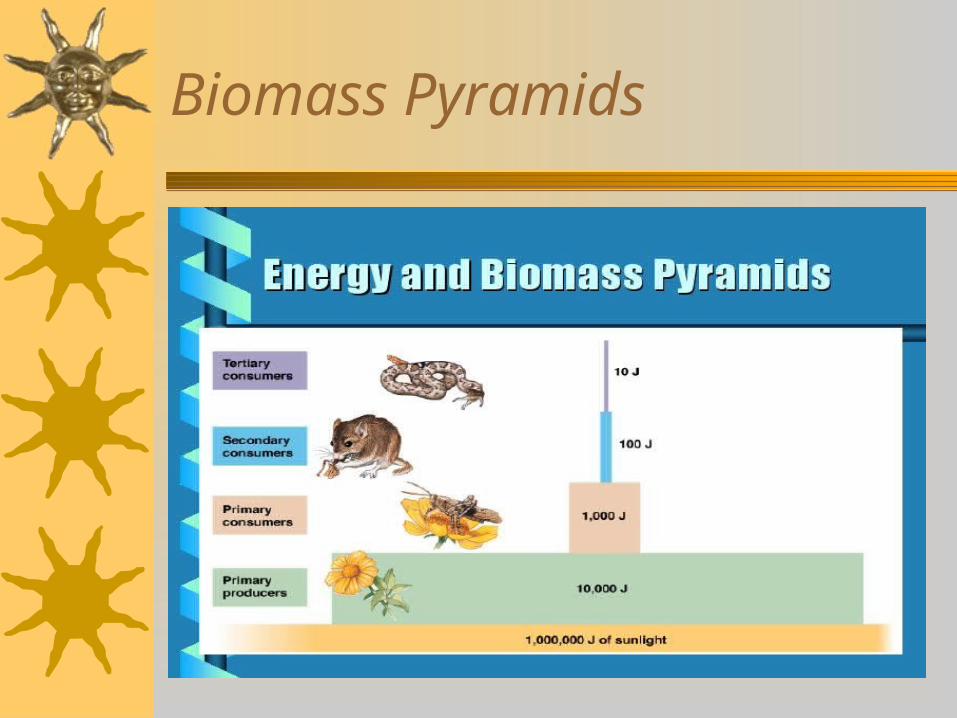
Biomass Pyramids
Biomass pyramids are more often used by ecologists to represent the distribution of matter in an ecosystem.
Each of the levels of a biomass pyramid represents the amount of matter (productivity) which is contained in that level.
Biomass Pyramids
Question Set 4
What is the difference in the information provided by a biomass pyramid and an abundance pyramid?
Abundance pyramids show the number of organisms at each of the trophic levels of an ecosystem.
Each of the levels of a biomass pyramid represents the amount of matter (productivity) which is contained in that level.
Changes in an ecosystem
Changes often occur in an ecosystem, which upset the natural balance and flow of matter and energy.
Events which might cause such imbalance include:– Human destruction of ecosystems.– Fire– Widespread disease which eliminates one or more
species– Flood
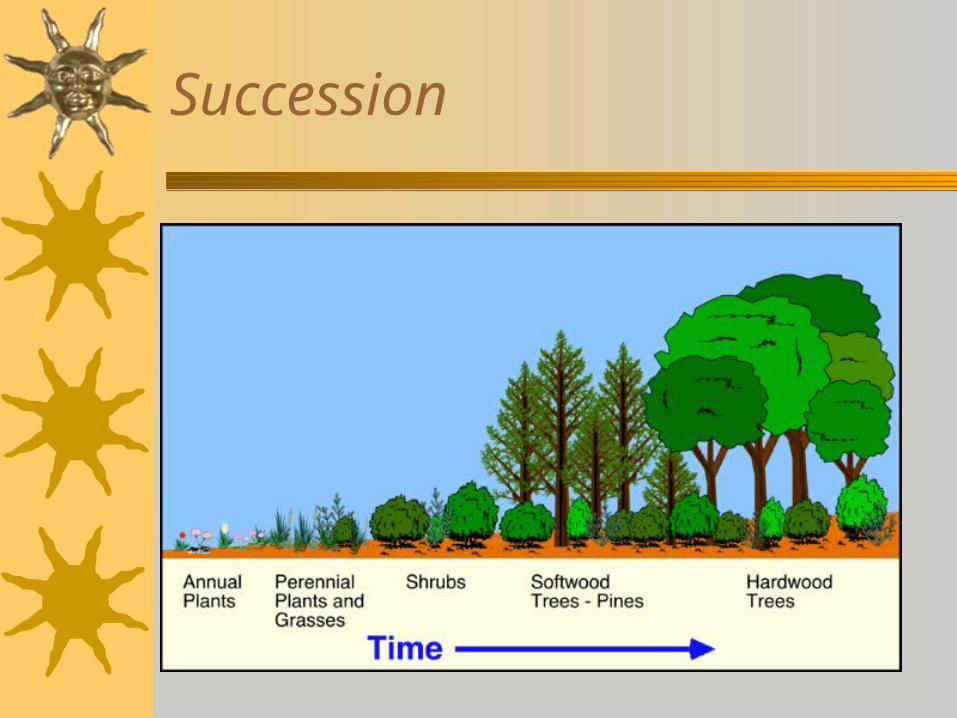
Succession
Succession is the process whereby organisms, plant and animal, recolonise an area which has been damaged.
Succession should be seen as the progressive and gradual modification of an environment by the organisms living in the area.
Succession
As organisms colonise an area they gradually change it, for example, by adding humus to the poor soil on a rocky outcrop.
Over time, conditions become more and more suitable for other organisms to move into the area.
Some organisms find that the new conditions are no longer favourable and hence die out, while others find the new conditions favourable and begin to move in.
Succession
This process will continue until a new, and balanced, ecosystem is established.
If this process starts from scratch, for example after a volcanic eruption, it is known as Primary Succession.
Succession
Secondary Succession
This is a form of succession which occurs when the environmental conditions in an area gradually change.
As a result of the change, some organisms no longer find the conditions favourable.
The result is a gradual change in the species present in an area.
An example of this is the changes in the environment which occurred from the time that sea levels rose and cut Rottnest Island off from the mainland.
Question Set 5
What is succession?Succession is the process whereby
organisms, plant and animal, recolonise an area which has been damaged.
Succession should be seen as the progressive and gradual modification of an environment by the organisms living in the area.
Question Set 5
What is the difference between primary and secondary succession?
If succession starts from scratch, for example after a volcanic eruption, it is known as Primary Succession.
If succession occurs when the environmental conditions in an area gradually change it is known as secondary succession.
Species Introduction
One of the most significant effects which man has on environments is the introduction of organisms into an environment.
It is important to note that established and balanced ecosystems have gradually established over extended periods of time.
The organisms which form the ecosystems have adapted and evolved together and often form a close relationship which is ultimately beneficial to the overall balance in an area.
Species Introduction
New plant and animal species which are introduced may not suit the environment and die out quickly.
However, problems occur when an introduced species is very well suited to the new environment and proves to be extremely competitive.
In these situation, the introduced species will often take over the niche of one or more indigenous species .
In extreme cases the introduced species will change the natural conditions in the ecosystem, rendering it uninhabitable for many natural organisms.
Some examples
Some examples of introduced species in Australia which have had a detrimental effect on local ecosystems are:– Foxes– Rabbits– Bridal Creeper– Cane Toads– Donkeys and Horses– Prickly Pear– Veldt grass– Kikuyi Grass– Blackberry Bush
Special Note
While the introduction of a species into an ecosystem can have a devastating effect, removal of indigenous species can equally cause imbalance and ecological degradation.
The worldwide reduction in phytoplankton in the oceans is a good example of the effect which removal of a species may have.
The human effect on ecosystems
Clearly, humans use ecosystems for a wide range of purposes. This often involves modification of the ecosystem so that it does not bare any resemblance to the original ecosystem. An example of this is clearing for farming or mining.
In other situations humans use resources which are available within a natural ecosystem. An example of this is fishing or logging.
Natural Ecosystems
We have already reviewed the characteristics of a natural ecosystem. They include:– A natural balance of biomass and energy flow.
– Little or no accumulation of matter at any one point in the ecosystem.
– Sustainability.
– Little or no import of energy or biomass.
Modified Ecosystems
These are ecosystems which are either natural and have been changed to suit mans needs or ecosystems which are unnatural but are established by man.
An example of such ecosystems include farms and towns in which there is a clear flow of energy and biomass. However, often considerable biomass and energy is either lost or gained.
Managed Natural Ecosystems
Some ecosystems provide valuable resources for human use.
These ecosystems need to be managed so that the removable of the sought resource is sustainable.
This is often contentious and difficult to establish because the measurement of natural ecosystems is difficult.;
Often, it is the degradation of an ecosystem which first signals that too many resources are being withdrawn from an ecosystem.
The Fisheries Industry
A good example of the management of a natural ecosystems is the fisheries industry.
Specifically, the management of the Western Australian Crayfish industry has proved to be sustainable over extended periods of time.
The Fisheries Department conducts research, controls fishing licences and sets bag limits in order to ensure that sustainable levels of fishing occur.
Agricultural Ecosystems
These are an example of another managed ecosystem.
Agricultural ecosystems can involve minimal change to natural ecosystems through to large scale monocultures such as wheat farming.
In general, agricultural ecosystems will not naturally sustain themselves and need constant tending by humans to ensure that sought resources are produced.
Agricultural Ecosystems
The general features of an agricultural ecosystem are:– Lower or reduced biodiversity in relation to a
natural ecosystem in the same area.– Nutrient flow is often disrupted or reduced.– Large amounts of matter are removed at cropping.– Large amounts of energy are artificially introduced
and removed.
Urban Ecosystems
Urban ecosystems are often the least stable of ecosystems.
Modern town planning is now acknowledging that much needs to be done to integrate towns into the natural environment rather than removing the natural environment completely.
Sustainable human activity with minimal pollution is becoming more and more important.
Urban Ecosystems
The characteristics of an urban ecosystem include:– Large amounts of chemical energy is introduced to the
biotic environment.– Large amounts of raw materials and manufactured
biomass are introduced to the ecosystem.– Large amounts of heat energy are produced and lost.– Large amounts of chemical energy are produced and
often pollute the environment.– Large amounts of energy importing and exporting.– Unsustainable.
Human Population Dynamics
The human population is growing at an exponential rate.
The time it takes for the population to double in size (doubling time) has reduced, on average, from 200 years (1650) to 35 years (1950).
The doubling time is likely to be significantly less today in 2003.
Human Population Dynamics
The doubling time is significantly different in different areas of the world.
In many European countries the doubling time is 100 year or more.
In many African nations the doubling is as low as 20 years.
This causes significant problems in environmental degradation and food production.
Malthusian Theory
Also known as Doomsday Theory.This theory basically uses food production
rates and human growth rates to attempt to predict a point at which the human population can no longer be sustained on the Earth.
Malthusian Theory
The difficulty in predicting the point at which human populations can no longer be sustained are:– Food production technology is improving all the time.– Food production technology is applied across the world at
different rates. Some countries produce a surplus of food and either store the excess or destroy it to maintain market prices.
– While food production technology is improving, this does not take into account degradation of the natural environment.
– Some populations in the world may have already reached unsustainable levels while others may be considerable off this point.
Urbanisation
Urbanisation is the trend towards large populations living in cities and large towns while fewer people are choosing to live on the land in rural communities.
A further complication is that land is gradually sub-divided in urban areas so that the land on which people live can not sustain their basic needs.
In rural areas the opposite is occurring. Small sustainable farmers are being replaced by larger landholders so fewer people are in a position to lead a sustainable lifestyle.
Energy Consumption
Another unsustainable aspect of human activity is the use of energy.
Man uses many more non-renewable, polluting energy sources than sustainable clean energy sources.
Particularly, carbon emissions across the world are far too great and are now having an extremely detrimental effect on the atmosphere and the natural environment.
Another complicating factor is that a small number of developed countries use the vast majority of energy while less developed countries use very little.
Drinking Water
While water is not a scarce resource, drinking water is scarce. Further, drinking water is often more scarce in some areas of the world than others.
A complicating modern factor is the increasing rate at which humans either pollute natural drinking water or destroy natural systems which provide drinking water.
The development of dams across the world is also causing significant devastation with lost natural ecosystems and damage to the general species diversity of the planet.
Ozone Depletion
The ozone layer is a thin layer of ozone (O3) in the upper atmosphere.
It appears that this layer is extremely important in blocking ultra-violet wavelengths of light emitted from the sun.
As the ozone layer is damaged, the protection it offers against ultra-violet light is reduced. Ultra-violet light is a significant contributor to skin cancer in humans, and is a known mutagen (ie it damages DNA)
Ozone Depletion
Ozone is an unstable gas and can easily be broken down to form oxygen (O3 O2).
This primarily occurs because of the action of a volatile group of chemicals known as chlorofluorocarbons (CFC’s).
Cl + O3 ClO + O2
ClO + O Cl + O2
CFC’s have been used for a long time as propellants in aerosols and in refrigeration.
The use of CFC’s is largely outlawed today.
The Greenhouse Effect
This is a natural phenomenon, caused by the retention of heat from solar radiation. Gases such as CO2 and methane (CH4) trap the heat and keep the Earth at a reasonable temperature
However, the increased levels of carbon dioxide cause the excess heat to be trapped in the atmosphere, hence raising global temperatures in the long term. This is referred to as global warming
Global warming
The possible consequences of global warming are that: – world weather patterns will change. Rainfall will be directed to
different areas
– With a general increased in temperature the sea levels around the world will rise. The consequence of this may be the loss of large areas of land and even whole countries which are particularly low lying.
– The warmer water expands, which is the primary cause of a rise in sea level.
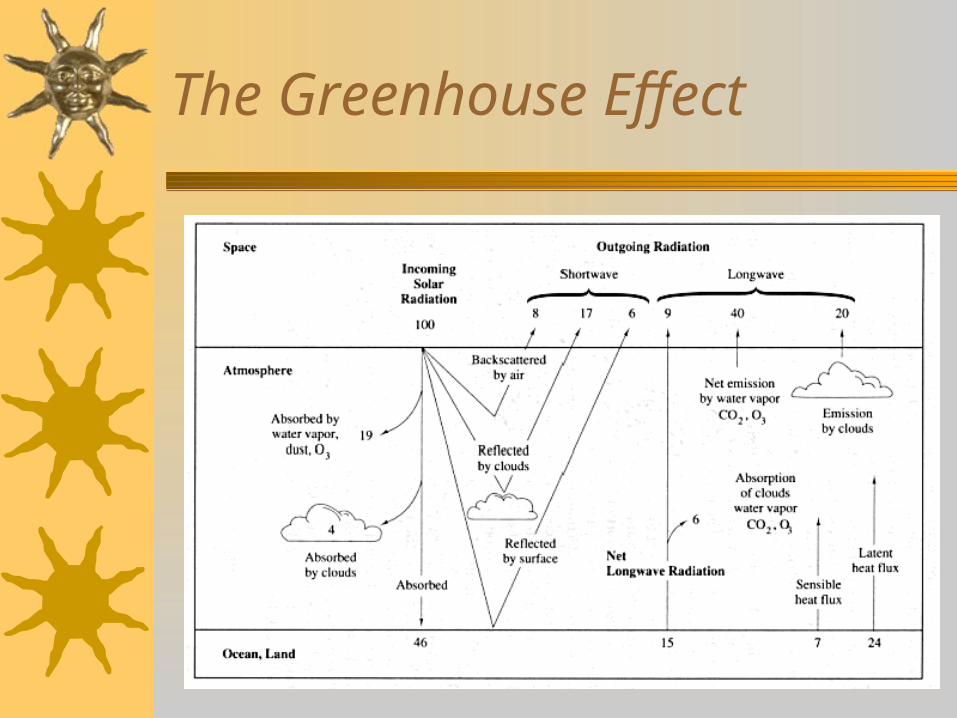
The Greenhouse Effect
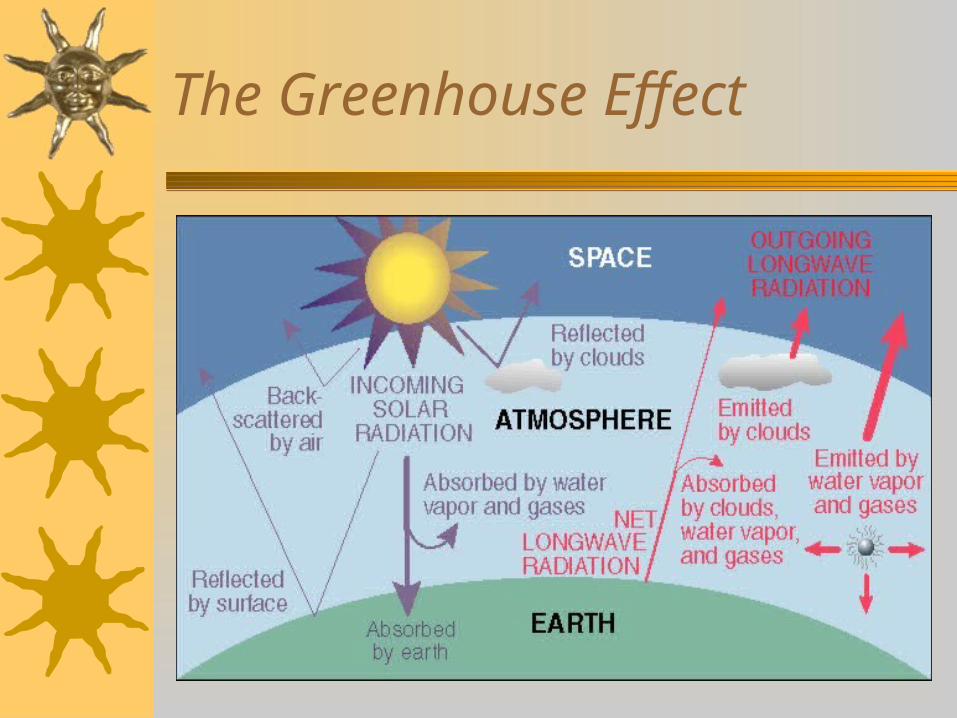
The Greenhouse Effect
Biodiversity
– What is it? It refers to the variety of plants, animals, fungi and micro-organisms, the genes they contain, and the ecosystems they form
– It is usually considered at three different levels:
1.Genetic diversity
2.Species diversity
3.Ecosystem diversity
Genetic diversity
Refers to the variety of genetic information contained in all of the individual organisms.
Occurs within and between populations of species as well as between species
Measured using a variety of DNA-based techniques
Species Diversity
Refers to the variety of species, measured as either species richness, species abundance or phylogenetic diversity
Species richness counts the number of species in an area Species abundance looks at the relative numbers, and
ends up with a scale like common, vary common or rare Phylogenetic diversity considers the genetic relationships
between different groups of organisms
Ecosystem diversity
This includes studying the broad differences between ecosystem types.
Harder to define than the other forms of diversity because the boundaries between ecosystems are not always clear.
Within individual ecosystems, there are microhabitats that can be used by different organisms. The greater the number of these, the greater the diversity
Reasons to conserve diversity
1. Ecosystem services: eg:protection of water resources, soil formation and protection, nutrient storage and recycling, pollution breakdown and absorption, climate stability and recovery from unpredictable events like flood, fire and cyclones
Reasons to conserve diversity continued
2. Biological resources: eg food, medicinal resources, wood products, ornamental species, breeding stocks and population reservoirs, and future resources
Reasons to conserve diversity continued
3. Social benefits: eg research and monitoring, recreation, cultural values, prevention of problems like salinity or soil erosion