what does a trade war with china look like? · 2018-07-02 · what does a trade war with china look...
TRANSCRIPT

What Does a Trade War with China Look Like?
Wendong Zhang & Chad HartAssistant Professor and Associate Professor of Economics and
Extension [email protected], [email protected]
Iowa Institute of Cooperatives Summer WorkshopHuxley, Iowa, June 21st, 2018

A Quick Introduction:Dr. Wendong Zhang
– Grown up in a rural county in NE China– Attended college in Shanghai and Hong Kong– Ph.D. in Ag Econ in 2015 from Ohio State– 2012 summer intern at USDA-ERS on farm economy
and farmland values– Research and extension interests: land value/ownership www.card.iastate.edu/farmland/agriculture and the environmentChina Ag center www.card.iastate.edu/china

China’s Provinces
MyHometown

Mainland China vs. US

Greenhouse – plastic film - Shandong Province
My hometown: Shenxian, Shandong Province

https://www.card.iastate.edu/china


Why Care About China?Reason 1: China is a huge market for US
Source: Choices 2017 Q2 Issue

US holds a large and consistent ag trade surplus with China
0
5
10
15
20
25
0
5
10
15
20
25
30
1998
1999
2000
2001
2002
2003
2004
2005
2006
2007
2008
2009
2010
2011
2012
2013
2014
2015
2016
2017
2018
US
Ag T
rade
Sur
plus
w C
hina
($ B
il.)
US
Expo
rts
to o
r Im
port
s fr
om C
hina
($Bi
l.)
US Ag Trade with China 1998-2018(Jan to April 2018 only)
Exports Imports Surplus

62%
Share of China in US Ag Exports
12-15%
0%
1%
16%15-18%
5%
2%
0%
75%

Why Care About China?Reason 2: Ag is comparative advantage
for US, not for China
Average Farm SizeChina: 2 AcresUS: > 400 Acres

China Corn Yield
China SoybeanYield
2015 Soybean Yield
US: 48 Bu/acreIowa: 56 Bu/acreChina: 26 Bu/acre

Why Care About China?Reason 3: Chinese People Are Getting Richer, and will need
more protein

Future of High-Speed Rail in China

Why Care About China?Reason 4: China will retaliate, diversify
and find other suppliers if possible
Commodity (2016 value of China ag imports) USA Brazil Europe Australia Argentina or
Uruguay
Soybean ($34.4 Bil.)(China increased production by 9% in 2018)
38% 47% A-10%
Pork ($2.32 Bil.) 13% 50% Canada: 11%
Ethanol ($0.38 Bil.) 70% 11% Pakistan 15%
Beef ($2.42 Bil.) 0% 22% 28% U-21%
Poultry ($1.11 Bil.) 79% A-9%
Corn ($0.87 Bil.) 10% Ukraine: 79%
China’s Ag Import Sources
China can produces 97% of its pork, but only 15% of its soybean demand domesticallyChina provided about US$200/acre subsidy to increase soy production (up 9% 2018)


US Loses Market Share as China Increases Meat Imports from the World
Source: Choices 2017 Q2 Issue

Belt and Road Initiative

Seasonality of Soybean Imports by China
If the disputes were resolved before harvest, we might be OK
(Tariff effectiveJuly 6th)

Why Care About China?Reason 5: Trade disputes with China have long-term impacts (chicken, beef)

Why Care About China?Reason 6: Chinese Ag Policy Presents Future Demand that could be filled by our competitors
Li Hayes Zhang 2017 Ag Policy Review
China’s projected corn import potential under the new 2020 E10 ethanol mandate

China’s Ethanol Industry in 2016
4th largest producer – 1 Bil gal.- After US, Brazil and EU- Corn ethanol 64%- Also uses cassava, sorghum,
corn stover- Imported 225 mil. gal, mainly
from U.S.- Tariff rose from 5% to 30%
China consumes 40 bil. gal gasoline; 1 bil. gal ethanol in 2016
China’s Ethanol Trial

What a World w/o Trade War Look Like?

The Export Potential to China if China removes trade barriers
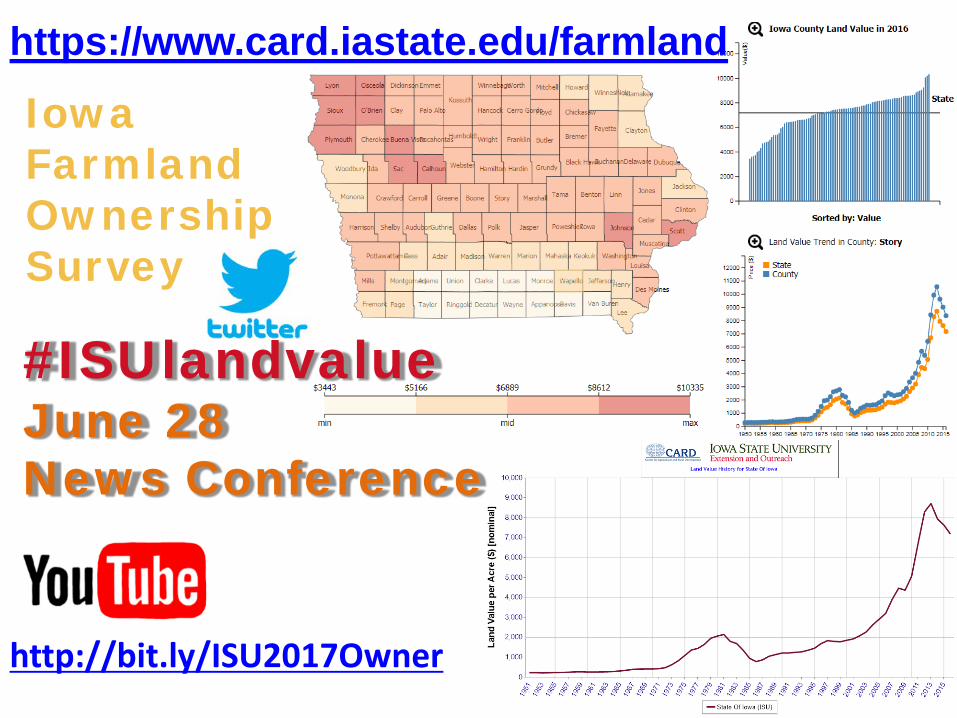
#ISUlandvalueJune 28 News Conference
https://www.card.iastate.edu/farmland
Iowa Farmland Ownership Survey
http://bit.ly/ISU2017Owner

Corn Use for the Next Decade
Source: USDA-OCE

Soybean Use for the Next Decade
Source: USDA-OCE

Arable Land


Why do U.S. farmers need export markets?
• That’s where the customers are• That’s where the economic growth is• That’s where the consumption growth is• We produce surpluses• We only eat high on the hog• Exports are crucial to farm income

96% of the world’s population lives outside the US
Source: CIA World Factbook

Population growth 2017 to 2050
Source: World Bank

Economic growth rates
Source: CIA World Factbook


Corn Export Sales
Source: USDA-FAS

Corn Export Shifts
Source: USDA-FAS

Soybean Export Sales
Source: USDA-FAS

Soybean Export Shifts
Source: USDA-FAS

Soybean Trade Last Year
Source: USDA-FAS
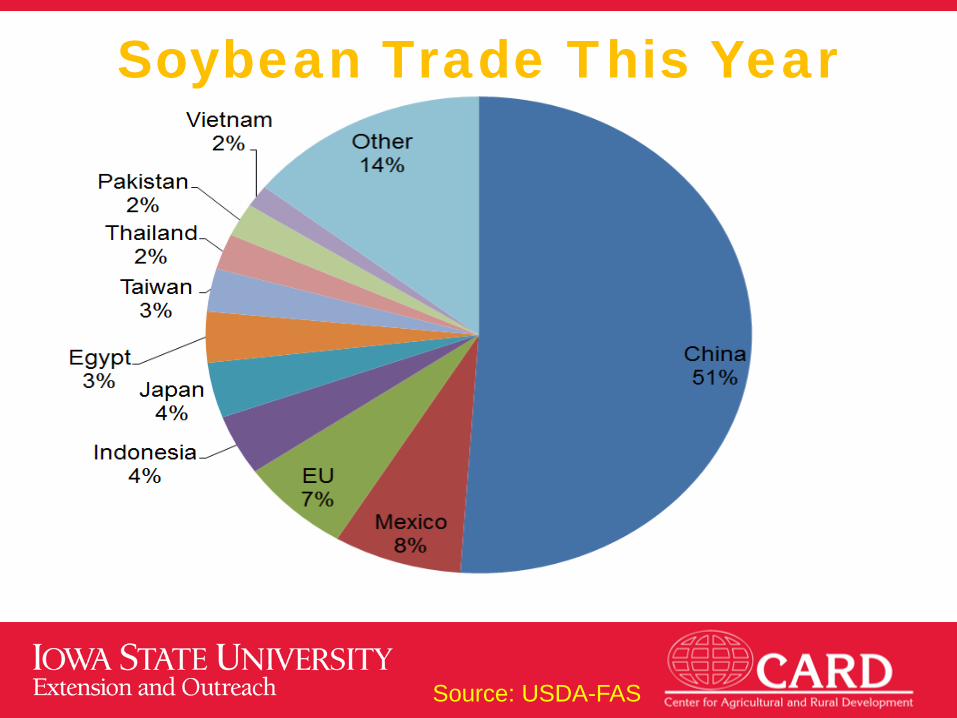
Soybean Trade This Year
Source: USDA-FAS

Sorghum Export Shifts
Source: USDA-FAS
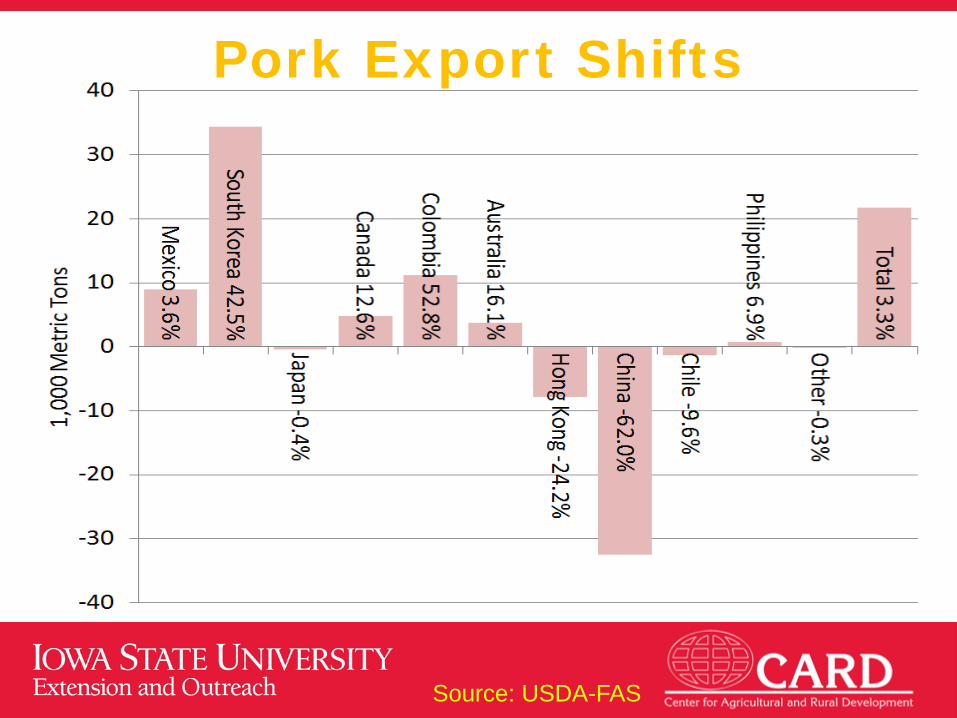
Pork Export Shifts
Source: USDA-FAS

Pork Trade Last Year
Source: USDA-FAS

Pork Trade This Year
Source: USDA-FAS
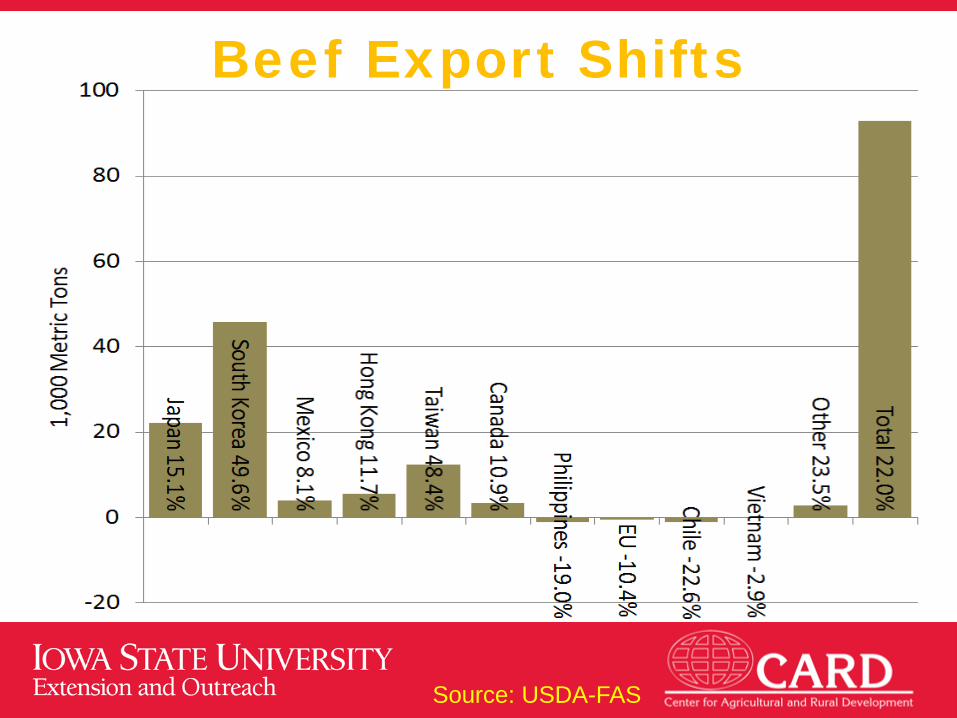
Beef Export Shifts
Source: USDA-FAS

Ethanol Exports
Source: EIA

Value of Ag Trade
Source: USDA-FAS

U.S. Ag Exports
Source: USDA-FAS
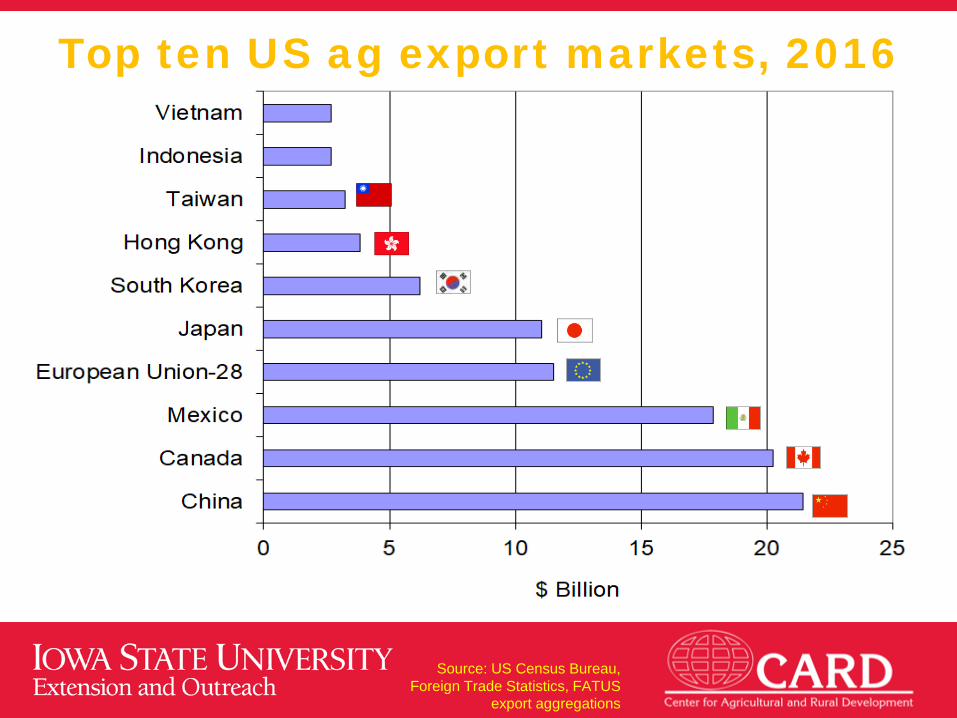
Top ten US ag export markets, 2016
Source: US Census Bureau, Foreign Trade Statistics, FATUS
export aggregations

Top 10 ag exporting states, 2016
Source: USDA Economic Research Service, “State
Export Data”

Population vs. arable land
Share of global Share of globalpopulation arable land
China 19% 5%
India 17% 10%
US 4% 13%

Pork Futures
Source: CME

Soy Futures
Source: CME

Thank You!Wendong Zhang Chad HartEconomics Professors and Extension Economists478C Heady Hall 478F Heady HallIowa State University Iowa State University515-294-2536 [email protected] [email protected]