what do teachers want, and does it matter? job ... do teachers want, and does it matter? job...
TRANSCRIPT

Draft – Not for quotation or attribution
What Do Teachers Want, and Does It Matter?
Job Satisfaction and Employee Performance1
Hai-Anh Dang2 and F. Halsey Rogers3
May 2007
Abstract: This paper uses a nationally representative school and teacher survey from Indonesia to jointly investigate the determinants of a teacher’s satisfaction level and its impacts on performance. First, we establish some stylized facts about satisfaction, showing that satisfaction with salary is systematically lower (and different) than satisfaction with other aspects of job performance. Second, we show that the strongest predictors of higher satisfaction are employment status (with civil servants having higher satisfaction) and proximity of educational/cultural amenities, while multigrade teaching enters significantly with opposing signs for different measures of satisfaction. Third, analysis using an IV probit model shows that teachers’ satisfaction with their salary and work environment has a strong and significant impact on a key performance measure: the teacher’s school attendance. Moreover, the effect is large: reducing the teacher’s satisfaction with salary from “satisfied” to “indifferent” doubles the predicted teacher absence rate to nearly 40 percent. Finally, certain policy variables (such as greater job security for teachers) appear to reduce teacher absence only indirectly through satisfaction, while others (such as teacher-recognition programs) have an independent effect on absence, presumably by providing incentives at the margin.
Key words: salary satisfaction, teacher absenteeism, teacher incentives, happiness, service delivery, IV probit, Indonesia.
1 The findings, interpretations, and conclusions expressed in this paper are entirely those of the authors, and do not necessarily represent the views of the World Bank and its affiliated organizations, or those of the Executive Directors of the World Bank or the governments they represent. 2 Department of Applied Economics, University of Minnesota; and Development Research Group, World Bank 3 Development Research Group, World Bank
Draft – Not for quotation or attribution
1. Introduction
Despite the recent growth of the literatures on service delivery and on job satisfaction, little research
has been done on the job satisfaction of service providers in developing countries, and on how job
satisfaction affects work performance. Where performance is monitored only poorly and the threat of
sanctions is not credible – as in many developing-country public education systems – an employee’s
performance may be heavily influenced by his or her commitment to and satisfaction with the job.
This paper uses a nationally representative school and teacher survey from Indonesia to jointly
investigate the determinants of a teacher’s satisfaction level and its impacts on performance. First, we
establish some stylized facts about satisfaction, showing that satisfaction with salary is systematically lower
(and different) than satisfaction with other aspects of job performance. Second, we show that the strongest
predictors of satisfaction are employment status (with civil servants having higher satisfaction), school with
multigrade teaching, and proximity of educational/cultural amenities. Third, analysis using an IV probit
model shows that teachers’ satisfaction with their salary and/or work environment has a strong and
significant impact on a key performance measure: the teacher’s school attendance. Moreover, the effect is
large: reducing the teacher’s satisfaction with salary from “satisfied” to “indifferent” doubles the predicted
teacher absence rate to nearly 40 percent. Finally, certain policy variables (such as greater job security for
teachers) appear to reduce teacher absence only indirectly through satisfaction, while others (such as teacher-
recognition programs) have an independent effect on absence, presumably by providing incentives at the
margin.
This paper consists of 6 sections. Section 2 provides a brief literature review, section 3 describes the
data. Section 4 defines the econometric framework and section 5 interprets estimation results. Section 6
concludes.
2. Literature review
This paper stands at the intersection of two rapidly expanding literatures – on the delivery of public
services (most notably, education and health), and on work satisfaction. World Bank (2003), which
1

Draft – Not for quotation or attribution
summarizes well the literature on service delivery in developing countries, points out the many difficulties of
ensuring that funds allocated to the social sectors – including funds for teacher salaries – wind up improving
social outcomes. As Filmer and Pritchett (2000) point out in the case of the health field, there are many
“weak links in the chain” from finance to results. In the education sector, the same is true: for example,
money intended for education often fails to reach the schools (Reinikka and Svensson 2004), teachers
themselves frequently fail to show up at school (PROBE Team 1999, Glewwe, Ilias, and Kremer 2004,
Chaudhury and others 2006), and teachers often use time inefficiently even when they are in school (Abadzi
2006). Following on the growing literature describing these service-delivery problems, rigorous evaluation
studies on interventions to deal with them have now begun to emerge (Banerjee and Duflo 2006; Duflo and
Hanna 2005; Muralidharan and Sundararaman 2006; Vegas 2005).
One consistent finding of this literature is that public school teachers are rarely held accountable:
they are typically not well monitored by administrators or parents, nor do formal incentives promote good
performance. Teachers face few rewards for good teaching or high levels of effort, whether in the form of
merit pay or through a predictably merit-based promotion ladder (Vegas 2005). And poor performers face
few sanctions, because of poor monitoring, union protection, and seeming voter indifference to the quality of
social services (Keefer and Khemani 2004). In India, for example, a companion survey found that despite a
national-average teacher absence rate of 25 percent, only one head teacher out of 3000 had ever dismissed a
teacher for excessive absence (Kremer and others 2006).
In environments with so few incentives for performance, perhaps the real mystery is why so many
teachers bother to turn up at work most days. The standard principal-agent framework is unlikely to provide
more than a partial answer to this question. Other elements of the answer will likely include intrinsic
motivation and professionalism (Reinikka and Svensson 2003, Besley and Ghatak 2005). These other
elements can be hard to measure, but they suggest a need to focus not just on rewards and punishments, but
on a teacher’s satisfaction with the work he or she is doing. When satisfaction is higher – abstracting away
from problems of endogeneity, which we tackle below – it seems likely that for any given structure of rewards
and punishments, the teacher will work more diligently and perform better.
The second related literature concerns the determinants and effects of work satisfaction. In recent
years a large literature in economics has explored job satisfaction, beginning with the seminal papers by
Hamermesh (1977) and Freeman (1978) on how job satisfaction affects job quits, and by Borjas (1979) on the
2
Draft – Not for quotation or attribution
determinants of job satisfaction.4 Recent studies have investigated job satisfaction as a function of individual,
family, and work characteristics. These studies have identified certain types of workers as having higher job
satisfaction—for example, the youngest and oldest workers (Clark, Oswald and Warr, 1996), more educated
workers (Vila and Garcia-Mora, 2005), women compared to men (Bender and Heywood, 2006), non-
unionized workers compared to unionized workers (Heywood et al., 2002), those with job training
opportunities (Gazioglu and Tansel, 2006), and those with higher pay (Clark and Oswald, 1996). Higher job
satisfaction levels have been found to reduce job quits (Ward and Sloane, 2000; Levy-Garboua et al., 2005) or
the intentions to quit (Shield and Price, 2002), as well as teacher absence from work (Michaelowa, 2002).
However, these studies focus mainly on developed countries, and very few studies investigate job
satisfaction in a developing country context. Furthermore, to our knowledge, the existing studies on the
impact of job satisfaction have not properly addressed the endogeneity of job satisfaction. It can be easily
imagined that there can exist unobserved characteristics that can affect both an employee’s job satisfaction
and his or her decision to quit or to be absent from work. One example is a person’s disposition: a cheerful
and outgoing person may be more likely to be satisfied with life in general and his or her work in particular,
making it more likely that this person will enjoy going to work. If the endogeneity of job satisfaction is not
controlled for, all estimation results may suffer from inconsistency.
To the best of our knowledge, Michaelowa (2002) is the only study so far that controls for teacher,
school and work characteristics in investigating the determinants of teacher job satisfaction and teacher job
satisfaction impact on teacher absenteeism. Using data from Burkina Faso, Cameroon, Cote d’Ivoire,
Madagascar, and Senegal, Michaelowa finds school factors that reduce teacher job satisfaction include larger
classes and isolation of the school, while the availability of electricity in the classroom increases predicted
satisfaction. High-school-educated male teachers living alone are found to be less satisfied than their female
colleagues. Michaelowa finds also that while multigrade teaching increases teacher absence from the
classroom, teacher job satisfaction decreases it. However, the approach used in that study raises at least two
concerns. First, an endogeneity problem arises when the paper includes variables such as whether the
teachers teach as private tutors or have other income-earning activity besides teaching, and whether the
teacher belongs to a teacher union. It is not hard to imagine a scenario where a teacher dissatisfied with her
meager salary decides to join the union to fight for a raise or to teach private tutoring classes to supplement
her salary. The endogeneity problem becomes even more serious when the paper uses uninstrumented
3
4 However, sociologists and psychologists have researched job satisfaction for quite a long time. See, for example, Warr (1999).
Draft – Not for quotation or attribution
teacher job satisfaction as an explanatory variable in the teacher absence regression, together with the same
explanatory variables from the previous regressions where satisfaction is used as the dependent variable.
Second, as recognized in the paper, the numbers of days the teacher is absent is collected based on self-
reporting instead of direct objective observations, thus leading to possible mismeasurement (and most likely
systematic understatement) of teacher absence rates.
Methodologically, our paper addresses the limits in Michaelowa (2002) by considering teacher
satisfaction and teacher absenteeism in a simultaneous system, where teacher satisfaction is recognized to be
an endogenous explanatory variable in the equation for teacher absence and it is estimated in a reduced-form
equation using an instrument. In terms of data, we use direct observation during surprise school visits to
collect information on teacher absence, so that we can avoid the problem of measurement error and bias.
Further details on the data are given in the next section.
3. Data and some descriptive statistics
The data for this paper were gathered through a unique survey of teachers at a nationally
representative random sample of 110 Indonesian primary schools in 2002-03. The interviews were conducted
during surprise visits to the schools, which allowed measurement of teacher absence from school would not
be contaminated by observation bias. Data on the school and community were provided by the head teacher
or acting head teacher, and enumerators interviewed each teacher directly to get information on his or her
demographic and educational background, life circumstances, and job satisfaction. Each school was visited
twice, allowing the enumerators to get two observations of attendance for each teacher; each teacher was
interviewed only once, however, so the data include only one set of response on satisfaction for each teacher.
Further details on the methodology and findings on teacher absence can be found in Chaudhury, Hammer,
Kremer, Muralidharan, and Rogers (2006), which sets Indonesia’s teacher absence rate of 19 percent in the
context of a multicountry comparison.
The satisfaction questions came at the end of each teacher interview, and consisted of the following:
How satisfied or dissatisfied are you with your job from the following points of view?
⇒ Salary? ⇒ Appreciation from parents?
4
Draft – Not for quotation or attribution
⇒ Social status in the community? ⇒ Work environment?
For each satisfaction variable, the answers allowed were: 4=Very Satisfied; 3=Satisfied; 2=Indifferent;
1=Dissatisfied; 0=Very dissatisfied.5 The response rate for these questions was quite high: 883 teachers
answered all four questions, out of the total sample of 890 teachers included in this analysis.
In this section and Section 5, we draw on these data to answer three sets of questions:
• Levels of satisfaction: How satisfied are Indonesian public-school teachers with various aspects of their work, and is salary systematically different from other aspects of the job for which we have satisfaction data?
• Predictors of satisfaction: What factors predict teachers’ satisfaction with their pay and other aspects of the job?
• Effects of satisfaction: Can we identify the effects of teacher satisfaction on performance and outcome variables – specifically, on teacher absence? And do certain variables seem to be mediated only through satisfaction, as opposed to having direct effects on performance?
Each of these questions has important policy implications, including the last one. As noted above,
teacher management systems in most developing countries are characterized by poor monitoring and a lack of
pecuniary or career-based incentives for good performance. In a standard principal-agent model, it is the
combination of monitoring, rewards, and punishments that drives performance. In this paper, we explore the
possibility that policy can affect other variables that independently improve a teacher’s motivation and
performance. Kremer et al. (2005) posits that day-to-day incentives for attendance at work, including pleasing
aspects of the work environment such as good infrastructure and equipment, may improve motivation and
performance, ceteris paribus. For policymakers who lack the tools or political influence to change pecuniary
motivations and monitoring, knowing these other variables may be important.
Descriptive statistics: How satisfied are Indonesian teachers with their jobs?
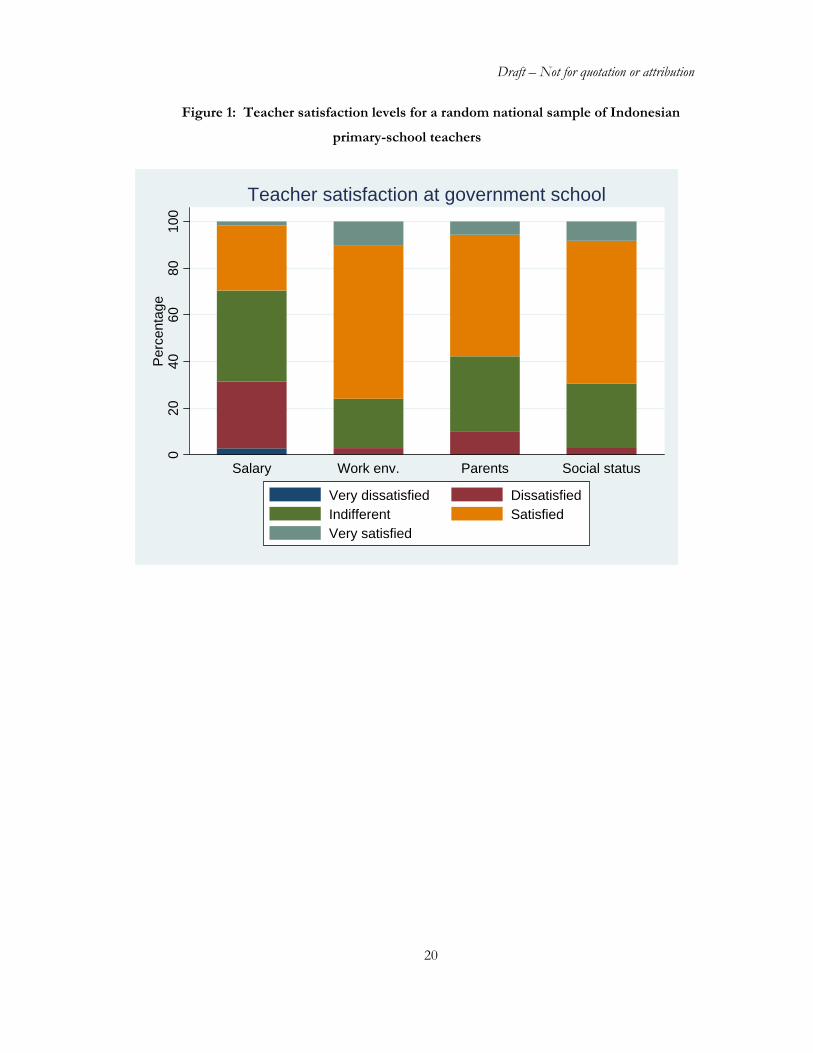
On three of the four satisfaction questions, the modal teacher response was “satisfied” (3 on our 0-4
scale). The exception was satisfaction with salary, which appears to be fundamentally different from the
other three aspects of the job. First, consider the levels of satisfaction reported. (See Figure 1.) Among
teachers at government schools, only 30 percent pronounce themselves satisfied or very satisfied with their
5 The scale was originally from 1 to 5, and in the reverse order; we have transformed it for expositional convenience.
5

Draft – Not for quotation or attribution
salaries, with roughly as many reporting themselves as dissatisfied or very dissatisfied. By contrast,
satisfaction with the non-salary aspects of work ranges from 58 percent to 77 percent.6
Moreover, within public schools, the pattern holds at each level of aggregation. In each of the 10
districts, average satisfaction with salary is lower than average satisfaction with any of the other three aspects.
And even at the school level, the pattern is nearly universal: in all but five of the 110 government schools,
the average reported satisfaction with salary is below the average satisfaction with the other three job aspects
(Figure 1).
Could this difference in mean levels reflect strategic behavior on the part of teachers? Perhaps
teachers fear that expressing satisfaction with pay will reduce future salary increases, and therefore they
systematically underreport their satisfaction with salary. But there are other indications that salary satisfaction
is different from satisfaction with other job characteristics. All four measures are significantly correlated with
each other (Table 1), but the correlation is much weaker between salary satisfaction and the other three
measures (correlation coefficient of .06 to .11) than among those other measures (.28 to .48). If the salary
were similar to the others but was simply understated in some systematic linear way, we would not expect to
see this pattern.
The empirical analysis in Section 5 uses two of the four measures of satisfaction: satisfaction with
salary, and satisfaction with the work environment. We choose to focus on these variables for three reasons.
First, these measures are more general than the social-status and parental-support measures, and together they
cover what most people would consider the two main determinants of job satisfaction. Second, in a
theoretical sense, it is conceivable that salary satisfaction could serve as a summary measure of an employee’s
feelings about his or her job. That is, respondents may be giving their assessment of the utility they derive
from salary conditional on the other conditions of work, because whether they consider themselves well-paid or
not will likely depend in part on what satisfaction they derive from other aspects of the work. Also, in our
survey, respondents were always asked first about their satisfaction with salary; since they may not have
known how many other satisfaction questions would follow, they may have tried to incorporate as much
relevant information as possible into their first responses. Finally, empirically we find that salary and work-
environment satisfaction are the two measures that are correlated with performance. It is worth noting that
the other measures are not, but we choose to focus below on the measures that are.
6
6 Interestingly, despite the differences between the two sectors, we see virtually the same pattern among private-school teachers (not shown here).

Draft – Not for quotation or attribution
4. Econometric framework
Both observable and unobservable factors can affect both a teacher’s satisfaction and his or her
decision to be absent from work. For example, one characteristic unobserved by the econometrician can be a
teacher’s disposition. A cheerful and outgoing teacher may be more likely to be satisfied with life in general
and his work in particular, and he may also enjoy going to work to interact with his colleagues and students.
On the other hand, a grumpy teacher can often complain about his work, and try to avoid it whenever the
opportunity arises. Another unobserved factor may be the school work atmosphere. It is understandable
that a collegial work environment can both have a beneficial impact on a teacher’s job satisfaction and his
conscience to show up for work.
To address the endogeneity of the satisfaction variables, we use an instrumental probit econometric
model. In this framework, the dependent variable for the first-stage regressions is the teacher’s satisfaction
(with salary and work environment, respectively), while the dependent variables for the second-stage
regressions is teacher absence. For estimation purpose, the salary and work environment satisfaction
variables are considered continuous variables. In practice, this can be argued to be a good approximation
since these variables have five values very dissatisfied, dissatisfied, indifferent, satisfied and very satisfied.
Teacher absence is indicated by a dummy variable which assumes the value 1 when the teacher is absent in
either survey round, and 0 otherwise. While some teachers are observed to be absent in both survey rounds,
these observations cannot be used since information on satisfaction cannot be directly obtained from the
teachers in these cases. Consequently, we dropped these observations from our analysis.
The model is defined as follows. For teacher i, i=1,…, n, let Di be a dummy variable equal to 1 if the
teacher is satisfied, and 0 otherwise; and let Yi be a binary variable that equals 1 if the teacher is absent, and 0
otherwise. Assume Di and Yi are generated by the following structure
iii ZD υα +=
]0[1],|0[1 * ≥++=≥= iiiiiii XDDXYY εβγ (1)
where Zi, Xi are vectors of the observables, iυ and iε are vectors of the unobservables in the
satisfaction and work outcome equations respectively. 1[.] is the indicator function.
7

Draft – Not for quotation or attribution
Assume that
i) αiZ is a non-degenerate random variable conditional on X = x.
ii) ( iυ , iε ) are independent of Z given X
and ( iυ , iε ) are normally distributed with zero mean vector and covariance matrix
∑= . ⎥⎦
⎤⎢⎣
⎡
1
2
ρσρσσ
with the variance of iε normalized to 1, and the variance of iυ being , and the correlation
coefficient between
2σ
iυ and iε being ρ .
The log likelihood function for observation i, i = 1,…, n is
ln Li = σσ
αφ ln)(ln))(1ln()1()(ln −
−+Φ−−+Φ ii
iiiiZD
kYkY (2)
with 21
/)(
ρ
σαρβγ
−
−++= iiii
iZDXD
k
and and (.)Φ (.)φ being the standard normal distribution and density function respectively. 7
As a primary instrument for the IV estimates, we use the distance to the nearest college or university.
This instrument is intended to capture the desirability of being near to cultural amenities (for both
consumption reasons and because of the greater status associated with such locations), and also represents
the opportunity cost of further professional development. There are both theoretical and empirical evidence
supporting the validity of this instrument. Theories on job satisfaction emphasize the need for professional
learning and development as an important factor determining an individual’s job satisfaction.8 Empirically, in
7 Add citation.
8 For example, an influential theory on job satisfaction is the Job Characteristic Theory (JCT) which was developed by Hackman and Oldham (1976, 1980). The theory posits that there are five job characteristics that can be summarized in a
8
Draft – Not for quotation or attribution
the neighboring country of Brunei, the Yong study (1994) finds the first reason that young teacher trainees
are attracted to teaching is because they want to take advantage of the opportunity to improve their education
through degree courses. In a US study, Card (1995) uses college proximity as an instrument for educational
attainment and finds that controlling for other factors, living near a college raises education by 0.32 years.
College proximity then should have important impact on a teacher if we are ready to assume that teachers are
eager, at least more than other people, to improve their education by either taking a university course, or
attending seminars or cultural activities, or just making use of the libraries or computers in the university.
If teachers often availed themselves of the opportunity to take university courses, this could
conceivably pose problems for our IV estimation strategy. In theory, having to attend courses at the
university could directly increase teachers’ absence rates, violating the IV exclusion restriction. However, we
believe this is unlikely to be a problem, for two reasons. First, we expect that for most teachers in our sample,
proximity to a university serves primarily as a proxy for cultural opportunities, since the large majority of
teachers would not have been enrolled in university courses at the time of the survey.9 Second, any direct
effect, if it existed, would tend to increase teacher absence – whereas we show below that proximity is
associated with higher teacher satisfaction and lower rates of teacher absence.
In addition, a measure of school quality is also used as a second set of instruments. The quality of
school is represented by whether the school has multi-grade teaching and a school infrastructure index. This
school infrastructure index is created by taking the average of dummy variables indicating whether the school
has running water, electricity, a toilet, a library, computers, and a room for the staff. These instruments
arguably affect teacher satisfaction directly and affect teacher absenteeism indirectly through teacher
satisfaction. However, estimation results are presented using distance to the nearest college as the only
instrument and using both distance to the nearest college and school quality as instruments.
The explanatory variables used in the regressions are at the individual, school, community, and
regional levels. Individual-level variables include teacher gender, experience, education, and marital status, as
9
scalar score called the Motivating Potential Score (MPS), which affects a multitude of personal and work outcomes—including high quality work and absenteeism. The theory proposes that there is one important individual characteristic: the Growth Need Strength (GNS) or strength of a person’s need for personal accomplishment, learning and development, which determines the intensity of the jobholder’s response to his job MPS. A person with a high GNS will value the opportunities that a high MPS job brings to him and will responds positively to them consequently, and a person with a low GNS will act vice versa. 9 This changed in 2006, with the passage of a law doubling salaries for teachers who met certain educational qualifications, including having a four-year college degree or its equivalent. But our data were collected in 2002-03, well before this law was envisioned.
Draft – Not for quotation or attribution
well as dummy variables indicating whether the teacher’s native language is the local language and whether the
teacher has recent undergone teacher training. The native-language variable can proxy for the teacher’s
affinity for the local area and potential for integration into local activities, which could affect his or her job
satisfaction and performance. To control for teacher income and job security, we include two dummy
variables indicating whether the teacher is a head teacher (or deputy) or other permanent civil-service teacher.
School and community variables in the regressions include information on whether the school has multi-
grade teaching, whether the school has a teacher recognition program, the distance from the school to the
nearest paved road and the distance to the nearest Education Ministry office, a school infrastructure index, a
school discipline index, and parental education. The school discipline index is a dummy variable which equals
1 if the school’s head teacher has ever dismissed, suspended or transferred a teacher or stopped a teacher’s
salary as a form of punishment. The parental education variable is proxied by the share of parents for each
school that completed lower secondary school or higher. Regional characteristics are represented by dummy
variables indicating districts, with Pasuruan district serving as the omitted reference district.
5. Estimation results
This section presents two sets of results: regressions explaining teacher satisfaction along two
dimensions (salary and work environment), and regressions explaining teacher absence using a similar set of
variables, together with the instrumented satisfaction variables.
5.1. The determinants of teacher satisfaction
Estimation results for the determinants of teacher satisfaction are shown in Table 2. In columns 1-3,
the dependent variable is the teachers’ satisfaction with salary; in columns 4-6, it is the teachers’ satisfaction with
work environment. While the specifications in columns 1 and 4 control only for a teacher’s individual
characteristics, columns 2 and 5 include controls only for the school and community characteristics associated
with a teacher. Both of these sets of specifications are presented for comparison purposes only, however; our
attention should focus on columns 3 and 6, which include all teacher individual, school, and community
characteristics as regressors. Although none of the teachers’ individual characteristics are significant in
column 6 specification, some are highly significant in column 3.
10
Draft – Not for quotation or attribution
It is possible that teachers’ satisfaction with salary may affect teachers’ satisfaction with work
environment or vice versa. The specifications in columns 7 and 8 address this concern. While the
specification in column 7 controls for additive effects by adding teachers’ satisfaction with salary and work
environment together, the specification in column 8 controls for multiplicative effects by multiplying
teachers’ satisfaction with salary and teachers’ satisfaction with work environment. However, because of this
transformation, care should be taken for comparisons between the different specifications since the
satisfaction index ranges from 0 (very dissatisfied) to 4 (very satisfied) in the specifications in columns 1 to 6,
from 0 to 8 in the specifications in column 7, and from 0 to 16 in the specifications in column 8.
All the regressions in Table 2 are estimated by the OLS method, so that the impact magnitudes can
be easily read off from the coefficients. Ceteris paribus, a one-unit change in the explanatory variable will
create a change equivalent to its corresponding coefficient, with each unit change in teacher satisfaction
representing the move from being in one satisfaction category to the next (e.g. from being “indifferent” to
being “satisfied” or vice versa). As discussed earlier, while some characteristics make teachers more or less
satisfied with their salaries, these same characteristics do not necessarily affect their satisfaction with their
work environment, or vice versa.
After all characteristics are controlled for, individual characteristics affect only the teachers’ satisfaction
with salary and teachers’ satisfaction with salary combined with work environment (and not satisfaction with
work environment alone). These variables include a teacher’s civil-service status (which comes with greater
job security and higher salary) and his or her familiarity with the local language. Speaking the local language
as a mother tongue increases a teacher’s predicted salary satisfaction by 0.14, while holding the rank of head
(or deputy head) teacher or permanent teacher raises predicted teacher salary satisfaction almost four times as
much – by 0.54, an increase of more than half a point.10 A comparatively similar relationship holds for
combined satisfaction with salary and work environment: the corresponding numbers are .19 and .75 for the
specification in column 7 (additive effects) and .60 and 1.95 for the specification in column 8 (multiplicative
effects). Surprisingly, there is no significant difference between holding a head teacher position and holding a
permanent (civil-service) teacher position in its impact on predicted teacher satisfaction with salary and salary
combined with work environment; what appears to matter is not being a contract teacher.
11
10 This latter point is consistent with the findings of Chomitz and others (1999) in their analysis of compensating differentials for Indonesian doctors: “A large value is attached to civil service appointment by public school graduates . . . . An increase in the probability of appointment from 0% to 100% is valued on average at Rp 2,189,000/month [then around $800/month] by male public school graduates from Java/Bali.”

Draft – Not for quotation or attribution
Turning to community and school characteristics, teachers are more satisfied with their salaries and less
satisfied with their work environment if the school has multi-grade teaching. While a multi-grade
environment increases predicted salary satisfaction by almost one full point, it reduces predicted satisfaction
with the work environment by around half a point. Since multi-grade teaching is considered demanding and
may require more work for teachers (Thomas and Shaw, 1992), and even undesirable in most developing
countries (Benveniste and McEwan, 2000), it is understandable that multi-grade teaching can reduce teacher
work satisfaction. However, it is less clear why multi-grade schooling is associated with higher teacher salary
satisfaction. A possible explanation may be that teachers are paid more in these schools, but further
investigation would be necessary to establish whether this is the case. Compared to teachers’ satisfaction with
work environment, teachers’ satisfaction with salary seems to have a dominant impact on teacher absenteeism,
because when teachers’ salary satisfaction and teachers’ work-environment satisfaction are combined, multi-
grade teaching has a positive impact.
Two other variables are significant predictors of only one type of satisfaction or the other. While the
disciplinary action taken by a school may decrease teacher salary satisfaction by around .20 (and also decrease
teacher salary and work environment satisfaction combined), it does not affect predicted teacher work
satisfaction alone. Interestingly, a greater distance to the nearest Education Ministry office positively affects
teacher satisfaction with the work environment alone, perhaps because distance from the Education Ministry
office may be correlated with less rigorous supervision of teachers.
The distance to the nearest college or university has a highly statistically significant and negative
impact on both teacher salary satisfaction and work satisfaction. It can be calculated from Table 2 that when
this distance increases from between 1 and 5 kilometers to between 25 and 100 kilometers, teacher salary
satisfaction and work-environment satisfaction decrease by around 0.3 and 0.16 points, respectively. This is
consistent with the hypothesis that teachers care about local cultural amenities and their opportunities for
professional development.
5.2. The impact of teacher satisfaction on absenteeism
We turn now to the question of whether job satisfaction, properly instrumented, can help explain a
key aspect of job performance: the teacher’s attendance at school. We use this variable because it is a
12

Draft – Not for quotation or attribution
relatively straightforward and observable measure of teacher effort, compared with, for example, the amount
of time a teacher spends preparing lesson plans. While exogenous factors such as sickness and unavoidable
out-of-school duties can reduce teacher attendance, the recent literature discussed in section 2 suggests that
high levels of absence are indicative of low levels of accountability and teacher effort. By common sense, we
expect that when teachers are more satisfied with their salary, or their work environment, they will come to
work more often. Econometrically speaking, in a regression of teacher absenteeism on teacher salary
satisfaction or teacher work-environment satisfaction, the signs on the coefficients of the satisfaction
variables are expected to be negative.
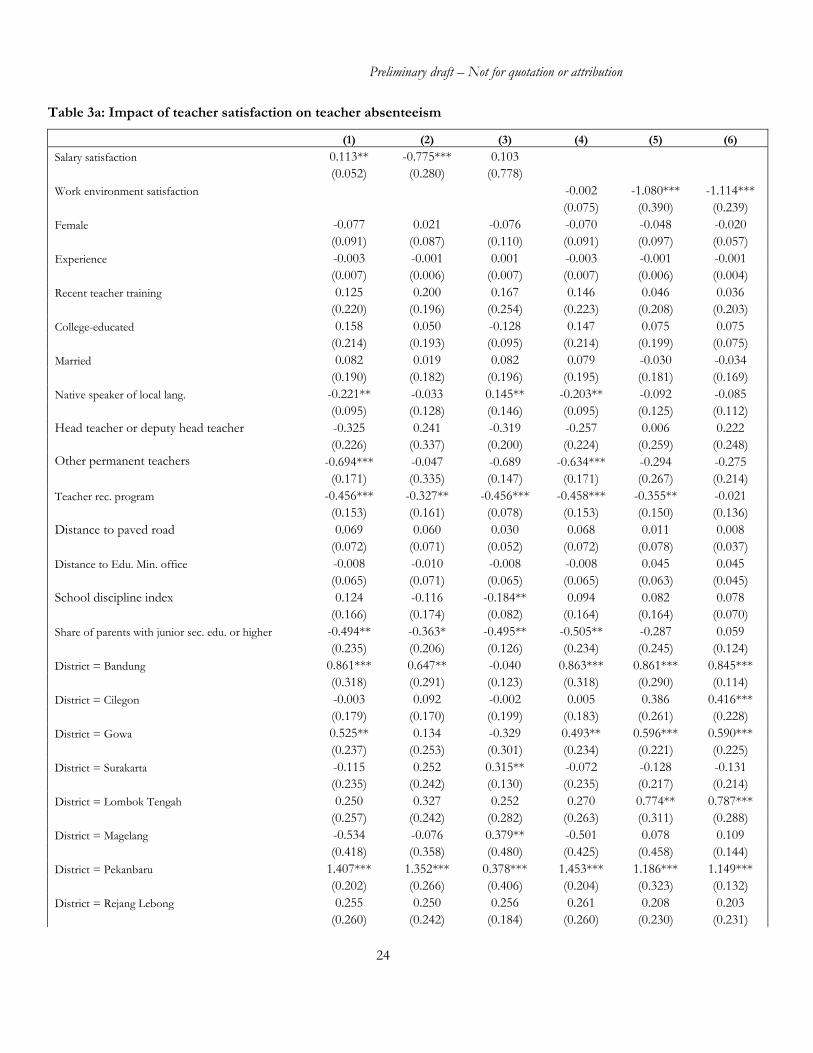
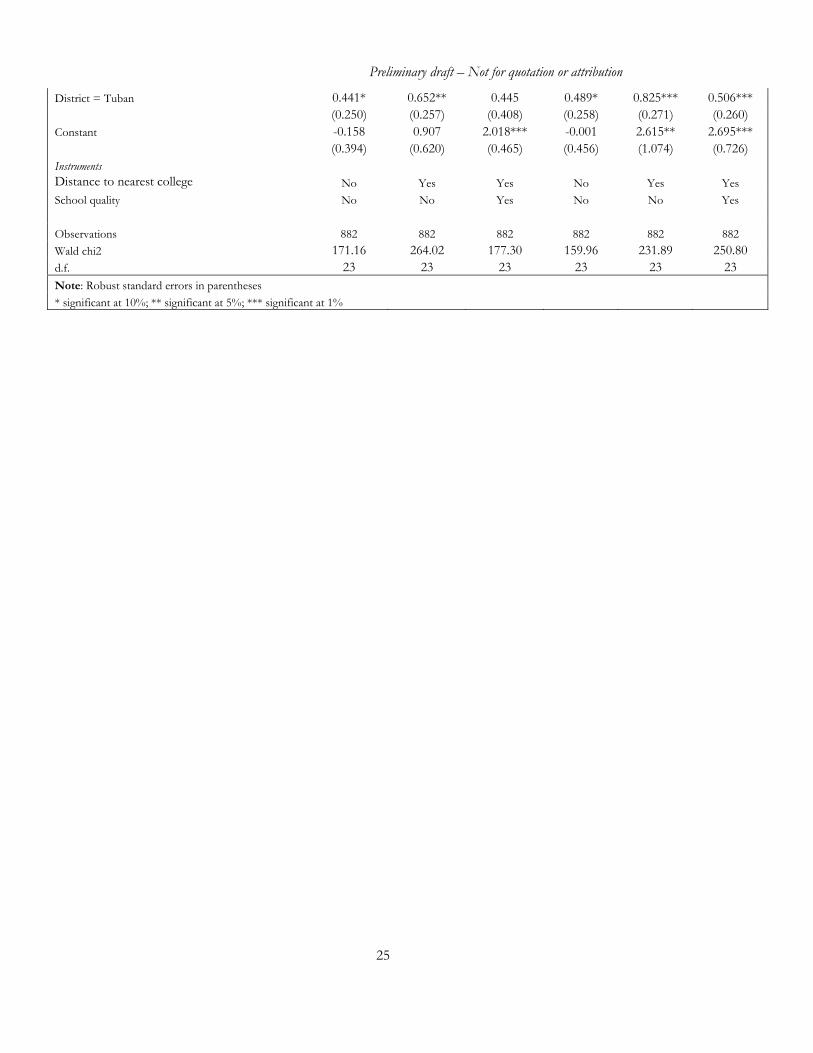
The regressions presented in Tables 3a and 3b explore this hypothesis. As in Table 2, each
observation represents an individual teacher. Here, the dependent variable is a dummy variable indicating
whether the teacher was absent during either of the two visits by the survey team.11
Because of the potential for endogeneity, we would not necessarily expect the hypothesized negative
relationship between satisfaction and teacher absence to show up in uninstrumented regressions. And indeed,
the uninstrumented probit regression in columns 1 of Table 3a shows that, controlling for other factors,
salary satisfaction is positively correlated with teacher absenteeism and it is statistically significant at the 5%
level. While satisfaction with work environment has the expected negative sign, the coefficient is small and
insignificant.
The results are very different once we instrument for satisfaction with distance to the nearest college
(column 2). In this specification, salary satisfaction is strongly significant at the 1% level and has a negative
impact on teacher absenteeism. When additional instruments representing school quality which consists of a
dummy variable indicating multi-grade teaching school and a school infrastructure index is used, the
coefficient on teacher salary satisfaction is positive, although it is no longer statistically significant (column 3).
In the first-stage regression with all the instruments, school infrastructure index is not significant. In a
regression not shown here, when this instrument is excluded, while distance to the nearest college is strongly
significant at the 1% level, the dummy variable indicating multi-grade teaching school is significant only at the
10% level. In the second-stage regression, the coefficient on teacher salary satisfaction is negative although it
13
11 Alternatively, our dependent variable could have been the number of times each teacher was absent in two visits (0, 1, or 2). We chose not to take this approach, because of a lack of reliable satisfaction data for the teachers who were absent on both visits. In most such cases, we had no satisfaction data; in the few cases where there were responses to these questions, their reliability was uncertain, as we could not be sure that they had not been provided by a co-worker of the absent teacher.

Draft – Not for quotation or attribution
is not statistically significant. However, as discussed above, since multi-grade teaching can make teachers
more satisfied with their salary possibly in an indirect way through a higher pay system in these schools, this
variable may not be a good instrument for the salary satisfaction regression. Thus it may be safer to use just
the distance to the nearest college as the instrument in the salary satisfaction regression and the specification
in column 2 is the model for interpretation of impact of salary satisfaction on teacher absenteeism.
With the endogeneity properly taken into account, work environment satisfaction has the expected
negative sign on teacher absenteeism. Furthermore, the coefficients on work environment satisfaction are
strongly statistically significant at the 1% level and similar whether the instruments include distance to the
nearest college alone or both distance to the nearest college and school quality.
The predicted effects of satisfaction on absence are quite high. Figure 3 plots the probabilities of
teacher being absent against teacher satisfaction with salary and work environment, using distance to the
nearest college as the only instrument. The slopes of the lines are fairly steep. For example, the predicted
probability of teacher absenteeism is reduced by around 25% when teacher satisfaction with either salary or
work environment is raised by one point – from “dissatisfied” to “indifferent”, for example. The effect of
satisfaction with work environment on absence is even stronger: a one-point increase reduces predicted
absence by as much as 35%. The predicted absence rates at the far left side of the graph should not be taken
too literally, given the relative lack of support in that part of the satisfaction range, but the evidence is
consistent with a substantial satisfaction effect.
Not only is satisfaction important as a predictor of absence, but it also seems to mediate the effects
of other variables. Being a native speaker of the local language and holding a civil-service position are both
associated with lower teacher absence in columns 1 and 4, but once we properly account for satisfaction in
columns 2, 5 and 6, those variables lose their statistical significance. (This variable is significant in the
specification in column 3, but as discussed above, it is better to use estimation results in the specification in
column 2 for interpretation). Particularly in the case of the civil-service position, this makes sense. In a
standard principal-agent framework, the direct effect of higher job security on teacher absence would be
expected to be positive: teachers who have little fear of job loss will find it easier to be absent. Thus we
would expect job security to reduce teacher absence only by increasing job satisfaction and professional
commitment.
14
Draft – Not for quotation or attribution
Surprisingly, after instrumenting for work environment satisfaction, we see no significant effects - on
teacher absence – of the education level of the parents of students at the teacher’s school. Higher levels of
parental education could conceivably affect teacher performance through a variety of mechanisms.
Education could increase parents’ ability to assess school quality or their ability to hold teachers accountable,
for example; or teachers could find that the non-pecuniary rewards of teaching are higher where students
come from more educated families (Chaudhury and others 2006). But the results in columns 2, 3, 5 and 6
suggest that in Indonesia, teachers working in schools with more educated parents tend to be more satisfied
with their salary and not their work environment.
When teachers’ combined satisfaction with salary and work environment are instrumented for, it also
has a negative impact on teacher absenteeism (columns 1, 2, and 3 Table 3b). While the specifications in
columns 1 and 3 use distance to the nearest college as the only instrument, the specifications in the columns 2
and 4 use in addition for instruments a dummy variable indicating school with multi-grade teaching. However,
in the first-stage regression, school with multi-grade teaching is never significant. Thus the specifications in
column 1 and 3 are the main specifications for interpretation.
While schools with a teacher recognition program has a negative impact on teacher absenteeism in all
specifications, school discipline index has a negative impact in the work environment satisfaction regression,
and schools with more educated parents has a negative impact in the salary satisfaction regression. Being
native speaker of the language and the civil rank as head teacher has a positive impact on teacher absenteeism;
these results are inconsistent with the earlier results in Table 3a. However, these results hold only if our
assumption that teachers’ salary satisfaction and work environment satisfaction interact with each other in a
multiplicative way.
6. Conclusion
This paper establishes stylized facts about satisfaction for teachers in Indonesia, using an empirical
structure that accounts for the possible endogeneity of satisfaction and job performance. First, satisfaction
with salary is systematically lower (and different) than satisfaction with other aspects of job performance.
Second, the strongest predictors of satisfaction are employment status (with civil servants having higher
satisfaction), school with multigrade teaching, and proximity of educational/cultural amenities. Third,
15
Draft – Not for quotation or attribution
analysis using an IV probit model shows that teachers’ satisfaction with their salary and/or work environment
has a strong and significant impact on a key performance measure: the teacher’s school attendance. Finally,
certain policy variables (such as greater job security for teachers) appear to reduce teacher absence only
indirectly through satisfaction, while others (such as teacher-recognition programs) have an independent
effect on absence, presumably by providing incentives at the margin.
We believe that the results indicate the value of further research into what determines teachers’ job
satisfaction, and how satisfaction levels affect performance. Especially as long as monitoring, incentives, and
accountability remain highly imperfect, the performance of developing-country teachers will likely depend
substantially on their satisfaction with the school environment and with their salaries. If this is the case, it
requires economic analysis of teacher motivation that moves beyond a straightforward principal-agent
framework, in which salary levels and formal rewards and sanctions take center stage, to a broader approach
that recognizes the many factors that affect teacher satisfaction and performance. Future empirical research
along these lines may include applying the same analysis framework to other developing countries for which
data are now available, or investigating the impact of teacher satisfaction on other outcomes such as student
academic performance and teacher work performance.
16

Draft – Not for quotation or attribution
References
Banerjee, Abhijit and Esther Duflo. 2006. "Addressing Absence." Journal of Economic Perspectives, 20:1.
Bender, Keith A. and John S. Heywood. (2006). Job Satisfaction of the Highly Educated: The Role of Gender, Academic Tenure, and Earnings. Scottish Journal of Political Economy 53(2):253-279.
Benveniste, Luis A. and Patrick J. McEwan. (2000). Constraints to Implementing Educational Innovations: The Case of Multigrade Schools. International Review of Education 46(1/2): 31–48.
Besley, Timothy and Maitreesh Ghatak. 2005. "Competition and Incentives with Motivated Agents." American Economic Review, 95:3, pp. 616-36.
Borjas, G. (1979). Job Satisfaction, Wages and Unions. Journal of Human Resources, 14(1): 21-40.
Card, David E. (1995). Using Geographic Variation in College Proximity to Estimate the Returns to Schooling. In Aspects of Labor Market Behavior: Essays in Honor of John Vanderkamp. Eds L. N. Christofides et al. Toronto: University of Toronto Press.
Chaudhury, Nazmul, Jeffrey Hammer, Michael Kremer, Karthik Muralidharan, and F Halsey Rogers. 2006. "Missing in Action: Teacher and Health Worker Absence in Developing Countries." Journal of Economic Perspectives, 20:1, pp. 91-116.
Chomitz, Kenneth M, Gunawan Setiadi, Azrul Azwar, Nusye Ismail, and Widiyarti. 1999. What Do Doctors Want? Developing Incentives for Doctors to Serve in Indonesia's Rural and Remote Areas. World Bank Policy Research Working Paper Series: 1888.
Clark, Andrew and Andrew Oswald. (1996). Satisfaction and Comparison Income. Journal of Public Economics 65: 359-381.
Clark, Andrew, Andrew Oswald and Peter Warr. (1996). Is Job Satisfaction U-shaped in Age? Journal of Occupational and Organizational Psychology 69: 57-81.
Clark, Andrew. (2001). What Really Matters in a Job? Hedonic Measurement Using Quit Data. Labour Economics 8: 223-242.
Duflo, Esther and Rema Hanna. 2005. "Monitoring Works: Getting Children to Come to School." Cambridge, MA: Massachusetts Institute of Technology.
Filmer, Deon, Jeffrey S Hammer, and Lant H Pritchett. 2000. "Weak Links in the Chain: A Diagnosis of Health Policy in Poor Countries." World Bank Research Observer, 15:2, pp. 199-224.
Freeman, R. B. (1978). Job Satisfaction as an Economic Variable. American Economic Review 68(2): 135-141.
Garrett, R. M. (1999.) Teacher Job Satisfaction in Developing Countries. Department for International Development. London: England.
Gazioglu, Saziye and Aysit Tansel. (2006). Job Satisfaction in Britain: Individual and Job Related Factors. Applied Economics 38:1163-1171.
17

Draft – Not for quotation or attribution
Glewwe, Paul, Naumann Ilias, and Michael Kremer. 2004. "Teacher Incentives." National Bureau of Economic Research Working Paper 9671.
Hackman, Richard J. and Greg R. Oldham. (1976). Motivation through the Design of Work: Test of a Theory. Organizational Behavior and Human Performance. 16: 250-279.
Hackman, Richard J. and Greg R. Oldham. (1980). Work Redesign. Reading, Mass.: Addison-Wesley.
Hamermesh, Daniel S. (1977). Economic Aspects of Job Satisfaction. In Orley C. Ashenfelter and Wallace E. Oates (Eds). Essays in Labor Market Analysis. New York: John Wiley.
Heywood, J. S., W. S. Siebert, and X. Wei. (2002). Job Satisfaction and Worker Sorting: The Case of Union and Government Jobs. Industrial and Labor Relations Review 55: 595-609.
Keefer, Philip and Stuti Khemani. 2004. "Why Do the Poor Receive Poor Services?" Economic and Political Weekly, 39:9, pp. 935-43.
Kremer-Hayon, Lya and Zahava Goldstein. (1990.) The Inner World of Israeli Secondary School Teachers: Work Centrality, Job Satisfaction and Stress. Comparative Education, 26(2-3); 285-298.
Kremer, Michael, Nazmul Chaudhury, F. Halsey Rogers, Karthik Muralidharan and Jeffrey Hammer. (2005). Teacher Absence in India: A Snapshot. Journal of the European Economic Association 3(2-3): 658-667.
Levy-Garboua, Louis, Montmarquette, C. and Simonnet, V. (2005). Job Satisfaction and Quits. Labour Economics (In press).
Maddala, G. S. (1983). “Limited Dependent and Qualitative Variables in Econometrics.” Cambridge University Press, Cambridge.
Michaelowa, Katharina. (2002). “Teacher Job Satisfaction, Student Achievement, and the Cost of Primary Education in Francophone Sub-Saharan Africa”. HWWA Discussion Paper 188.
Muralidharan, Karthik and Venkatesh Sundararaman. 2006. "Teacher Incentives in Developing Countries: Experimental Evidence from India." Harvard University and the World Bank.
PROBE Team. 1999. Public Report on Basic Education in India. New Delhi: Oxford University Press.
Reinikka, Ritva and Jakob Svensson. 2003. "Working for God? Evaluating Service Delivery of Religious Not-for-Profit Health Care Providers in Uganda." The World Bank, Policy Research Working Paper Series: 3058.
Reinikka, Ritva and Jakob Svensson. 2004. "Local Capture: Evidence from a Central Government Transfer Program in Uganda." Quarterly Journal of Economics, 119:2, pp. 679-705.
Shields, Michael A. and Stephen Wheatley Price. (2002). Racial Harassment, Job Satisfaction and Intentions to Quit: Evidence from the British Nursing Profession. Economica 69:295-326.
Thomas, C. and Shaw, C. (1992) Issues in the development of multigrade schools. World Bank Technical Paper Number 172. World Bank, Washington, DC.
18
Draft – Not for quotation or attribution
Vegas, Emiliana ed. 2005. Incentives to Improve Teaching: Lessons from Latin America. Washington, DC: World Bank.
Vila, Luis E. and Garcia-Mora, Belen. (2005). Education and the Determinants of Job Satisfaction. Education Economics 13(4): 409-425.
Ward, Melanie E. and Peter J. Sloane. (2000). Non-pecuniary Advantages Versus Pecuniary Disadvantages: Job Satisfaction among Male and Female Academics in Scottish Universities. Scottish Journal of Political Economy 47:273-303.
Warr, P. (1999). Well-being and the Workplace. In: Kahneman D., E. Diener, and N. Schwartz (Eds.) Well-being: The Foundations of Hedonic Psychology. New York: Russell Sage Foundation.
World Bank. 2003. World Development Report 2004: Making Services Work for Poor People. Washington, DC: Oxford University Press for the World Bank.
Yong, Bob Chui Seng. (1994). Factors That Determine the Attractiveness of the Teaching Profession in Brunei Darussalam as Perceived by Teacher Trainess. Journal of Education for Teaching, 20(1): 113-126.
19
Draft – Not for quotation or attribution
Figure 1: Teacher satisfaction levels for a random national sample of Indonesian
primary-school teachers
020
4060
8010
0P
erce
ntag
e
Salary Work env. Parents Social status
Teacher satisfaction at government school
Very dissatisfied DissatisfiedIndifferent SatisfiedVery satisfied
20

Draft – Not for quotation or attribution
Figure 2: Average teacher satisfaction with salary vs. satisfaction on other dimensions
Ver
y di
s.D
issa
tisfie
dIn
diffe
rent
Sat
isfie
dV
ery
sat.
Ave
rage
of t
hree
sat
. ind
ices
Very dis. Dissatisfied Indifferent Satisfied Very sat.Salary satisfaction
School-level average satisfaction for government school
21

Draft – Not for quotation or attribution
22
Table 1: Correlations among different satisfaction measures (at the level of the individual teacher)
Satisfaction with
Satisfaction with Salary Social status
Work environment
Appreciation from parents
Salary 1.000 Social status 0.092*** 1.000 Work environment 0.059* 0.381*** 1.000 Appreciation from parents 0.112*** 0.475*** 0.281*** 1.000
Note: 883 observations
Table 2: Determinants of teacher satisfaction
Salary satisfaction Work env. satisfaction Salary & work sat. (1) (2) (3) (4) (5) (6) (7) (8) Female 0.071 0.092 -0.033 -0.02 0.073 0.267 (0.058) (0.060) (0.062) -0.057 (0.084) (0.213) Experience 0.004 0.001 0.003 -0.001 -0.000 -0.004 (0.005) (0.005) (0.004) -0.004 (0.007) (0.015) Recent teacher training 0.212* 0.167 -0.089 -0.033 0.134 0.429 (0.108) (0.105) (0.074) -0.075 (0.148) (0.405) College-educated -0.091 -0.128 -0.017 -0.046 -0.174 -0.588 (0.100) (0.096) (0.071) -0.078 (0.144) (0.399) Married -0.065 -0.066 -0.032 -0.061 -0.127 -0.174 (0.123) (0.124) (0.078) -0.08 (0.145) (0.395) Native speaker of local lang. 0.206*** 0.145* 0.114* 0.049 0.194** 0.596*** (0.073) (0.074) (0.058) -0.061 (0.078) (0.212) Head teacher or deputy head teacher 0.468** 0.531*** 0.174 0.222 0.754*** 1.953***
(0.184) (0.202) (0.155) -0.154 (0.255) (0.647) Other permanent teachers 0.426*** 0.529*** 0.119 0.161 0.689*** 1.795*** (0.140) (0.149) (0.106) -0.113 (0.206) (0.473) School is multigrade 0.894*** 0.928*** -0.467*** -0.463*** 0.465* 1.741** (0.171) (0.179) (0.114) -0.12 (0.269) (0.690) Teacher rec. program 0.047 0.054 -0.009 -0.02 0.035 -0.011 (0.090) (0.080) (0.073) -0.072 (0.110) (0.278) Distance to paved road 0.029 0.030 -0.019 -0.02 0.009 0.081 (0.054) (0.052) (0.038) -0.037 (0.072) (0.189) Distance to Edu. Min. office 0.018 0.015 0.136*** 0.134*** 0.149 0.270 (0.065) (0.068) (0.045) -0.046 (0.094) (0.202)
Preliminary draft – Not for quotation or attribution
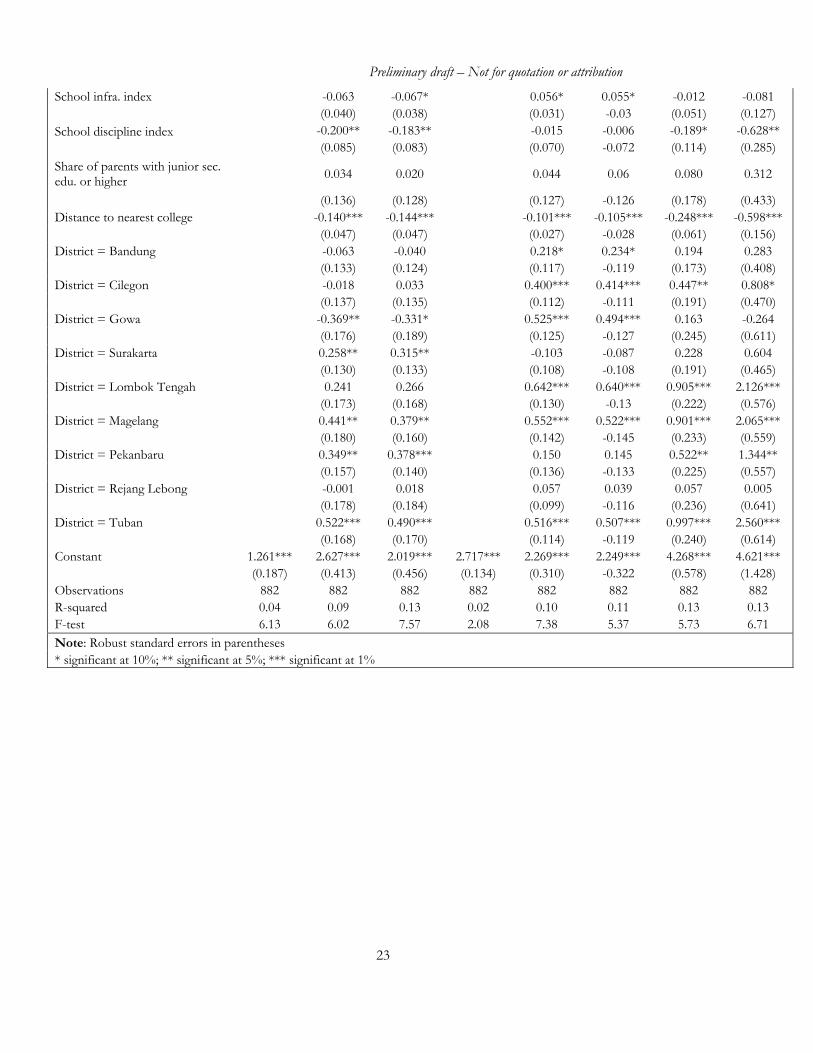
23
School infra. index -0.063 -0.067* 0.056* 0.055* -0.012 -0.081 (0.040) (0.038) (0.031) -0.03 (0.051) (0.127) School discipline index -0.200** -0.183** -0.015 -0.006 -0.189* -0.628** (0.085) (0.083) (0.070) -0.072 (0.114) (0.285) Share of parents with junior sec. edu. or higher 0.034 0.020 0.044 0.06 0.080 0.312
(0.136) (0.128) (0.127) -0.126 (0.178) (0.433) Distance to nearest college -0.140*** -0.144*** -0.101*** -0.105*** -0.248*** -0.598*** (0.047) (0.047) (0.027) -0.028 (0.061) (0.156) District = Bandung -0.063 -0.040 0.218* 0.234* 0.194 0.283 (0.133) (0.124) (0.117) -0.119 (0.173) (0.408) District = Cilegon -0.018 0.033 0.400*** 0.414*** 0.447** 0.808* (0.137) (0.135) (0.112) -0.111 (0.191) (0.470) District = Gowa -0.369** -0.331* 0.525*** 0.494*** 0.163 -0.264 (0.176) (0.189) (0.125) -0.127 (0.245) (0.611) District = Surakarta 0.258** 0.315** -0.103 -0.087 0.228 0.604 (0.130) (0.133) (0.108) -0.108 (0.191) (0.465) District = Lombok Tengah 0.241 0.266 0.642*** 0.640*** 0.905*** 2.126*** (0.173) (0.168) (0.130) -0.13 (0.222) (0.576) District = Magelang 0.441** 0.379** 0.552*** 0.522*** 0.901*** 2.065*** (0.180) (0.160) (0.142) -0.145 (0.233) (0.559) District = Pekanbaru 0.349** 0.378*** 0.150 0.145 0.522** 1.344** (0.157) (0.140) (0.136) -0.133 (0.225) (0.557) District = Rejang Lebong -0.001 0.018 0.057 0.039 0.057 0.005 (0.178) (0.184) (0.099) -0.116 (0.236) (0.641) District = Tuban 0.522*** 0.490*** 0.516*** 0.507*** 0.997*** 2.560*** (0.168) (0.170) (0.114) -0.119 (0.240) (0.614) Constant 1.261*** 2.627*** 2.019*** 2.717*** 2.269*** 2.249*** 4.268*** 4.621*** (0.187) (0.413) (0.456) (0.134) (0.310) -0.322 (0.578) (1.428) Observations 882 882 882 882 882 882 882 882 R-squared 0.04 0.09 0.13 0.02 0.10 0.11 0.13 0.13 F-test 6.13 6.02 7.57 2.08 7.38 5.37 5.73 6.71 Note: Robust standard errors in parentheses * significant at 10%; ** significant at 5%; *** significant at 1%
Preliminary draft – Not for quotation or attribution
24
Table 3a: Impact of teacher satisfaction on teacher absenteeism
(1) (2) (3) (4) (5) (6)
Salary satisfaction 0.113** -0.775*** 0.103 (0.052) (0.280) (0.778) Work environment satisfaction -0.002 -1.080*** -1.114*** (0.075) (0.390) (0.239) Female -0.077 0.021 -0.076 -0.070 -0.048 -0.020 (0.091) (0.087) (0.110) (0.091) (0.097) (0.057) Experience -0.003 -0.001 0.001 -0.003 -0.001 -0.001 (0.007) (0.006) (0.007) (0.007) (0.006) (0.004) Recent teacher training 0.125 0.200 0.167 0.146 0.046 0.036 (0.220) (0.196) (0.254) (0.223) (0.208) (0.203) College-educated 0.158 0.050 -0.128 0.147 0.075 0.075 (0.214) (0.193) (0.095) (0.214) (0.199) (0.075) Married 0.082 0.019 0.082 0.079 -0.030 -0.034 (0.190) (0.182) (0.196) (0.195) (0.181) (0.169) Native speaker of local lang. -0.221** -0.033 0.145** -0.203** -0.092 -0.085 (0.095) (0.128) (0.146) (0.095) (0.125) (0.112) Head teacher or deputy head teacher -0.325 0.241 -0.319 -0.257 0.006 0.222 (0.226) (0.337) (0.200) (0.224) (0.259) (0.248) Other permanent teachers -0.694*** -0.047 -0.689 -0.634*** -0.294 -0.275 (0.171) (0.335) (0.147) (0.171) (0.267) (0.214) Teacher rec. program -0.456*** -0.327** -0.456*** -0.458*** -0.355** -0.021 (0.153) (0.161) (0.078) (0.153) (0.150) (0.136) Distance to paved road 0.069 0.060 0.030 0.068 0.011 0.008 (0.072) (0.071) (0.052) (0.072) (0.078) (0.037) Distance to Edu. Min. office -0.008 -0.010 -0.008 -0.008 0.045 0.045 (0.065) (0.071) (0.065) (0.065) (0.063) (0.045) School discipline index 0.124 -0.116 -0.184** 0.094 0.082 0.078 (0.166) (0.174) (0.082) (0.164) (0.164) (0.070) Share of parents with junior sec. edu. or higher -0.494** -0.363* -0.495** -0.505** -0.287 0.059 (0.235) (0.206) (0.126) (0.234) (0.245) (0.124) District = Bandung 0.861*** 0.647** -0.040 0.863*** 0.861*** 0.845*** (0.318) (0.291) (0.123) (0.318) (0.290) (0.114) District = Cilegon -0.003 0.092 -0.002 0.005 0.386 0.416*** (0.179) (0.170) (0.199) (0.183) (0.261) (0.228) District = Gowa 0.525** 0.134 -0.329 0.493** 0.596*** 0.590*** (0.237) (0.253) (0.301) (0.234) (0.221) (0.225) District = Surakarta -0.115 0.252 0.315** -0.072 -0.128 -0.131 (0.235) (0.242) (0.130) (0.235) (0.217) (0.214) District = Lombok Tengah 0.250 0.327 0.252 0.270 0.774** 0.787*** (0.257) (0.242) (0.282) (0.263) (0.311) (0.288) District = Magelang -0.534 -0.076 0.379** -0.501 0.078 0.109 (0.418) (0.358) (0.480) (0.425) (0.458) (0.144) District = Pekanbaru 1.407*** 1.352*** 0.378*** 1.453*** 1.186*** 1.149*** (0.202) (0.266) (0.406) (0.204) (0.323) (0.132) District = Rejang Lebong 0.255 0.250 0.256 0.261 0.208 0.203 (0.260) (0.242) (0.184) (0.260) (0.230) (0.231)
Preliminary draft – Not for quotation or attribution
25
District = Tuban 0.441* 0.652** 0.445 0.489* 0.825*** 0.506*** (0.250) (0.257) (0.408) (0.258) (0.271) (0.260) Constant -0.158 0.907 2.018*** -0.001 2.615** 2.695*** (0.394) (0.620) (0.465) (0.456) (1.074) (0.726) Instruments Distance to nearest college No Yes Yes No Yes Yes School quality No No Yes No No Yes Observations 882 882 882 882 882 882 Wald chi2 171.16 264.02 177.30 159.96 231.89 250.80 d.f. 23 23 23 23 23 23 Note: Robust standard errors in parentheses * significant at 10%; ** significant at 5%; *** significant at 1%

Preliminary draft – Not for quotation or attribution
26
Table 3b: Impact of teacher satisfaction on teacher absenteeism
(1) (2) (3) (4) Salary satisfaction plus work satisfaction -0.507** -0.481* (0.221) (0.281) Salary satisfaction multiplied by work satisfaction -0.205** -0.170 (0.084) (0.133) Female -0.008 -0.012 0.232 0.243 (0.094) (0.097) (0.093) (0.101) Experience -0.001 -0.001 -0.006 -0.006 (0.006) (0.007) (0.015) (0.006) Recent teacher training 0.153 0.134 0.170 0.170 (0.216) (0.217) (0.220) (0.224) College-educated 0.068 -0.168 -0.554 -0.577 (0.212) (0.216) (0.397) (0.393) Married -0.003 0.002 -0.132 -0.144 (0.189) (0.195) (0.183) (0.192) Native speaker of local lang. -0.064 -0.073 0.594*** 0.594*** (0.124) (0.136) (0.127) (0.157) Head teacher or deputy head teacher 0.165 0.142 2.025*** 0.110 (0.317) (0.251) (0.634) (0.635) Other permanent teachers -0.167 -0.196 -0.133 1.801*** (0.313) (0.203) (0.466) (0.467) Teacher rec. program -0.380** -0.388** -0.394*** -0.418*** (0.150) (0.156) (0.279) (0.157) Distance to paved road 0.044 0.009 0.056 0.087 (0.077) (0.071) (0.076) (0.075) Distance to Edu. Min. office 0.014 0.013 0.347* 0.343* (0.070) (0.085) (0.184) (0.178) School discipline index -0.040 -0.198* -0.681** -0.047 (0.178) (0.114) (0.182) (0.284) Share of parents with junior sec. edu. or higher -0.365* 0.069 0.255 0.283 (0.216) (0.227) (0.220) (0.429) District = Bandung 0.827*** 0.837*** 0.774*** 0.338 (0.285) (0.167) (0.394) (0.288) District = Cilegon 0.244 0.455*** 0.193 0.894** (0.216) (0.174) (0.199) (0.426) District = Gowa 0.369 0.215 0.255 0.014 (0.227) (0.203) (0.518) (0.518) District = Surakarta 0.104 0.233 0.642 0.082 (0.246) (0.258) (0.468) (0.271) District = Lombok Tengah 0.582* 0.905*** 2.129*** 0.517 (0.298) (0.215) (0.291) (0.560) District = Magelang -0.005 -0.034 2.139*** 2.163*** (0.426) (0.470) (0.411) (0.491) District = Pekanbaru 1.440*** 1.453*** 1.423*** 1.473*** (0.238) (0.239) (0.242) (0.232)

Preliminary draft – Not for quotation or attribution
27
District = Rejang Lebong 0.264 0.071 0.080 0.250 (0.246) (0.233) (0.627) (0.247) District = Tuban 0.816*** 0.803** 0.826*** 2.579*** (0.304) (0.237) (0.298) (0.348) Constant 1.816* 1.724 0.533 0.437 (0.999) (1.191) (1.059) (0.596) Instruments Distance to nearest college Yes Yes Yes Yes School quality No Yes No Yes Observations 882 882 882 882 Wald chi2 185.60 179.78 201.27 176.94 d.f. 23 23 23 23 Note: Robust standard errors in parentheses * significant at 10%; ** significant at 5%; *** significant at 1%

Preliminary draft – Not for quotation or attribution
28
Figure 3: Teacher absence probabilities versus satisfaction levels
0
0.2
0.4
0.6
0.8
1
1.2
Verydiss.
Diss. Indiff. Satis. Verysatis.
Teacher satisfaction levels
Prob
abili
ties
of b
eing
abs
ent
Salary satisfactionWork satisfaction