what do banks do? - the future of finance
TRANSCRIPT

Adair TurnerAndrew HaldanePaul WoolleySushil WadhwaniCharles GoodhartAndrew SmithersAndrew LargeJohn KayMartin WolfPeter BooneSimon JohnsonRichard Layard
futureoffinance.org.uk
1 What do banks do? Why do credit booms and busts occur and what can public policy do about it?
THE FuTurE oF FinancEAnd the theory that underpins it

Copyright © by the Authors. All Rights Reserved. 2010.
Adair Turner and others (2010), The Future of Finance: The LSE Report, London School of Economics and Political Science.
Cover Design: LSE Design Unit
For further information, contact Harriet Ogborn
Email: [email protected]
Tel: 020 7955 7048

5
Chapter 1 What do banks do? Why do credit booms and busts
occur and what can public policy do about it?
Adair Turner
Over the last 30 to 40 years the role of finance within developed economies has
grown dramatically: debt to GDP ratios have increased, trading volumes exploded, and
financial products have become more complex. Until the recent crisis this growing scale
and complexity were believed to enhance both efficiency and stability. That assumption
was wrong. To understand why, we need to recognise specific features of financial
markets, credit contracts, and fractional reserve banks. The recent crisis was particularly
severe because of the interaction between the specific characteristics of maturity
transforming banks and securitised credit markets. The regulatory response needs to
distinguish the different economic functions of different categories of credit: only a
fraction of credit extension relates to capital formation processes. The response should
combine much higher bank capital requirements than pre-crisis, liquidity policies which
reduce aggregate maturity transformation, and counter-cyclical macro prudential tools
possibly deployed on a sectorally specific basis.
Introduction and Summary
In 2007 to 2008 the world faced a huge financial crisis, which has resulted in major
losses in wealth and employment and which has imposed great burdens on the public
finances of developed countries. The latest stage of the crisis – its mutation into sovereign
debt concerns – is still ongoing. We still need to manage out of the crisis; and we need to
learn the lessons of what went wrong, so that we can reduce the probability and severity
of future crisis. To do that effectively, we need to ask fundamental questions about the
optimal size and functions of the financial system and about its value added within the
economy, and about whether and under what conditions the financial system tends to
generate economic stability or instability. We need to debate what the ―future of finance‖
should be. That is the purpose of the essays combined in this book.
The recent past of finance, the last 20 to 30 years, has been striking, with three
important developments: (i) first, a very major growth in the scale of financial activities
relative to the real economy; (ii) second, an explosion of the complexity of financial
products and services, in particular linked to the development of securitised credit and of
credit and other derivatives; (iii) and third, a rise in intellectual confidence that this

Chapter 1 – Adair Turner
6
growth in scale and complexity was adding economic value, making the global economy
both more efficient and less risky.
It is now clear that the third assumption was quite wrong: we need to understand
why.
Many aspects of what went wrong are obvious and have been set out in numerous
official and academic reports. Risk management practices were often poor, relying on
over-simplistic mathematical models; governance arrangements – the role of boards, risk
committees and risk managers – were often inadequate, as sometimes was supervision by
regulatory authorities. Rating agencies were beset by conflicts of interest. Complex
structured products were sometimes sold to investors who failed to understand the
embedded options; and in derivatives markets, huge counterparty exposures appeared,
creating severe risks of interconnected failure. The policy response now being designed at
European and global level needs to address, and is addressing, these clear deficiencies.
But even if these deficiencies are addressed, the future financial system could
remain dangerously unstable. Regulatory reform needs to address more fundamental
issues. To do that effectively it must recognise that financial markets and systems have
highly specific characteristics which distinguish them from other markets within a
capitalist economy. In particular: (i) financial markets are different because inherently
susceptible to de-stabilising divergences from equilibrium values; (ii) credit contracts
create highly specific risks which increase economic volatility, and different categories of
credit perform different functions and create different risks1; (iii) banks are highly
specific institutions which introduced their own specific risks into the economy.
Understanding these distinctive characteristics is central to understanding the potential
dynamics of modern market economies; too much of modern economics has ignored them
almost completely, treating the financial system as neutral in its macro-economic effect.
This chapter considers their implications. Its key conclusions are that:
(i) There is no clear evidence that the growth in the scale and complexity of the
financial system in the rich developed world over the last 20 to 30 years has driven
increased growth or stability, and it is possible for financial activity to extract rents
from the real economy rather than to deliver economy value. Financial innovation
and deepening may in some ways and under some circumstances foster economic
1 Three features of credit contracts carry important implications for cyclical tendencies within a
market economy: specificity of tenor; specificity of nominal value; and the rigidity and irreversibility of
default and bankruptcy. See Adair Turner Something Old and Something New: Novel and Familiar Drivers
of the Latest Crisis, lecture to the European Association of Banking and Financial History (May 2010) for a
discussion of these features.

Chapter 1 – Adair Turner
7
value creation, but that needs to be illustrated at the level of specific effects: it
cannot be asserted a priori or on the basis of top level analysis.
(ii) The most fundamental development in several developed economies in the last 40
to 50 years has been the growth in private sector debt to GDP, and it is essential to
understand the role which debt/credit plays within our economy. In many current
discussions about the potential impact of higher capital requirements on growth, the
focus is almost exclusively on credit extension as a means to intermediate
household savings into corporate investment, with a direct potential link between
credit extension and GDP growth. But in many developed economies the majority
of credit extension plays no such role and instead either (i) supports consumption
smoothing across the life-cycle, in particular through residential mortgages; (ii)
supports leveraged ―asset play‖ investments in already existing assets, in particular
in commercial real estate. Lending against property – residential or commercial –
dominates credit extension and is inherently susceptible to self-reinforcing cycles of
credit supply and asset price.
(iii) Fractional reserve banks facilitate all categories of credit extension through
maturity transformation, which in turn creates significant risks. There is a
reasonable case that financial deepening via bank credit extension plays a growth-
enhancing role in the early and mid stages of economic development, but it does not
follow that further financial deepening (i.e. a growing level of private sector credit
and bank money relative to GDP) is limitlessly value creative. Less maturity
transformation in aggregate and a reduced role for bank credit in the economy,
compared with that which emerged pre-crisis in several developed economies, may
in the long run be optimal.
(iv) While volatile credit supply in part derives specifically from the existence of banks,
which introduce both leverage and maturity transformation into the financial
system, the development of securitised credit and mark-to-market accounting has
also contributed to that volatility, increasing the extent to which credit pricing and
the quantity of credit supplied are driven by self-referential assessments of credit
risk derived from the market price of credit.
(v) The essential reason why the 2007 – 2008 crisis was so extreme was the interaction
of the specific features of bank credit and the specific features of securitised credit.
(vi) Looking beyond banking and credit supply to the more general development of
trading activity in non-credit derivatives, foreign exchange and equities, a
pragmatic approach to the economic value of liquid traded markets should replace
the axiomatic belief in the value of increased liquidity which characterised the pre-
crisis years. Market liquidity delivers economic value up to a point, but not
limitlessly. Liquid FX markets play a role in lubricating trade and capital flows, but
can overshoot equilibrium values. Equity markets may be reasonably efficient at
setting relative prices, but are susceptible to huge aggregate overshoots. Volatility
in equity markets, however, is less harmful than volatility in debt markets. Market

Chapter 1 – Adair Turner
8
making can be an economically useful function, but some proprietary trading (e.g.
many FX carry trades) perform no useful economic purpose and can generate
instability. The ability of regulators to distinguish useful market-making from de-
stabilising proprietary trading is, however, limited. Conversely, however, it is not
nil.
If the essential causes of the crisis lay in the interaction between the specific risky
characteristics of banks and of securitised credit markets, the regulatory response must
address these fundamental issues.
The implications for policy are that:
(i) No silver bullet structural reform can be an adequate response.
Addressing the ―Too Big To Fail‖ issue is a necessary but not sufficient response.
Destabilising volatility of credit supply could arise in a system of multiple small
banks.
The objective behind the Volcker rule is highly desirable, but a system of
completely separate commercial and investment banks could still generate de-
stabilising credit and asset price swings.
Narrow banking proposals to separate insured deposit taking from lending activities
will fail to address the fundamental drivers of credit and asset price instability.
Proposals for replacing banks with 100% equity financed loan funds, while useful
in stimulating thinking about radical increases in bank capital requirements, might
exacerbate price and valuation driven instability.
(ii) The most important elements of the regulatory reform instead need to be:
Much higher capital requirements across the whole of the banking system, and
liquidity requirements which significantly reduce aggregate cross-system maturity
transformation in both banks and shadow banks.
The development of counter-cyclical macro-prudential tools which can lean against
the wind of credit and asset price cycles, and which may need to do so on a sector
specific basis.
(iii) Other elements of reform are appropriate but less fundamental.
Improvements in and regulation of remuneration, risk governance and rating
agencies practices have a role to play.
More effective and intense supervision of individual firms is important.
Fiscal policies – levies and taxes – can legitimately raise revenue and can be
designed to complement capital and liquidity regulation.

Chapter 1 – Adair Turner
9
And a pragmatic attitude towards the value of liquid traded markets implies that
constraints on specific products or practices, such as short-selling, may be useful
elements in the regulatory tool kit and should not be rejected as axiomatically
harmful.
But none of these other policies is as important as higher capital and liquidity
standards and the development of a macro-prudential approach; and it is vital that focus
on other aspects of the reform does not divert attention from these priorities.
To make these points, this chapter is structured in six sections:
1. First, what a financial system does, and in particular, what banks do: their
theoretical value added within the economy.
2. Second, trends in the banking and financial system over the last 50 years,
illustrating a dramatic increase in the overall scale of the financial sector, and
important changes in the mix of activities performed.
3. Third, a focus on the provision of credit to the real economy: and the relationship
between credit, economic growth and human welfare. And an argument in favour of
new macro-prudential policy tools, focused directly on the dynamics of credit
extension.
4. Fourth, a look at the complex securitisation which developed over the last 15 years.
Was it truly valuable? Will it return and do we want it to return? And what policy
measures are required to make sure that it plays its appropriate function in the real
economy?
5. Fifth, a focus on the provision of market liquidity and on the trading and position-
taking activities which support it. How valuable is it? And what policy implications
follow if we do not accept that more trading activity is always beneficial in all
markets?
6. Sixth, implications for the regulatory reform agenda.
* * *

Chapter 1 – Adair Turner
10
1. The financial system‟s value added to the economy
What does the financial system do, and how does it deliver economic value added
or welfare benefits? There are many different ways of categorising financial system
activities. For the purposes of this chapter, I will start with a fourfold distinction between:
First, the provision of payment services, both retail and wholesale.
Second, the provision of pure insurance services, life or general, wholesale and
retail, which enable people or businesses to lay off exposure to risks by pooling
their exposure with others.
Third, the creation of markets in spot or short-term futures instruments in, for
instance, foreign exchange and commodities.
Fourth and finally, financial intermediation between providers of funds and users of
funds, savers and borrowers, investors and businesses, an intermediation which
plays a crucial role in capital allocation within the economy.
Specific products and activities of course span these four categories. A bank current
account is a bundled mix of one and four. Most life insurance products bundle elements
of two and four. And commodities trading via the futures market can be a form of
investment, competing with other categories of investment to which savers might wish to
devote their funds. But the conceptual distinctions nevertheless remain valuable.
My focus in this chapter will be almost entirely on category four, with some
comments in the final section on category three. It is in these category four activities that
the problems arose in the latest crisis: nothing went wrong with the payment system, or
with insurance pooling services, or with spot foreign exchange markets. And indeed it is
within this category four set of activities that problems have arisen in most past financial
crisis and where they are most likely to lie in future.
The function we are focusing on here (Chart 1) is that of linking providers of funds
(which can be either households or businesses or other corporate bodies) with users of
funds, which again can be either households, businesses or other corporate bodies, or
indeed the government. And the claims which exist between the providers and the issuers
can take debt or equity (or intermediate) form, and can be a variety of different maturities.
And one function that parts of the financial system perform is simply to help make a
match between specific providers of funds and specific users, so that a direct investment
can be made. Equity research and underwriting and distribution, for instance, can result in

Chapter 1 – Adair Turner
11
an individual household or corporate body owning a share of a specific company –
similarly for bond research underwriting and distribution. But this match-making function
is actually only a small part of what the financial system does. Indeed, the core of what
the financial system does is to intermediate non-matching providers and users of funds,
enabling the pattern of providers‘ assets to differ from the pattern of users‘ liabilities.
This intermediation of non matching assets and liabilities entails four functions.
First, a pooling of risks, with each depositor of a bank having an indirect claim on
all the mortgages, business loans, or credit card receivables owed to the bank rather
than a claim on one specific mortgage or loan.
Second, maturity transformation via balance sheet intermediation, with banks
lending at longer average maturities than they borrow. The clear risks inherent in
this transformation are off-set by the equity cushion, but also by the holding of a
fractional reserve of highly liquid assets, by liquidity insurance achieved through
lines available from other banks and by the central bank lender-of-last-resort
function (Chart 2). This maturity transformation function enables, for instance,
savers within the household sector to hold short-term deposits, while borrowers
within the household sector can borrow on long-term mortgages.
Third, maturity transformation via the provision of market liquidity, which gives the
holder of a contractually long-term asset the option of selling it immediately in a
liquid market. The matching process I referred to earlier can result in a company
issuing perpetual equity which is bought by a specific investor who intends to hold
the equity in perpetuity, taking the dividend stream. But if there is a liquid market in
equities that investor does not have to hold the equity perpetually but has the option
of selling the equity.2
Fourth and finally, risk return transformation, the creation of a different mix of debt
and equity investment options for savers than arise naturally from the liabilities of
the borrowers. Thus what a bank balance sheet essentially does is take a set of debt
liabilities from final users and, in the language of securitisation, to ‗tranche‘ them,
with some investors buying bank equity, some buying bank subordinated debt,
some senior debt, and some making deposits (Chart 3). As a result, depositors and
senior debt holders hold a debt claim of much lower risk than the average pooled
quality of the asset side of the banks‘ balance sheet, but also lower return, while
equity holders have a higher risk and higher return investment.
2 Of course this form of liquidity provision comes with uncertainty as to capital value, while
maturity transformation on balance sheet enables the depositor to enjoy both liquidity and (almost, it is
hoped) capital certainty. But it is still a form of maturity transformation, giving the fund provider a different
set of asset options than is inherent in the maturity of the liabilities faced by fund users.

Chapter 1 – Adair Turner
12
These four transformation functions can deliver value added to the economy in
three different ways (Chart 4).
The first function, pooling, entails the intermediary allocating capital to end
projects. The financial system plays an indirect role in the capital allocation process
even when it facilitates and informs direct matched investments – via, for instance,
equity research and distribution. But it plays an even more active role in capital
allocation when it performs pooling functions, either via asset management or via
the pooling of bank debt claims. And it is important that it is done well, since a
more efficient allocation of capital will tend to produce a higher level of income for
any given level of investment.3
Second, and within the household sector, functions two and three enable individuals
to hold the maturity mix of assets and liabilities which they want with, for instance,
savers able to have short-term deposits, while borrowers can have long-term
maturity mortgages. This provides assurance of access to liquid assets in the face of
either fluctuating consumption or unanticipated income shocks. It enables more
extensive smoothing of consumption across the life cycle. And as a result it can
deliver direct consumer welfare benefits independent of any impact on aggregate
savings rates, investment levels, the efficiency of capital allocation, or economic
growth.
Third, all four functions together enable individual household sector savers to hold
a mix of assets (as defined by risk, return and liquidity) which is different from the
mix of liabilities owed by business users of funds. This transformation may under
some circumstances produce a higher rate of savings, more productive investment
and, for a period of time, higher growth.4 Thus, for instance, maturity
transformation makes possible a term structure of interest rates more favourable to
long-term investment than would otherwise pertain, making long-term loans
available on better terms. But in general, the impact of transformation of
risk/return/and liquidity possibilities will be to produce a level of savings which is
optimal even if not necessarily higher, i.e. a level of savings which best reflects
individual preferences and which thus maximises welfare. Under some
circumstances this welfare maximising savings rate might be lower than would
pertain in a less developed financial system: underdeveloped financial systems, by
constraining financial investment options and life cycle consumption smoothing
3 This financial intermediary function does not perform the whole of the capital allocation process. A
significant amount of capital allocation occurs de facto within large firms, which make decisions about the
use of retained earnings. But while not performing the whole of the capital allocation process, the financial
system plays an important role. 4 A higher rate of investment will produce a period of higher growth and a higher level of income at
any one time than would otherwise pertain, but not a permanently higher growth rate.

Chapter 1 – Adair Turner
13
choices, can sometimes constrain individuals to choose savings rates higher than
they would choose if a wider set of investment and borrowing options was
available.
The first of these benefits, capital allocation, derives from the pooling function. The
second and third derive from the risk-return transformation and the maturity
transformation processes. Essentially what these do is to increase the range of options for
investment in different combinations of risk/return/maturity beyond that which would
exist if investors had to invest directly in the individual untransformed liabilities of
business or households, or in pools of these untransformed liabilities.
Finally in this description of the theory, it is useful to note that the wave of complex
credit securitisation which occurred over the last 15 to 20 years, was not in its economic
function entirely new, but rather an intensification of the four financial system
transformations described above and an application of those transformation functions to
more assets and at a finer level of differentiation. Thus:
Complex securitisation pooled previously un-pooled assets such as mortgages.
It transformed the risk/return characteristics of assets by tranching, taking for
instance, a set of mortgages with an average untransformed credit rating of A, and
manufacturing some AAA securities, some AA, some BBB and some equity.
It introduced new forms of contractual balance sheet maturity transformation, via
Structured Investment Vehicles (SIVs), conduits and mutual funds, which enabled
short-term providers of funds to fund longer term credit extensions.5
And it was underpinned by extensive trading in credit securities, providing market
liquidity so that the holder of a contractually long credit security could sell it
immediately if they wanted.
By doing all this, complex securitisation increased the extent to which assets
offered to investors could be tailored to their specific preferences for specific
combinations of risk/return and liquidity. As a result, its proponents asserted before the
crisis, it must have increased economic efficiency and economic welfare. Whether that
argument was valid is considered in Section 4.
5 Indeed it also applied the technologies of rotating ‗master trusts‘ to achieve maturity transformation
in the other direction, creating longer term credit securities out of mortgages whose average expected
repayment maturity might (but might not) be relatively short term.

Chapter 1 – Adair Turner
14
2. Trends in banking, securitisation and trading
Section 1 has considered the functions which a banking and financial system can in
principle perform. A striking fact about the last 30 to 40 years of economic history is that
the scale on which it performs those functions, the overall size of the financial system
relative to the real economy, has dramatically increased. There are several different
dimensions to this increase. (Chart 5)
Leverage – measured by debt to GDP – has increased significantly in many
countries including the US shown here, with households in particular becoming
more indebted, and with a particularly striking increase in intra-financial system
leverage, claims by one financial firm upon another.
Innovation has driven complexity, with a massive development over the last 20
years of complex securitisation and derivatives products.
And trading volumes have increased hugely, relative to underlying real economic
variables, with foreign exchange trading increasing for instance from eleven times
global trade and long-term investment flows in the 1970‘s to over 70 times today
and with similarly dramatic increases in oil and derivatives trading.
There has thus been an increasingly ‗financialisation‘ of the economy, an increasing
role for the financial sector. Financial firms as a result have accounted for an increased
share of GDP, of corporate profits, and of stock market capitalisation. And there has been
a sharp rise in income differential between many employees in the financial sector and
average incomes across the whole of the economy.
This increasing financial intensity reflected in part the globalisation of world trade
and capital flows, and the floating exchange rate regimes which followed the breakdown
of the Bretton Woods system in the 1970‘s, but also deliberate policies of domestic
financial liberalisation.
A crucial issue is therefore whether this increased financial intensity has delivered
value added for the real economy – whether it has improved capital allocation, increased
growth, or increased human welfare and choice in ways which do not show up in growth
rates. And whether it has made the economy more or less volatile and vulnerable to
shocks.
Three observations are striking when we pose that question.

Chapter 1 – Adair Turner
15
First is the relatively little attention to that question paid by mainstream economics,
with many theories of growth and development, and many models of the economy
used by policymakers in finance ministries and central banks, treating the financial
system as a neutral pass through. As Alan Taylor and Moritz Shularick note in a
recent paper which considers the same issues I will address in this chapter: ‗in the
monetarist view of Freidman and Schwartz (1963) and also in the recently dominant
neokeynesian synthesis, macroeconomic outcomes are largely independent of the
performance of the financial system‘.6
Second, however, is that while the recently dominant neoclassical school of
economics has often been uninterested in the detailed transmission mechanisms
which link actual financial institutions to real economic variables, it has provided
strong support for the belief that increased financial activity – financial deepening,
innovation, active trading and increased liquidity – must be a broadly positive
development. This is because more financial activity helps complete markets. The
first fundamental theorem of welfare economics, demonstrated mathematically by
Kenneth Arrow and Gerard Debreu, illustrates that a competitive equilibrium is
efficient, but only if markets are complete, i.e. if there are markets in which to strike
all possible desired contracts, including insurance contracts and investment
contracts linking the present and the future, as well as markets for current goods,
services and labour.7 Therefore, the more that the financial sector provides the
transformation functions described in Section 1, the more that innovation allows
investors to choose precise combinations of risk, return, and liquidity and the more
that trading activity generates market liquidity, the more efficient and welfare-
maximising must the economy be.
These theoretical propositions have moreover had a major influence on policy
makers. Keynesian famously suggested that ‗practical men, who believe themselves
quite exempt from any intellectual influences, are usually the slaves of some
defunct economist‘. But the bigger danger may be that reasonably intellectual men
and women who play key policy making roles can be over-influenced by the
predominant conventional wisdom of the current generation of academic
economists. Certainly in the UK Financial Services Authority, the idea that greater
market liquidity is in almost all cases beneficial, that financial innovation was to be
encouraged because it expanded investor and issuer choice, and that regulatory
interventions can only be justified if specific market imperfections can be
identified, formed key elements in our institutional DNA in the years ahead of the
crisis. And the predominant tendency of the International Monetary Fund in the
years before the crisis was to stress the advantages of free capital flows, financial
6 M Schularick and A M Taylor “Credit Booms Gone Bust: Monetary Policy, Leveraged Cycles and
Financial Crises 1870 to 2008”. NBER working paper number 15512, November 2009. 7 K Arrow and G Debreu. Existence of an Equilibrium for a Competitive Economy, Econometrica
Volume 22, 1954.

Chapter 1 – Adair Turner
16
deepening and financial innovation, making reference to theories of market
completion and allocative efficiency.
The third observation, however, is that at the most general level there is no clear
and always present correlation between the financial intensity of an economy and,
say, the overall rate of economic growth. Carmen Reinhart and Ken Rogoff in their
recent survey of eight centuries of financial folly, crashes and debt defaults (‗This
Time it‘s Different‘) identify the period 1945 to the early 1970‘s as one of
‗financial repression‘ in which the role of the financial system was subdued in many
countries.8 And in some developing countries that ‗financial repression‘ probably
was one among a package of market restrictive policies which hampered economic
growth. But equally there were countries which in that period achieved historically
rapid growth with fairly depressed financial systems (for instance Korea) and in the
more developed economies – the US, Europe, and Japan – this period of financial
repression was one of significant and relatively stable growth, comparing well with
the subsequent 30 years of increased financial activity and financial liberalisation.
To assess the question properly, however, we need to consider specific financial
activities and the economic functions they perform. This section therefore sets out a
detailed description of what has changed, under four headings.
(i) The growth and changing mix of credit intermediation through UK bank balance
sheets over the last 50 years.
(ii) The growth of complex securitisation as a new form of credit intermediation over
the last 10 to 20 years.
(iii) The difficulty to quantify, but vitally important, change in aggregate maturity
transformation, which the first two sets of changes have almost certainly produced.
(iv) And finally the growth of financial trading activity over the last 30 years, linked in
part to complex credit securitisation, but also visible in a far wider range of markets
than credit securities alone.
(i) Growth and changing mix of bank intermediation
First then, trends in bank intermediation. What did UK banks do 50 years ago and
what do they do today: what has changed? Well for data availability reasons my figures
actually start 46 years ago in 1964. Chart 6 shows the balance sheet of the UK banking
8 C Reinhart and K Rogoff, This Time it‟s Different: Eight Centuries of Financial Folly, Princeton,
2009.

Chapter 1 – Adair Turner
17
system in that year, with the quantities expressed as percents of GDP, the aggregate
balance sheet of all UK banks then just 35% of GDP. And one of the things banks then
did was to use deposits from the household sector to fund government debt, with banks
holding large holdings of government debt as part of their liquidity policies, and with the
UK‘s government debt level, at 93.2% of GDP, still reflecting the aftermath of high war
indebtedness. But the other thing the banking and building society sections together did
(Chart 7) was take net funds from the household sector – which deposited 40% of GDP
but borrowed only 14% and lend it to the private, non-financial and corporate sector,
which deposited 8% of GDP but borrowed 13%. In other words, it intermediated net
household savings into business investment.
Over the subsequent 45 years, however, the pattern changed significantly (Chart 8).
Household and unincorporated business borrowing from the banking and building society
sectors grew from about 14% of GDP to 76% of GDP, while deposits grew also, but less
dramatically from 39% to 72%. In addition, however, from the late 1990s, securitisation
made possible loans to the household sector that were not, or not necessarily, held on
bank balance sheets, these reaching 17% of GDP by 2007, the green shaded area on Chart
8.
Meanwhile (Chart 9) a somewhat similar, but more volatile pattern was observed
for the corporate sector. With lending growing from 13% of GDP to 35%, but with
sudden surges and set backs on the path. And with deposits growing from 8% to 17%.
So, putting the two sectors together (Chart 10) we get a growth of total lending far
more dynamic than the growth of deposits, and the emergence on bank and building
society balance sheets (Chart 11) of what is labelled ‗a customer funding gap‘ a
deficiency of customer deposits (household or corporate) versus loans to those sectors.
This funding gap was bridged by increased wholesale funding, including wholesale
funding from abroad, made easier by the fact that by 2007, unlike in 1964, the UK
banking system‘s relationship with the UK real economy (captured on Chart 11) was
within the context of London‘s role as a very large wholesale financial entrepot. Thus the
total balance sheet of the UK banking system, defined to include all legal banking entities
operating in London, had by 2007 reached around 500% of GDP, compared with 34% in
1964, and was dominated not by the banks‘ relationship with UK households and
companies, but by a complex mesh of intra-financial system claims and obligations
(Chart 12).
This funding gap and reliance on wholesale funding created significant
vulnerabilities for the UK banking system which crystallised in 2007 and 2008: and new
liquidity policies are being introduced to reduce such vulnerabilities in future. But it is not
on the important risks and policies related to this funding gap that I wish to comment
here, but on the increase in leverage in both the household and corporate sectors.

Chapter 1 – Adair Turner
18
In both sectors, debt to GDP has increased significantly and in both the leverage has
been focused on financing of real estate assets.
In the household and unincorporated business sector (Chart 13) the increase has
been dominated by mortgage lending, up from 14% to 79% of GDP. Unsecured personal
sector lending has increased from 3% at end 1975 to 9% but is still far less important than
mortgage lending. Lending to unincorporated businesses meanwhile remains trivial in the
big picture.
While in the corporate sector, the dramatic increase in debt to GDP in the last two
decades has been dominated by the commercial real estate sector (Chart 14) with actually
very little increase in the leverage of non commercial real estate related businesses. A
dominance which looks even greater if we look at net lending. Thus if for the last 10
years, we look at gross lending to different corporate sectors (Chart 15) and gross
deposits by different sectors into the banking system (Chart 16), then we can calculate
each sector‘s net deposits to or net lending from the banking sector (Chart 17). What this
illustrates is that the vast majority of net lending to the corporate sector is explained by
lending to commercial real estate with, for instance, manufacturing only a marginal net
borrower from the banking system, and indeed borrowing less in nominal terms than in
1998. While the service sector excluding wholesale and retail, hotels and restaurants is a
net depositor, for understandable reasons given its inherent characteristics.
Summing up, therefore, the striking features of UK banking sector trends over the
last 45 years are:
First, a very significant financial deepening: i.e. an increase in both loans and
deposits as a percent of GDP.
Second, significant increases in the income leverage of both the household and
corporate sectors, i.e. of indebtedness relative to GDP, and thus to income measures
such as household income, corporate profit or property rentals.9
And third, the fact that leverage growth has been dominated by increasing debt
levels secured against assets, and predominantly against residential houses and
commercial real estate.
9 Details of the several different ways of meaning leverage (relative to income or assets) are set out
in the FSA Financial Risk Outlook 2010

Chapter 1 – Adair Turner
19
(ii) The growth of complex securitisation
These changes in the scale and mix of banking intermediation have occurred
gradually since the 1960s, with a strong acceleration after the financial liberalisation of
the 1970s.10
The second overall trend I will highlight – the growth of the complex
securitisation – accrued primarily over the last two decades, though with important initial
developments in the 1970s and 80s.
I use the term ‗complex securitisation‘ to stress the fact that marketable credit
securities had been around for a long time before the securitisation wave of the last 20 to
30 years. These straight-forward credit securities, government bonds and corporate bonds
were non-pooled and non-tranched: each security was the liability of a single government
or corporate; and there was no process for creating multiple credit quality tiers out of the
liabilities of one issuer. But they were credit securities which connected providers of
funds to users of funds in a debt contract form, without the intermediation of a bank
balance sheet. And the markets for these instruments were and are very big, illustrating
the large potential investor base for medium and long term debt contracts (Chart 18). US
debt to government debt to GDP reached 76% in 1945 and is 53% today with $7.5 trillion
dollars of T bonds outstanding. US single name corporate bonds (Chart 19) accounted for
50% of all corporate credit financing even back in the 1950s, and there are now $4.1
trillion dollars of these straight forward single name corporate bonds outstanding.
So securitised credit – i.e. credit extension through purchase of marketable credit
securities rather than through loans on bank balance sheet – is not new. But what
‗complex securitisation‘ did was to extend the potential role of marketable credit
securities to a wider range of final borrowers.
The initial and still most important application of this new technology was in
residential mortgages, with two phases of development.
First (Chart 20), the growth of US agency and Government-Sponsored Enterprise
(GSE) mortgage backed securities from 1971 onwards, initially in a simple pass-
through, non tranched form, but with tranching introduced with the creation of
Collateralised Mortgage Obligations (CMOs) from 1983 on.
Second, the growth of private label (i.e. non-GSE) mortgage backed securities from
the mid 1980s onwards, with these usually using the new technique of tranching.
This growth of mortgage securitisation was then followed, from the late 1980s on,
by the extension of securitisation to other asset categories (Chart 21), in particular
consumer credit and commercial mortgages.
10
In the UK key policy measures were the liberalisation of the domestic banking system via
“Competition and Credit Control” (1971) and the abolition of exchange controls in 1979

Chapter 1 – Adair Turner
20
What in essence this complex securitisation did was to achieve outside a bank
balance sheet two of the functions which, as we saw earlier, a bank balance sheet can
deliver (Chart 22) – pooling of multiple small credit risks, and tranching so that different
providers of funds can hold a variety of different combinations of risk and return. As a
result complex securitisation made it possible to extend the role of credit securities
beyond the sphere of governments and single named corporates. In addition, its advocates
asserted that it delivered efficiency and welfare benefits arising from the fact that
investors could select precisely that combination of risk and return which met their
preferences. A combination which they could then continually and smoothly adjust
through time, not only by buying or selling the underlying credit instruments, but also
through use of the credit derivatives markets (Chart 23) which developed alongside
complex securitisation.
(iii) Increasing aggregate maturity transformation
In addition to choosing their precise desired combination of risk and return,
moreover, it appeared that securitisation enabled investors to enjoy precisely the liquidity
that they desired, given the marketable nature of credit securities. The long-term buy and
hold investor could hold a credit security for its long-term contractual maturity, but the
short-term investor could sell at any time.
Securitisation therefore, by increasing the range of credits which could be
securitised, played a role in what is almost certainly another key feature of the financial
system of the last several decades – an increasing aggregate maturity transformation.
Aggregate maturity transformation is the extent to which the financial sector in total
(eliminating all intra-financial system claims) holds assets which are longer term than
liabilities, and thus is the extent to which the non financial sector is enabled to hold assets
which are shorter term than its liabilities. And it is frustratingly difficult to measure with
any precision the level and trend of aggregate maturity transformation given the
complexity introduced by the large scale of intra-financial system claims.
But the figures for household deposits and lending in the UK (Chart 24) clearly
suggest that a significant increase in aggregate maturity transformation must have
occurred. Loans to the UK household sector have increased dramatically as a percent of
GDP, and these loans are primarily mortgages, with long-term contractual terms, 20 or 30
years or more. Deposits have increased also but these deposits are predominantly short
term, many indeed are instant access. And buffers of highly liquid assets held by banks
have significantly reduced. It therefore must be the case that the UK banking system, and
banking systems in other countries, are performing more aggregate maturity
transformation than in the past, and as a result running greater liquidity risks.

Chapter 1 – Adair Turner
21
In addition, however, to increased maturity transformation on bank balance sheets,
securitisation, combined with other financial innovations, resulted in an increasing level
of maturity transformation off bank balance sheets. SIVs and conduits were major buyers
of contractually long-term credit securities, but were funded by short-term commercial
paper. Mutual funds with on-demand liabilities to investors who believed they enjoyed
deposit like security of capital value, were investing in long-term credit securities, or in
the commercial paper of SIVs and conduits, and thus involved in either one step or two
step maturity transformation processes. And the trading books of commercial investment
banks included large portfolios of contractually long credit securities, funded short term
by repo financing arrangements.
All these new forms of maturity transformation relying crucially on the idea that
‗market liquidity‘ would be available whenever needed. All helping to give investors
more choice in respect to the liquidity of their investments. But all creating new financial
stability risks.
(iv) Increasing trading activity across multiple markets
Fourth and finally in this review of key financial trends, the last 30 years have seen
a quite remarkable explosion in the scale of financial trading activities relative to real
economic variables.
The value of foreign exchange trading has exploded relative to the value of global
GDP or global trade (Chart 25). From 11 times global trade value in 1980 to 73
times today.
The value of oil futures traded has increased from 20% of global physical
production and consumption in 1980, to ten times today (Chart 26).
And interest rate derivatives trading has grown from nil in 1980 to $390 trillion in
mid-2009 (Chart 27).
Summing up, therefore, increasing financial intensity in the UK, US and other
advanced economies over the last 40-50 years, and in particular the last 30, has been
driven by the following factors.
Increased leverage of non financial sectors, in particular driven by increased
lending against real estate assets, both residential and commercial.
The growth of complex securitisation, which has in particular supported more
residential mortgage lending.
An increased level of aggregate maturity transformation.
Increased trading activity and market liquidity.

Chapter 1 – Adair Turner
22
And, as a result of these other trends, an increase in the scale and complexity of
intra-financial system claims, claims between financial institutions rather than
between them and the real economy.
The crucial question is whether this increase in financial activity has delivered
human welfare benefits and if so how:
Via the direct welfare benefits of more effective consumption smoothing?
Or via improved allocation of capital?
Or via increased savings rates and growth rates?
Or via optimal savings rates and growth rates, even if not necessarily increased
rates?
3. Bank credit extension: optimal role and mix
The development of the modern market economy over the last 200 years has been
accompanied by a pervasive development of banking systems, performing the first three
functions outlined in Section 1 – pooling of risks, maturity transformation, and risk return
transformation via the introduction of an intermediating equity slice. As a result
depositors enjoy high certainty of capital value combined with short contractual maturity:
equity fund providers take much greater risk, but with that risk still bounded by limited
liability.
So fundamental and pervasive are these features of banking systems within market
economies, that there is a tendency to think that they are inherent and inevitable. In fact,
however, there have always been economists concerned that these features create market
instability: Irving Fisher and Milton Friedman warned against the dangers of a classic
fractional reserve banking model: and in the last year Professor John Kay in Britain and
Professor Laurence Koltikoff in the US have produced ‗narrow bank‘ or ‗limited purpose
bank‘ proposals which would completely reject the model in which short-term deposits of
certain value can, via transformation, fund risky household and commercial loans.11
I am not going to argue in this chapter for either of those radical change models.
Indeed I believe that Professor Kay‘s and Professor Koltikoff‘s proposals would not
effectively address the fundamental problem we face – which is volatility in the supply of
11
L Kotlikoff, Jimmy Stewart is Dead: Ending the World‟s Ongoing Financial Plague with Limited
Purpose Banking, Wiley 2010. J Kay, Narrow Banking, The Reform of Banking Regulation, CFSI, 2009

Chapter 1 – Adair Turner
23
credit to the real economy, and biases in the sectoral mix of that credit. A volatility and
bias which, as I shall describe in Section 4, can occur as much in a non-bank securitised
form of credit extension as when credit is extended on balance sheet. But the fact that
there are respected economists arguing that the entire structure of banking is inappropriate
does mean that we need to go back to the basics of whether and why and under what
circumstances banks as we currently know them add value to the real economy.
A classic statement of how fractional reserve banking adds value was set out in
Walter Bagehot‘s Lombard Street. He argued that banking enabled the mobilisation of
savings, that, for instance, Britain enjoyed an economic advantage over France because
the UK‘s more advanced banking system fostered the productive investment of savings
rather than leaving them ‗dormant‘: „Much more cash‟ – he wrote – „exists out of banks in
France and Germany and in the non-banking countries than can be found in England or
Scotland, where banking is developed. But this money is not… attainable… the English
money is “borrowable money”. Our people are bolder in dealing with their money than
any continental nation… and the mere fact that their money is deposited in a bank makes
it attainable. A place like Lombard Street where in all but the rarest times money can be
obtained on good security or upon decent proposals of probable gain is a luxury which no
other country has ever enjoyed before‘.
Bagehot‘s argument rests essentially on the positive benefits of the transformation
functions considered in Section 1, with the pooling, maturity and risk/return
transformation functions of Britain‘s banking system enabling individuals with secure
liquid deposits to finance trade and investment through loans to borrowers with whom
they had no direct contact, and whose liabilities were of longer term; while in France,
with a less developed banking system, the capital formation process depended to a greater
extent on the creation of precise matches – people with money who happened also to have
entrepreneurial and management capability, or who could make direct contracts with
specific businesses.
Bagehot‘s initial insight is reflected in the predominant belief that ‗financial
deepening‘ is good for an economy: that more financial intermediation, measured by
credit as a % GDP, will mean higher investment and thus higher GDP. And a number of
studies have indeed illustrated either cross-sectoral or time serves correlations between
the development of basic banking and financial systems and economic growth.12
And
from the current position of a developing nation like, say India, the positive benefits of
some financial deepening do seem clear. But the paper by Moritz Schularick and Alan
Taylor which I quoted earlier, questions whether this positive relationship pertains as
economies move beyond the level of financial maturity reached in the advanced countries
12
See , e.g. I.R.G.King and R.Levine Finance and growth: Schumpeter might be right, Quarterly
Journal of Economics‖ 1993 , or Rouseeau and Sylla, Emerging Financial Markets and Early US Growth,
NBER WP 7448

Chapter 1 – Adair Turner
24
30 to 40 years ago. It documents the growth of leverage and credit extension which
liberalisation and innovation have facilitated, but finds little support for the preposition
that this liberalisation and innovation has led to a corresponding increase in real growth
rates for the countries in their sample.
It is on this question of financial deepening beyond the level reached in the
advanced countries 30 to 40 years ago that I will focus here. And in doing so I will focus
solely on what one might label the long term comparative statics issue, not the issue of
transitional dynamics.
By long-term comparative statics I mean the question, would the UK, for instance,
be better or worse off if in, say 2025, we had a debt to GDP of 120%, or 100% or
80%. Or indeed would we be better or worse off if today we had 80% debt, with
debt never having grown to today‘s level of 125%? To answer that question we
need to consider the impact of credit on the long-term savings rate and the
efficiency of capital allocation and thus on the long-term productive potential of the
economy: and we also need to consider the direct welfare benefits which credit can
deliver through life cycle consumption smoothing.
The transitional dynamics question, by contrast, is quite different. It accepts as a
necessary given that we start with private debt to GDP of 125% and asks what is the
optimal evolution of this level over the medium term, say the next five years. To
answer that question we need to consider the implications of changes in credit
supply for aggregate nominal demand, and thus for the path of actual GDP (and
employment) relative to productive potential.
We need to know the answers to both questions, and the answers might well pose a
policy timing dilemma, with de-leveraging beneficial over the long term, but harmful
over the short. And both questions are highly relevant to the design of the new capital and
liquidity regulatory regime on which the global institutions – the Financial Stability
Board and the Basel Committee – are engaged this year. Higher capital and liquidity
requirements together will probably mean less plentiful credit supply. The newly
established Macroeconomic Assessment Group jointly established by the Bank of
International Settlements (BIS) and the Financial Stability Board (FSB), will therefore
need to consider both the long term and the transitional implementations of such
restriction. For now, however, I will focus solely on the long-term question.
And I will begin by assuming that higher capital and liquidity requirements will
increase the cost of credit intermediation and thus increase the price and/or decrease the
quantitative supply of credit. I say ‗assume‘ because at least in respect to higher capital
requirements there is a theoretical debate. If, for instance, the propositions of Modigliani
and Miller hold, higher equity capital requirements ought to produce a lower cost of bank

Chapter 1 – Adair Turner
25
equity and a lower cost of bank debt (since the riskiness of both would reduce), and in a
taxless world those effects would fully offset the higher proportionate role for relatively
more expensive equity.13
In the real world of tax biases in favour of debt, however, there
clearly is a private cost penalty to higher equity requirements, and the case that tighter
liquidity requirements increase the cost of long-term credit provision appears fairly clear.
So assuming that higher capital and liquidity requirements do mean more expensive
and less plentiful credit supply, what economic consequences follow?
A common and apparently obvious answer assumes that a higher cost of credit and
more restricted supply of credit will mean that capital investment will be reduced as
productive investments go unfinanced. The assumed model here is that of a marginal
efficiency of capital schedule (Chart 28) with possible investment projects ranked by
order of return, and with the level of investment in the economy, the number of projects
which get financed, determined by how many deliver a return higher than the cost of
capital. Increase the cost of credit intermediation and fewer projects will be financed.
Under this model it can still be socially optimal to raise capital requirements since
the impact of increased credit intermediation costs in good years can be offset by a
decreased risk of financial crises. Models which assume that this is the balance to be
struck, such as the NIESR model which the FSA has been using to consider the tradeoffs
involved in the setting of new capital liquidity requirements, can still suggest that
significant increases in capital and liquidity requirements are socially optimal.14
But such
models still assume that increased bank capital means decreased investment and thus
reduced growth in good times. And this is the quite explicit assumption behind much
private sector input to the regulatory debate.
What I would like to question, however, is whether this model of the impact of
credit supply constraint is actually relevant to all, or indeed more than a small proportion,
of the total credit supply described in my earlier charts. Consider for instance, the growth
of UK mortgage credit, which has gone over the last 45 years from 14% to 79% of GDP.
Obviously to some extent, mortgage credit indirectly helps finance new investment in
housing. But over the last 50 years capital investment in UK housing as a percentage of
GDP (Chart 29) has oscillated but with no particular trend. And the net capital stock of
investment in residential housing measured as accumulated past investment minus
depreciation has as a result not risen as a percentage of GDP (Chart 30). Instead what we
13
Miller M and Modigliani F: “The Cost of Capital, Corporation, Finance and the Theory of
Investment”, American Finances Review 1958, 48.3, pp 261-297 – “Corporate Income Taxes and the Cost
of Capital: A Correction”, American Economics Review, 53.3, 1963, pp 443-453 14
See FSA Turner Review Conference Discussion Paper, October 2009, for a description of the
modelling approach using the NIESR model. Note that the NIESR model does distinguish the impact of
credit restrictions on the corporate versus household sector, but does not distinguish within the corporate
sector between different categories of credit (eg, commercial real estate versus all others) in the way
considered later in this section.

Chapter 1 – Adair Turner
26
have is phenomenon in which mortgage debt as a percent of GDP and the market value of
housing, have risen in a fashion largely detached from the processes of capital
investment.15
Which does not, I must immediately stress, mean that mortgage finance has no
economic or social value but rather that in countries with relatively stable populations and
with large housing stocks inherited from the past, the economic function of mortgage
finance is only to a very limited extent related to the financing of new investment, and to
a very large extent supporting the ability of individuals to smooth consumption over the
life cycle, with younger generations buying houses off the older generation who already
own them.16
The extent to which this is the case varies with national characteristics such
as the density of population and the growth rate of the population (or of household
numbers) but it is as least possible to imagine an economy which was making no new net
investment in housing but which had a high and rising level of mortgage debt to GDP.
An assumed model in which an increased cost of credit intermediation would curtail
investment and thus growth, is therefore largely irrelevant to residential mortgage debt in
the UK, and thus for 63% of all bank lending. Instead, when we think about the value
added of different levels of mortgage debt, the trade-off is follows.
A plentiful supply of residential mortgage debt will increase human welfare by
enabling individuals to smooth the consumption of housing services through their
life cycle. It enables the individual without inherited resources to use future income
prospects to purchase houses today. And it lubricates a process by which one
generation first accumulates housing assets and then sells them to the next
generation, achieving an inter-generational resource transfer equivalent to a pension
system. A more restricted supply of mortgage finance makes access to home
ownership more dependent on the vagaries of inheritance, and tends to produce an
inefficient use of housing resources, with older people facing few incentives to
trade down from large houses and to release housing resources for use by the
younger generation.
Conversely, however, the easy availability of mortgage credit can generate a
credit/asset price cycle, and can encourage households on average to select levels of
income leverage which, while sustainable in good and steady economic times,
increase vulnerability to employment or income shocks. It can therefore create
15
The difference between the market value of housing and the net capital stock illustrated on is to a
significant extent explained by land values. Mortgage credit in a rich densely populated but stable
population country is therefore to a very significant extent financing the purchase of a fixed supply of land
by one generation from another. 16
The key element of consumption which is smoothed is the flow of housing services which
ownership of a house delivers.

Chapter 1 – Adair Turner
27
macroeconomic volatility. And it can tempt some individuals, in pursuit of
prospective capital gain, into debt contracts which harm their individual welfare
rather than maximise it.
There are therefore very important advantages and risks created by extensive
mortgage credit supply, which need to be taken into account in decisions about bank
capital and liquidity (or any other policy levers which might impact on credit supply). But
the optimal resolution of this balance has no necessary implications either way for the
overall level of investment and growth in the economy, on which discussions of the
impact of capital adequacy regimes frequently focus.
Similar considerations may apply when thinking about some sub-sets of corporate
lending, and in particular lending to the corporate real estate sector, which has grown so
dramatically in the last 20 years as a percentage of GDP and as a share of total corporate
lending.
And here again I definitely do not suggest that all lending to commercial real estate
is somehow socially useless, and that, as it were ‗real bankers only lend money to
manufacturing companies‘. In a mature economy indeed, high quality investment in
commercial real estate – high quality hotels, office space and retail parks – and the related
investment in the public urban environment, is definitely part of the wealth creation
process. Fixed capital formation in buildings and structures at around 6% of GDP is now
slightly higher than total investment in all plant, machinery, vehicles, ships and aircraft,
and that may well be what we should expect in a mature rich economy (Chart 31).
But note that it was just as high as a percentage of GDP in 1964, when total lending
to real estate developers was much lower.
Which suggests that alongside the role which lending to commercial real estate
plays in financing new productive real estate investment, what much CRE lending does is
to enable investors to leverage their purchase of already existing assets, enjoying as a
result the tax benefit of interest deductibility, often in the expectation of medium-term
capital gain, and in some cases exploiting the put option of limited liability.
Thus in both residential and commercial real estate lending, the model in which we
assume that more expensive credit would restrict productive investment is only partially
applicable. In both, moreover, we need also to recognise the role that credit can play in
driving asset price cycles which in turn drive credit supply in a self-reinforcing and
potentially destabilising process. Thus, (Chart 32) increased credit extended to
commercial real estate developers can drive up the price of buildings whose supply is
inelastic, or of land whose supply is wholly fixed. Increased asset prices in turn drive
expectations of further price increases which drive demand for credit: but they also
improve bank profits, bank capital bases, and lending officer confidence, generating

Chapter 1 – Adair Turner
28
favourable assessments of credit risk and an increased supply of credit to meet the extra
demand.
So that overall as we look at the drivers and economic functions of credit, we must I
believe distinguish between different categories (Chart 33), which have different
economic functions and whose dynamics are driven by different factors. Household
credit, 74% of the total, is essentially about life cycle consumption smoothing and inter-
generational resource transfer not productive investment. Real estate lending, which
combining household and commercial real estate, amounts to over 75% of all lending in
the UK, is at times strongly driven by expectations of asset appreciation. Commercial real
estate and indeed leveraged buy out borrowing has quite a lot to do with exploiting the tax
shield of debt and the put option of limited liability. Only lending to non-real estate
companies therefore appears to accord fully with the commonly assumed model in which
credit finances investment and trade and is serviced out of capital flows, and in which a
higher cost of credit will curtail productive investment. But in the UK at least such
lending accounts for a relatively small proportion of the total (Chart 34).
In deciding optimal levels of capital and liquidity for the banking system we
therefore need to consider the possible impact on different categories of lending whose
economic value or direct welfare benefit is quite different. We also need to recognise,
however, that the elasticity of response of different categories of credit to interest rate
changes is likely to be hugely varied and to vary over time in the light of changing
expectations of future asset prices.
The company which is thinking of investing in a new project – be it a new
manufacturing product development, a new energy investment, or a new retailing
concept – and intending to repay the loan out of project cash flows, may be very
sensitive to minor variations in expected interest rates. So also to a less but still
significant extent might be the individual using unsecured credit to smooth short-
term cash flows.
But when expectations of property (or other asset) price inflation have become
strongly embedded, even quite large increases in interest rate may have little short-
term impact – to the homeowner or commercial real estate investor who expects
medium-term capital appreciation of say 15% per annum, small increases in lending
rates may make little difference to their propensity to borrow.
There is therefore a danger that at some points in the credit/asset cycle appropriate
actions to offset the economic and financial stability dangers of exuberant lending will
tend to crowd out that element of lending which is indeed related to the funding of
marginal productive investments.

Chapter 1 – Adair Turner
29
This in turn carries implications for optimal policy. The analysis presented in this
section suggests three conclusions.
First, that we cannot base our assessment of optimal capital and liquidity levels
solely on the ‗marginal productive investment‘ model, but that we do need to
understand what impact higher capital requirements would have on fixed capital
investment.
Second, that optimal policy almost certainly needs to distinguish between different
categories of credit, which perform different economic functions and whose interest
rate elasticity of demand is likely, at least at some points in the cycle, to vary
hugely.
And third that optimal policy needs to be able to lean against credit and asset price
cycles.
These conclusions together suggest the need for macro-prudential through-the-cycle
tools, and perhaps for those tools to be differentiated in their sectoral application.17
We
need new tools to take away the punch bowl before the party gets out of hand. Four
approaches could be considered:
The first is for interest rate policy to take account of credit/asset price cycles as well
as consumer price inflation. But that option has three disadvantages: that the interest
elasticity of response is likely to be widely different by sector – non-commercial
real estate SMEs hurting long before a real estate boom is slowed down: that higher
interest rates can drive exchange rate appreciation: and that any divergence from
current monetary policy objectives would dilute the clarity of the commitment to
price stability.
The second would be across the board countercyclical capital adequacy
requirements, increasing capital requirements in the boom years, on either a hired-
wired or discretionary basis. But that too suffers from the challenge of variable
elasticity effects, given that capital levers also work via their impact on the price of
credit.
The third would be countercyclical capital requirements varied by sector, increased
say against commercial real estate lending but not against other categories. That
certainly has attractions, but might be somewhat undermined by international
competition, particular within a European single market. If, for instance, Ireland had
increased capital requirements for commercial real estate lending counter-cyclically
in the years before 2008, the constraint on its own banks would have been partially
offset by increased lending from British or other foreign competitors.
17
The case for such tools and the complexities involved in their application are discussed in the
Bank of England discussion paper “The Role of Macro Prudential Policy”, November 2009.

Chapter 1 – Adair Turner
30
The fourth would entail direct borrower focussed policies, such as maximum limits
on loan-to-value ratios, for instance, either applied continuously or varied through
the cycle.18
There are no easy answers here, but some combination of new macro-prudential
tools is likely to be required. And a crucial starting point in designing them is to recognise
that different categories of credit perform different economic functions and that the
impact of credit restrictions on economic value added and social welfare will vary
according to which category of credit is restricted.
4. Complex securitised credit:
reducing or increasing risk?
The growth of complex securitised credit was discussed in Section 3 (ii) and its role
in driving increased maturity transformation was discussed in Section 3 (iii). It played a
major role in the 2008 crisis. It was not the sole driver of that crisis: the rapid expansion
of poor quality on-balance sheet lending, financed by wholesale funding, was also
important. And securitisation and related trading played no significant role in some of the
biggest individual bank failures; it was, for instance, irrelevant to HBOS‘s over expansion
into commercial real estate. But clearly securitisation was an important part of the story,
complex securitisation supported an explosion of low quality mortgage credit origination
in the US and new forms of off-bank balance sheet maturity transformation created major
new risks. And excessive complexity created problems of intransparency, imperfectly
understood risks, and confidence and contagion effects driven by uncertainties over the
value of ‗toxic assets‘.
Before the crisis, however, securitisation and the associated growth of credit and
other derivatives were widely lauded as favourable developments, improving investor and
borrower choice, economic efficiency and risk management. In the wake of the crisis we
should therefore ask:
Whether the positive benefits attributed to securitisation and credit derivatives were
or could be significant.
And whether the risks which complex securitisation helped generate are inherent to
the provision of credit in a securitised form, or arose simply because of bad features
18
Note that while national borrower focussed limits are also susceptible to cross-border leakage
problems (eg, through the use of legal entities in other countries) these problems are least in respect to
lending secured against real estate, given the immovable nature of property, and the potential to design
restrictions on the level of debt which can be secured against specific properties.
Chapter 1 – Adair Turner
31
of the pre-crisis securitisation, features we can fix via better regulation or market
practice.
Four related arguments were advanced in favour of credit securitisation.
First that it enabled banks better to manage their balance sheet risks.19
Rather than
say, a regional bank in the US holding an undiversified portfolio of credit exposures
in its region, it could instead originate loans and distribute them, it could hedge
credit exposure via credit derivatives and interest rate exposure via interest rate
derivatives. In some past banking crisis – such as the US banking system collapse
of the early 1930s, or the savings and loans crisis of the 1980s – the problems were
in part the undiversified nature of specific bank exposures, or the lack of
instruments to separate credit risk exposure from interest rate mis-match.
Securitisation appeared to fix these problems.
Second, it was argued that complex securitisation achieved market completion, with
pooling, tranching and marketability enabling each investor to hold precisely that
combination of risk/return/liquidity which best met their preferences. It was
assumed by axiom that this must in some way be good – either, presumably, in a
direct welfare sense, or because it enabled the attainment of a higher, or at least an
optimal savings rate.
Third, and as a result, it was asserted that securitisation not only made individual
banks less risky, but the whole system more stable, because risk was dispersed into
the hands of precisely those investors best suited to manage different combinations
of risk.
Fourth, it was argued that securitisation supported increased credit supply. Complex
securitisation of sub-prime mortgage credit in the US was valuable because it
enabled new classes of borrower to enjoy the benefits of life-cycle consumption
smoothing, and the use of Credit Default Swaps (CDS) was beneficial because it
enabled banks to better manage credit risk, economising on the use of bank capital
and enabling them to extend more credit off any given capital base.20
Obviously something went badly wrong with this rosy vision, and in particular with
the proposition that complex securitisation would reduce individual bank and system
wide risks. And the easy thing, with the benefit of hindsight, is to list the specific features
of pre-crisis securitisation which created major risk.
19
See eg, Lowell Bryan, “Breaking up the Bank”, 1988 20
In the pre-crisis years, ―using bank capital more efficiently‖ (i.e. being able to support more
lending on any given level of bank capital) was perceived as not only a rational private objective for
individual banks, but as a valuable social objective. Thus the Basel II capital adequacy regime was designed
around the overt principle that if banks could develop more sophisticated risk management systems, they
should be allowed to operate with higher leverage.

Chapter 1 – Adair Turner
32
Inadequacies in credit ratings, as rating agencies with conflicts of interest were
tempted into putting ratings on securities for which no sound rating methodology
existed.
Poor incentives for good underwriting: originators and traders who cared little
whether the credit was good as long as they could sell it before any problems arose.
Over complexity – particularly in the final decade before the crisis, with a
proliferation of the alphabet soup of ever more exotic re-securitisations, such as
CPDO‘s and CDO squareds, combined with a general lack of transparency about
underlying credit quality.
Poorly understood embedded options – again particularly a problem in the most
complex products which emerged in the final decade.
And far too low capital requirements against the holding of credit securities in
trading books, creating massive capital arbitrage opportunities, and resulting in a
model of securitised credit which was called ‗originate and distribute‘, but which
was actually ‗originate, distribute, and then acquire somebody else‘s credit
securities‘, so that when the music stopped the biggest losses actually arose on the
balance sheets of banks and investment banks.21
In response to this list of now obvious problems, an extensive regulatory reform
programme is in hand, involving:
Regulation of credit rating agencies to guard against conflicts of interest.
Various forms of risk retention requirements to ensure that credit originators have
‗skin-in-the-game‘.
Requirements for better disclosure of underlying risk.
And a radical reform of trading book capital. The Basel Committee has already
announced specific changes, for implementation by 2011, which will increase
capital requirements against specific trading activities several times, and a
fundamental review of all trading book capital requirements will be completed over
the next 12 months.
Alongside these regulatory responses meanwhile, a market reaction (‗once bitten
twice shy‘ as it were) is likely in itself to mean that when securitised credit returns it does
so without some of the past excesses. The market place is likely to demand simple and
21
See eg, the estimates of the incidence of losses set out in the IMF‘s Global Financial Stability
Report of October 2008.
Chapter 1 – Adair Turner
33
transparent structures: and, even if regulators allowed it, to have no appetite for the hyper
complex instruments of the final stage of pre-crisis exuberance.
So the regulators and the market together have a clear view of past problems: and I
think we will fix them. But what we do not know is whether fixing these problems means
that complex securitisation bounces back in a new less risky form, or whether it never
returns, or at least not on anything like the same scale. Because what is not clear is how
far previous market volumes were only possible because of intrinsically risky practices.
So beyond the immediate agenda of obvious things we should do and are doing, two
questions remain:
Did complex securitisation deliver economic value?
And were the risks it generated fixable or inherent?
(i) Securitisation and related derivatives: What economic value
added?
Let‘s consider the ‗economic value added‘ case for securitisation under three
headings.
The first is market completion, the idea that complex securitisation and derivatives
must have delivered value added because they completed markets, making possible
particular contracts not previously available, and thus allowing investors to pick
precisely that combination of risk, return and liquidity which best met their
preferences. In theory these benefits of ‗market completion‘ follow axiomatically
from the Arrow Debreu theorem, and in the pre-crisis years many regulators, and
certainly the FSA, were highly susceptible to this argument by axiom. We were
philosophically inclined to accept that if innovation created new markets and
products that must be beneficial and that if regulation stymied innovation that must
be bad. We are now more aware of the instability risks which might offset the
benefits of such innovation. But we also need to question how big the benefits could
possibly have been, even if securitisation had not brought with it risks of instability.
And here two perspectives are important.
- The first is that to the extent that complex structuring was driven by either tax or
capital arbitrage, reducing tax payments or reducing capital requirements without
reducing inherent risk, then it clearly falls in the category of the ‗socially
useless‘ (i.e. delivering no economic value at the collective social level) even if
it generated private return. And a non-trivial proportion of complex
securitisation was indeed driven by tax and capital arbitrage.

Chapter 1 – Adair Turner
34
- Second, that while there clearly is an economic value in market completion, it
must be subject to diminishing marginal return. That beyond some point, the
additional welfare benefit of providing ever more tailored combinations of risk,
return and liquidity must become minimal.
Together these two perspectives argue for a far greater scepticism about market
completion arguments in future than was common pre-crisis.
As for the second argument, that complex securitisation made possible increased
credit extension, that is undoubtedly true. In the US, the UK and several other
markets, securitisation of residential mortgages made possible the extension of
mortgage credit to segments of the population previously excluded from credit
access. But whether or not that was truly beneficial, takes us back to precisely the
considerations about the economic function and value of credit which I discussed in
Section 3, and to the different functions that different categories of credit perform.
And just as with on balance sheet mortgage credit extension, so with securitised
mortgage credit, the key issues are the extent to which the increased life cycle
consumption smoothing made possible was socially beneficial, and the extent to
which increased supply of credit drove asset prices in a volatile cycle, rather than
the extent to which more credit enabled marginal productive investment. Even from
a direct consumer welfare point of view, let alone from a macro volatility point of
view, it is clear that much of the extension of credit to new categories of borrowers
which was made possible by mortgage securitisation in the US, and to a degree in
the UK, was harmful rather than beneficial to the individuals concerned.22
23
Third and finally, the arguments relating to better risk management, both at the
individual firm level and at the system level. Given how spectacularly the system
blew up, it might seem obvious that this is the least convincing of the arguments for
complex securitisation. But in principle, and providing securitisation was done well
and distribution truly achieved, this might be the most convincing of the three
arguments put forward. In principle it would be better if small and mid-size banks
did not hold undiversified credit exposure to particular sectors or regions and the
use of credit default swaps to enable banks to adjust and diversify their credit risks
22
The FSA‘s Mortgage Market Review, October 2009, describes for instance how securitised
lending in the UK, extended credit to new categories of previously excluded borrower, but also the extent to
which arrears and repossessions are concentrated in these sectors. 23
The high credit losses incurred on US sub-prime and Alt-A lending ultimately derive from the fact
that the individuals concerned did not have the income levels to sustain the debt they took on, which could
only have been made affordable via further house price appreciation. This illustrates that while the
extension of credit to previously excluded sectors can enhance welfare by making possible consumption
smoothing, it cannot in a sustainable and non-risky way increase the lifetime earnings/consumption which
are being smoothed. If customers are excluded from credit access because their lifetimes earnings prospects
are low, the extension of credit cannot overcome and could make worse problems which can only be
addressed through income enhancement or redistribution.

Chapter 1 – Adair Turner
35
can have an economic value. As a result, securitised credit and credit derivatives
probably will and should play a significant role in the financial system of the future.
But recognising that fact should not lead us to fall into the trap of believing that
ever more complex innovation is beneficial because it completes more markets, or
that an increased aggregate supply of credit is a valid argument in favour of
innovation and light regulation.
(ii) Risks in the securitised credit model: fixable or inherent?
As discussed above, pre-crisis complex securitisation was made risky by a number
of apparently fixable problems. But risks were also created by two more fundamental
factors, which together imply that securitisation is unlikely to return on the scale which
existed pre-crisis, and that new tools for macro prudential management of the credit cycle
– discussed in Section 3 – are as relevant to securitised credit as to on balance sheet
credit.
Maturity transformation – The first of these fundamental factors is maturity
transformation. As discussed in Section 2 (iii) investor demand for securitised credit was
supported before the crisis by new forms of maturity transformation, contributing to the
increase in aggregate maturity transformation which made the financial system more
vulnerable to shocks. SIVs and conduits bought contractually long securities funded with
short-term commercial paper; mutual funds with very short-term liabilities bought either
long-term securities or the commercial paper of SIVs and conduits; and banks and
investment banks financed large trading book securities portfolios with repo finance. The
proportion of the securitised credit investor base which was only present because of these
unsafe forms of maturity transformation is difficult to quantify, but it may have
constituted more than half of the total, and it is these sources of demand which collapsed
most precipitously during the crisis (Chart 35). While the origination and distribution of
pooled and tranched securities are likely to play a significant role in the future system, it
will likely be a much smaller role than existed pre-crisis.24
Securitised credit, self-referential pricing and instability – The second
fundamental issue is whether a financial system in which securitised credit plays a greater
proportionate role is likely to be one in which the volatility of the credit and asset price
cycle described in Section 3 is still more severe. Securitisation is certainly not the only
cause of credit cycles: purely bank-based credit systems can and have generated self-
reinforcing credit and asset price upswings of the sort described on Chart 32, followed by
24
Note that this fact is highly pertinent to the ―transitional dynamics‖ issue which this chapter does
not consider but which is extremely important. In a long term comparative static sense, the disappearance of
securitised credit extension based on unsafe maturity transformation may be strongly positive: but over the
medium term, the likelihood that securitised credit markets will not return to their pre-crisis scale, makes
still more acute the issues of transition management in implementing new capital and liquidity requirements
which will restrict on-balance credit extension.

Chapter 1 – Adair Turner
36
credit crunches when the cycles swing into reverse. There have been many past banking
crises in systems where securitised credit played an insignificant role.25
But a pervasive role for securitised credit can further increase the potential for
volatility by increasing the extent to which credit-risk assessment and credit pricing
becomes self-referential, with credit security investors and bank loan officers deriving
their assessment of an appropriate price for credit not from independent analysis of credit
risks but from the observable market price. Thus for instance the International Monetary
Fund (IMF) Global Financial Stability Review of April 2006 noted that credit derivatives
‗enhance the transparency of the market‘s collective view of credit risks… (and thus)…
provide valuable information about broad credit conditions and increasingly set the
marginal price of credit‘. But a marginal price of credit set by a liquid market in credit
derivatives is only economically valuable if we believe, as per the efficient market
hypotheses, that ‗the market‘s collective view of credit risks‘ is by definition a correct
one. If instead we note the movement in the CDS spreads for major banks shown on
Chart 36, with spreads falling relentlessly to reach a historic low in early summer 2007,
and providing no forewarning at all of impending financial disaster, we should be worried
that an increased reliance on market price information to set the marginal price of credit,
could itself be a source of credit and asset price volatility, particularly when combined
with mark-to-market accounting.
A credit system which combines both maturity transforming banks and a significant
role for traded credit securities could therefore be even more susceptible to self-
reinforcing exuberant upswings and subsequent downswings than a pure bank system
(Chart 37).
With mark-to-market profits reinforcing management‘s, investors‘ and traders‘
confidence and animal spirits, and swelling bank capital bases and thus supporting
more trading or more lending.
And with the link from high asset prices to favourable credit assessments now hard
wired into the system, as high asset prices drive higher credit securities prices and
lower spreads, which are then used to set the marginal price of credit.
A set of self reinforcing cycles clearly evident in the years running up to the crisis:
reversing into the self-reinforcing downward spiral of confidence and credit
extension which has caused such economic harm.
25
For instance the US savings and loans crisis of the 1980‘s, and the Japanese and Swedish banking
crises of the 1990s.
Chapter 1 – Adair Turner
37
The reasons why the latest financial crisis was so severe may therefore have been
rooted in the interaction between the specific characteristics of maturity transforming
banks and those of a securitised credit system.
Two implications follow. First, that the emergence of a global credit supply system
which combines bank balance sheet and securitised elements has increased the
importance of macro-prudential tools. Second, that in considering the design of new
macro-prudential tools to address the volatility of the credit cycle, we need to consider the
potential volatility of securitised credit extension as well as on balance sheet credit. Tools
which solely address on-balance sheet credit, such as variations in capital requirements
against particular categories of credit, might be undermined if over exuberant credit
supply simply migrates to an off-balance sheet form. This might, along with the cross
border competition factors already noted, imply the need to consider borrower focused
restraints (e.g., maximum Loan-to-Values (LTVs)) rather than concentrating solely on
lender focus credit supply.
Summing up therefore on complex securitisation and related credit derivatives
markets:
It seems highly likely that securitisation will continue to play a significant role in
the credit intermediation process, and with appropriate regulation and market
discipline, could perform a socially useful function of enabling improved risk
management.
But the pre-crisis ideology that ‗market completion‘ arguments justified ever more
complex innovation, which regulators should never impede, ignored the fact that
returns from market completion must be subject to diminishing marginal returns,
ignored the extent to which much innovation was based on tax and capital arbitrage,
and ignored the risks which complexity created.
And the fact that a considerable proportion of investor demand relied crucially on
risky maturity transformation, means that securitisation‘s role in future is likely to
be more limited than in the past.
Finally and crucially, a system of securitised credit interacting with a system of
maturity transforming banks can further increase the risks of self-reinforcing credit
and asset priced cycles and therefore further increase the case for new macro
prudential tools.

Chapter 1 – Adair Turner
38
5. Market making and position taking:
valuable up to a point?
One of the functions which banks and investment banks perform in the market for
credit securities and credit derivatives is to trade and thus provide liquidity, enabling end
investors and other market users to buy and sell at reasonably low bid-offer spreads. That
activity is one among many trading activities in which banks have been increasingly
involved, with, as shown in Section 3(iv), an explosion over the last 30 years in the
volume of trading activity relative to real economic variables.
What value did this explosion of trading actually deliver: how valuable is the
liquidity which position-taking, or as some would label it, speculation, makes possible?
The question is a politically sensitive one, because market making and proprietary
trading to support it are at times highly profitable for firms and for individuals. Lending
officers guilty of lending badly to commercial real estate firms in an irrationally
exuberant upswing may have been overpaid relative to the economic value added of their
activity for society, but it is not in that area of financial services but within the trading
rooms of banks, investment banks and hedge funds that remuneration sometimes reaches
levels which to the ordinary citizen are simply bewildering. There is therefore strong
popular support for measures to curtail either trading volume or the profits derived from
it, whether by direct regulation of trading room bonuses, ‗Volcker rule limits on
commercial banks‘ involvement in proprietary trading, or financial transaction taxes such
as that proposed by James Tobin.
The high profitability of market making and proprietary trading – to the firms and
to individuals – reflects two facts: first that end customers appear to place great value on
market liquidity; second that market makers with large market share and high skills are
able to use their knowledge of underlying order flow and of interconnections between
different traded markets to make position taking and complex arbitrage profits.26
And the fact that end customers greatly value liquidity is in turn taken by the
proponents of ever more active trading as proof that more trading and more liquidity must
be socially valuable as well as privately profitable. The dominant ideology of financial
26
The proponents of separating ‗casino‘ banking from commercial banking often argue in support
that proprietary trading activity and market making is only profitable because risk taking is cross-subsidised
by ―Too Big To Fail‖ status and a significant tax payer guarantee. It is notable however that some of the
most profitable market making activities, either at all times (eg, spot and FX) or at particular times
(government bonds during 2009) are actually relatively low risk, and have very rarely resulted in losses
which have harmed individual bank solvency or total system stability. Several market making functions
appear to deliver super normal returns even when fully risk adjusted.

Chapter 1 – Adair Turner
39
liberalisation and innovation, has therefore argued that increased liquidity is wholly
beneficial in all markets for five reasons.
Increased liquidity enables end customers to trade at low bid offer spreads and in
large amounts: for any given scale of activity this decreases their costs.
If faced with this lower cost per transaction, customers transact more and therefore
provide more net revenues to the market makers and professional position takers,
that must be because they derive value from it.
Liquidity indeed is directly valuable because – in the classic argument of market
completion – it provides investors with a wider set of options, in this case the option
to sell whenever they want.
And liquidity creates value by ensuring efficient ‗price discovery‘, with a wider set
of market participants able to contribute to the collective judgement of the rational
market and with correct prices driving allocative efficiency.
Finally, these benefits of liquidity are likely to be accompanied by reduced
volatility, since liquidity is in part created by professional position takers who spot
divergences of prices from rational levels and by their speculation correct these
divergences.
These arguments reflect the dominant conventional wisdom of the last several
decades based on the assumptions of rational expectations and of efficient and self-
equilibriating markets. And they have been frequently and effectively deployed to argue
against regulations which might limit trading activity. And some of these arguments are
compelling, up to a point – reduced bid offer spreads on forward Foreign Exchange (FX),
must for instance have delivered value to exporters and importers.
But Keynes believed that ‗of the maxims of orthodox finance, none surely, is more
anti-social than the fetish of liquidity and the doctrine that it is a positive value on the part
of institutional investors to concentrate their resources on the holding of ―liquid‖
securities‘. And scepticism about the limitless benefits of market liquidity supported by
speculative trading is justified on at least three grounds.
First, the fact that the benefits of market liquidity must be, like the benefits of any
market completion, of declining marginal utility as more market liquidity is
attained. The additional benefits deliverable, for instance, by the extra liquidity
which derives from flash or algorithmic training, exploiting price divergences
present for a fraction of a second, must be of minimal value compared to the
benefits from having an equity market which is reasonably liquid on a day-by-day
basis.

Chapter 1 – Adair Turner
40
Second, the fact that greater market liquidity and the position taking and speculation
required to deliver it, can in some markets produce destabilising and harmful
momentum effects – cycles of over and then under valuation. Such swings can be
explained by the insights of behavioural economics – human tendencies, rooted in
our evolutionary history, which condition us to be swept along with herd
psychology27
, or they can be explained in terms of relationships between different
market participants, operating under conditions of inherent irreducible uncertainty,
imperfect information and complex principal/agent relationships, which make it
rational for individual participants to act in ways which produce collective unstable
results, with continual oscillations around rational equilibrium levels.28
And third, an emerging body of analysis which suggests that the multiple and
complex principal/agent relationships which exist throughout the financial system,
mean that active trading which both requires and creates liquid markets, can be used
not to deliver additional value to end investors or users of markets, but to extract
economic rent. Additional trading, for instance, can create volatility against which
customers then seek to protect themselves by placing value on the provision of
market liquidity. The fact that customers place great value on market liquidity, and
thus support large market-marking profits, therefore in no way proving that the
increased trading activity is value added at the social level.
So faced with these two schools of thought – what should we conclude? Has all the
increased trading activity of the last 30 years delivered economic value via lower
transaction costs and more efficient and liquid markets, or has it generated harmful
volatility and enabled market traders to extract economic rent? My answer is that I don‘t
know the precise balance of these possible positives and negatives, because there are
many issues of complex theory and empirical analysis not yet resolved and very difficult
to resolve. But we certainly need to have the debate rather than accepting as given the
dominant argument of the last 30 years which has asserted that increased liquidity,
supported by increased position taking, is axiomatically beneficial. And a reasonable
judgement on the economic value added of increased liquidity may be that increased
liquidity does deliver benefits but subject to diminishing marginal utility, and that the
increased financial speculation required to deliver increased liquidity creates an
increasing danger of destabilising herd and momentum effects the larger pure financial
activity becomes relative to underlying real economic activity (Chart 38).
27
See Kuhneman, Slovic and Tversky “Judgement Under Uncertainty heuristics and biases” (1982)
for discussion of how economic agents made decisions on the bases of rough heuristics, i.e. rules of thumb.
The widespread application of these rules by multiple agents can then generate self-reinforcing herd effects. 28
See Vayano and Woolley, An Institutional Theory of Momentum and Reversal” (LSE November
2008), and George Soros The New Paradigm for Financial Markets (2008).

Chapter 1 – Adair Turner
41
So that there is an optimal level of liquidity, with increased liquidity and
speculation valuable up to a point but not beyond that point, but with the complication for
practical policy makers that the point of optimal benefit is impossible to define with any
precision, that it varies by market, and that we have highly imperfect instruments through
which to gain the benefits without the disadvantages. There is, for instance, no economic
value that I can discern from the operation of speculators in currency ‗carry trades‘,
which are among purest examples of what Professor John Kay labels ‗tailgating
strategies‘ – riding an unsustainable trend in the hope that you will be clever enough to
get out just ahead of the crash.29
But there may be no instruments that can eliminate
carry-trade activities without undermining useful Forex market liquidity of value to non-
financial corporations.
But the fact that we do not have perfect discriminatory instruments does not mean
that a more nuanced assessment of the benefits of market liquidity will have no
implications for public policy. Instead three implications follow:
The first is that in setting trading book capital requirements for commercial and
investment banks, we should shift from a bias in favour of liquidity to a bias to
conservatism. If regulators believe that the level of capital required for prudential
purposes needs to increase, and the industry argues that this will restrict liquidity in
some specific markets, we should be more willing to question whether the liquidity
serves a useful economic purpose and more willing in some cases to wave it
goodbye.
The second is that policymakers need to be concerned with the potential danger of
destabilising speculative activity, even if it is performed by non-banks. Speculative
trading activity can cause harm, even when it poses no threat to commercial bank
solvency. If necessary, highly leveraged hedge fund speculation should be
constrained by leverage limits.
And third, we should certainly not exclude the potential role for financial
transaction taxes which might, in James Tobin‘s words, ‗throw some sand in the
wheels‘ of speculative activity. It may well be the case that a generalised and
internationally agreed financial transactions tax, whether on Forex flows or on a
wider set of financial transactions, is not achievable. One of the interesting features
of the transaction tax debate is that it is littered with articles by academics who have
been convinced of the theoretical case in favour of a financial transaction tax, but
who have subsequently failed to promote the idea. In 1989, Larry Summers co-
authored an article entitled: When financial markets work too well: a cautious case
for a securities transaction tax30
, but in office subsequently he did not pursue it.
29
See John Kay, Tailgating blights markets and motorways, Financial Times, January 19, 2010. 30
L.H Summers and V.P. Summers, Journal of Financial Service Research, 1989.

Chapter 1 – Adair Turner
42
Rudi Dornbusch argued in 1990 that ‗it‘s time for a financial transactions tax‘, but
was subsequently sceptical about the feasibility of comprehensive capital controls.31
But at very least we should take financial transaction taxes out of the ‗index of
forbidden thoughts‘
6. Reforming Global Finance: Radicalism, structural
solutions and inherent instability
Let me sum up then and draw some overall conclusions about the need for radical
reform, and what we should mean by radical. I started by describing the quite startling
increases in the scale of the financial system which have occurred over the last 30 to 50
years, and I have then considered the value added of this increased financial activity
under three headings.
First, the huge growth in of bank balance sheets relative to GDP, and in the level of
leverage in the real economy. Here I concluded that whether this increase was value
added depends crucially on the economic and social functions which credit
performs, that these functions vary by category of credit, and that whereas some
credit extension could be understood in terms of a model in which more credit (or a
lower cost of credit) enabled the undertaking of more productive investments, in
fact much credit (for instance most mortgage credit), plays the economic functions
of enabling life-cycle consumption smoothing and inter-generational resource
transfer, is valuable to the extent that such smoothing delivers welfare benefits, but
should not be expected to spur investment or long term economic growth. I also
argued that credit extension to finance real assets, such as property, can be subject
to self-reinforcing and potentially unstable cycles, particularly given the corporate
tax deductibility of interest payments and the existence of limited liability. I
therefore argued that we need to recognise the credit/asset price cycle as a crucial
economic variable, and that we need new macro-prudential policy tools to manage
that cycle. Tools which may need to be differentiated by category of credit, given
the hugely different elasticity response of different categories and their different
economic and social value.
Second, I looked at the growth of complex securitisation, the growing role of
tranched and pooled credit securities within total credit supply, and again concluded
31
Rudiger Dornbusch, ―It‟s time for a financial transactions tax”, The International Economy,
August/September 1990. Note that while Dani Rodrik has argued that Dornbusch‘s subsequent scepticism
about capital controls ( ―Capital controls: an idea whose time is past‖ 1997) is inconsistent with
Dornbusch‘s earlier position, in fact it is quite possible to be opposed to legislated prohibition of capital
flows but in favour of taxing them .

Chapter 1 – Adair Turner
43
that the economic and social value of these innovations depended crucially on the
value of the credit extension which it enabled. I also stressed the danger that a
securitised system of credit extension can make credit assessments and pricing
decisions increasingly self-referential, and that mark-to-market accounting of credit
securities can reinforce pro- cyclical tendencies in credit extension, both in its
securitised and its on- balance sheet form. What makes the latest financial crisis so
severe was therefore the interaction between the specific features of maturity
transforming banks and of traded credit securities markets. Banks are special
because they can create both money and credit in a self-reinforcing fashion; credit
securities markets can be subject to cycles in which credit assessment and pricing
become self referential. Either can introduce volatility into the financial system; but
it is their interaction which maximises that volatility. This interaction, I argued,
increases the importance of effective macro-prudential tools.
Finally, I considered the huge growth of trading activity, across multiple markets,
relative to underlying real economic variables, and argued that we must reject the
efficient market hypothesis that more trading and more market liquidity is
axiomatically beneficial, working instead on the assumption that position taking
which supports liquidity is valuable up to a point but not beyond that point. I
therefore argued for a bias to conservatism in the setting of capital requirements
against trading activities, a greater willingness to accept that in some circumstances
there can be a case for restricting specific categories of trading activities, and for the
removal of the idea of financial transaction taxes from the ‗index of forbidden
thoughts‘.
Overall therefore, I am arguing for a radical reassessment of the too simplistic case
in favour of financial liberalisation and financial deepening which strongly influenced
official policy in the decades ahead of the crises, and which reflected the dominant
conventional wisdoms of neoclassical economics.
We need to challenge radically some of the assumptions of the last 30 years and we
need to be willing to consider radical policy responses. Those radical responses, however,
are not necessarily those, or not only those, often defined as radical in current debates.
In those debates many commentators have tended to define radicalism along three
specific dimensions.
How far we go in addressing the ―Too Big To Fail‖ problem, by making large
banks resolvable or if necessary smaller.
Whether we are willing to separate ―casino banking‖, i.e. proprietary trading, from
utility or commercial banking.

Chapter 1 – Adair Turner
44
And whether we embrace major structural reforms to create narrow banks or limited
purpose banks of the sort proposed by Professors John Kay and Laurence Kotlikoff.
But the implication of this chapter is that none of these structural solutions will be
sufficient to address the potential for instability inherent in the specific characteristics of
financial markets, credit contracts, and maturity transforming banks.
Addressing ―Too Big To Fail‖. The ―Too Big To Fail‖ agenda is undoubtedly
important and a key focus for the Financial Stability Board‘s Standing Committee
on supervisory and regulatory cooperation which I chair. It is not acceptable that tax
payers have to bail out large failing banks, and the ex-ante expectation that they will
undermines market discipline. In the latest crisis as in previous ones, however,
direct tax payer costs of bank rescue are likely to account for only a very small
proportion of the total economic costs. IMF estimates suggest they are unlikely to
exceed 2-3% of GDP in the developed economies most affected by the crisis, and
they may turn out significantly less once bank equity stakes are sold32
. But public
debt burdens in the developed economies are likely, as a result of this crisis, to
increase by something like 50% of GDP. These much larger costs derive essentially
from volatility in credit supply, first extended too liberally and at too low prices –
especially to real estate and construction sectors – and then restricted. This has two
implications. The first is that when we say that in future all banks, however big,
must be allowed to ―fail‖, the objective should not be to put them into insolvency
and wind-up, since that will produce a sudden contraction of lending, but instead to
ensure that we can impose losses on subordinated debt holders and senior creditors
sufficient to ensure that the bank can maintain operations, under new management,
without tax payer support. The second is that the multiple failure of small banks
could be as harmful to the real economy as the failure of one large bank, even if all
such banks failed at no tax payer cost, and even if the market knew ex-ante that no
tax payer support would be forthcoming33
. The American banking crisis of 1930-33
was primarily a crisis of multiple relatively small banks.
Separating commercial from investment banking. Limiting the involvement of
commercial lending banks in risky proprietary trading is undoubtedly also desirable.
Losses incurred in trading activities can generate confidence collapses, which
constrain credit supply and in extremis necessitate public rescue. The interaction
between trading activity and classic investment banking played a crucial role in the
32
IMF, A fair and substantial contribution by the financial sector, Interim Report for the G-20
(April 2010) estimates that ―Net of amounts recovered so far, the fiscal cost of direct support has averaged
2.7% of GDP for advanced G-20 countries.‖ 33
See BIS 80th
Annual Report, June 2010, p.16. ―A financial landscape dotted with a large number
of small but identical institutions will be just as prone to collapse as a system with a small number of
financial behemoths‖.

Chapter 1 – Adair Turner
45
origins of the latest crisis: indeed, the thesis of this chapter is that it was precisely
the interaction of maturity transforming banks and of self-referential credit
securities markets, which drove the peculiar severity of this latest crisis. But for
three reasons legislated separation of commercial and investment banking will not
prove a straightforward nor sufficient solution.
- First because a precise legislated distinction is extremely difficult, as the terms
of the ―Volcker rule‖ now introduced in US legislation illustrate. That
legislation defines proprietary trading as the purchase or sale or underwriting
for profit of any tradable security or contract: but it then exempts from the
definition any such position-taking for the purposes of market-making,
customer facilitation or hedging, leaving it to regulators to enforce the
distinction and to devise tools to prohibit position-taking unrelated to value
added activities. Underpinning the authority of regulators with the principle of
a legislated Volcker rule may well be desirable; but the implementation of the
rule is likely to depend crucially on appropriate design of trading book capital
rules.
- Second, because while large integrated commercial and investment banks
(such as Citi, RBS and UBS) played a major role in the crisis, so too did large
or mid-sized commercial banks (such as HBOS, Northern Rock, and IndyMac)
which were not extensively involved in the proprietary trading activities which
a Volcker rule would constrain.
- Third, that even if proprietary trading of credit securities was largely
conducted by institutions separate from commercial banks, important and
potentially destabilising interactions could still exist between maturity
transforming banks and credit securities trading. A credit supply and real
estate price boom could be driven by the combination of commercial banks
originating and distributing credit and non-banks buying and trading it, the
two together generating a self-referential cycle of optimistic credit assessment
and loan pricing, even if the functions were performed by separate institutions.
Volcker rules are in principle desirable, but not a sufficient response.
Separating deposit taking from commercial banking. Professor John Kay‘s
proposed structural solution is quite different from Paul Volcker‘s. Rather than
splitting commercial from investment banking, it would separate insured deposit
taking from lending. All insured retail deposits would be backed 100% by
government gilts, while lending banks would be funded by uninsured retail or
commercial deposits or by wholesale funds, and would compete in a free,
unregulated and unsupervised market. The underlying assumption is that the
existing system is unstable only because explicit deposit insurance and implicit

Chapter 1 – Adair Turner
46
promises of future rescue undermine the market discipline which would otherwise
produce efficient and stable results. If instead we believe that financial markets,
maturity transforming banks, and credit extension against assets which can increase
in value, are inherently susceptible to instabilities which cannot be overcome by
identifying and removing some specific market imperfection, then Professor Kay‘s
proposal fails to address the fundamental issues. It would create safe retail deposit
banks which would never need to be rescued, but it would leave credit supply and
pricing as volatile, pro-cyclical and self-referential as it was pre-crisis.
Abolishing banks: 100% equity support for loans. Professor Kotlikoff‘s proposal, in
contrast, suggests a truly radical reform of the institutional structure for credit
extension. Lending banks would become mutual loan funds, with investors sharing
month by month (or even day by day) in the economic performance of the
underlying loans. This is equivalent to making banks 100% equity funded,
performing a pooling but not a tranching function. And it would clearly exclude the
possibility of publicly funded rescue: if the price of loan fund assets fell, the
investors would immediately suffer the loss. But it is not clear that such a model
would generate a more stable credit supply. As Section 4 argued, a system of
securitised credit combined with mark-to-market accounting can generate self-
referential cycles of over and under confidence. And while Kotlikoff‘s loan funds
might seem to abolish the maturity transforming bank, with investors enjoying short
term access but not capital certainty, investors would be likely in the upswing to
consider their investments as safe as bank deposits. Investments in loan funds
would therefore be likely to grow in a procyclical fashion when valuations were on
an upswing and then to ―run‖ when valuations and confidence fell, creating credit
booms and busts potentially as severe as in past bank-based crises. The essential
challenge indeed is that the tranching and maturity transformation functions which
banks perform do deliver economic benefit, and that if they are not delivered by
banks, customer demand for these functions will seek fulfilment in other forms. We
need to find safer ways of meeting these demands, and to constrain the satisfaction
of this demand to safe levels, but we cannot abolish these demands entirely.
There is therefore a danger that if radicalism is defined exclusively in structural
terms – small banks, narrow banks, or the replacement of banks with mutual loan funds –
that we will fail to be truly radical in our analysis of the financial system and to
understand how deep-rooted are the drivers of financial instability. An exclusive focus on
structural change options, indeed, reflects a confidence that if only we can identify and
remove the specific market imperfections which prevent market disciplines from being
effective, then at last we will obtain the Arrow-Debreu nirvana of complete and self-
equilibrating markets. If instead we believe that liquid financial markets are subject for
inherent reasons to herd and momentum effects, that credit and asset price cycles are
centrally important phenomena, that maturity transforming banks perform economically

Chapter 1 – Adair Turner
47
valuable but inherently risky functions, and that the widespread trading of credit
securities can increase the pro-cyclicality of credit risk assessment and pricing, then we
have challenges which cannot be overcome by any one structural solution.
Instead two elements should form the core of the regulatory response to the crisis:
much higher bank capital and liquidity requirements and the development of new macro
prudential through-the-cycle tools. Together these can help address the fundamental
issues of volatile credit extension and asset price cycles:
Higher capital and liquidity requirements will create a more resilient banking
system, less likely to suffer crisis and bank failure. But they will also, by
constraining but not eliminating the extent to which the banking system can
perform its tranching and maturity transformation functions, constrain total leverage
in the real economy and thereby reduce the vulnerability which derives from the
rigidities of credit contracts. And by reducing the likelihood of bank failure, they
will reduce the danger that confidence collapse leads to sudden constraints on credit
supply. Even if not varied through the cycle, higher bank capital and liquidity
requirements will therefore tend to reduce the procyclicality inherent in banking
systems and credit markets. In the long run, moreover, there is no reason to believe
that a more restricted credit supply and lower financial system and real economy
leverage will result in lower steady state growth, given in particular that much
credit supply and demand in rich developed countries is unrelated to productive
investment, instead performing a different (but still valuable) consumption
smoothing effect. While the transition to higher capital and liquidity standards
needs to be managed with care, there is therefore a strong argument for long term
capital standards which are much higher than pre-crisis, and for liquidity policies
which seek deliberately to constrain aggregate maturity transformation well below
pre-crisis levels.
Higher continuous capital and liquidity requirements will still however leave the
economy vulnerable to destabilising up-swings in credit supply and asset prices,
deriving from the interaction between maturity transforming banks, credit securities
markets, and self reinforcing credit and asset price cycles. In addition therefore, the
regulatory response needs to involve the deployment of counter cyclical macro-
prudential tools which directly address aggregate credit supply. These could include
automatic or discretionary variation of capital or liquidity requirements across the
cycle, or constraints, such as LTV limits, which directly address borrowers rather
than lenders. Such policy levers may moreover need to be varied by broad category
of credit (e.g. distinguishing between commercial real estate and other corporate
lending) given the very different elasticity of response of different categories of
credit to both interest rate and regulatory levers.

Chapter 1 – Adair Turner
48
References
Arrow, K. and Debreu, G. (1954), ―Existence of
an Equilibrium for a Competitive Economy‖,
Econometrica, Volume 22.
Bank of England discussion paper, (2009) ―The
Role of Macro Prudential Policy‖, November.
BIS 80th
Annual Report, June 2010.
Bryan, L. (1988), Breaking up the Bank.
Dornbusch, R. (1990), ―It‘s time for a financial
transactions tax‖, The International Economy,
August/September.
FSA Financial Risk Outlook 2010.
FSA Mortgage Market Review, October 2009
FSA Turner Review Conference Discussion
Paper, October 2009.
IMF, (2010) ―A fair and substantial contribution
by the financial sector‖, Interim Report for
the G-20, April.
IMF Global Financial Stability Report of October
2008.
Kay, J., (2010), ―Tailgating blights markets and
motorways‖, Financial Times, 19th
January.
Kay, J. (2009), Narrow Banking, The Reform of
Banking Regulation, CFSI.
King, I.R.G. and Levine, R. (1993), ―Finance and
growth: Schumpeter might be right‖,
Quarterly Journal of Economics.
Kotlikoff, L. (2010), Jimmy Stewart is Dead:
Ending the World‟s Ongoing Financial
Plague with Limited Purpose Banking, Wiley.
Kuhneman, Slovic and Tversky, (1982),
Judgement Under Uncertainty heuristics and
biases.
Miller, M. and Modigliani, F. (1958),―The Cost
of Capital, Corporation, Finance and the
Theory of Investment‖, American Finances
Review, 48.3, pp 261-297.
Miller, M. and Modigliani, F. (1963), ―Corporate
Income Taxes and the Cost of Capital: A
Correction‖, American Economics Review,
53.3, pp 443-453.
Reinhart, C. and Rogoff, K. (2009), This Time
it‟s Different: Eight Centuries of Financial
Folly, Princeton.
Rousseau, P. and Sylla, R., (1999), ―Emerging
Financial Markets and Early US Growth‖,
NBER WP 7448.
Schularick, M. and Taylor A. M.(2009), ―Credit
Booms Gone Bust: Monetary Policy,
Leveraged Cycles and Financial Crises 1870
to 2008‖, NBER working paper number
15512, November.
Soros, G. (2008), The New Paradigm for
Financial Markets.
Summers, L.H and Summers, V.P., Journal of
Financial Service Research, 1989.
Turner, A. (2010), ―Something Old and
Something New: Novel and Familiar Drivers
of the Latest Crisis‖, Lecture to the European
Association of Banking and Financial, May.
Vayanos, D. and Woolley, P. (2008), ―An
Institutional Theory of Momentum and
Reversal”, LSE, November.

Chapter 1 – Adair Turner
49
Chart 1
1
Lin
kin
g f
un
d p
rovid
ers
wit
h f
un
d u
se
rs
Ho
use
ho
lds
No
n-p
rofit
ma
kin
g
institu
tions
Bu
sin
esse
s
Bu
sin
esses
Govern
ments
No
n-p
rofit
ma
kin
g
institu
tions
Ho
use
hold
s
Pro
vid
ers
Us
ers
Inte
rme
dia
tio
n
of
un
ma
tch
ed
as
se
t a
nd
lia
bil
ity
co
ntr
ac
ts
Fa
cil
ita
tio
n o
f “m
atc
he
d” d
ire
ct
inve
stm
en
ts,
e.g
.:
eq
uit
ies
, b
on
ds

Chapter 1 – Adair Turner
50
2
Ma
turi
ty t
ran
sfo
rma
tio
n v
ia b
an
k i
nte
rme
dia
tio
n
Pro
vid
ers
of
fun
ds
Use
rs
of
fun
ds
Insta
nt o
r sh
ort
term
acce
ss
Me
diu
m to
lo
ng
term
ma
turi
ty
Pe
rma
ne
nt fu
nd
sE
qu
ity
De
bt
De
po
sit
ors
Liq
uid
a
ss
ets
Im
me
dia
tely
ava
ilab
le
Me
diu
m to
lo
ng
te
rm
matu
rity
loa
ns
Und
erp
inn
ed
by
•P
riva
te in
su
ran
ce
•C
en
tra
l B
an
k L
.O.L
.R. fu
nctio
ns
Chart 2

Chapter 1 – Adair Turner
51
Chart 3
3
Ris
k-r
etu
rn t
ran
sfo
rma
tio
n v
ia b
an
k in
term
ed
iati
on
:
“T
ran
ch
ing
”
Pro
vid
ers
of
fun
ds
Use
rs
of
fun
ds
Lia
bil
itie
sA
ssets
Clo
se to z
ero
ris
k
depo
sits
Modera
tely
ris
ky
senio
r debt
Hig
h r
isk e
qu
ity
Modera
tely
ris
ky
loans
Ris
kie
r subord
inate
d d
ebt

Chapter 1 – Adair Turner
52
4
Ho
w f
inan
cia
l in
term
ed
iati
on
can
ad
d v
alu
e
P
oolin
g o
f risks a
nd s
ele
ction o
f
loans/investm
ents
M
atu
rity
tra
nsfo
rmation
C
on
tra
ctu
ally
on
ba
lan
ce
sh
ee
t
V
ia m
ark
et liq
uid
ity
R
isk-r
etu
rn tra
nchin
g
Direct w
elfare
benefits
(e
.g. better
life
-cyc
le
consum
ption s
mooth
ing)
Possib
le h
igher/
clo
ser
to
optim
al savin
gs r
ate
Effic
ient capital allo
cation
Chart 4

Chapter 1 – Adair Turner
53
5
Measu
res o
f in
cre
asin
g f
inan
cia
l in
ten
sit
y1929
1935
1941
1947
1953
1959
1971
1977
1983
1990
1996
2002
2007
10%
50%
100%
150%
200%
250%
300%
1929
1935
1941
1947
1953
1959
1965
1971
1977
1983
1990
1996
2002
2007
10%
50%
100%
150%
200%
250%
300%
1929
1935
1941
1947
1953
1959
1971
1977
1983
1990
1996
2002
2007
10%
50%
100%
150%
200%
250%
300%
1929
1935
1941
1947
1953
1959
1965
1971
1977
1983
1990
1996
2002
2007
10%
50%
100%
150%
200%
250%
300%
0
50
10
0
15
0
20
0
25
0
30
0
35
0
40
0
45
0
1987
1989
1991
1993
1995
1997
1999
2001
2003
2005
2007
$Tr
OT
C in
tere
st
rate
co
ntr
acts
, n
otio
na
l a
mo
un
t o
uts
tan
din
g
0
10
0
20
0
30
0
40
0
50
0
60
0
70
0
80
0
90
0
1,0
00
1,1
00
1977
1982
1987
1992
1997
2002
2007
$bn Glo
bal nom
inal G
DP
, $b
nG
lobal F
X turn
over,
annual, $
bn
Glo
bal export
s, $
bn
US
de
bt
as
a %
of
GD
P b
y
bo
rro
we
r ty
pe
Gro
wth
of
inte
res
t ra
te
de
riva
tive
s v
alu
es
, 1
98
7-2
00
9
FX
Tra
din
g v
alu
es
& w
orl
d G
DP
19
77
-20
07
Glo
ba
l is
su
an
ce
of
as
se
t-
ba
ck
ed
se
cu
riti
es
$Trn
Chart 5

Chapter 1 – Adair Turner
54
6
Wh
at
the
UK
ba
nk
ing
sys
tem
did
: 1
96
4
232
17646 1
De
po
sit
s &
oth
er
acco
un
ts
Ca
sh
& a
t call
Accep
tan
ces &
dis
co
un
ts
Tre
asu
ry b
ills
& g
ilts
Lo
an
s,
ad
van
ces &
oth
er
Pre
mis
es &
oth
er
Ca
pit
al
&
reserv
es
Lia
bilit
ies
Assets
UK
ban
ks‟ ag
gre
gate
bala
nce s
heet
as %
of
GD
P
So
urc
e:
David
Sh
ep
pa
rd (1
97
1)
Th
e G
row
th a
nd
Rule
of
UK
Fin
an
cia
l In
stitu
tio
ns 1
88
0-1
96
6
To
tal =
34%
Chart 6

Chapter 1 – Adair Turner
55
7
Wh
at
the U
K b
an
kin
g s
yste
m d
id:
1964 (
Co
nt.
)
39 7
13
14
Lia
bilit
ies
Assets
Ban
ks &
Bu
ild
ing
So
cie
ties‟ £ l
en
din
g/d
ep
osit
s
Pri
vate
no
n-f
ina
ncia
l secto
r as %
of
GD
P
Ho
useh
old
len
din
g
Co
rpo
rate
len
din
gH
ou
seh
old
dep
osit
s
Co
rpo
rate
dep
osit
s
So
urc
e:
Ba
nk o
f E
ng
lan
d
Chart 7

Chapter 1 – Adair Turner
56
8
Ho
us
eh
old
de
po
sit
s a
nd
lo
an
s:
19
64
–2009
So
urc
e:
Ba
nk o
f E
ng
lan
d, Ta
ble
s A
4.3
, A
4.1
0%
10%
20%
30%
40%
50%
60%
70%
80%
90%
100%
1964
1967
1970
1973
1976
1979
1982
1985
1988
1991
1994
1997
2000
2003
2006
2009
% of GDP
Securitisations a
nd loan tra
nsfe
rsD
eposits
Loans
Chart 8

Chapter 1 – Adair Turner
57
9
Pri
va
te n
on
-fin
an
cia
l c
orp
ora
te (
PN
FC
) d
ep
os
its
an
d lo
an
s:
1964 –
2009
So
urc
e:
Ba
nk o
f E
ng
lan
d T
ab
les A
4.3
, A
4.1
0%
5%
10%
15%
20%
25%
30%
35%
40%
1964
1967
1970
1973
1976
1979
1982
1985
1988
1991
1994
1997
2000
2003
2006
2009
% of GDP
Se
cu
ritisa
tio
ns a
nd
lo
an
tra
nsfe
rsD
ep
osits
Loans
Chart 9

Chapter 1 – Adair Turner
58
10
Ho
us
eh
old
an
d P
NF
C d
ep
os
its
an
d l
oa
ns
:
1964 –
2009
So
urc
e:
Ba
nk o
f E
ng
lan
d, Ta
ble
s A
4.3
, A
4.1
0%
20%
40%
60%
80%
100%
120%
140%
1964
1968
1972
1976
1980
1984
1988
1992
1996
2000
2004
2008
% of GDP
Securitisations
Deposits
Loans
Chart 10

Chapter 1 – Adair Turner
59
11
UK
ban
ks
an
d b
uil
din
g s
oc
ieti
es £
le
nd
ing
/de
po
sit
s t
o/f
rom
pri
va
te n
on
-fin
an
cia
l s
ec
tor:
200
7 a
s %
of
GD
P
22
17
72
35
76
Ho
useh
old
dep
osit
s
Co
rpo
rate
bo
rro
win
g
(+1%
secu
riti
sati
on
)
Ho
useh
old
bo
rro
win
g (
+22%
secu
riti
sed
len
din
g)
Lia
bil
itie
sA
ss
ets
Co
rpo
rate
dep
osit
s
Cu
sto
mer
fun
din
g g
ap
Chart 11

Chapter 1 – Adair Turner
60
12
UK
ba
nk
ba
lan
ce
sh
ee
ts –
2007
26
70
86
28
18
0
10
7
22
71
10
7
31
12
6
20
11
8
2
UK
resid
en
ts
dep
osit
s
No
n-r
esid
en
ts
dep
osit
s
(in
clu
din
g f
rom
ban
ks)
Dep
osit
s f
rom
UK
ban
ks
Rep
os
Oth
er
Cap
ital
& r
eserv
es
Oth
er
Rep
os
Investm
en
ts
Mark
et
loan
s t
o U
K b
an
ks
Mark
et
loan
s t
o n
on
-resid
en
ts
(in
clu
din
g b
an
ks)
Mark
et
loan
s t
o U
K r
esid
en
ts
Ad
van
ces t
o U
K &
no
n-r
esid
en
ts
Cash
, cen
tral
ban
k,
T-b
ills
, g
ilts
To
tal =
497%
Lia
bil
itie
sA
ss
ets
Chart 12

Chapter 1 – Adair Turner
61
13
Ho
us
eh
old
an
d N
PIS
H l
en
din
g:
19
64
–2009
0%
10%
20%
30%
40%
50%
60%
70%
80%
1976
1979
1982
1985
1988
1991
1994
1997
2000
2003
2006
2009
% of GDP
Lendin
g to u
nin
corp
ora
ted b
usin
esses
Unsecure
d lendin
g to h
ousehold
s
Resid
en
tial m
ort
ga
ge len
din
g
Oth
er
len
din
g t
o h
ou
seh
old
an
d N
PIS
H
So
urc
e:
Ba
nk o
f E
ng
lan
d, Ta
ble
s A
4.3
, A
4.1
So
urc
e:
Ba
nk o
f E
ng
lan
d, Ta
ble
A4
.1
0%
10%
20%
30%
40%
50%
60%
70%
80%
90%
1964
1967
1970
1973
1976
1979
1982
1985
1988
1991
1994
1997
2000
2003
2006
2009
% of GDP
Se
cu
ritisa
tio
ns a
nd
lo
an
tra
nsfe
rs
Lo
an
s s
ecu
red o
n d
we
llin
gs
Chart 13

Chapter 1 – Adair Turner
62
14
Co
rpo
rate
lo
an
s b
y b
roa
d s
ec
tor:
19
87
–2008
0%
5%
10%
15%
20%
25%
30%
35%
Q1
1987
Q1
1989
Q1
1991
Q1
1993
Q1
1995
Q1
1997
Q1
1999
Q1
2001
Q1
2003
Q1
2005
Q1
2007
Q1
2009
% of GDP
Non-c
om
mm
erc
ial re
al est
ate
PN
FC lendin
gCom
merc
ial re
al est
ate
lendin
g
So
urc
e:
ON
S,
Fin
sta
ts
No
te:
Pa
rt o
f th
e in
cre
ase
in r
ea
l e
sta
te le
nd
ing
ma
y b
e d
ue
to
re
-ca
teg
orisa
tio
n o
f co
rpo
rate
len
din
g
follo
win
g s
ale
an
d le
ase
-ba
ck o
f p
rop
ert
ies a
nd
PF
I (p
ub
lic fin
an
ce
initia
tive
) le
nd
ing
, b
ut w
e d
o n
ot
thin
k th
ese
ele
me
nts
are
la
rge
en
ou
gh
to
ch
an
ge
th
e o
ve
rall
pic
ture
. B
rea
k in
se
rie
s f
rom
Q1
20
08
du
e to
in
clu
sio
n o
f b
uild
ing
so
cie
ty d
ata
. S
terlin
g b
orr
ow
ing
on
ly.
Chart 14

Chapter 1 – Adair Turner
63
15
Co
rpo
rate
lo
an
s b
y s
ec
tor:
19
98
–2008
0
100
200
300
400
500
600
700
Q1
1998
Q1
1999
Q1
2000
Q1
2001
Q1
2002
Q1
2003
Q1
2004
Q1
2005
Q1
2006
Q1
2007
Q1
2008
Q1
2009
£ billion Real est
ate
Const
ructi
on
Hote
ls a
nd r
est
aura
nts
Whole
sale
and r
eta
il t
rade
Serv
ices
Natu
ral re
sourc
es
Manufa
ctu
ring
So
urc
e:
Ba
nk o
f E
ng
lan
d
Chart 15

Chapter 1 – Adair Turner
64
16
Co
rpo
rate
de
po
sit
s b
y s
ec
tor:
19
98 –
20
09
0
50
100
150
200
250
300
350
Q1
1998
Q1
1999
Q1
2000
Q1
2001
Q1
2002
Q1
2003
Q1
2004
Q1
2005
Q1
2006
Q1
2007
Q1
2008
Q1
2009
£ billion Real est
ate
Const
ructi
on
Hote
ls a
nd r
est
aura
nts
Whole
sale
and r
eta
il t
rade
Serv
ices
Natu
ral re
sourc
es
Manufa
ctu
ring
So
urc
e:
Ba
nk o
f E
ng
lan
d
Chart 16

Chapter 1 – Adair Turner
65
17
Co
rpo
rate
se
cto
r n
et
de
po
sit
s/b
orr
ow
ing
:
1998 –
20
09
So
urc
e:
Ba
nk o
f E
ng
lan
d
-350
-300
-250
-200
-150
-100
-500
50
100
Q1
1998
Q1
1999
Q1
2000
Q1
2001
Q1
2002
Q1
2003
Q1
2004
Q1
2005
Q1
2006
Q1
2007
Q1
2008
Q1
2009
£ billion Serv
ices
Real est
ate
Const
ructi
on
Hote
ls a
nd r
est
aura
nts
Whole
sale
and r
eta
il t
rade
Natu
ral re
sourc
es
Manufa
ctu
ring
Net deposits
Net borrowing
Chart 17

Chapter 1 – Adair Turner
66
18
Go
vern
men
t b
on
ds o
uts
tan
din
g a
s %
of
GD
P
So
urc
e: F
ed
era
l Re
se
rve
Flo
w o
f F
un
ds A
cco
un
ts;
Da
tastr
ea
m
So
urc
e:
'Na
tio
na
l de
bt' fro
m H
M T
rea
su
ry P
ub
lic
Fin
an
ce
s D
ata
ba
nk; 'O
uts
tan
din
g g
ilts
' fro
m O
NS
Fin
an
cia
l Sta
tistics C
on
sis
ten
t; D
ata
str
ea
m
US g
overn
ment
bonds
outs
tandin
g
0%
20%
40%
60%
80%
100%
1945
1955
1965
1975
1985
1995
2005
% of GDP
UK
govern
ment
bonds
outs
tandin
g
0%
50%
100%
150%
200%
250%
300%
1945
1955
1965
1975
1985
1995
2005
% of GDPO
uts
tandin
g g
ilts
Nati
onal debt
To
tal
gil
ts o
uts
tan
din
g a
t Q
4 2
00
9
= £
79
6.3
bn
UK
go
vern
men
t b
on
ds o
uts
tan
din
g
Chart 18

Chapter 1 – Adair Turner
67
19
US
no
n-f
inan
cia
l co
rpo
rate
cre
dit
fu
nd
ing
:
1952 –
20
09
as
% o
f G
DP
So
urc
e: U
.S.
Flo
w o
f F
un
ds.
No
te:
Mu
nic
ipa
l se
cu
ritie
s r
efe
rs to
bo
nd
s is
su
ed
to
fu
nd
pu
blic
-priva
te p
art
ne
rsh
ips a
nd
are
no
t tr
ad
itio
na
l lo
ca
l g
ove
rnm
en
t
Issu
ed
se
cu
ritie
s. M
ort
ga
ge
s c
an
be
de
fin
ed
as c
om
me
rcia
l p
rop
ert
y le
nd
ing
.
0%
5%
10
%
15
%
20
%
25
%
30
%
35
%
40
%
45
%
50
%
55
%
19
52
19
55
19
58
19
61
19
64
19
67
19
70
19
73
19
76
19
79
19
82
19
85
19
88
19
91
19
94
19
97
20
00
20
03
20
06
20
09
U.S
. b
an
k lo
an
sN
on
-ba
nk a
nd
fo
reig
n b
an
ks lo
an
sC
orp
ora
te b
on
ds
Co
mm
erc
ial p
ap
er
Mu
nic
ipa
l S
ecu
ritie
sM
ort
ga
ge
s
Cre
dit M
ark
et
Instr
um
en
ts
20
09
:
Cre
dit
ma
rke
t in
str
um
en
ts o
uts
tan
din
g =
$7
.2tn
Co
rpo
rate
bo
nd
s o
uts
tan
din
g =
$4
.1tn
Chart 19

Chapter 1 – Adair Turner
68
20
Secu
riti
sati
on
of
US
resid
en
tial
mo
rtg
ag
es:
1960 –
2009
So
urc
e:
U.S
. F
low
of F
un
ds
0%
10
%
20
%
30
%
40
%
50
%
60
%
70
%
80
%1952
1955
1958
1961
1964
1967
1970
1973
1976
1979
1982
1985
1988
1991
1994
1997
2000
2003
2006
2009
Private
lab
el R
MB
S issue
rs (
ho
me
mo
rtg
ag
e R
MB
S)
Ag
ency a
nd
GS
E b
acke
d R
MB
S (
ho
me
mo
rtg
ag
es)
Ho
me
mo
rtg
ag
es
BA
NK
Mo
rtg
ag
es o
uts
tan
din
g a
s %
of
GD
P
BA
NK
L
EN
DIN
G
Chart 20

Chapter 1 – Adair Turner
69
21
Secu
riti
sed
cre
dit
as %
of
tota
l cate
go
ry:
1970 –
2009
So
urc
e: U
.S.
Flo
w o
f F
un
ds
Pri
va
te la
be
l H
om
e M
ort
ga
ge
0%
10
%
20
%
30
%
40
%
50
%
60
%
70
%
1970Q1
1973Q1
1976Q1
1979Q1
1982Q1
1985Q1
1988Q1
1991Q1
1994Q1
1997Q1
2000Q1
2003Q1
2006Q1
2009Q1
Ho
me
Mtg
e t
ota
l H
om
e m
tge
GS
ES
Co
mm
erc
ial M
tge
Co
nsum
er
cre
dit
Ho
me
mo
rtg
ag
es
Co
nsu
mer
cre
dit
Co
mm
erc
ial
mo
rtg
ag
e
Chart 21

Chapter 1 – Adair Turner
70
22
Tra
nc
hin
g v
ia s
ec
uri
tis
ati
on
Pro
vid
ers
of
fun
ds
Use
rs
of
fun
ds
Inve
sto
rs
with
a
rang
e o
f
diffe
ren
t
risk / r
etu
rn
pre
fere
nce
s
Po
ol o
f a
sse
ts o
r,
for
insta
nce
,
ave
rag
e A
A
qua
lity
Secu
riti
sati
on
AA
A
AA
BB
B
Eq
uit
y
Chart 22
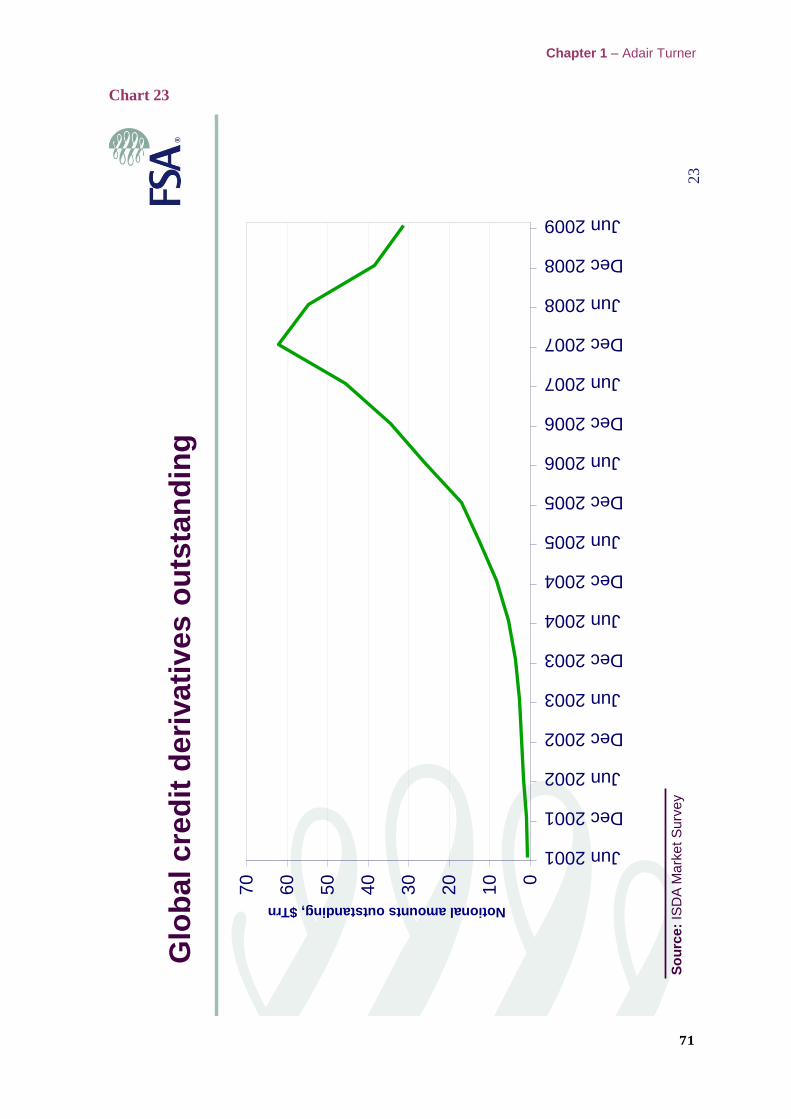
Chapter 1 – Adair Turner
71
23
Glo
bal
cre
dit
deri
vati
ves o
uts
tan
din
g
0
10
20
30
40
50
60
70
Jun 2001
Dec 2001
Jun 2002
Dec 2002
Jun 2003
Dec 2003
Jun 2004
Dec 2004
Jun 2005
Dec 2005
Jun 2006
Dec 2006
Jun 2007
Dec 2007
Jun 2008
Dec 2008
Jun 2009
So
urc
e:
ISD
A M
ark
et
Su
rve
y
Notional amounts outstanding, $Trn
Chart 23

Chapter 1 – Adair Turner
72
24
Ho
us
eh
old
de
po
sit
s a
nd
lo
an
s:
19
64
–2009
0%
10%
20%
30%
40%
50%
60%
70%
80%
90%
100%
1964
1967
1970
1973
1976
1979
1982
1985
1988
1991
1994
1997
2000
2003
2006
2009
% of GDP
Se
cu
ritisa
tio
ns a
nd
lo
an
tra
nsfe
rsD
ep
osits
Loans
So
urc
e:
Ba
nk o
f E
ng
lan
d
Chart 24

Chapter 1 – Adair Turner
73
25
Incre
ased
tra
din
g a
cti
vit
y r
ela
tive t
o r
eal
eco
no
my:
FX
0
10
0
20
0
30
0
40
0
50
0
60
0
70
0
80
0
90
0
1,0
00
1,1
00
1977
1982
1987
1992
1997
2002
2007
$bn Glo
ba
l n
om
ina
l G
DP
, $
bn
Glo
ba
l F
X t
urn
ove
r, a
nn
ua
l, $
bn
Glo
ba
l e
xp
ort
s,
$b
n
So
urc
e:
BIS
Tri
en
nia
l Cen
tra
l Ba
nk S
urv
ey,
IM
F
Inte
rna
tio
na
l Fin
an
cia
l Sta
tistics
Chart 25

Chapter 1 – Adair Turner
74
26
Incre
ased
tra
din
g a
cti
vit
y r
ela
tive t
o r
eal
eco
no
my:
Oil
Glo
ba
l o
il co
nsum
ptio
n v
s.
tra
de
d o
il fu
ture
s 1
98
3-2
00
9
0
20
0
40
0
60
0
80
0
1,0
00
1,2
00
1983
1985
1987
1989
1991
1993
1995
1997
1999
2001
2003
2005
2007
2009
Ye
ar
Oil barrels equivalent (millions)
Excha
nge
futu
res
vo
lum
es (
mill
ion
ba
rre
ls e
quiv
ale
nt)
Wo
rld
co
nsum
ptio
n
(mill
ion b
arr
els
)
)
So
urc
e:
NY
ME
X
Chart 26

Chapter 1 – Adair Turner
75
27
Inte
rest
rate
deri
vati
ves t
rad
ing
: 1980 –
2009
0
50
100
150
200
250
300
350
400
4501987
1989
1991
1993
1995
1997
1999
2001
2003
2005
2007
$Tr
OT
C in
tere
st
rate
co
ntr
acts
, n
otio
na
l a
mo
un
t o
uts
tan
din
g
So
urc
e:
ISD
A M
ark
et
Su
rve
y (
19
87
-19
97
), B
IS Q
ua
rte
rly
Revie
w (
19
98
-20
09
). In
clu
de
s in
tere
st ra
te s
wa
ps a
nd
in
tere
st
rate
op
tio
ns.
Chart 27

Chapter 1 – Adair Turner
76
28
Cre
dit
pri
ce
s a
nd
pro
du
cti
ve
in
ve
stm
en
t:
the
co
mm
on
ly a
ssu
med
mo
de
l
Price of credit
Qu
an
tity
of
inv
estm
en
t u
nd
ert
aken
Incre
ase in c
ost of
fundin
g r
esultin
g f
rom
incre
ased c
apital
requirem
ents
on b
anks
Chart 28

Chapter 1 – Adair Turner
77
29
Re
sid
en
tial
dw
ell
ing
s in
ve
stm
en
t a
s %
of
GD
P
Dw
ellin
gs
0%
1%
2%
3%
4%
5%
6%
7%
8%
9%
10%
1955
1957
1959
1961
1963
1965
1967
1969
1971
1973
1975
1977
1979
1981
1983
1985
1987
1989
1991
1993
1995
1997
1999
2001
2003
2005
2007
% of GDP
Chart 29

Chapter 1 – Adair Turner
78
30
Ho
us
ing
ca
pit
al
sto
ck
, m
ark
et
va
lue
an
d d
eb
t
Lan
d v
alu
e
0%
50%
100%
150%
200%
250%
300%
350%
1987
1988
1989
1990
1991
1992
1993
1994
1995
1996
1997
1998
1999
2000
2001
2002
2003
2004
2005
2006
2007
2008
2009
% of GDP
HH
: R
es
ide
nti
al
as
se
ts
HH
s:
Ne
t c
ap
ita
l s
toc
k,
Dw
ell
ing
s (
No
min
al)
HH
: M
OR
TG
AG
ES
(T
OT
AL
)
Ne
t c
ap
ita
l d
oe
s n
ot
inc
lud
e l
an
d
Re
sid
en
tia
l a
ss
ets
Chart 30

Chapter 1 – Adair Turner
79
31
Gro
ss
ca
pit
al
inve
stm
en
t in
bu
ild
ing
s a
nd
mach
inery
str
uctu
res:
1955 –
2007
Oth
er
new
buildin
gs
and s
tructu
res
(CR
E)
0%
1%
2%
3%
4%
5%
6%
7%
8%
9%
10%
1955
1957
1959
1961
1963
1965
1967
1969
1971
1973
1975
1977
1979
1981
1983
1985
1987
1989
1991
1993
1995
1997
1999
2001
2003
2005
2007
% of GDP
Pla
nt,
Machin
ery
, vehic
les
,ship
s and a
ircra
ft
0%
1%
2%
3%
4%
5%
6%
7%
8%
9%
10%
1955
1957
1959
1961
1963
1965
1967
1969
1971
1973
1975
1977
1979
1981
1983
1985
1987
1989
1991
1993
1995
1997
1999
2001
2003
2005
2007
% of GDP
Chart 31

Chapter 1 – Adair Turner
80
32
Cre
dit
an
d a
ss
et
pri
ce
cyc
les
Ex
pe
cta
tio
n o
f
futu
re a
ss
et
pri
ce
inc
rea
se
s
Inc
rea
se
d c
red
it
ex
ten
de
d
Lo
w c
red
it l
osses:
hig
h
ban
k p
rofi
ts
•C
on
fid
en
ce r
ein
forc
ed
•In
cre
ased
cap
ital
base
Inc
rea
se
d a
ss
et
pri
ce
s
Inc
rea
se
d le
nd
er
su
pp
ly o
f c
red
it
Fa
vo
ura
ble
assessm
en
ts o
f
cre
dit
ris
k
Inc
rea
se
d
bo
rro
we
r d
em
an
d
for
cre
dit
Chart 32

Chapter 1 – Adair Turner
81
33
Dri
vers
an
d e
co
no
mic
fu
nc
tio
n o
f d
iffe
ren
t
ca
teg
ori
es
of
de
bt
Un
secu
red
p
ers
on
al
Resid
en
tial
mo
rtg
ag
eC
om
merc
ial
real esta
teL
evera
ged
b
uy-o
uts
Oth
er
co
rpo
rate
Welf
are
en
han
cin
geco
no
mic
fu
ncti
on
Lifecycle
consum
ption
sm
ooth
ing
F
inance o
f pro
ductive
investm
ent
Dri
vers
of
pri
vate
in
cen
tives t
o b
orr
ow
E
xpecta
tions o
f asset
appre
cia
tion
Tax d
educta
bili
ty o
f in
tere
st and p
ut
option o
f lim
ited li
abili
ty
No
in
UK
Yes in
US
Chart 33

Chapter 1 – Adair Turner
82
34
Ba
nk
an
d b
uil
din
g s
oc
iety
le
nd
ing
in
£ t
o U
K
eco
no
my b
y f
un
cti
on
: 2009
Oth
er
co
rpo
rate
Co
mm
erc
ial
real esta
te
Resid
en
tial
mo
rtg
ag
e
(in
clu
din
g
securitisations a
nd
loan tra
nsfe
rs)
Un
secu
red
pe
rso
na
l
Prim
arily
pro
ductive investm
ent
Som
e p
roductive investm
ent
and s
om
e levera
ged a
sset
pla
y
Main
ly life c
ycle
consum
ption
sm
ooth
ing
Pure
lif
e c
ycle
consum
ption
sm
ooth
ing
•D
iffe
rent
form
s o
f
econom
ic v
alu
e
added /
welfare
benefit
•V
ery
diffe
rent
ela
sticity
of dem
and
227
1235
243
232
Chart 34

Chapter 1 – Adair Turner
83
35
Inves
tors
in
US
an
d E
uro
pea
n p
rim
e R
MB
S:
ch
an
ge in
nu
mb
er
of
inves
tors
betw
ee
n 2
006
/07
an
d 2
009
-38
%
-64
%
-77
%
-10
0%
SIV
s/C
on
du
its
Mu
tua
l F
un
ds
Ba
nk
s
As
se
t M
an
ag
ers
In
su
ran
ce
Co
mp
an
ies
H
ed
ge
Fu
nd
s
Ris
ky m
atu
rity
transfo
rmation
Capital arb
itra
ge
and r
isky m
atu
rity
transfo
rmation
Chart 35

Chapter 1 – Adair Turner
84
36
Fin
an
cia
l fi
rms
‟ C
DS
an
d s
ha
re p
ric
es
Exhib
it 1
.27:
Com
posi
te T
ime S
eri
es
of
Sele
ct
Fin
ancia
l Fir
ms'
CD
S a
nd s
hare
pri
ces
0.0
%
0.2
%
0.4
%
0.6
%
0.8
%
1.0
%
1.2
%Dec 02
Apr 03
Aug 03
Dec 03
Apr 04
Aug 04
Dec 04
Apr 05
Aug 05
Dec 05
Apr 06
Aug 06
Dec 06
Apr 07
Aug 07
Dec 07
Apr 08
Aug 08
Dec 08
Average CDS Spread in Percent
-0.5
0
1.0
0
1.5
0
2.0
0
2.5
0
MarketCap Index
CD
SSH
ARE-P
RIC
E-A
DJU
STED
Fir
ms in
clu
ded: A
mbac, A
viv
a, B
anco S
anta
nder,
Barc
lays, B
erk
shir
e H
ath
aw
ay,
Bra
dfo
rd &
Bin
gle
y, C
itig
roup, D
euts
che B
ank, F
ort
is, H
BO
S, Lehm
an B
roth
ers
, M
err
ill L
ynch, M
org
an
Sta
nle
y, N
ational A
ustr
alia B
ank, R
oyal B
ank o
f S
cotland a
nd U
BS
.
CD
S s
eri
es p
eaks a
t 6.5
4%
in S
epte
mber 2008.
So
urc
e:
Mo
od
y’s
KM
V,
FS
A C
alc
ula
tio
ns
Chart 36

Chapter 1 – Adair Turner
85
37
Cre
dit
an
d a
ss
et
pri
ce
s:
wit
h s
ec
uri
tis
ed
cre
dit
an
d
ma
rk-t
o-m
ark
et
ac
co
un
tin
g
Ex
pe
cta
tio
ns
of
futu
re a
ss
et
pri
ce
ris
es
Ma
rk-t
o-m
ark
et
ac
co
un
tin
g g
en
era
tes
ba
nk
pro
fits
an
d c
ap
ita
l in
cre
ase
•H
igh
bo
nu
se
s a
nd
mo
tiva
tio
na
l
rein
forc
em
en
t
•In
cre
ase
d c
ap
ita
l fo
r o
wn
ac
co
un
t
tra
din
g o
r o
n b
ala
nc
e s
he
et
len
din
g
Inc
rea
se
d r
ea
l a
ss
et
pri
ce
s e
.g. re
al
es
tate
Fa
vo
ura
ble
as
se
ss
me
nts
of
cre
dit
ris
kInc
rea
se
d
pri
ce
/re
du
ce
d
sp
rea
ds
of
cre
dit
se
cu
riti
es
Inc
rea
se
d in
ve
sto
r
de
ma
nd
fo
r c
red
it
se
cu
riti
es
at
low
er
sp
rea
ds
Inc
rea
se
d o
n b
ala
nc
e
sh
ee
t le
nd
ing
at
low
sp
rea
ds
Inc
rea
se
d n
ew
cre
dit
ex
ten
sio
n a
t lo
we
r
sp
rea
ds
Chart 37

Chapter 1 – Adair Turner
86
38
Ho
w v
alu
ab
le i
s i
ncre
ased
mark
et
liq
uid
ity?
Po
ssib
le c
on
cep
tual
fram
ew
ork
Incre
asin
g m
ark
et
liq
uid
ity
Net
imp
ac
t o
f u
sefu
l a
nd
ha
rmfu
l s
pe
cu
lati
on
Economic Value Added
+ –
Be
ne
fits
of:
•L
ow
er
tra
ns
ac
tio
n
co
sts
•F
iner
ma
tch
to
inve
sto
r
pre
fere
nc
es
•Im
pro
ve
d
allo
cati
on
of
cap
ital?
•H
igh
er
savin
gs
?
Ne
t e
co
no
mic
va
lue
ad
de
d
Chart 38

87
Chapter 2 What is the contribution of the financial sector:
Miracle or mirage?
Andrew Haldane, Simon Brennan and Vasileios Madouros1
This chapter considers the contribution made by the financial sector to the wider
economy. The measured GDP contribution of the financial sector suggests it underwent a
"productivity miracle" from the 1980s onwards, as finance rose as share of national
output despite a declining labour and capital share. But a detailed decomposition of
returns to banking suggests an alternative interpretation: much of the growth reflected
the effects of higher risk-taking. Leverage, higher trading profits and investments in deep-
out-of-the-money options were the risk-taking strategies generating excess returns to
bank shareholders and staff. Subsequently, as these risks have materialised, returns to
banking have reversed. In this sense, high pre-crisis returns to finance may have been
more mirage than miracle. This suggests better measuring of risk-taking in finance is an
important public policy objective - for statisticians and regulators, as well as for banks
and their investors.
1. Introduction
The financial crisis of the past three years has, on any measure, been extremely
costly. As in past financial crises, public sector debt seems set to double relative to
national income in a number of countries (Reinhart and Rogoff (2009)). And measures of
foregone output, now and in the future, put the net present value cost of the crisis at
anywhere between one and five times annual world GDP (Haldane (2010)). Either way,
the scars from the current crisis seem likely to be felt for a generation.
It is against this backdrop that an intense debate is underway internationally about
reform of finance (Goodhart (2010)). Many of the key planks of that debate are covered
in other chapters in this volume. Some of these reform measures are extensions or
elaborations of existing regulatory initiatives – for example, higher buffers of higher
quality capital and liquidity. Others propose a reorientation of existing regulatory
1 We would like to thank Stephen Burgess, Melissa Davey, Rob Elder, Perry Francis, Jen Han, Sam
Knott, Nick Oulton, Peter Richardson, Jeremy Rowe, Chris Shadforth, Sally Srinivasan and Iain de
Weymarn for comments and discussion on earlier drafts, and Alexander Haywood and Laura Wightman for
research assistance. The views expressed are those of the authors and not necessarily those of the Bank of
England.

FutureOfFinance_Report V6 OUTLINE.indd 1 8/7/10 13:36:13